SUMMARY
From late December to mid-January, much of the western US was hit by a series of nine atmospheric rivers that established a solid start to the season. It was also a La Nina winter, did that matter? The strong start to the season got much stronger by the end of a very productive March (150%-400% of normal precipitation). Following March the runoff forecasts ramped up significantly. April was a transition period before above-average streamflow’s kicked into action in May. Only six dust-on-snow events were observed over the winter on November 3, February 22, March 5, March 31, April 4, and April 19, nonetheless it was still a severe dust year in many areas of Colorado due to the particularly nasty dust event on April 4. But periods of inclement weather, precipitation, and periodic cooler temperatures, subdued snowmelt rates and prevented what could have been a sharp runoff spike seeing and we saw instead a period of sustained high flows.
MONTHLY WEATHER CONDITIONS
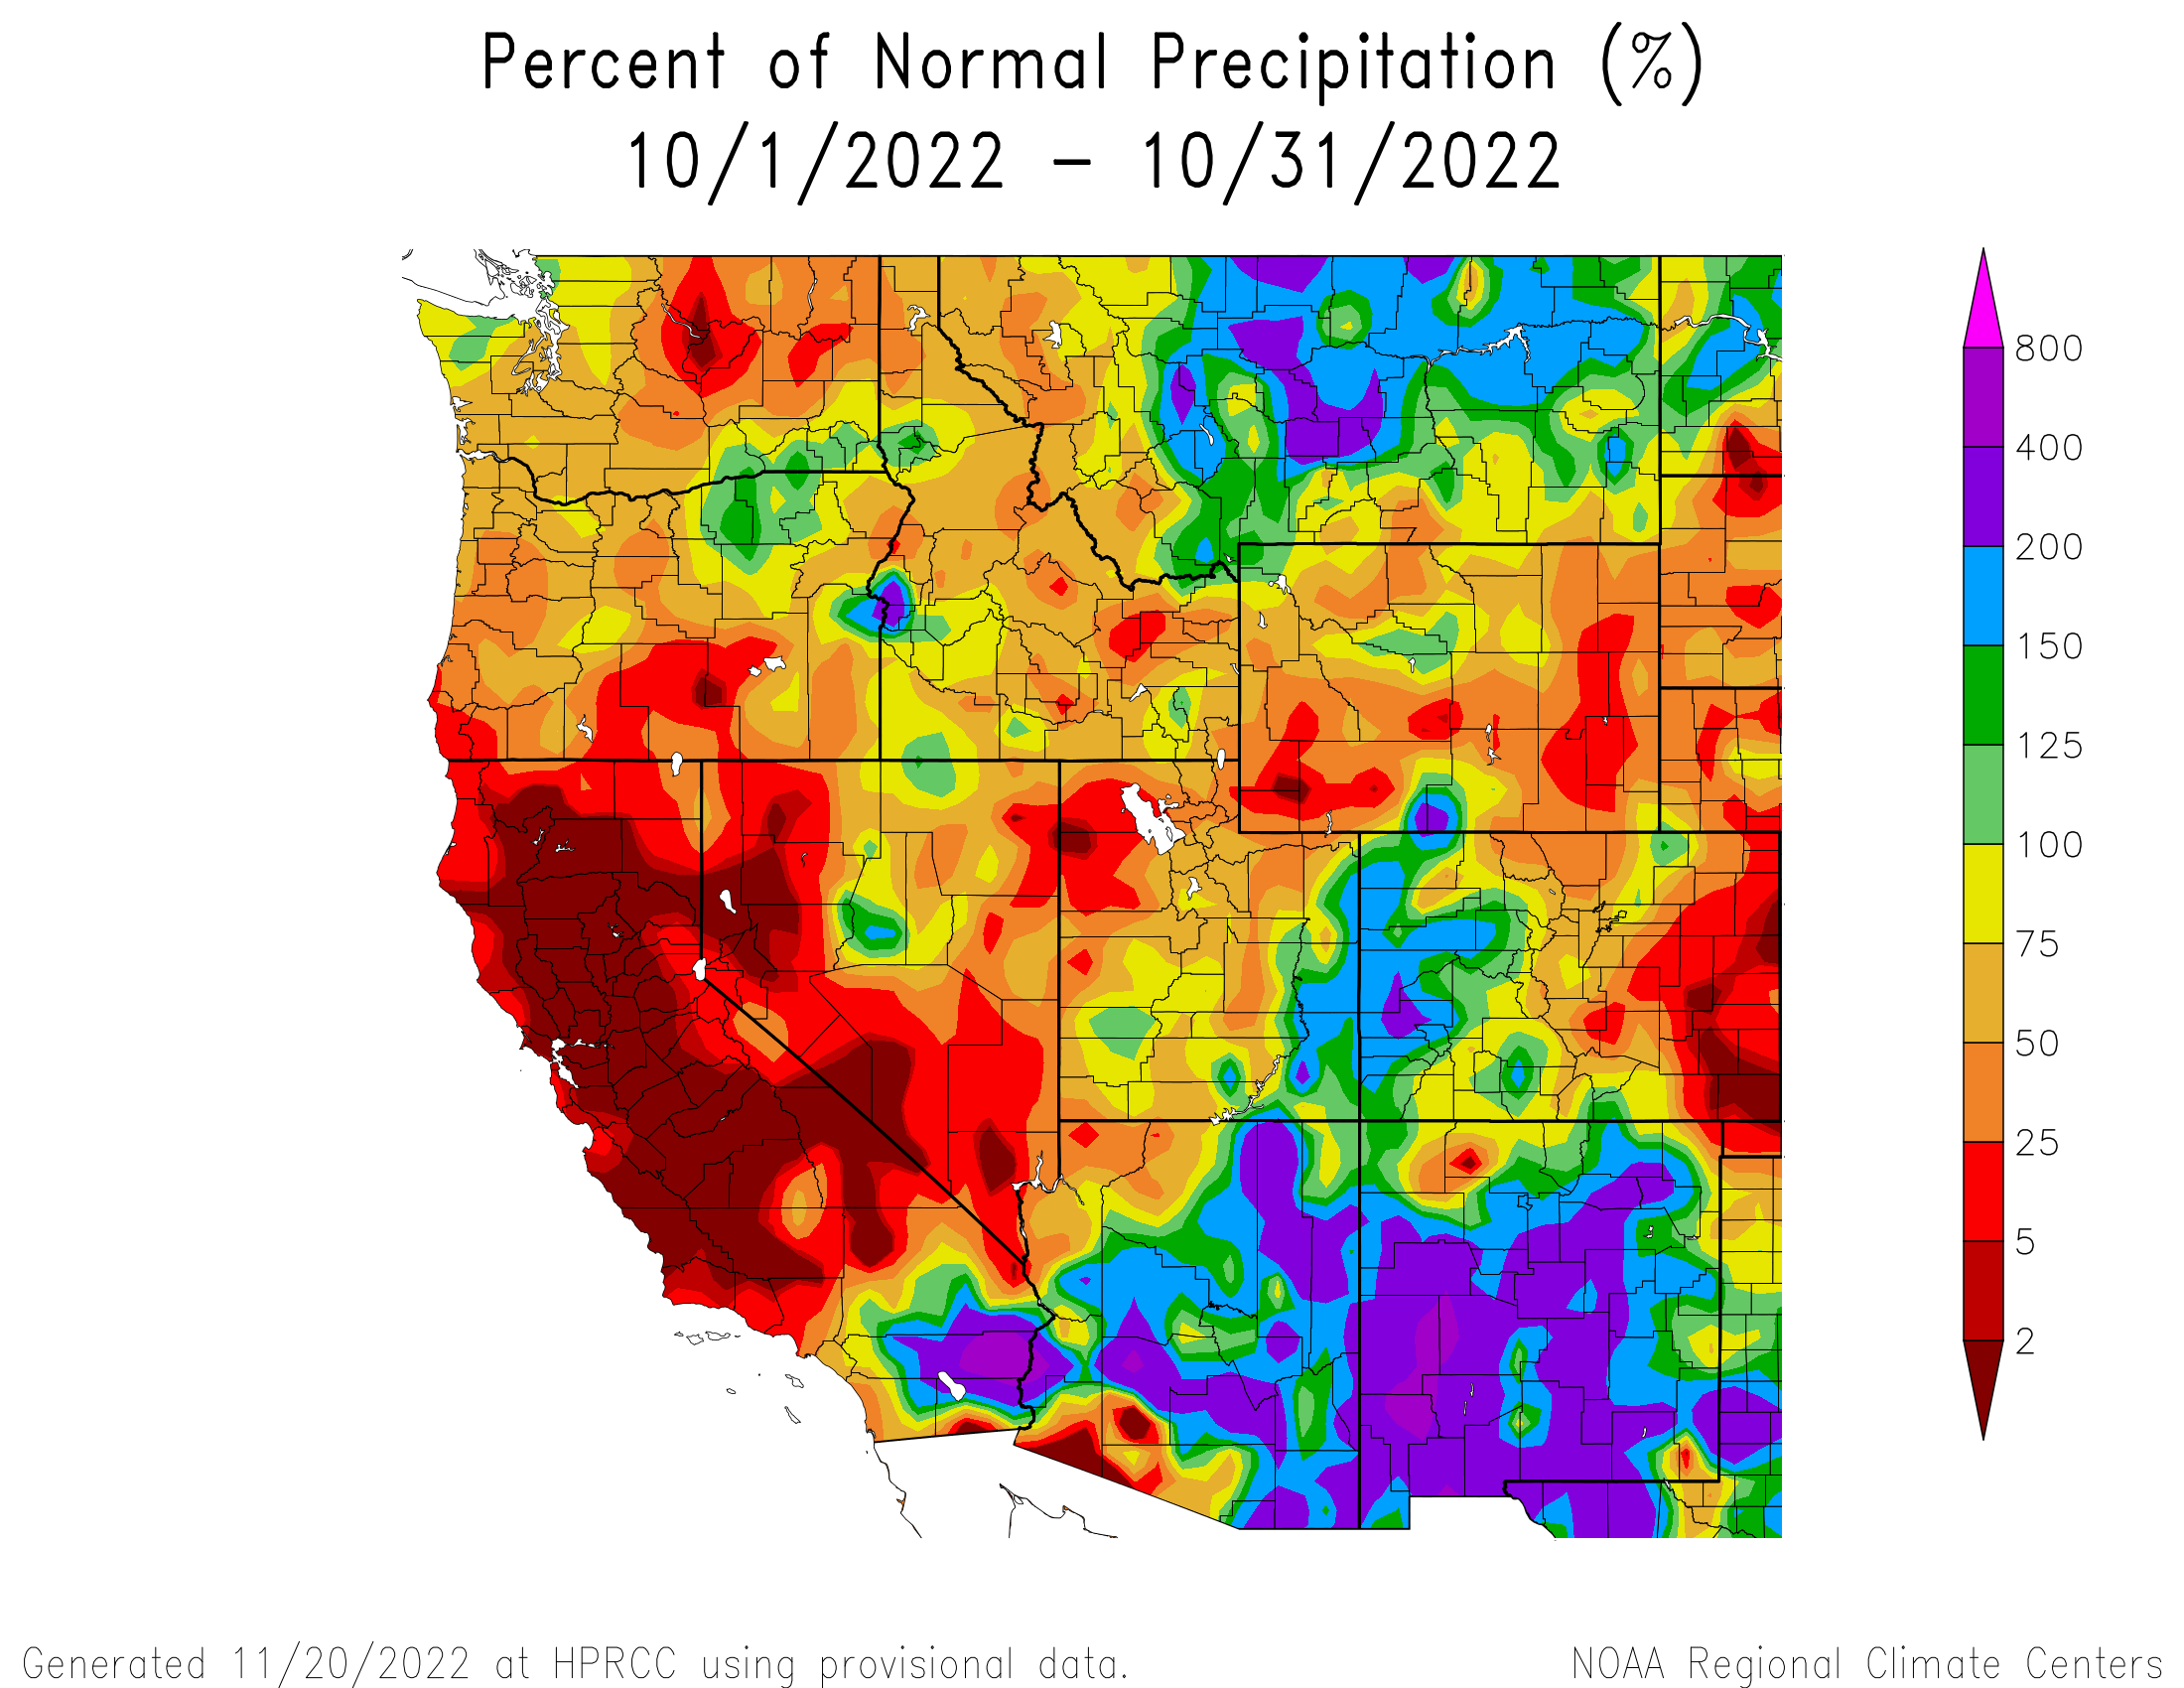
October Weather Summary: We saw numerous precipitation events in October, with the snow beginning to stick around the final week. The first storm to jumpstart the season deposited 9.8” on the ground at Swamp Angel by the morning of October 24th. It stayed cold, and the next wave of precipitation a couple days later brought 6”. A La Niña year is predicted with a high degree of certainty lasting through the winter, which generally indicates a sad year in terms of precipitation for those in the southern parts of Colorado as the Pacific Jet Stream heads north.
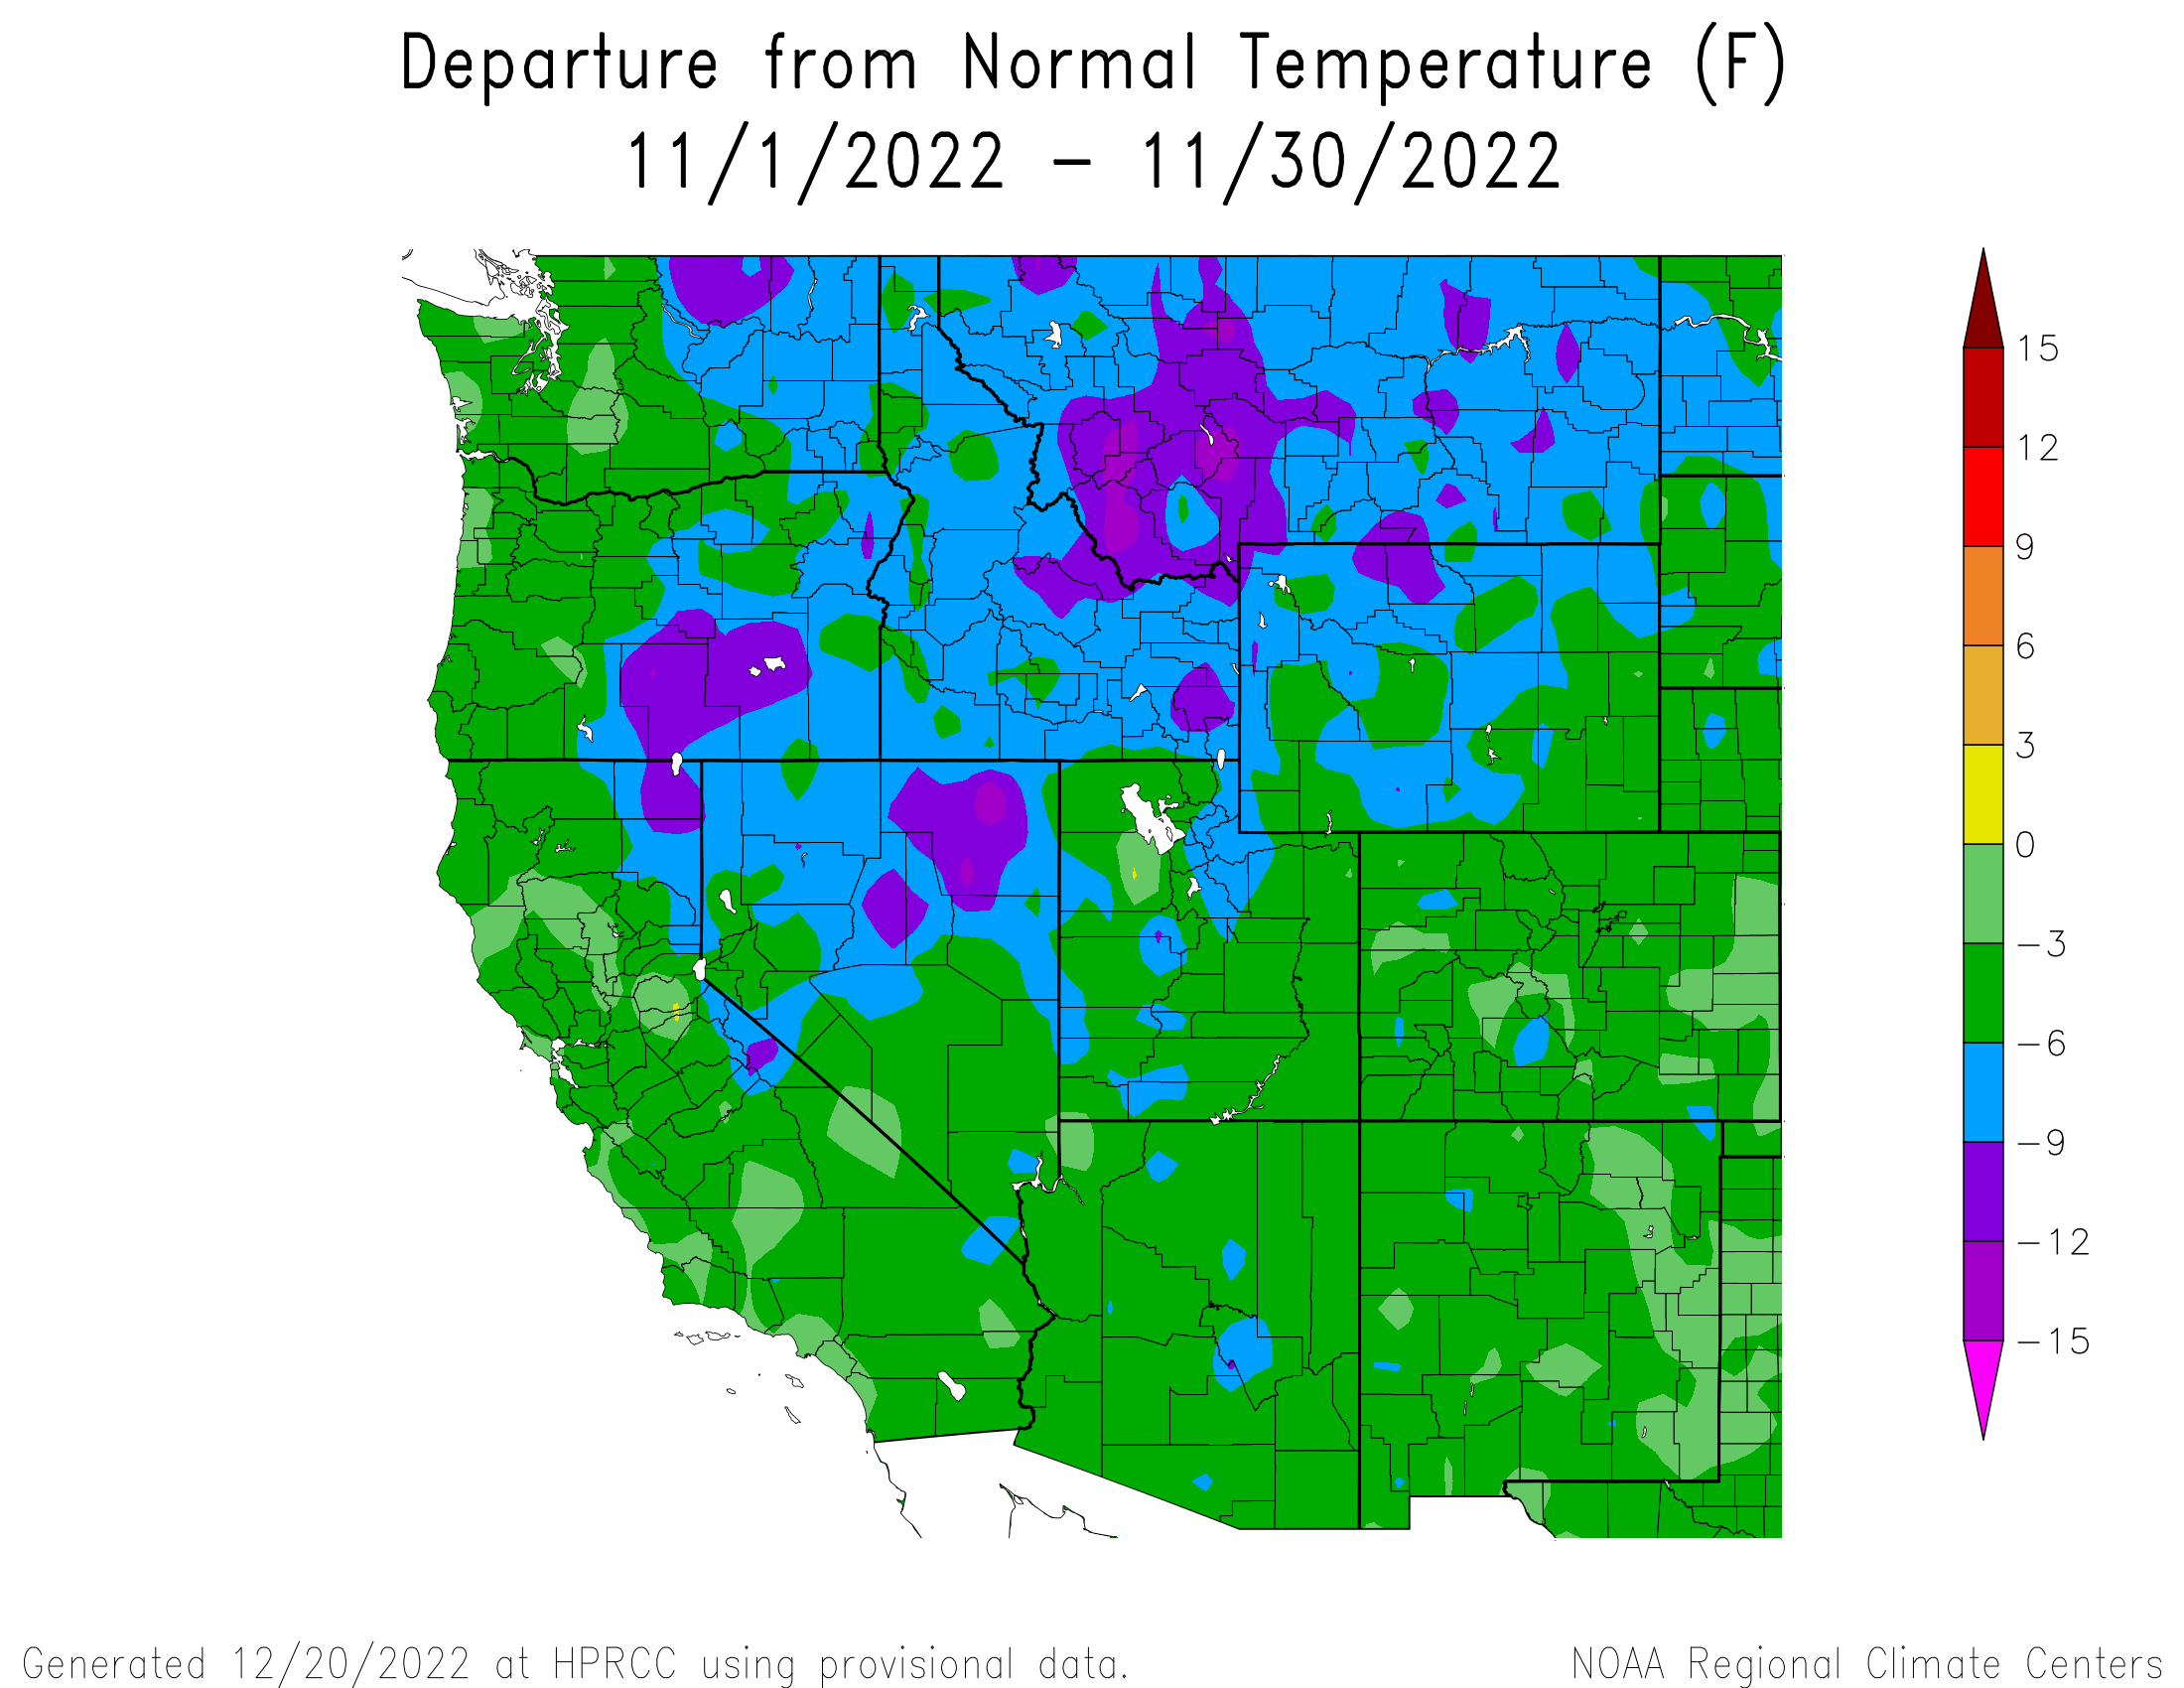
November Weather Summary: Colorado experienced a cold November. Utah’s mountains, and the northwest in general, continued to see a quick building of the snowpack. Northwestern Colorado saw a bit of above average snowfall, but most of Colorado’s snowpack lingered around normal.
Swamp Angel recorded two winter storms in November, one early and one late, bringing the November total snow accumulation in at 23” or 2.2” of water. Last year’s November at Swamp Angel was dry in comparison, with only one winter storm bringing in a piddling 0.55” precipitation.
NOAA reported that Earth saw its 9th warmest November in the last 143 years, and polar sea ice coverage was 4th lowest on record. In other major water news, the Colorado River Compact is one hundred years old this month.
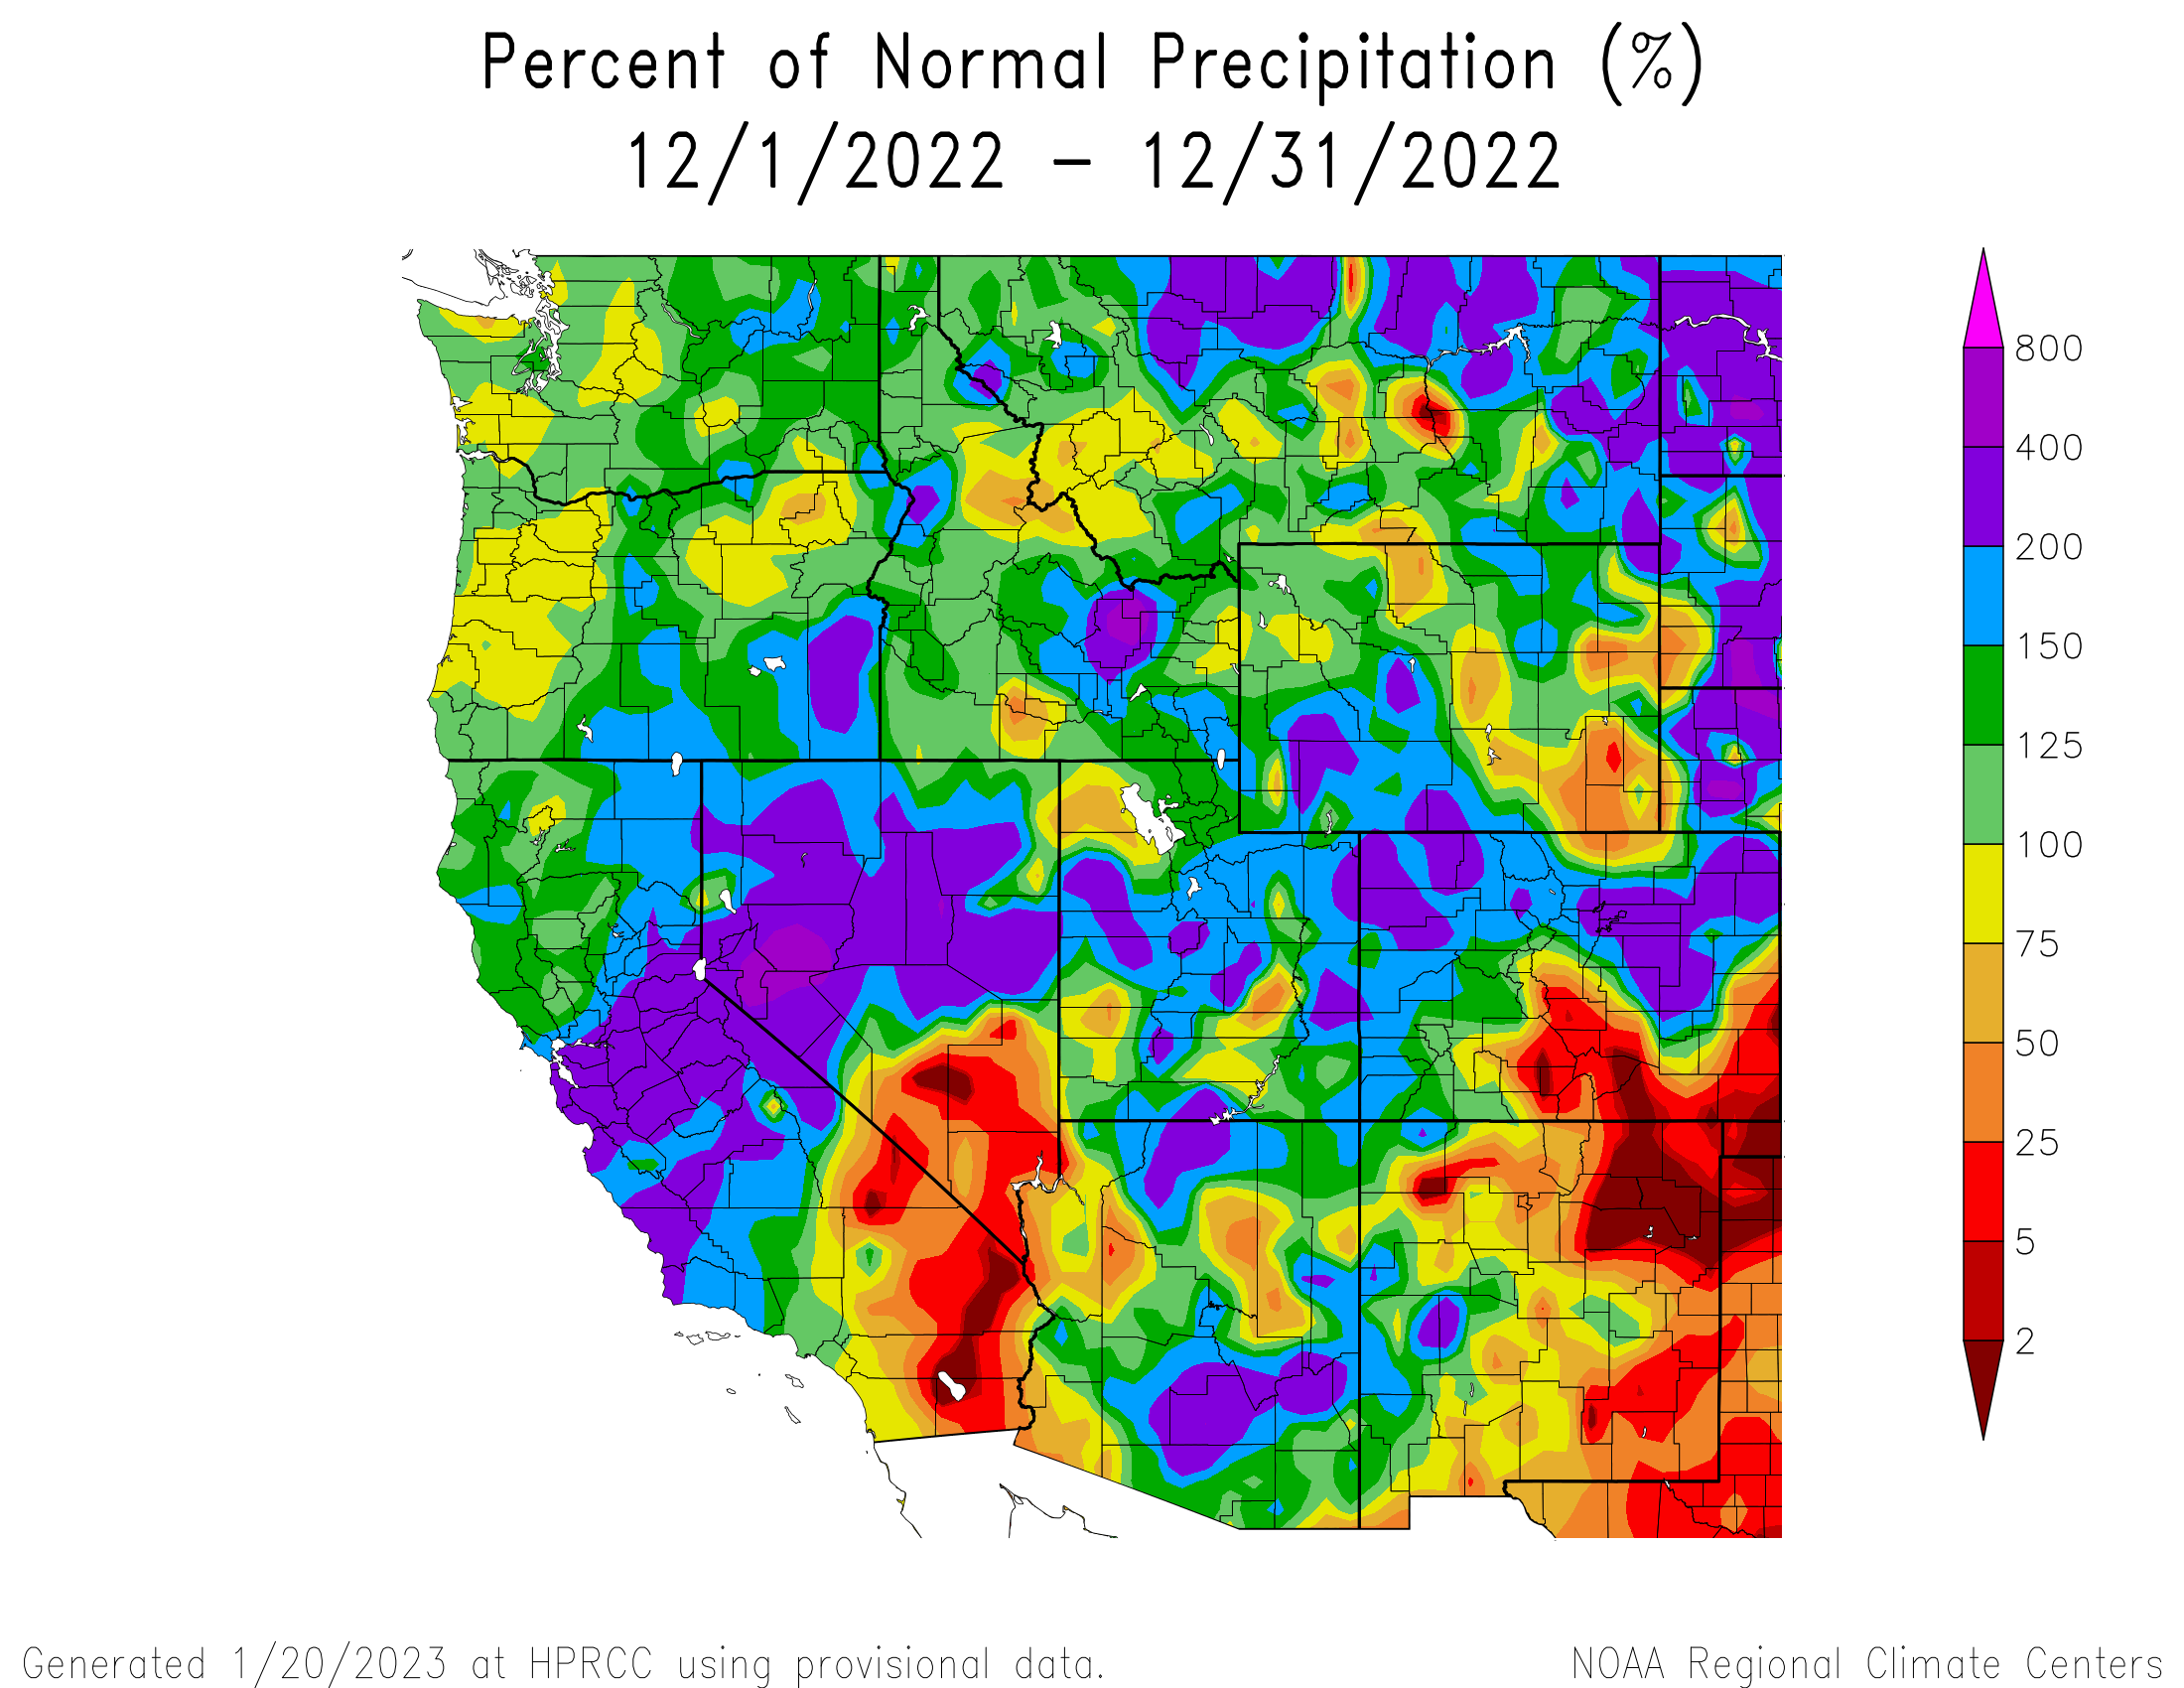
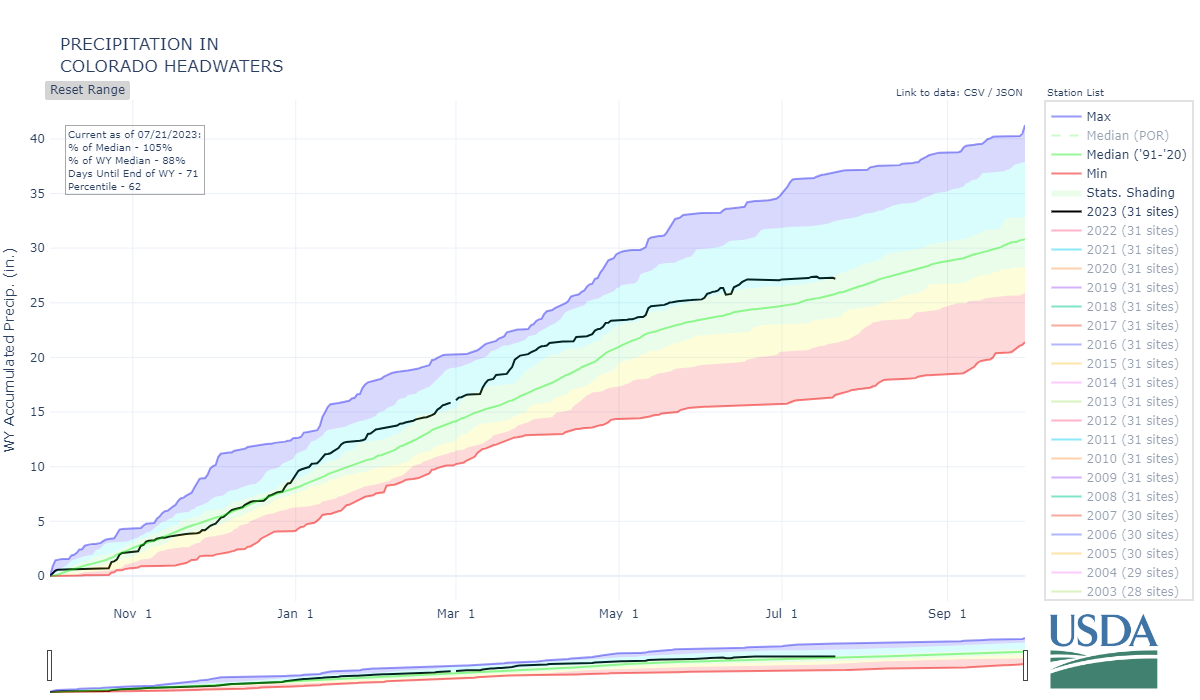
December Weather Summary: Coming off of a cold November, we entered a snowy December characterized by strong atmospheric rivers dropping above average precipitation on much of Colorado, Utah, and western Wyoming. Utah in particular ended the month with 155% of median SWE. The majority of Colorado saw either a one or two category improvement in drought status. Only a small pocket in the Sangre de Cristo’s saw worsening drought, and the Rio Grande and Arkansas struggled to keep up with a median snowpack.
Swamp Angel reported four December storms, with total December precipitation of 4.8” with 2.6’ of snow accumulation gained over 17 days of precipitation. The first storm brought total snowpack accumulation at Swamp Angel to 2.5’. The next storm in December favored higher elevations across the country, though with the wind, Senator Beck Study Basin only accumulated about 3”. A storm nestled in between the holidays, December 27-29, bumping Swamp Angel’s snowpack up a foot and a half, and the final storm in December continued into the New Year, dropping another foot of new snow.
Snowpack rests above the median at the beginning of January for the San Juan Mountains. Temperatures still remain slightly below average in northern Colorado, slightly above average in southern Colorado. There is a forecasted switch to neutral ENSO from La Nina, with 60-80 percent certainty due to warming Pacific waters. Potential for an El Nino fall. The NOAA seasonal outlook predicts below average precipitation for January-March
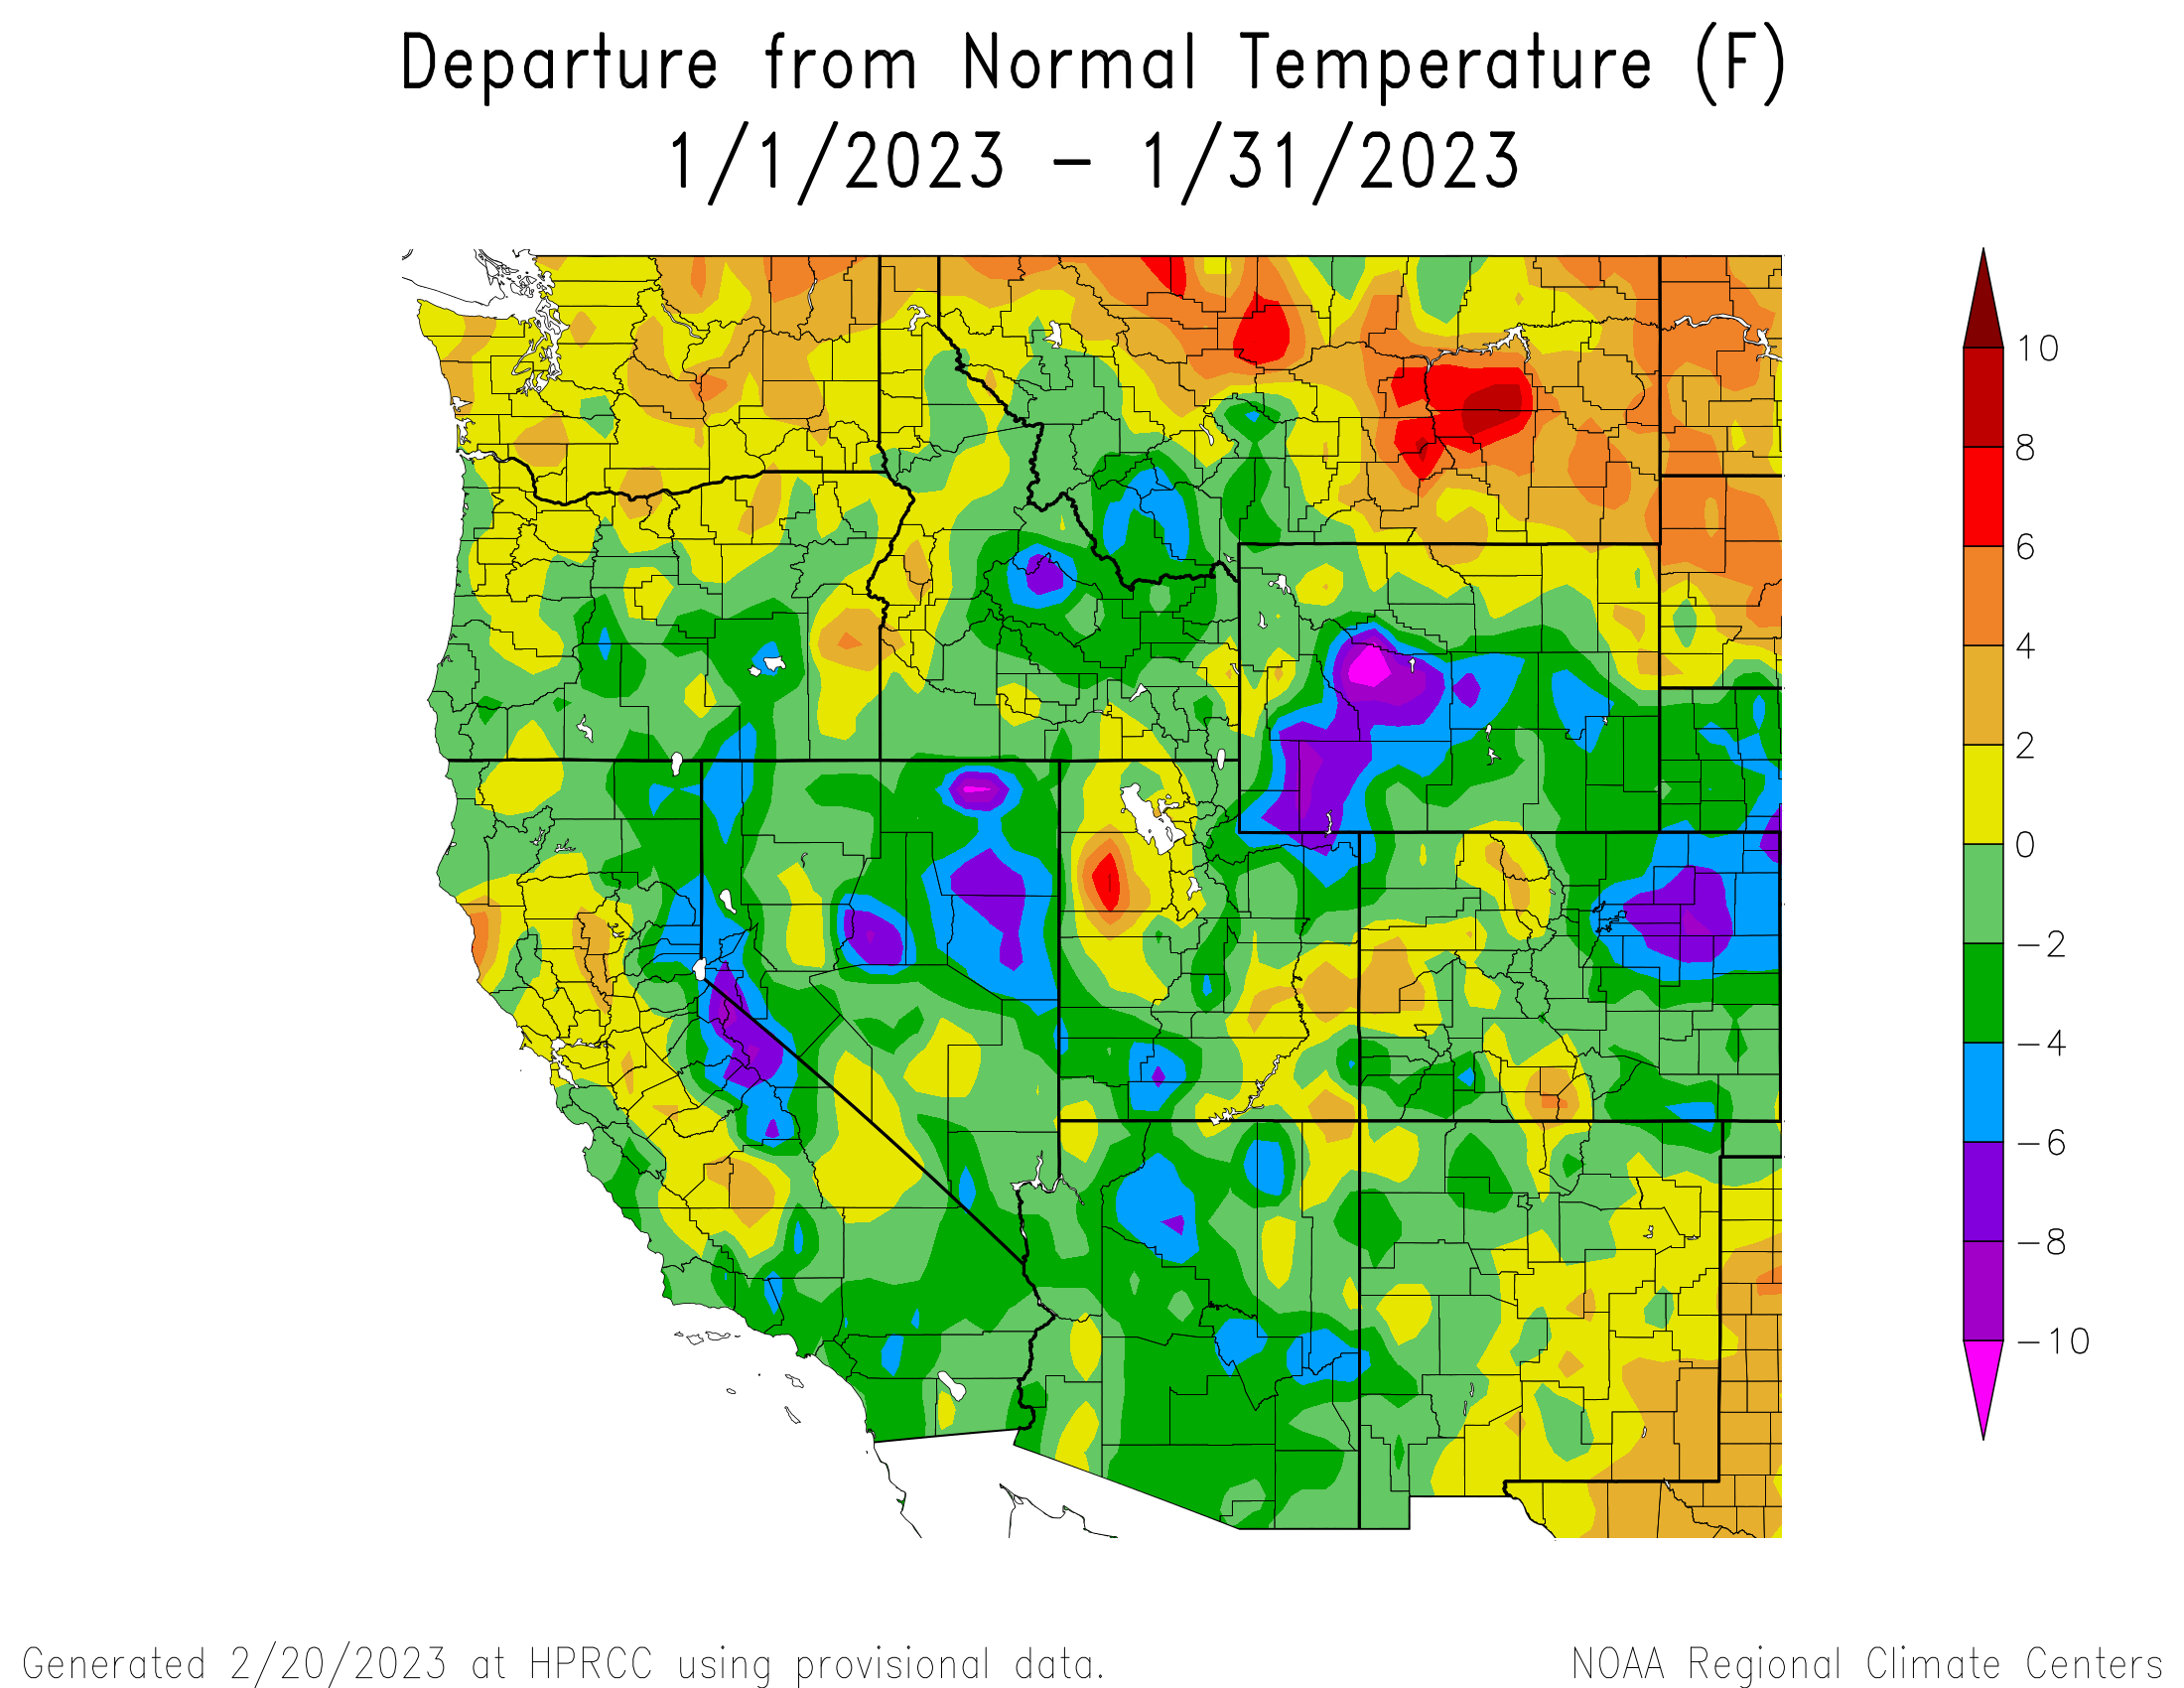
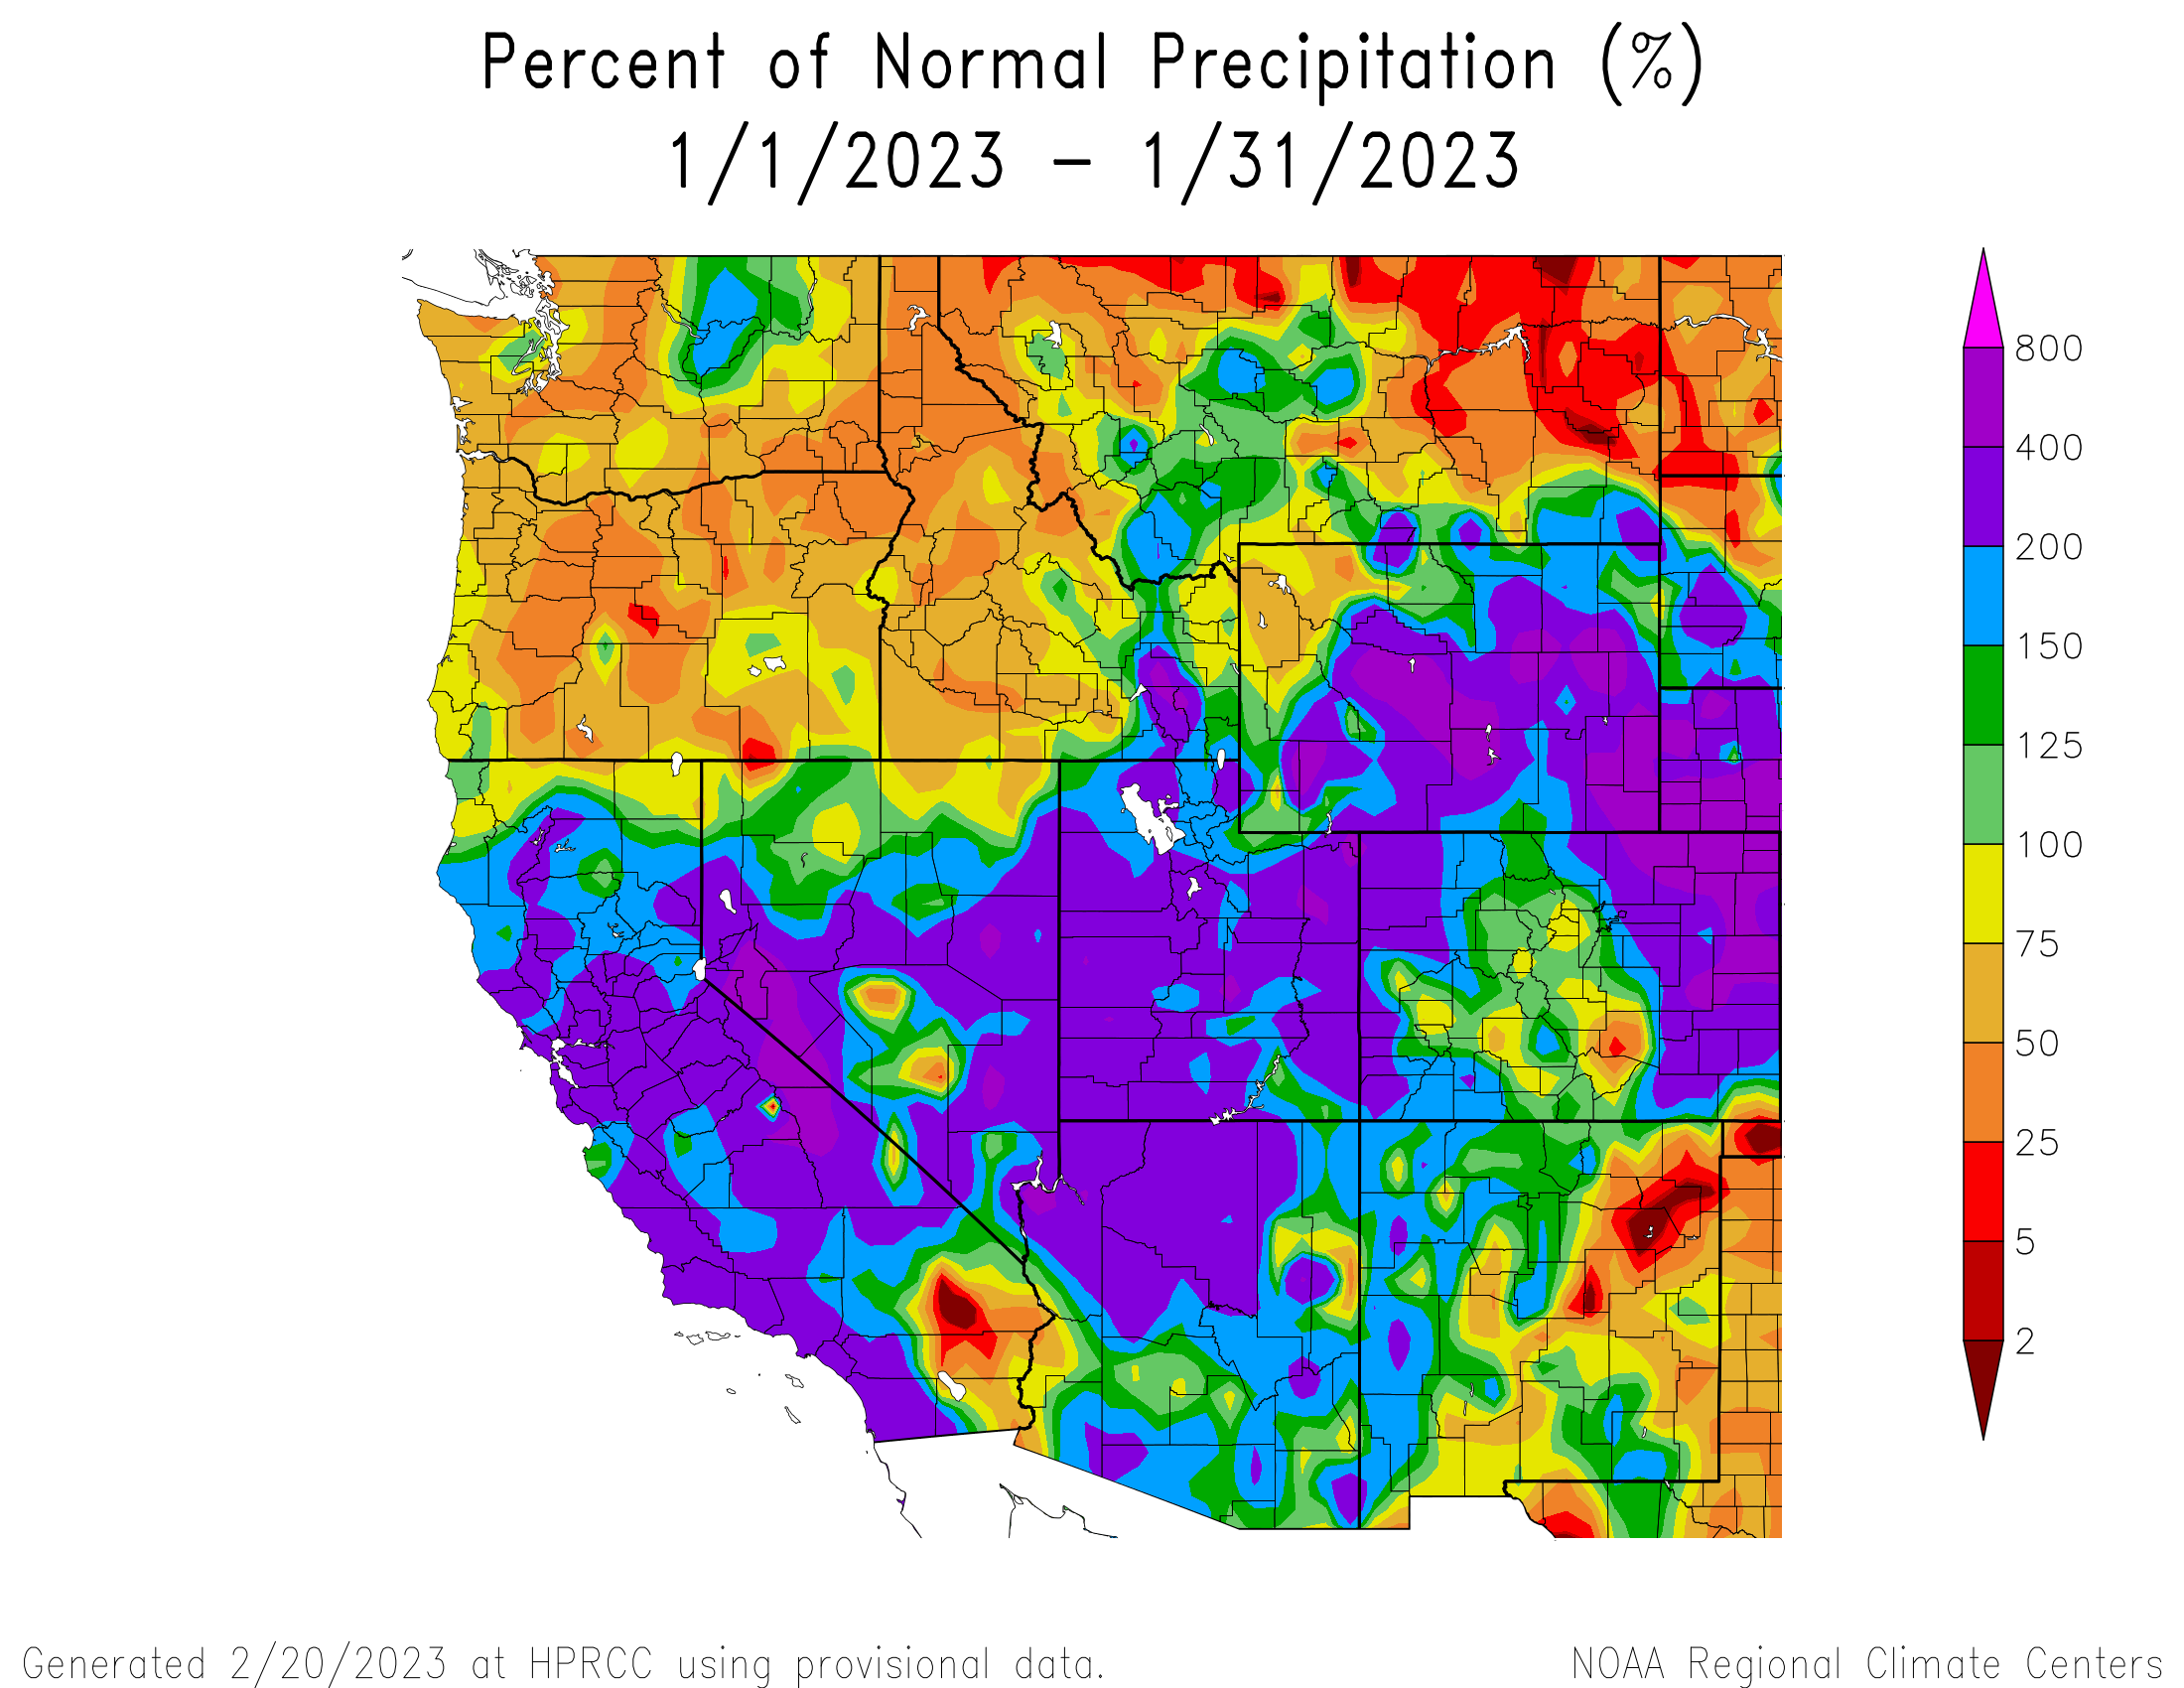
January Weather Summary: It was a big month for much of the intermountain west, ending with above average SWE across the mountains. Utah sits with more snow in the beginning of February than it has in 25 years, making it the snowiest winter since 1997. The state of Colorado had its 10th wettest January on record, ending the month with SWE at 131% of normal. The Arkansas River basin continues to stand out being below average at 82% of normal SWE. Much of the western U.S. was pummeled from late December through mid-January, as a series of nine atmospheric rivers dumped more than a season’s worth of rain and snow in some areas in a few short weeks.
Swamp Angel had a much bigger January compared to last year; January 2022 recorded zero storms, 2.7” SWE, and 12 days of precipitation. This year we had four January storms (five if you include the last December storm which rolled through into January 2nd), resulting in 6.7” total new SWE. 28 out of 31 days had recorded precipitation! Swamp Angel snowpack height neared two meters after the last January storm (1.92 m).
January started off snowing, from a 76-hour storm that began on December 30th and lasted through January 2nd. A string of consistent storms carried us through the month. The first January storm added 0.5” precipitation and half a foot of snow. The second from January 9-11, saw a bit more, just over 7” added to the Swamp Angel snowpack. A few days later the third January storm (14th-15th) added a good bit of snow to the higher Senator Beck study plot and a little less at Swampy. The final January storm (16th-18th) dropped over a foot of snow and 1.9” of precipitation, bringing the SASP snowpack close to 2 meters. The last half of January didn’t see any CSAS ‘storms’, i.e. 12 mm (0.5”) of precipitation with less than 12 hours between recorded precipitation, but continued to add small amounts of water to the snowpack, therefore keeping surface albedo high.
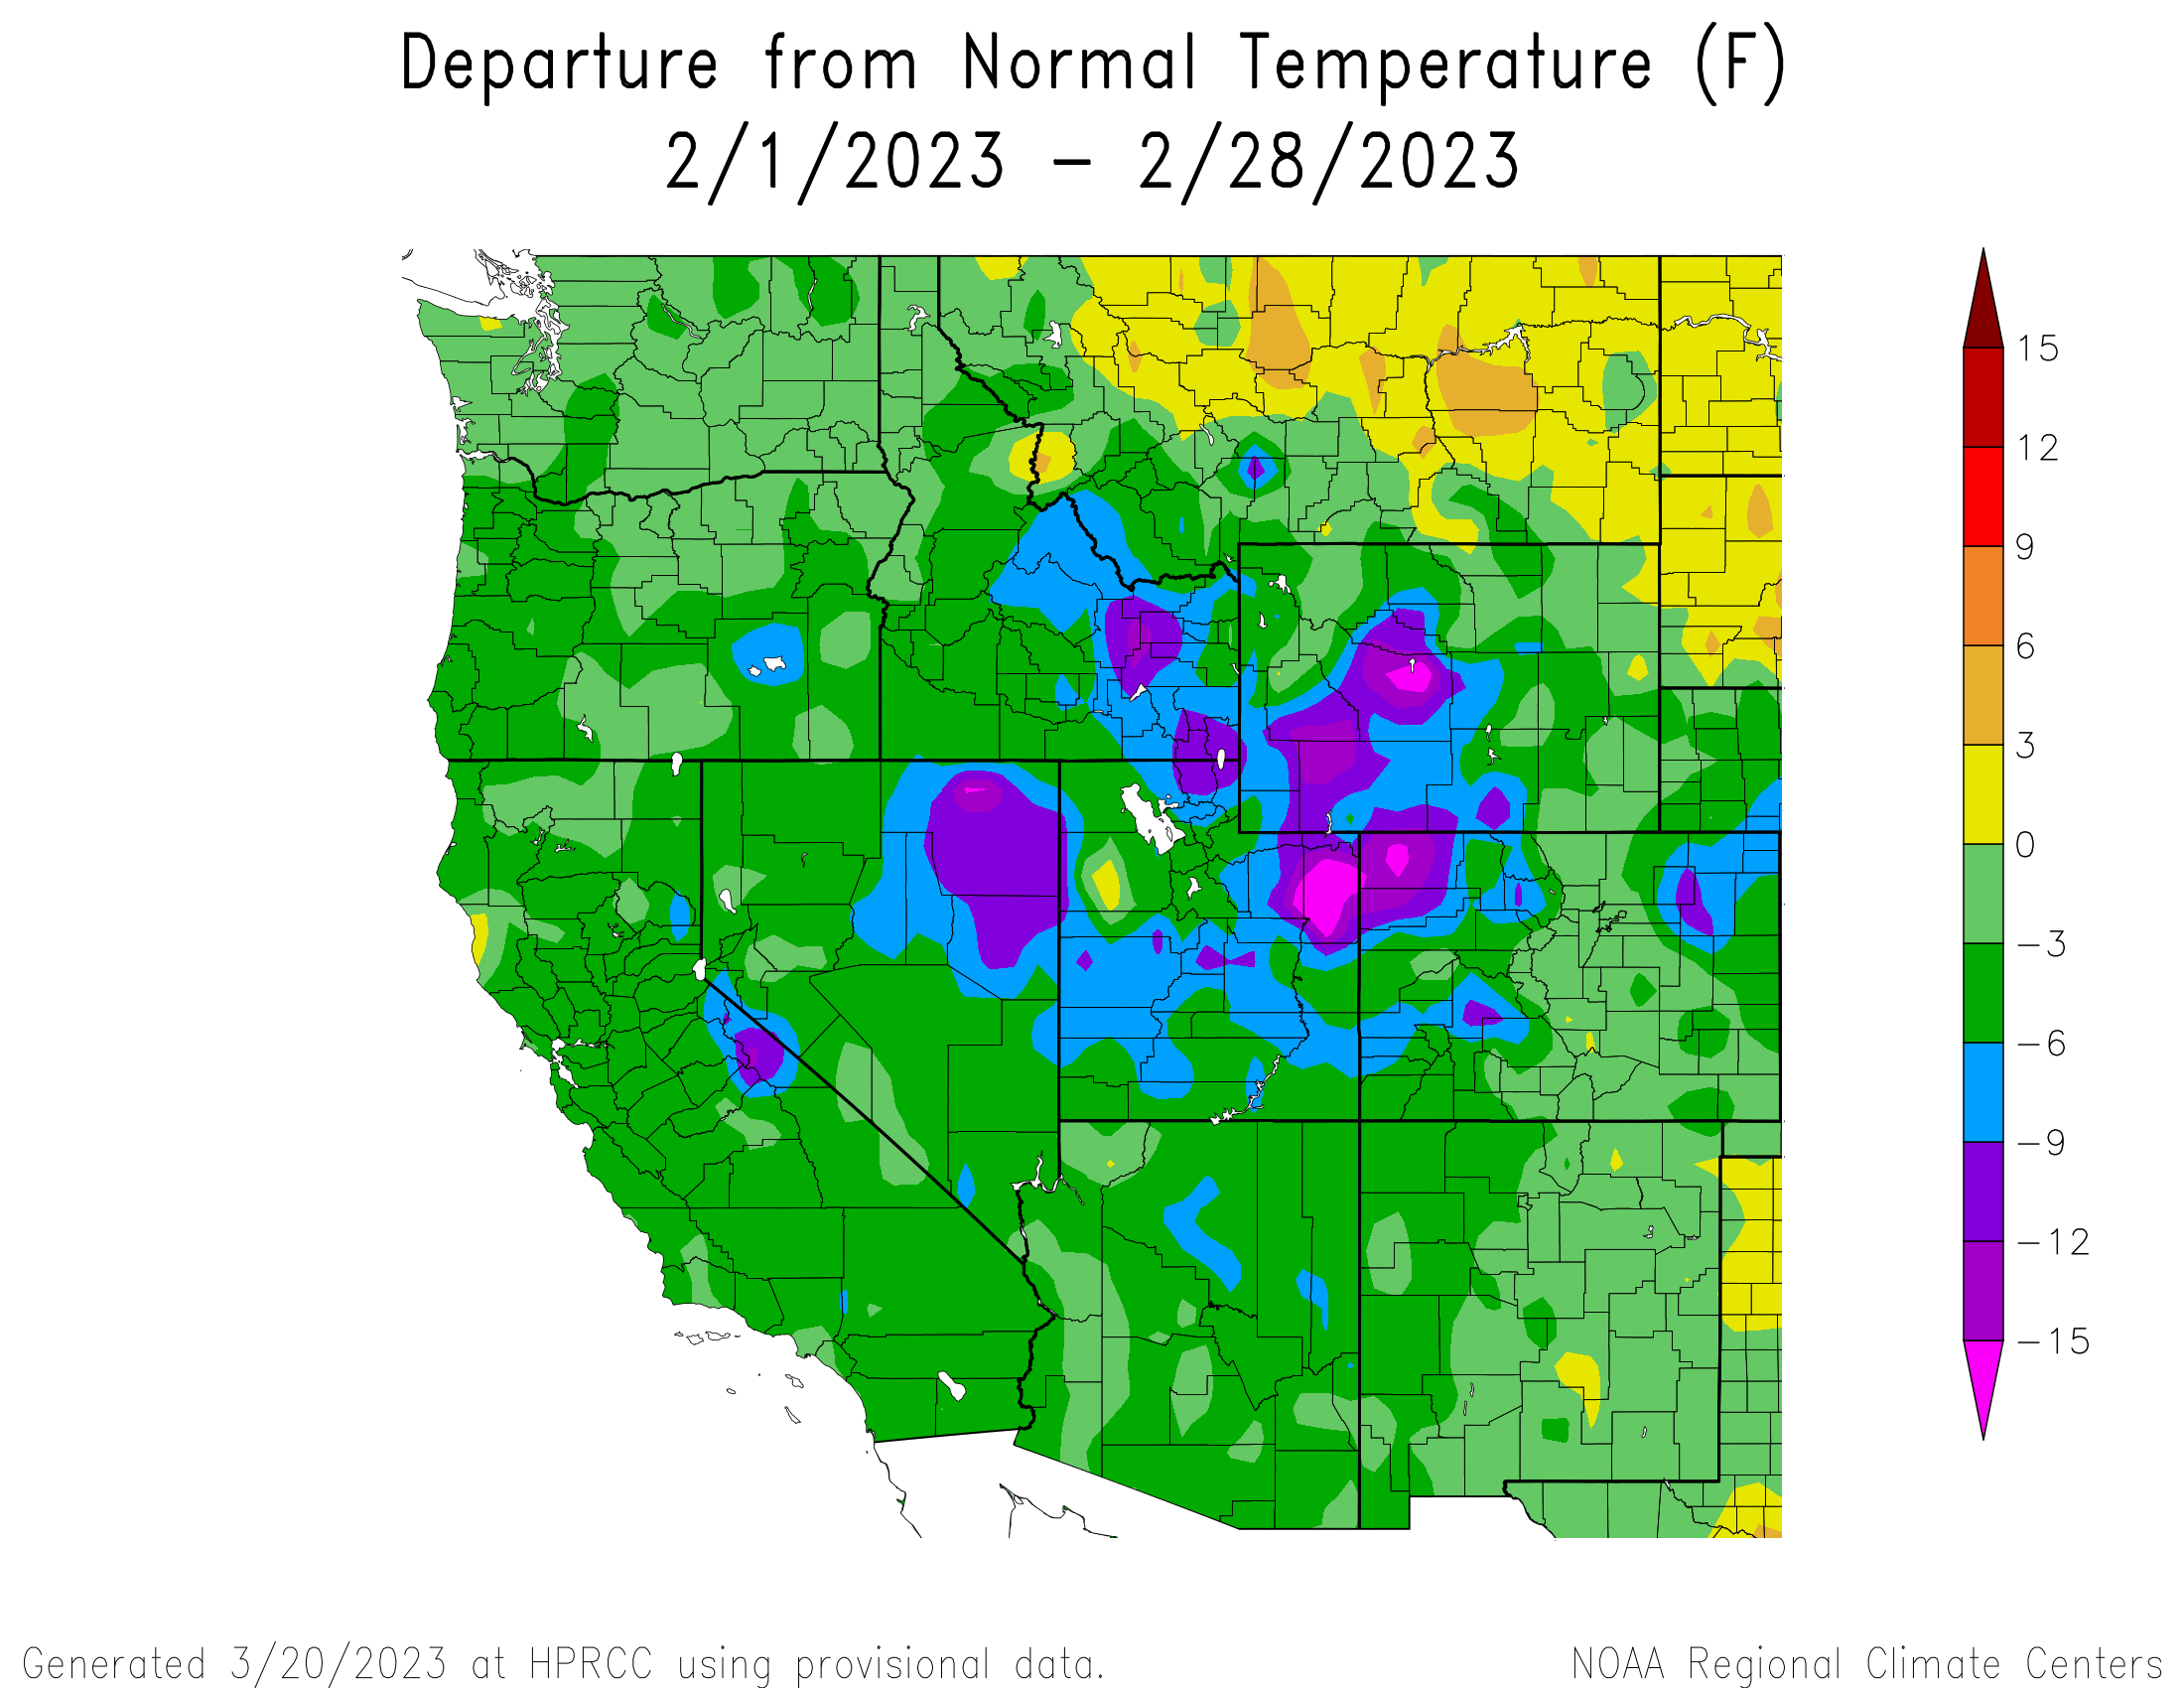
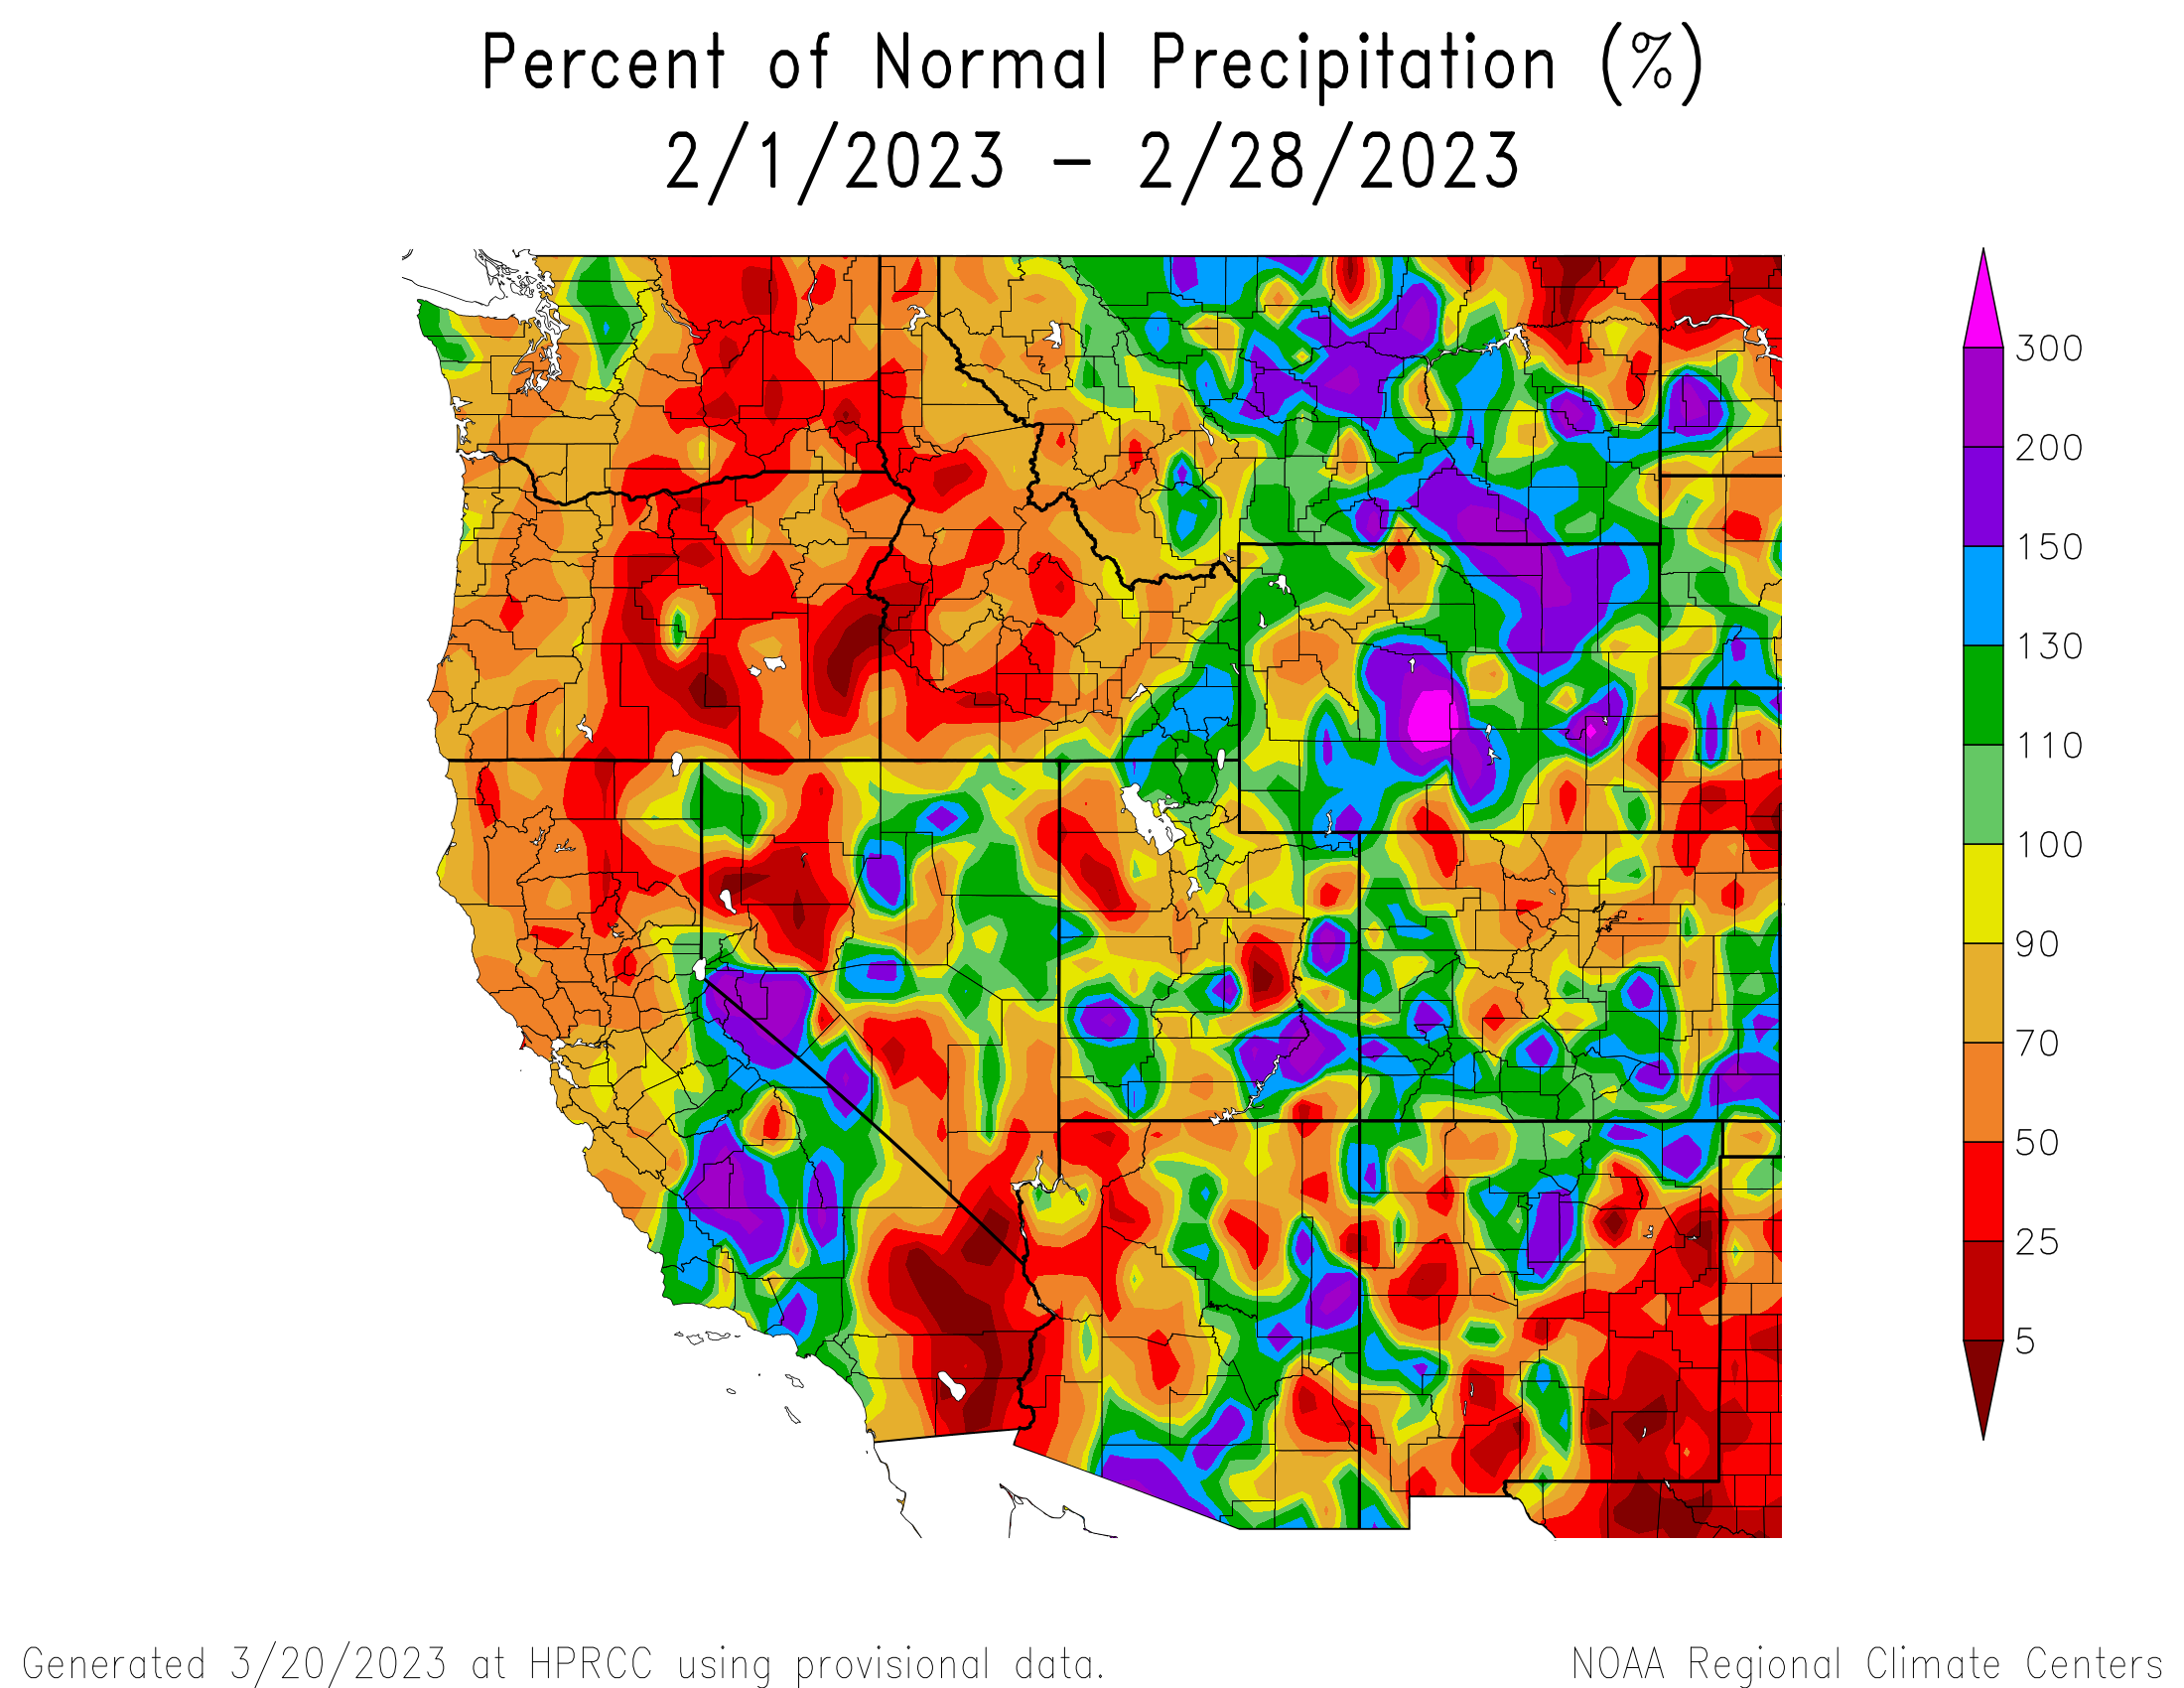
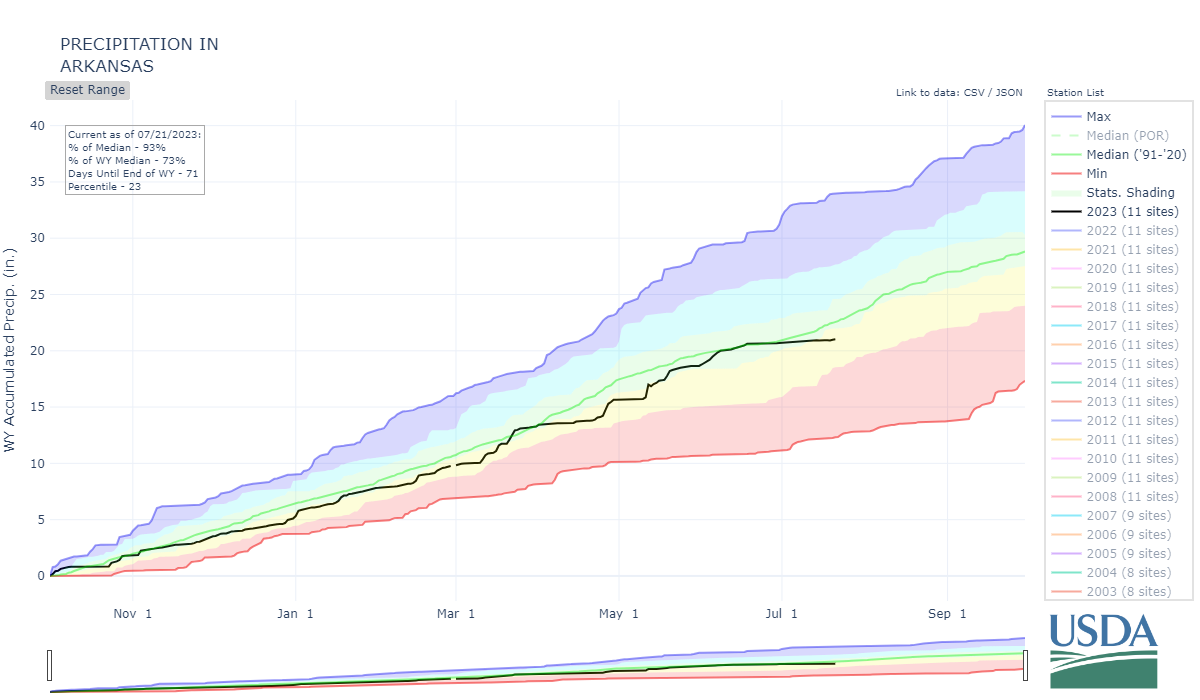
February Weather Summary: February was windy with colder-than-average temperatures statewide. Above average SWE conditions have held steady. The exception for above average SWE is the Arkansas River basin which rests at 78%, down from 82% at the end of January. Notably, the Southern mountains were hit with significant snowfall; the Upper Pecos River basin in New Mexico went from 76% of median to 109% within the month.
Swamp Angel’s daily average air temperature stayed below freezing all month. We recorded two storms after an early February dry spell, February 13-15th and February 21-24th, accounting for 3.7” precipitation out of the monthly total of 4” over 9 days of snowfall. Putney Study Plot recorded a monthly max wind gust 105 mph during the second February storm.
March Weather Summary: March 1st snow depth at SASP was 2.0 meters and the month brought in another half a meter (1.6’) of snow accumulation; snow depth peaked for the 22/23 winter season at 2.69 meters, or 8.8’. We saw four storms, 18 days with precipitation, amounting to 7.6” water (average for SASP in March is 4.4”) of precipitation in March – comparable storm count and days with snow as last year, but almost double the precipitation, much snowier!
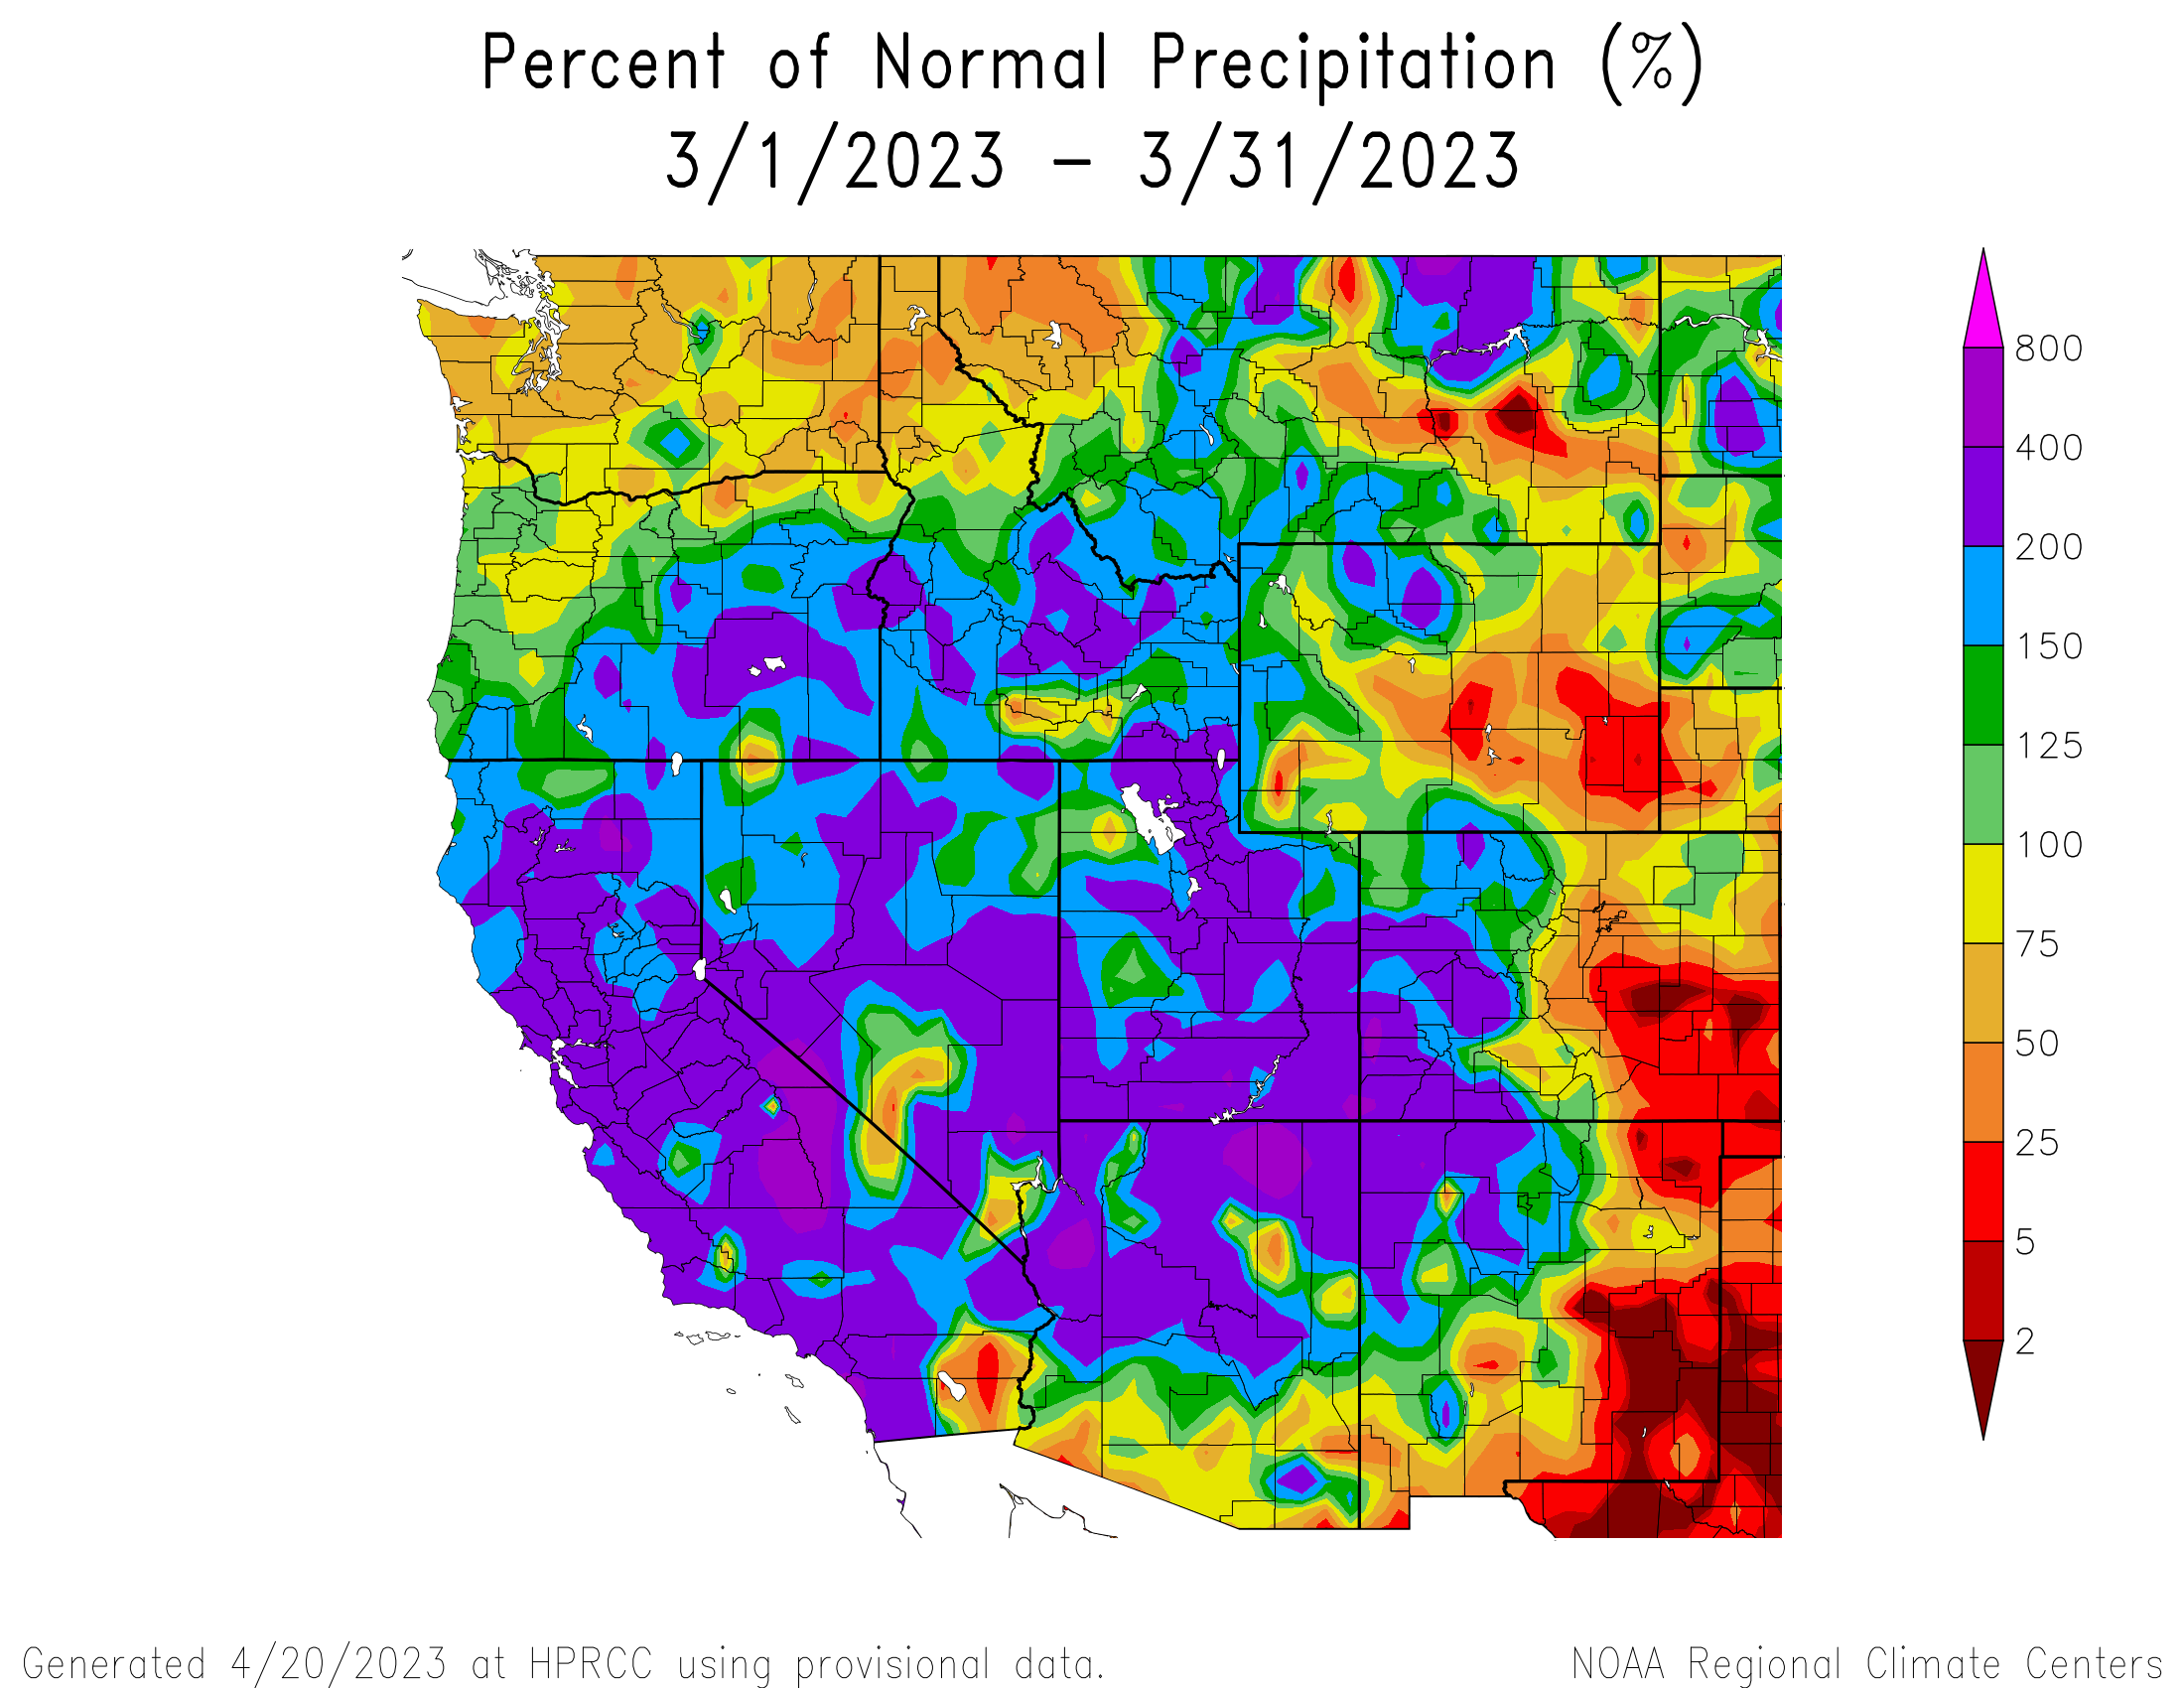
West of the continental divide in Colorado, March set records with much-above normal precipitation totals and below average temperatures. Average April 1st SWE for the state of Colorado was 140%. Notably, the Dolores River basin SWE was at a record 165% of average. At the end of March, most river basins across the state were near-normal or above for percent SWE, the lowest being the Arkansas River Basin at 96 % of SWE on April 1st.
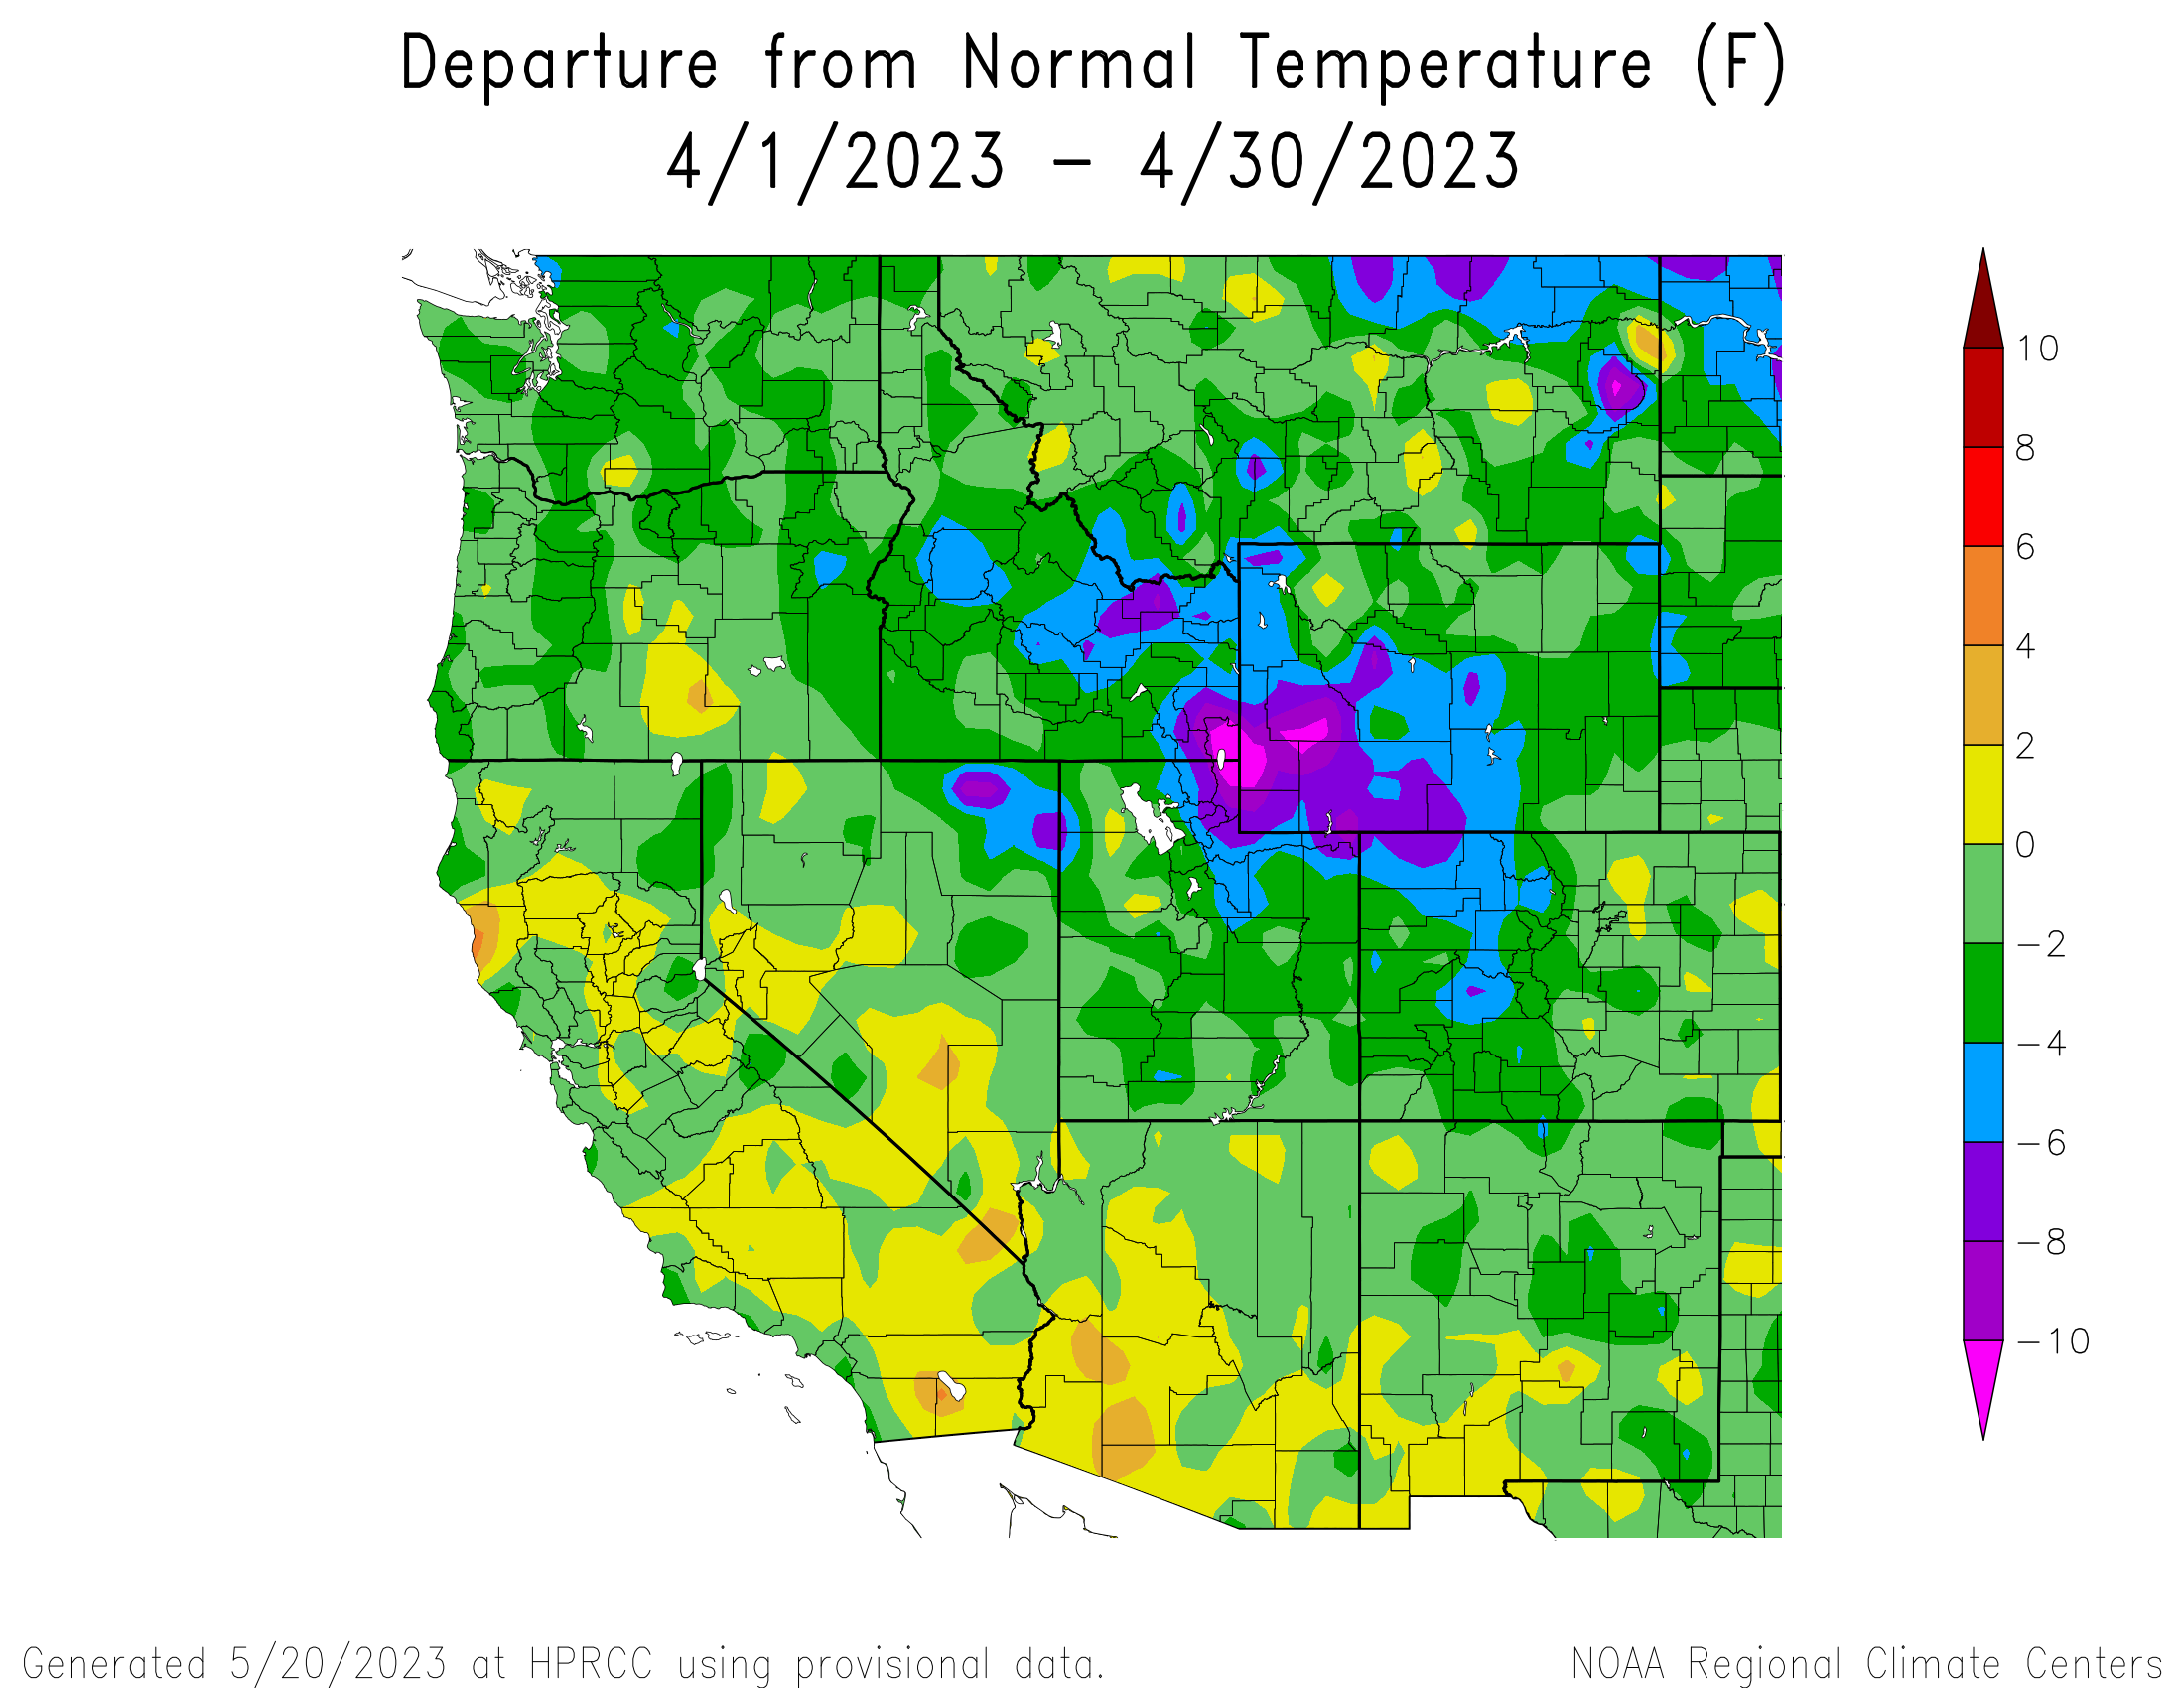
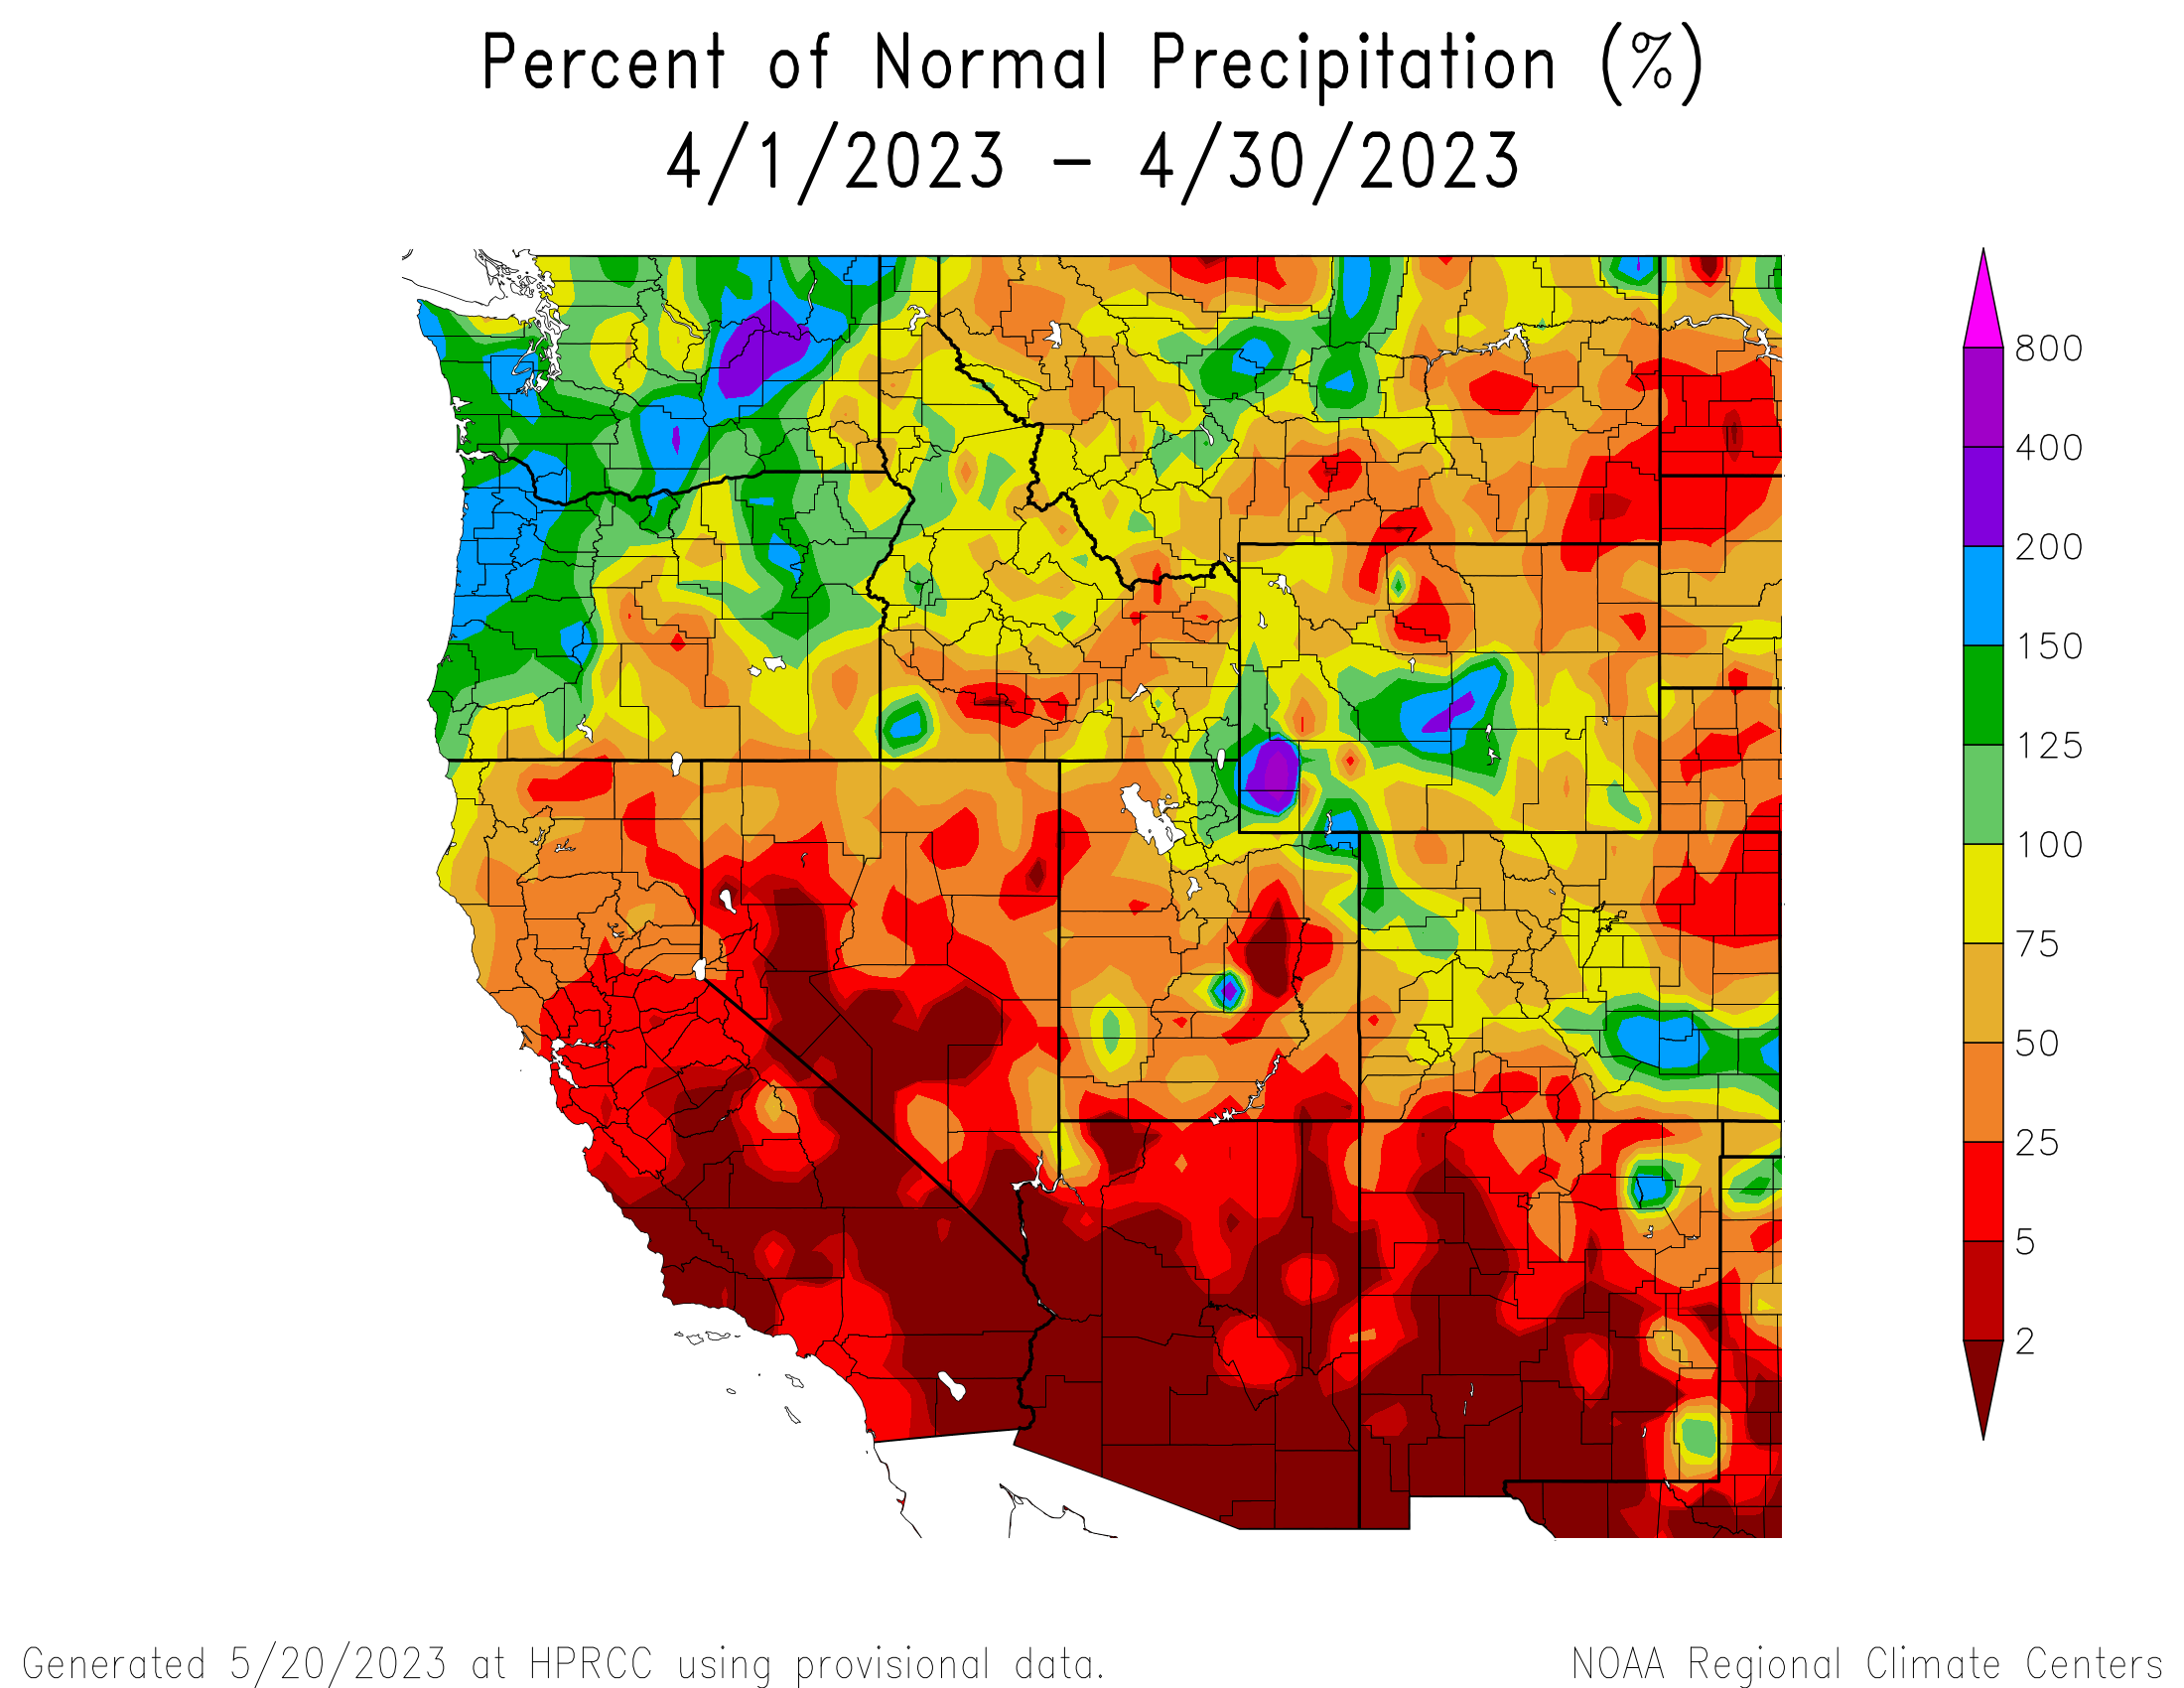
April Weather Summary: Colorado in April was cold and drier except for the southeastern part of the state which experienced wetter than average conditions. The Arkansas River Basin was the anomaly in the intermountain west region, sitting below average SWE at around 81%; the rest of Colorado holds an average-to-above average snowpack. Statewide percent median SWE for Colorado stands at 139%. Drought conditions worsened in Colorado, with coverage going from 37% to 44%, reflecting a drier eastern parts of the state. The inflow forecast for Lake Powell was 172% which should help the system in stress get by another year.
April brought SASP three winter storms, 15 days with precipitation, totaling 3.9” of precipitation. An end of month storm, April 24-26, dropped a foot of snow over 53 hours. Overall, precipitation for SASP in April was slightly below the average 4.4”, and from the start to the end of the month the snowpack at Swamp Angel saw a consolidation resulting in a depth decrease from 2.5 to 2.0 m. Max temperature hit 14.3 C (58 F) on April 11th and nighttime April temperatures stayed below freezing.
May Weather Summary:
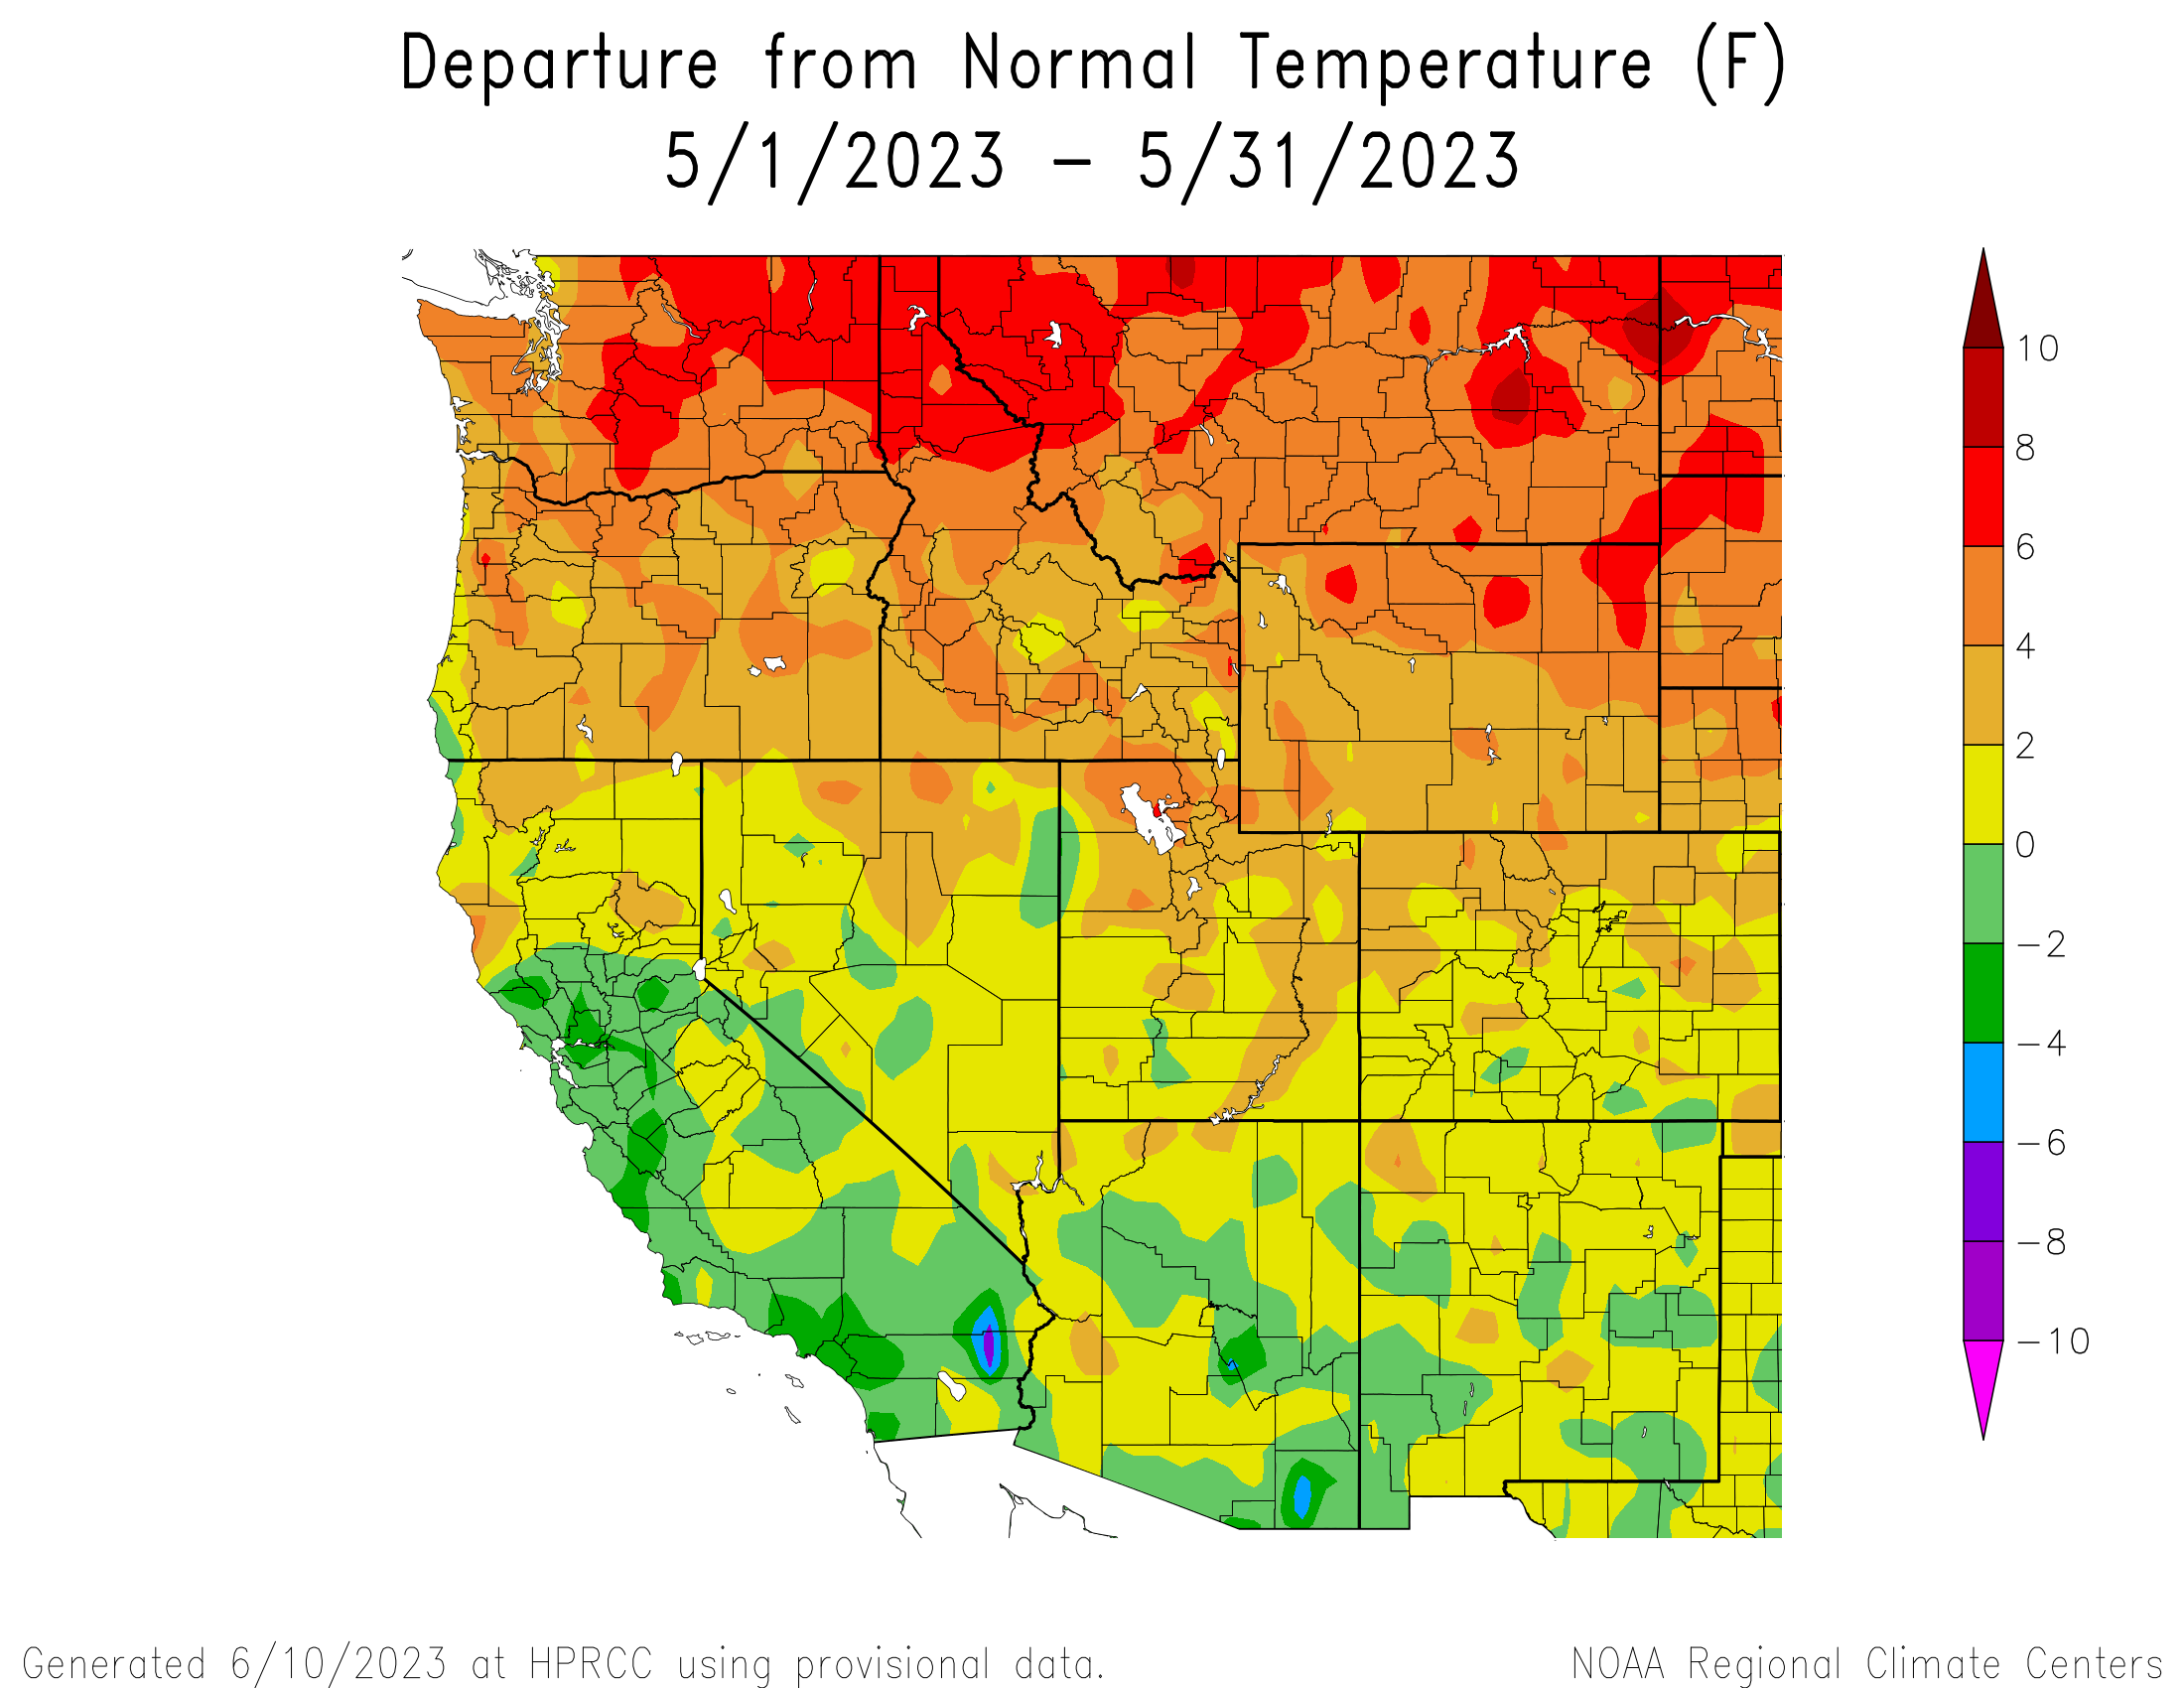
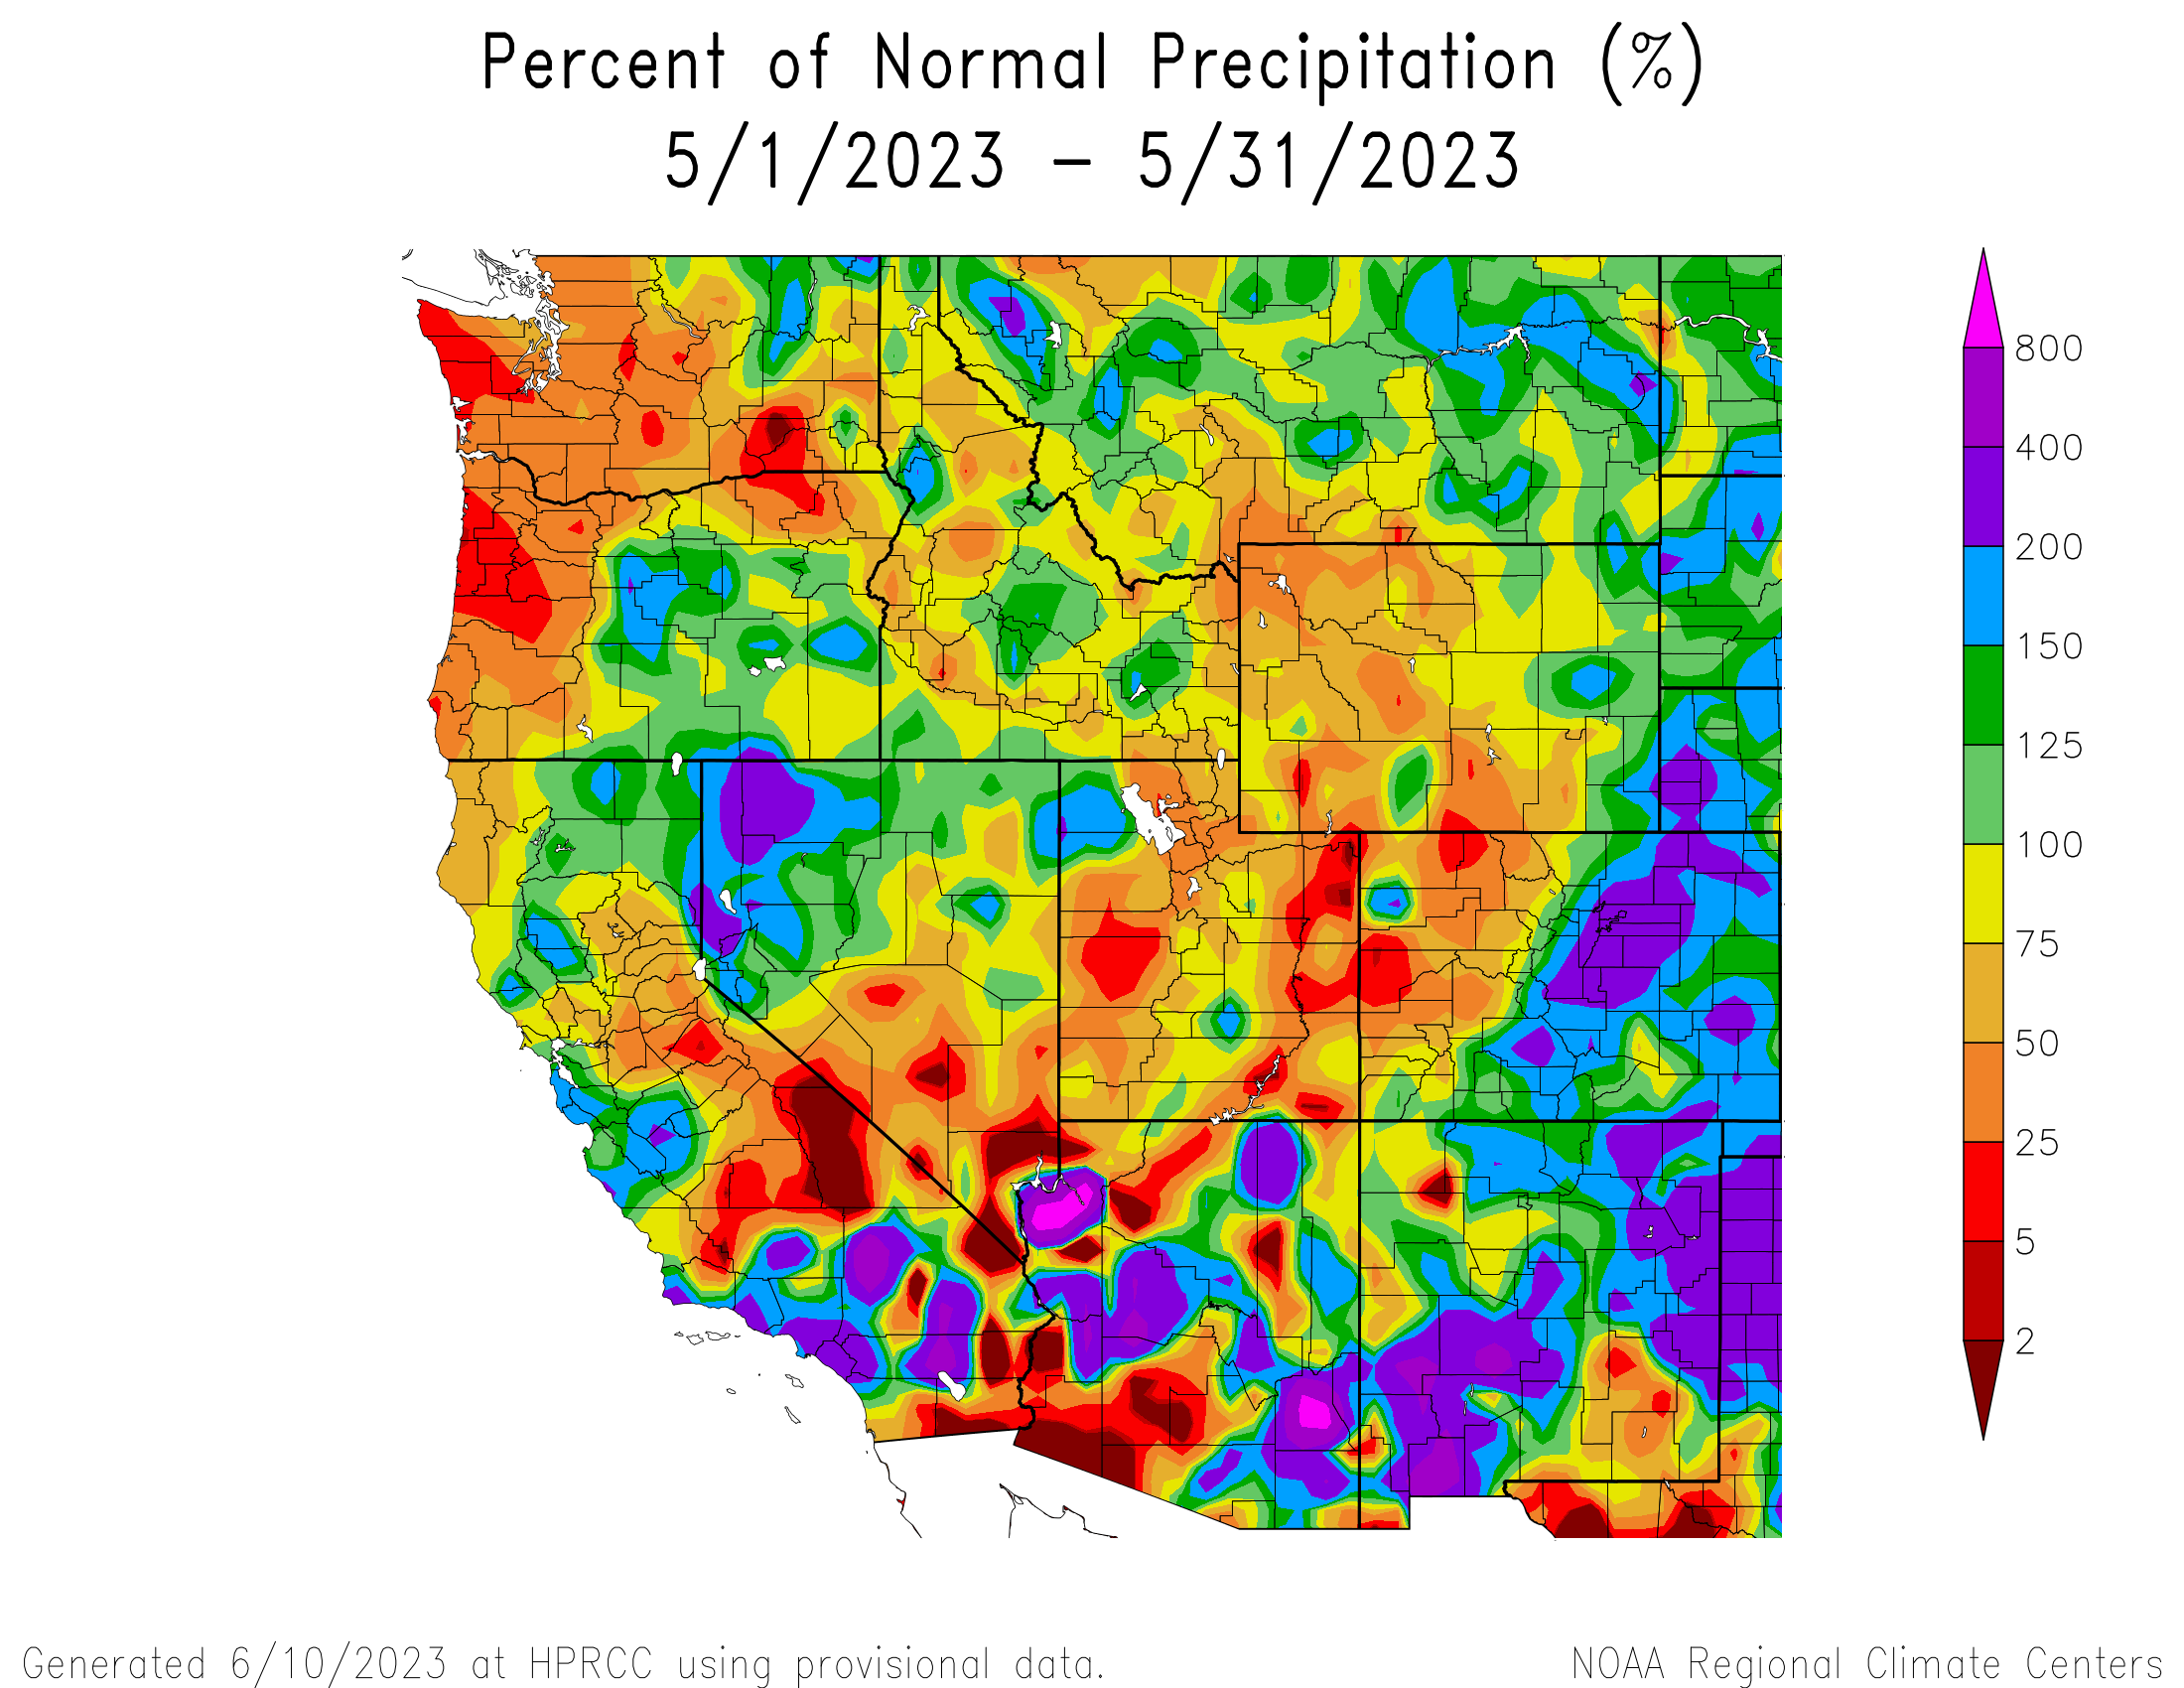
The state warmed up for the month of May as a departure from the previous colder months. Eastern Colorado saw lots of rain in May with many counties experiencing around the 10th wettest conditions since 1895. Drought conditions improved across the state, with less than 8% of the state in drought at the end of May compared with 27% in drought at the end of February. Among the highest in seasonal streamflow forecasts was the Dolores, which hasn’t seen high enough flows to boat since 2019, and the San Juan River basin. A boon for Lake Powell as well, as it was forecasted to receive 168% of average inflow.
Swamp Angel Study Plot saw a relatively dry May; one light storm in mid-May and 11 days total of precipitation. Total precipitation in May was 1.9”, only 61% of normal. Minimum temperature was -5.0 C (23 F) on May 5th and maximum temperature was 15.8 C (60.4 F) on May 29th. NOAA’s monthly precipitation outlook shows potential for Southwestern Colorado to miss out on the rainy conditions that the rest of the state has been experiencing as we head into June.
The talk of the town in May was also the anticipation of El Nino conditions as Pacific sea surface temperatures tipped towards the 0.5 degree warmer-than-average threshold. The probability of El Nino conditions remains at 70% through this coming winter.
June Weather Summary:
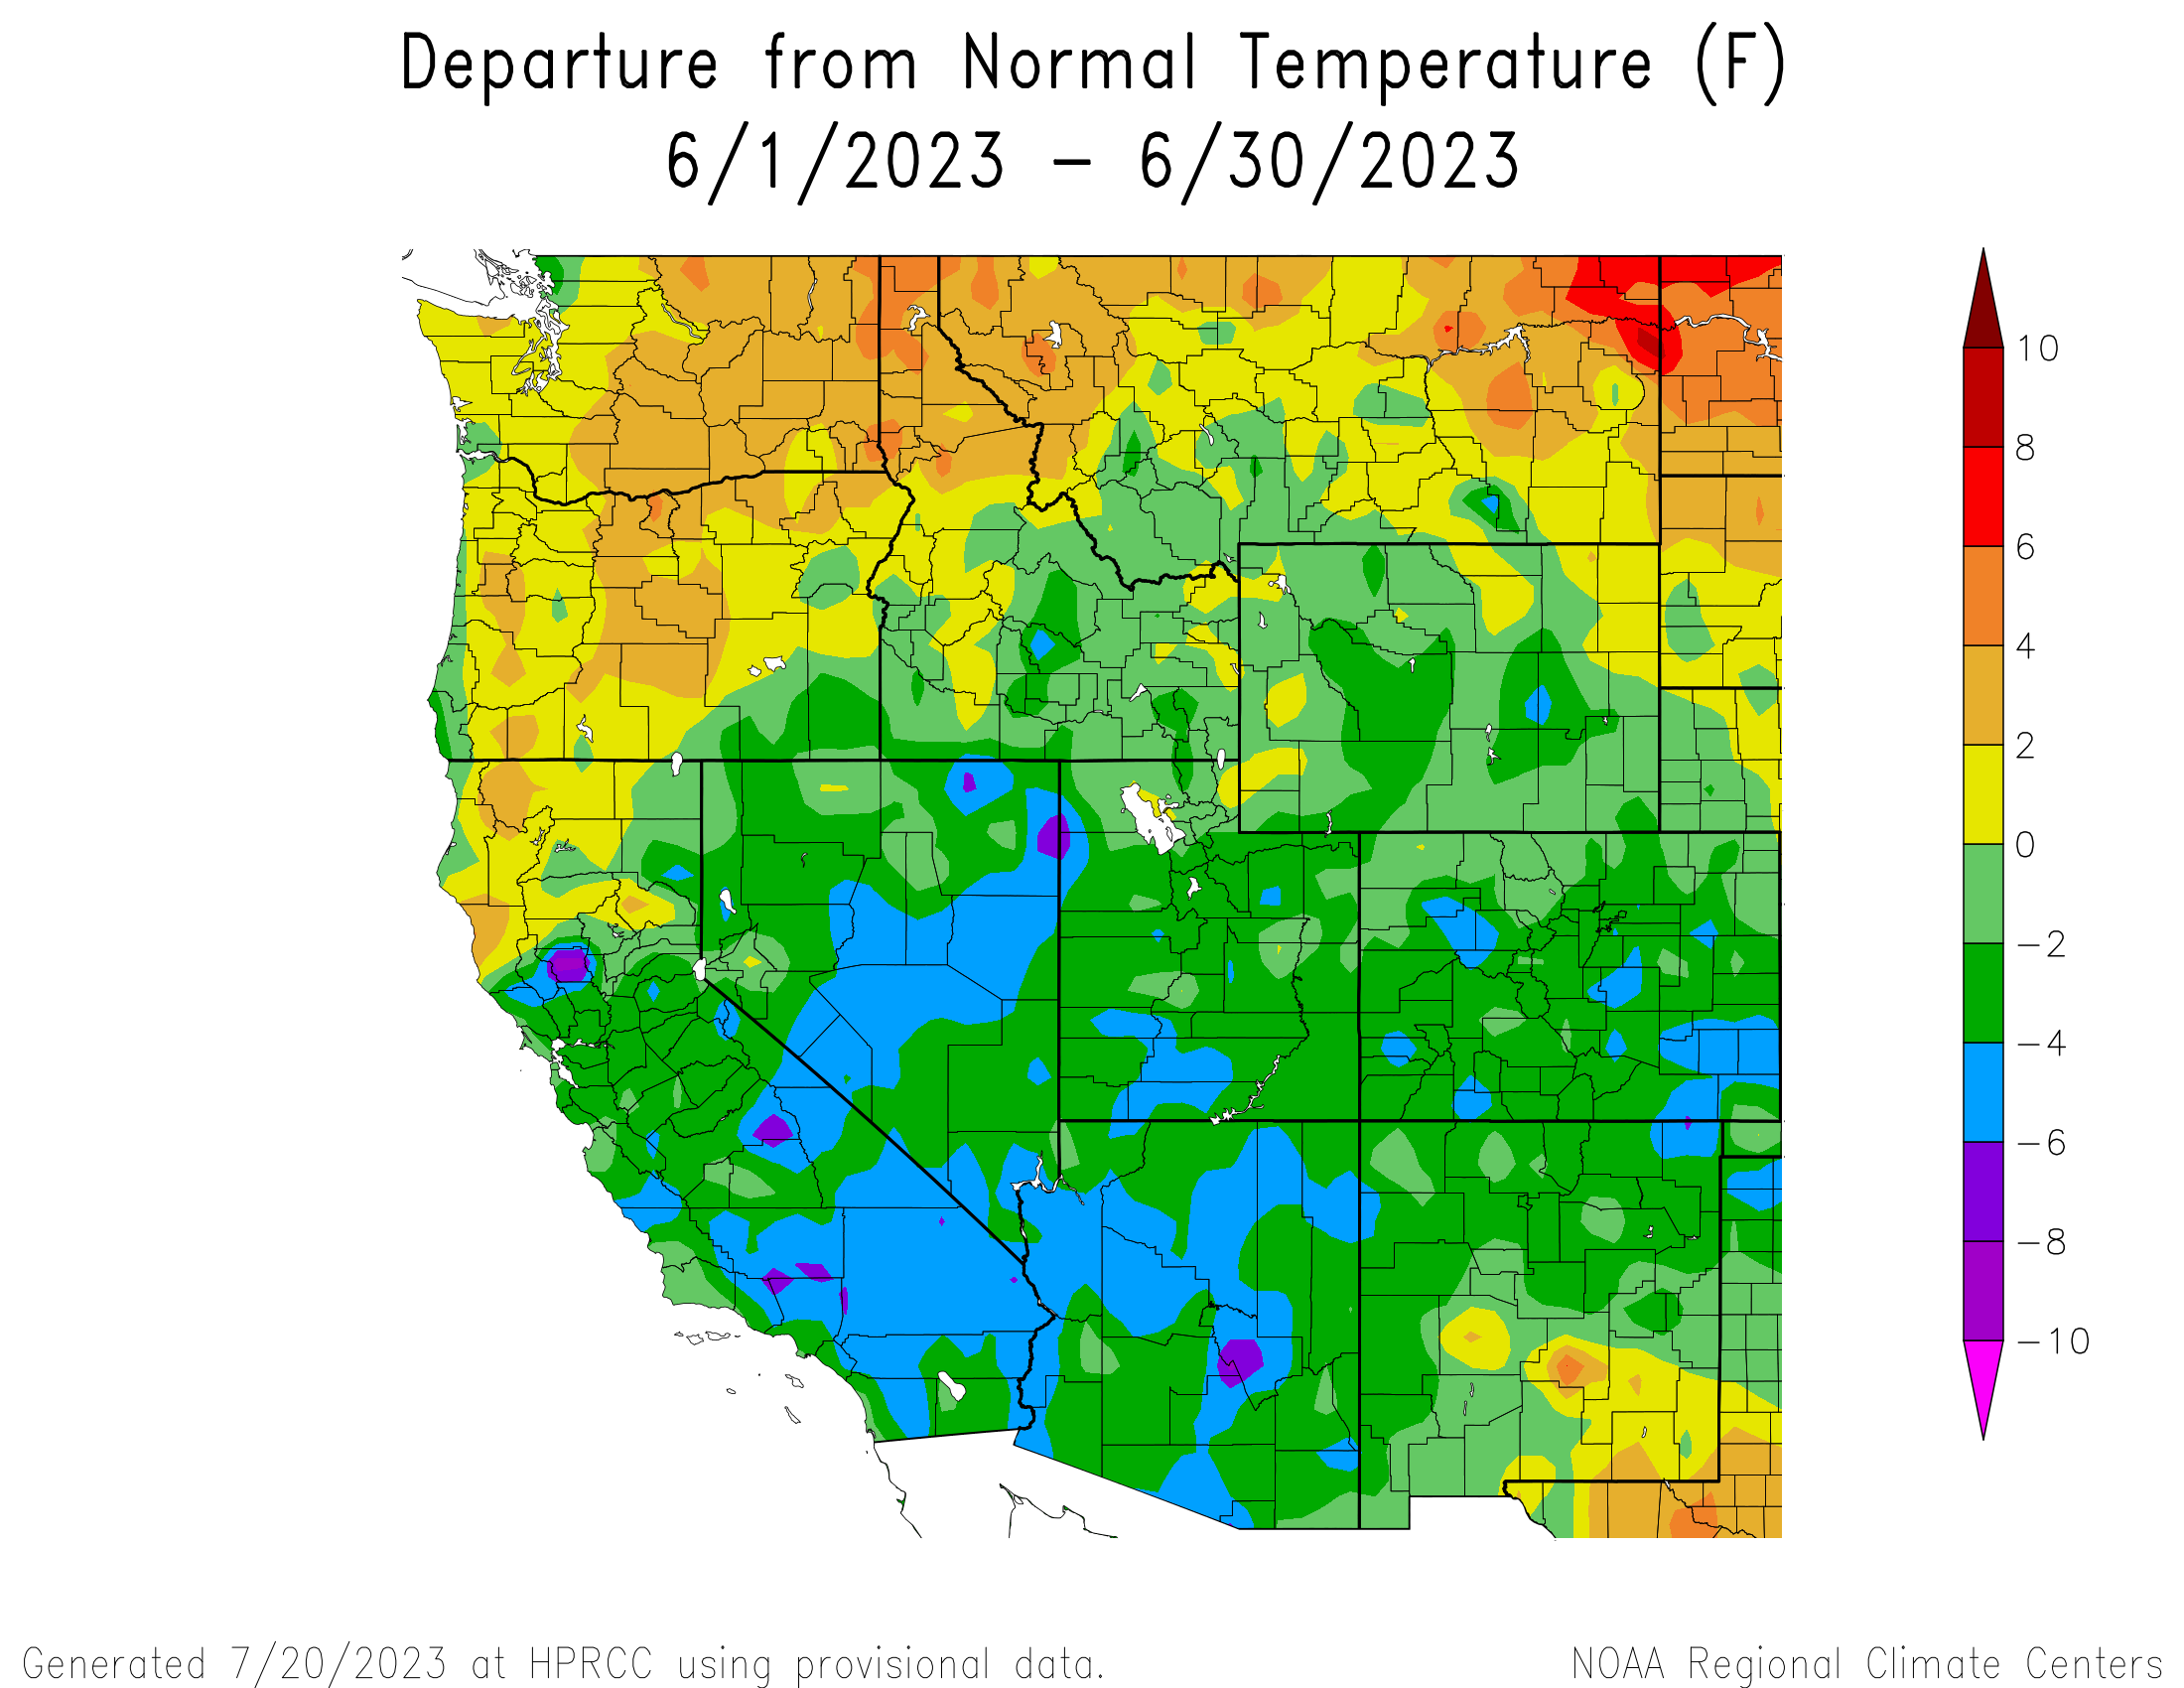
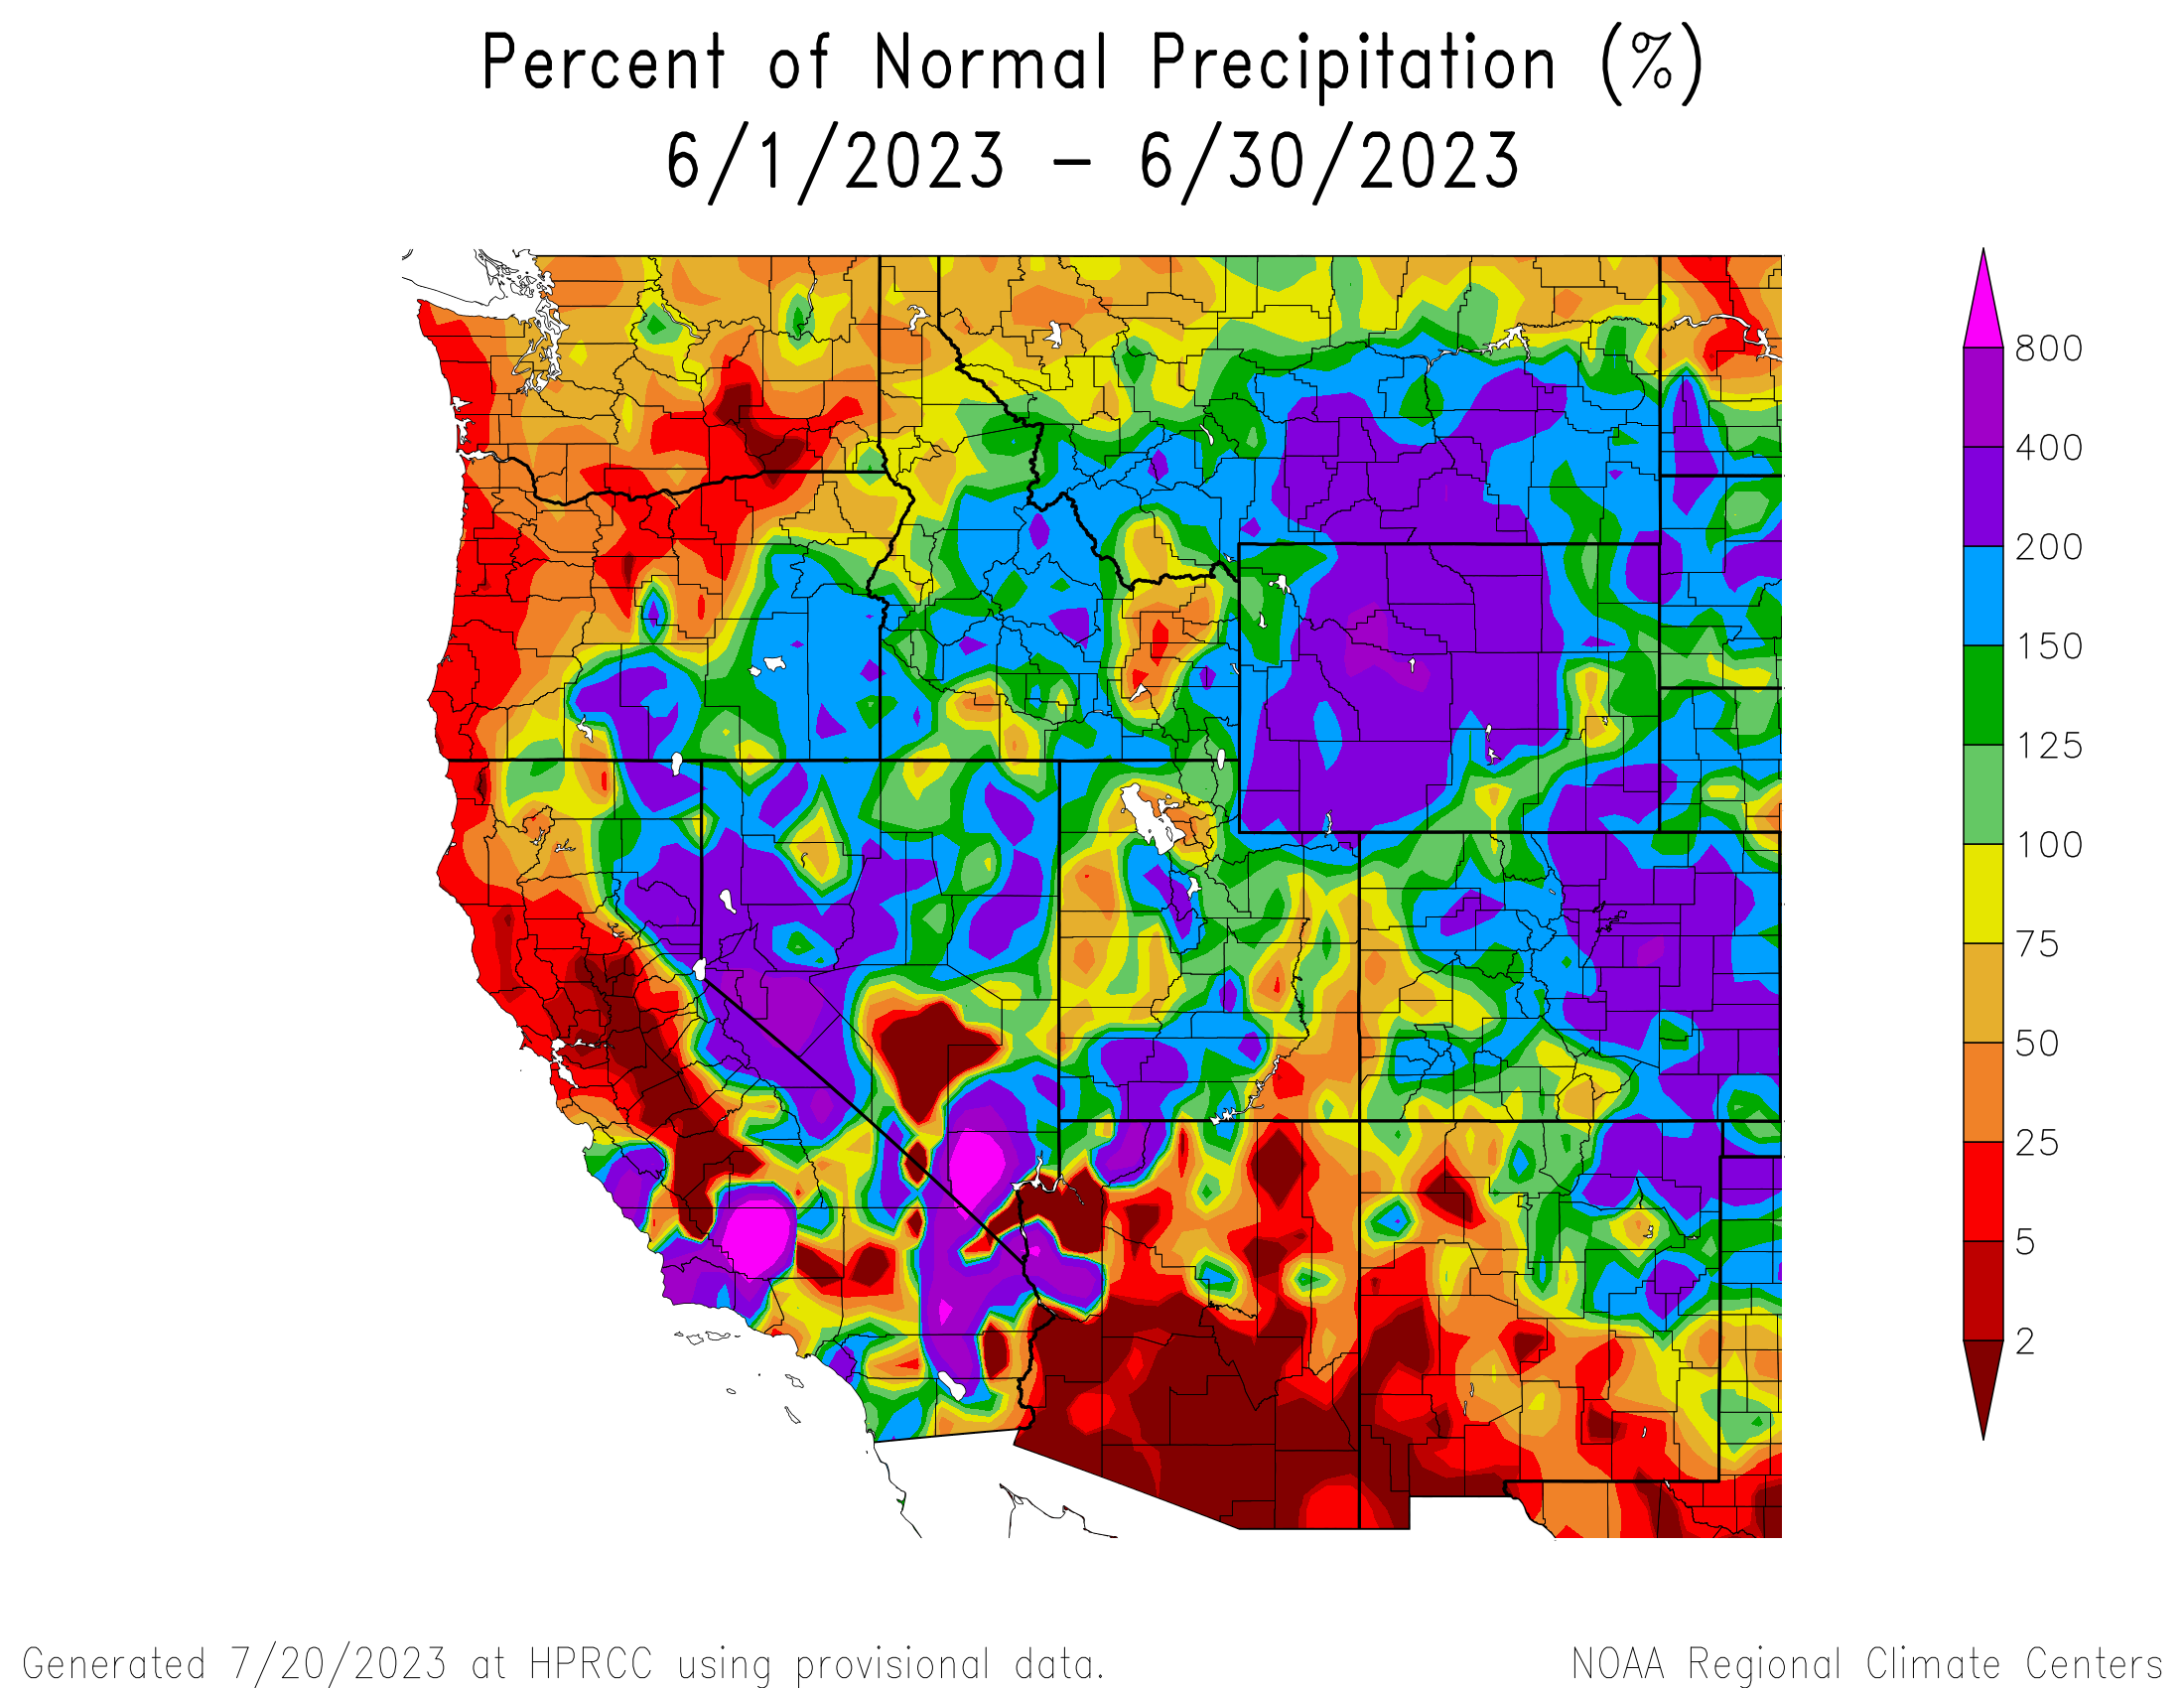
I think most everyone is thinking, ‘wet.’ And they are correct. In eastern Colorado, folks saw 200-400% of normal precipitation, and 400-800% of normal in Arapahoe and Elbert Counties! This was record-setting rainy conditions in these areas (Western Water Assessment). Southwestern Colorado was largely left out of this excitement. This month ranked as Colorado’s 4th wettest month on record, going back to 1872.
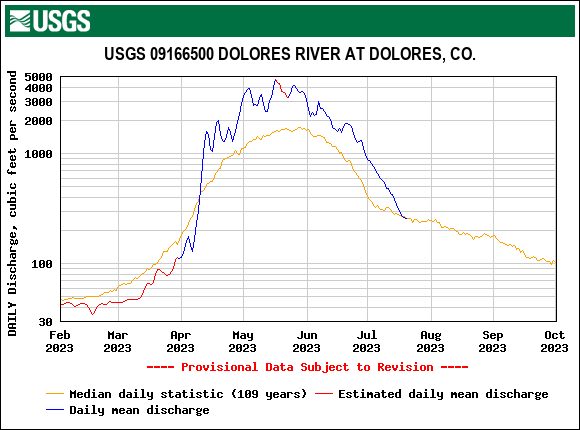
The cloudy and rainy June saw cooler than average temperatures for many parts of the state, mostly the central and southeastern areas, and some pockets had very cold temperatures, especially cooler than normal during the daytime. Snow mostly melted out at SNOTEL stations across the state but is lingering at the higher elevations – plenty of time left to go post-holing. So far it’s looking like snow has melted out, on average, about four days later than normal. The rain, later snowmelt, and normal to above-normal streamflow has boosted the state completely out of drought by the end of June. Notably, Colorado boaters also saw a runnable Dolores River and it peaked at above 4000 CFS. With El Nino brewing, it is likely things will heat up and dry out as the summer progresses.
June is typically Swamp Angels driest month, with an 18-year average (2004 - WY 2022) of 1.2” of precipitation. This June saw 1.85”of precipitation, and, due to an early June winter storm, Senator Beck saw a bump in snow depth of about two and a half inches over the nine-hour storm. Daytime average temp for the month of June was about 45 °F.
July Weather Summary:
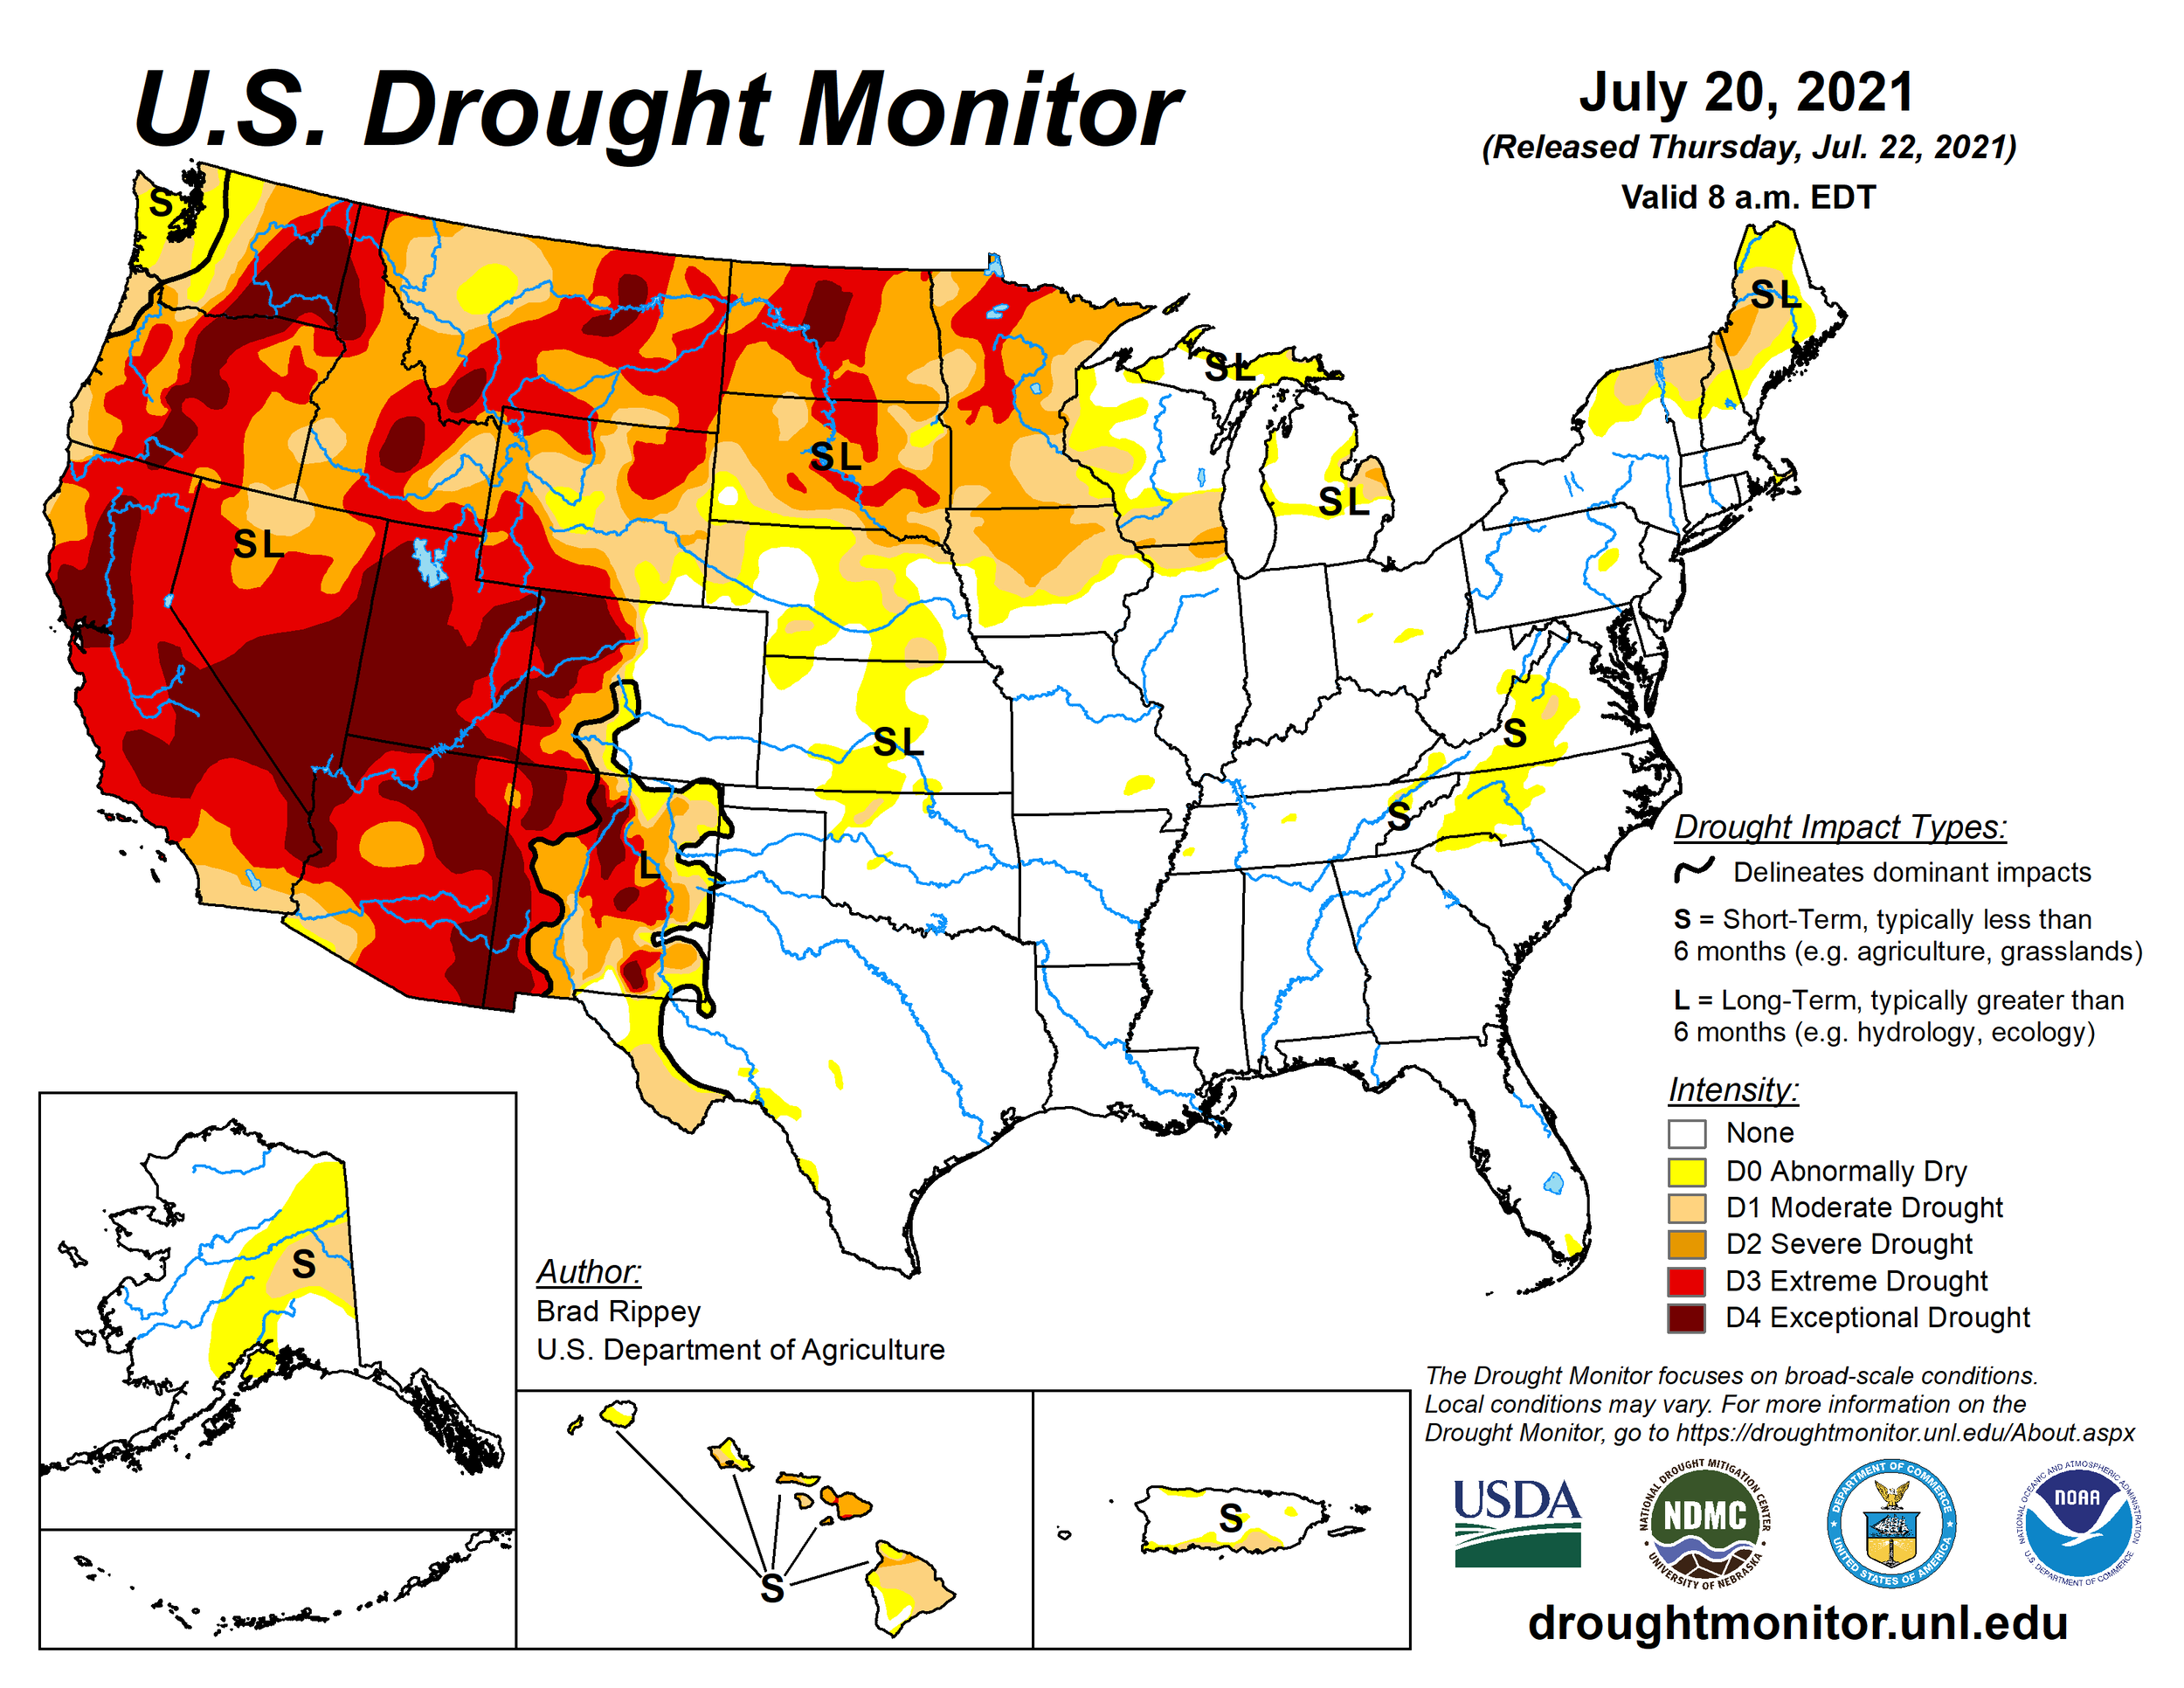
It seems that July split Colorado in half. Western/Southwestern Colorado took a hit in precipitation - in some cases it was the driest July on record. Central part of the state also experienced slight above average temperatures for the month, about 2-4 °F above normal. On the flat side, the eastern plains experienced wet conditions and near normal temperatures.
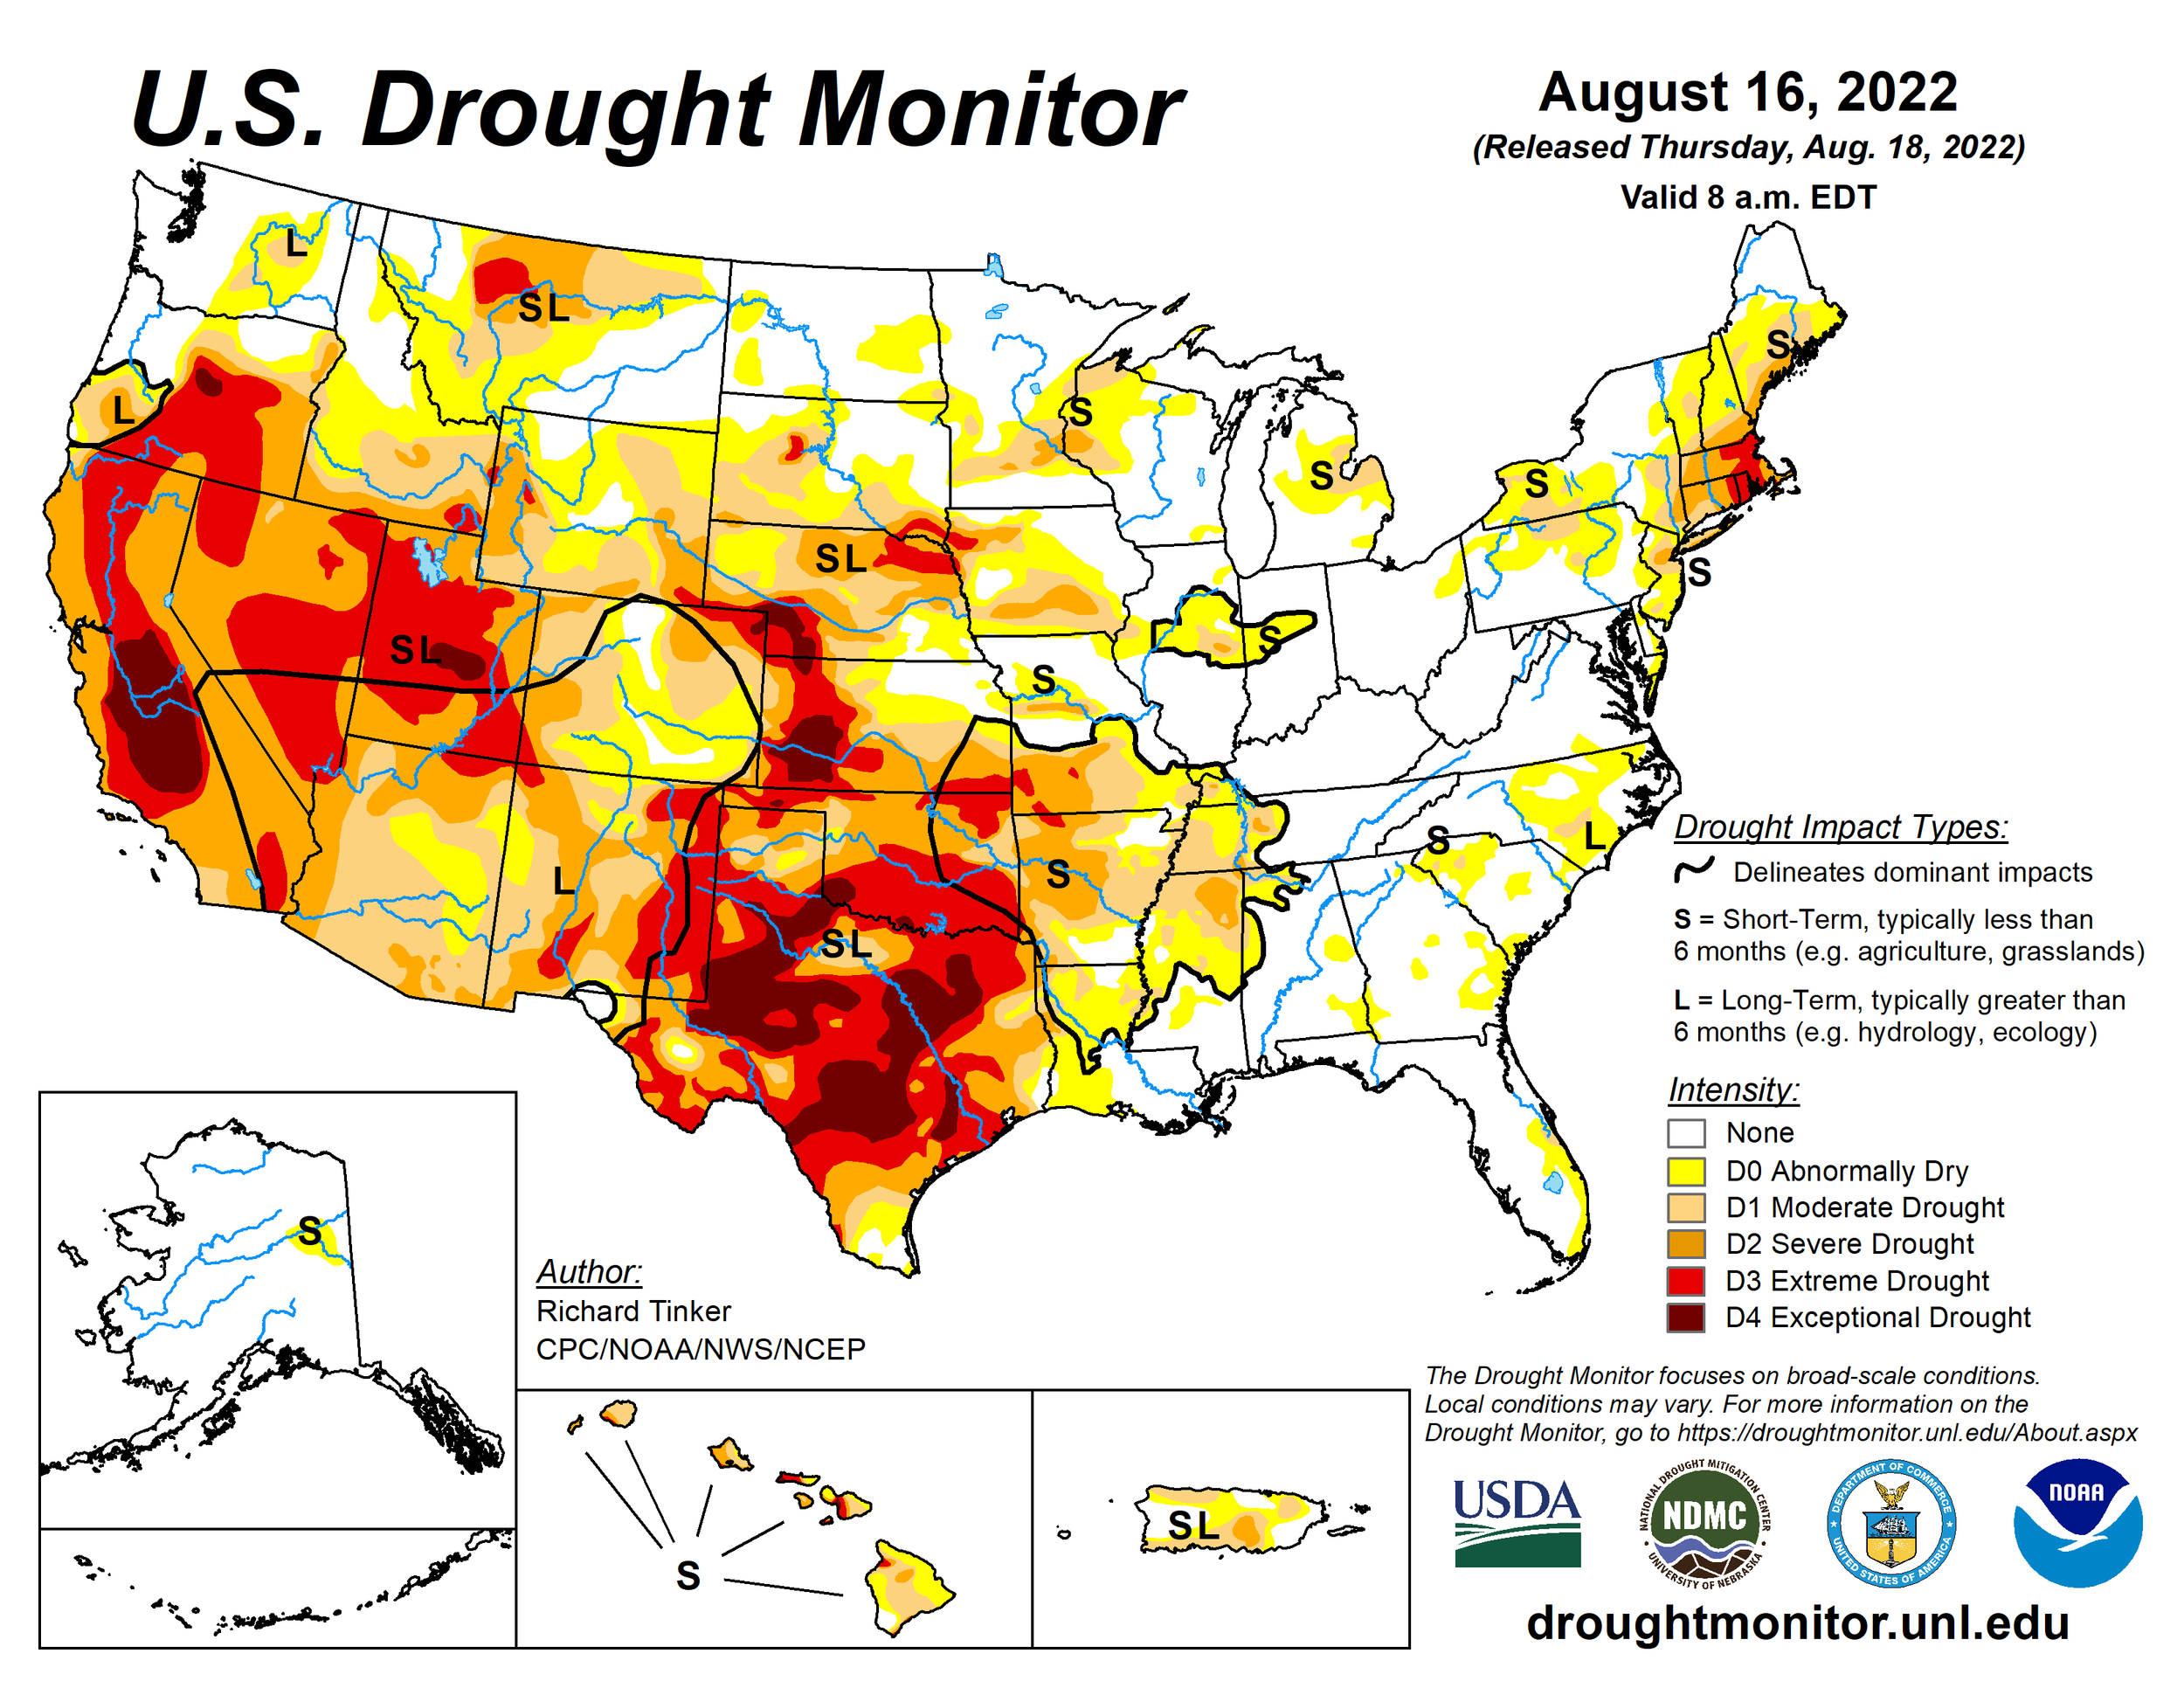
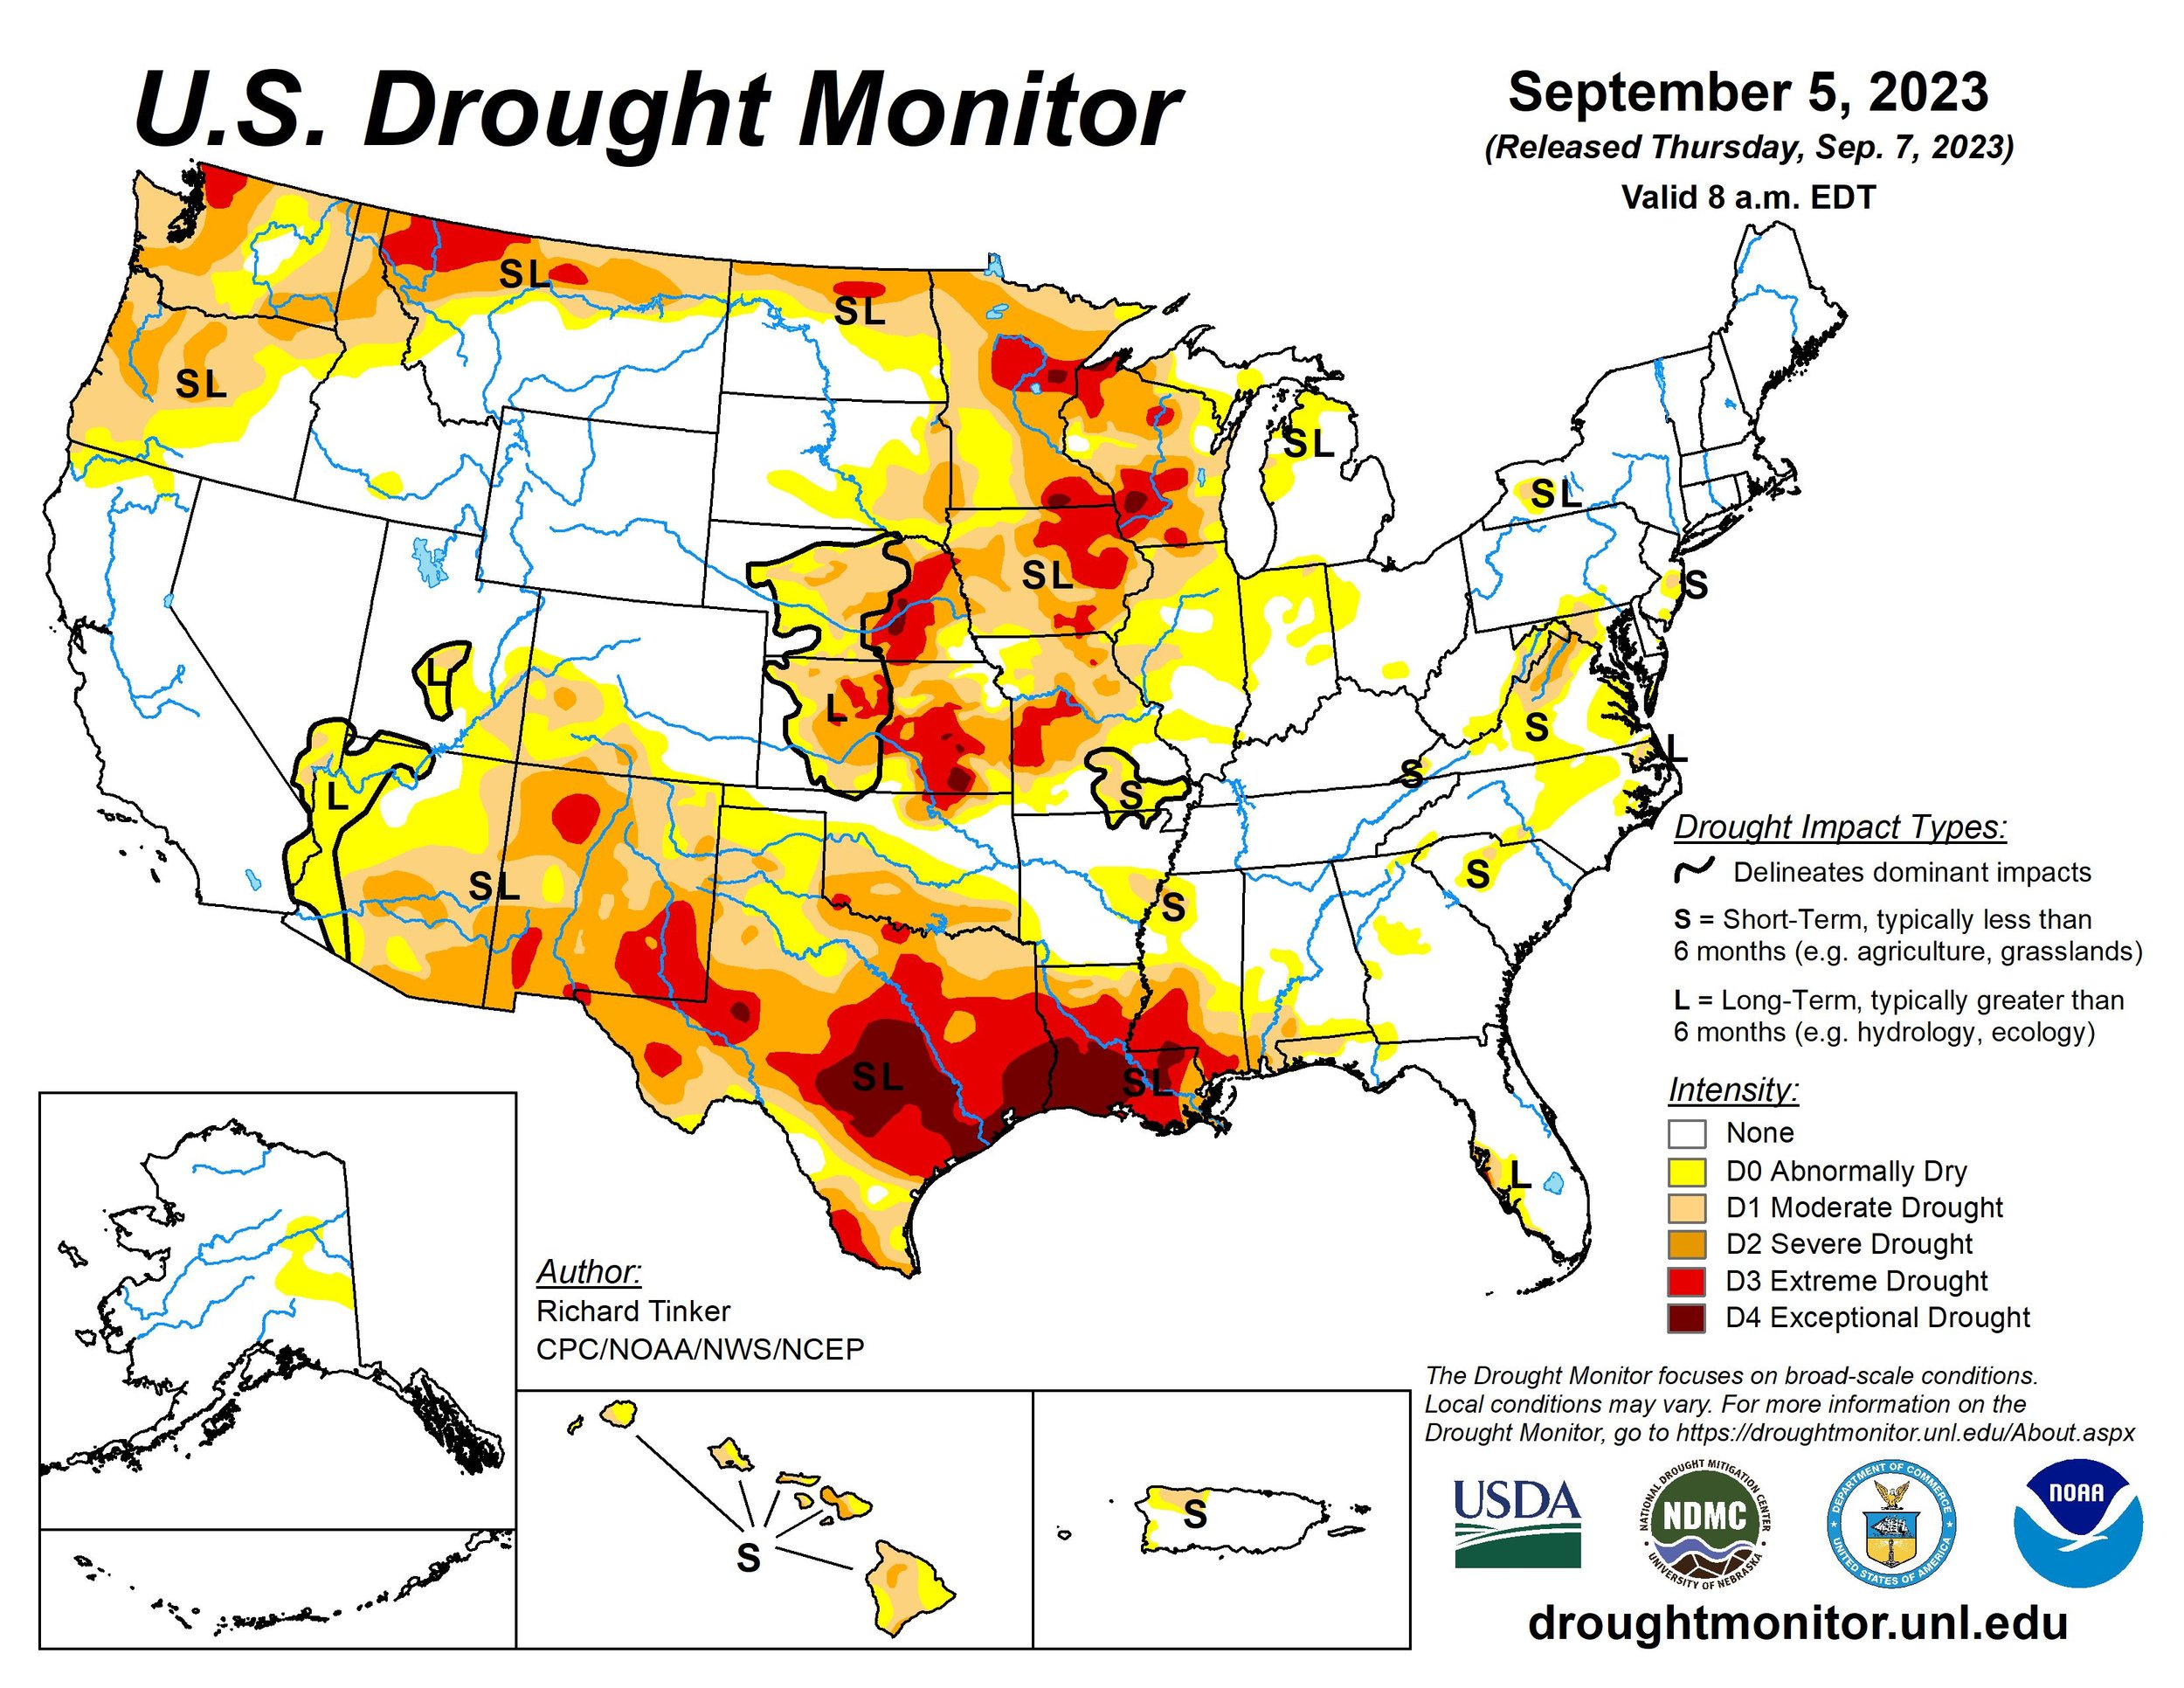
Most rivers feeding out the last of their snowmelt held steady at normal to above-normal flows. However, with the dry conditions and warm temps, Southwestern Colorado once again registered on the drought monitor, in the lowest category. The North American Monsoon may just now be arriving, but its impact this year has been difficult to predict, potentially because of the influence of El Niño, which is still predicted to take us through the winter with above 90% certainty.
In other news, 170% of normal inflow in Lake Powell brought it up to a whopping 40% full.
July daytime average air temperature at SASP was 56 °F, and precipitation ended up to be a trifling 0.79” of rain; the 18-year average (2004-2021) is 3.59”, and last July brought 4.88” of precipitation.
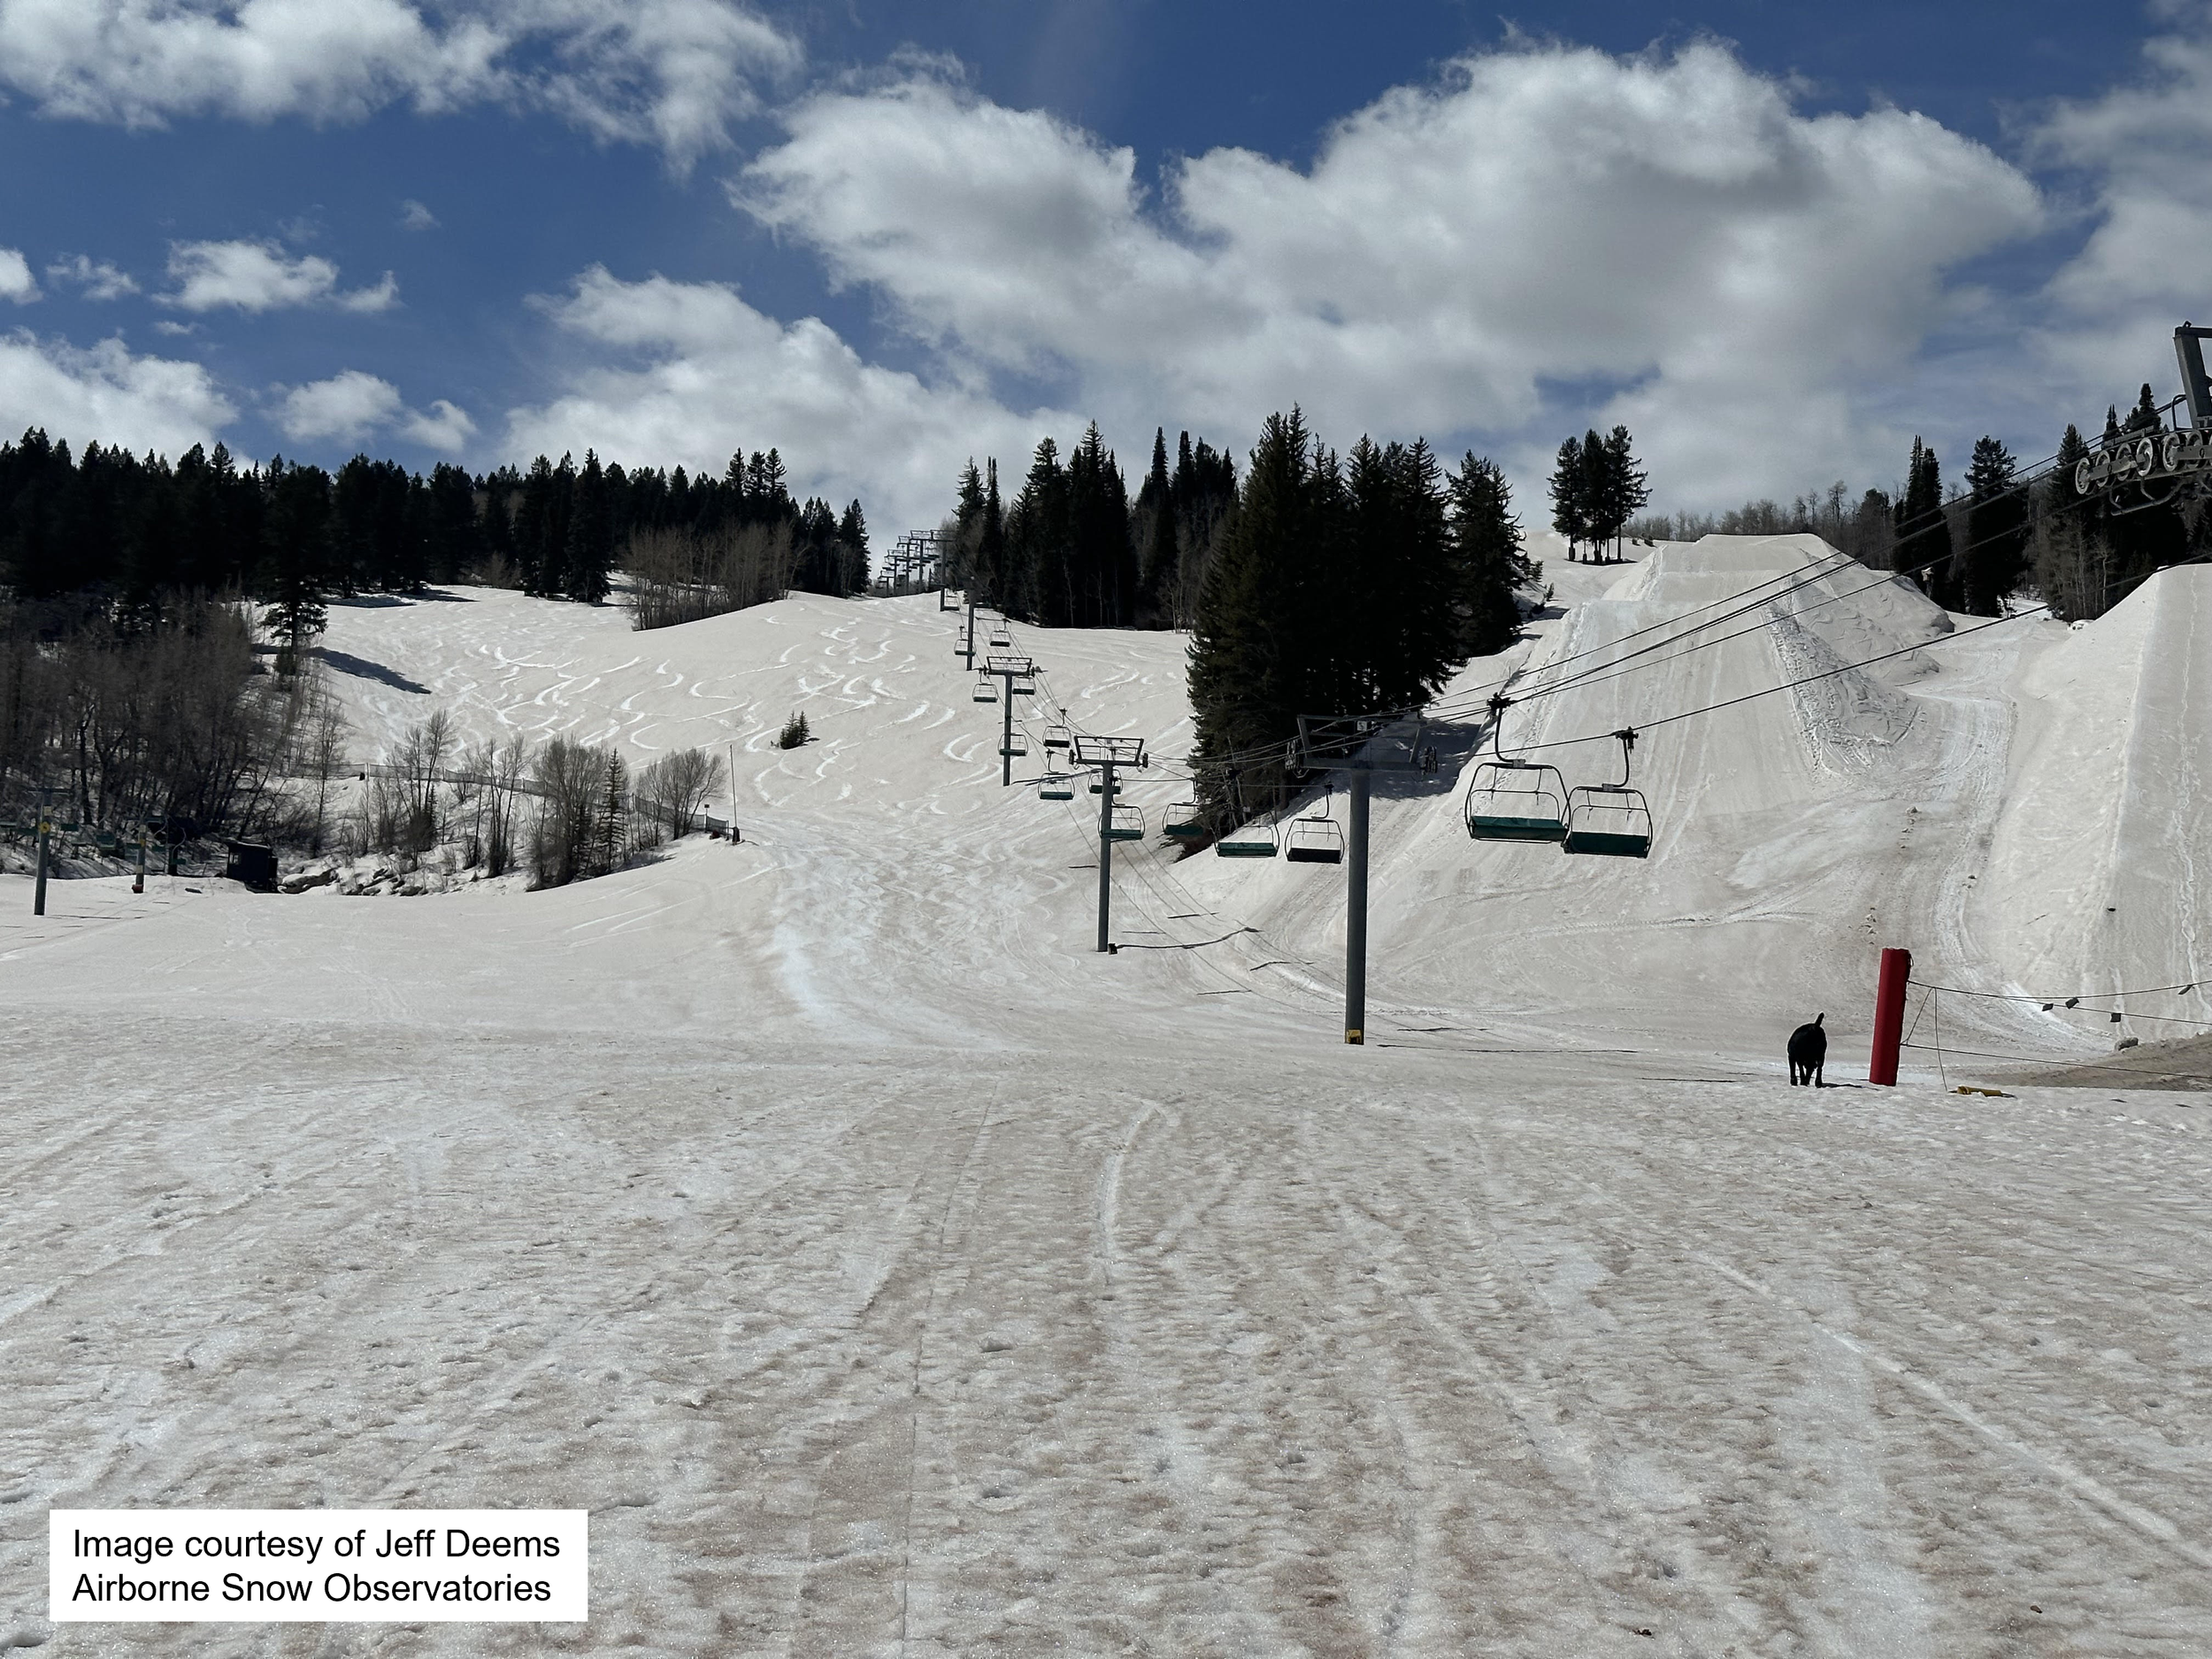
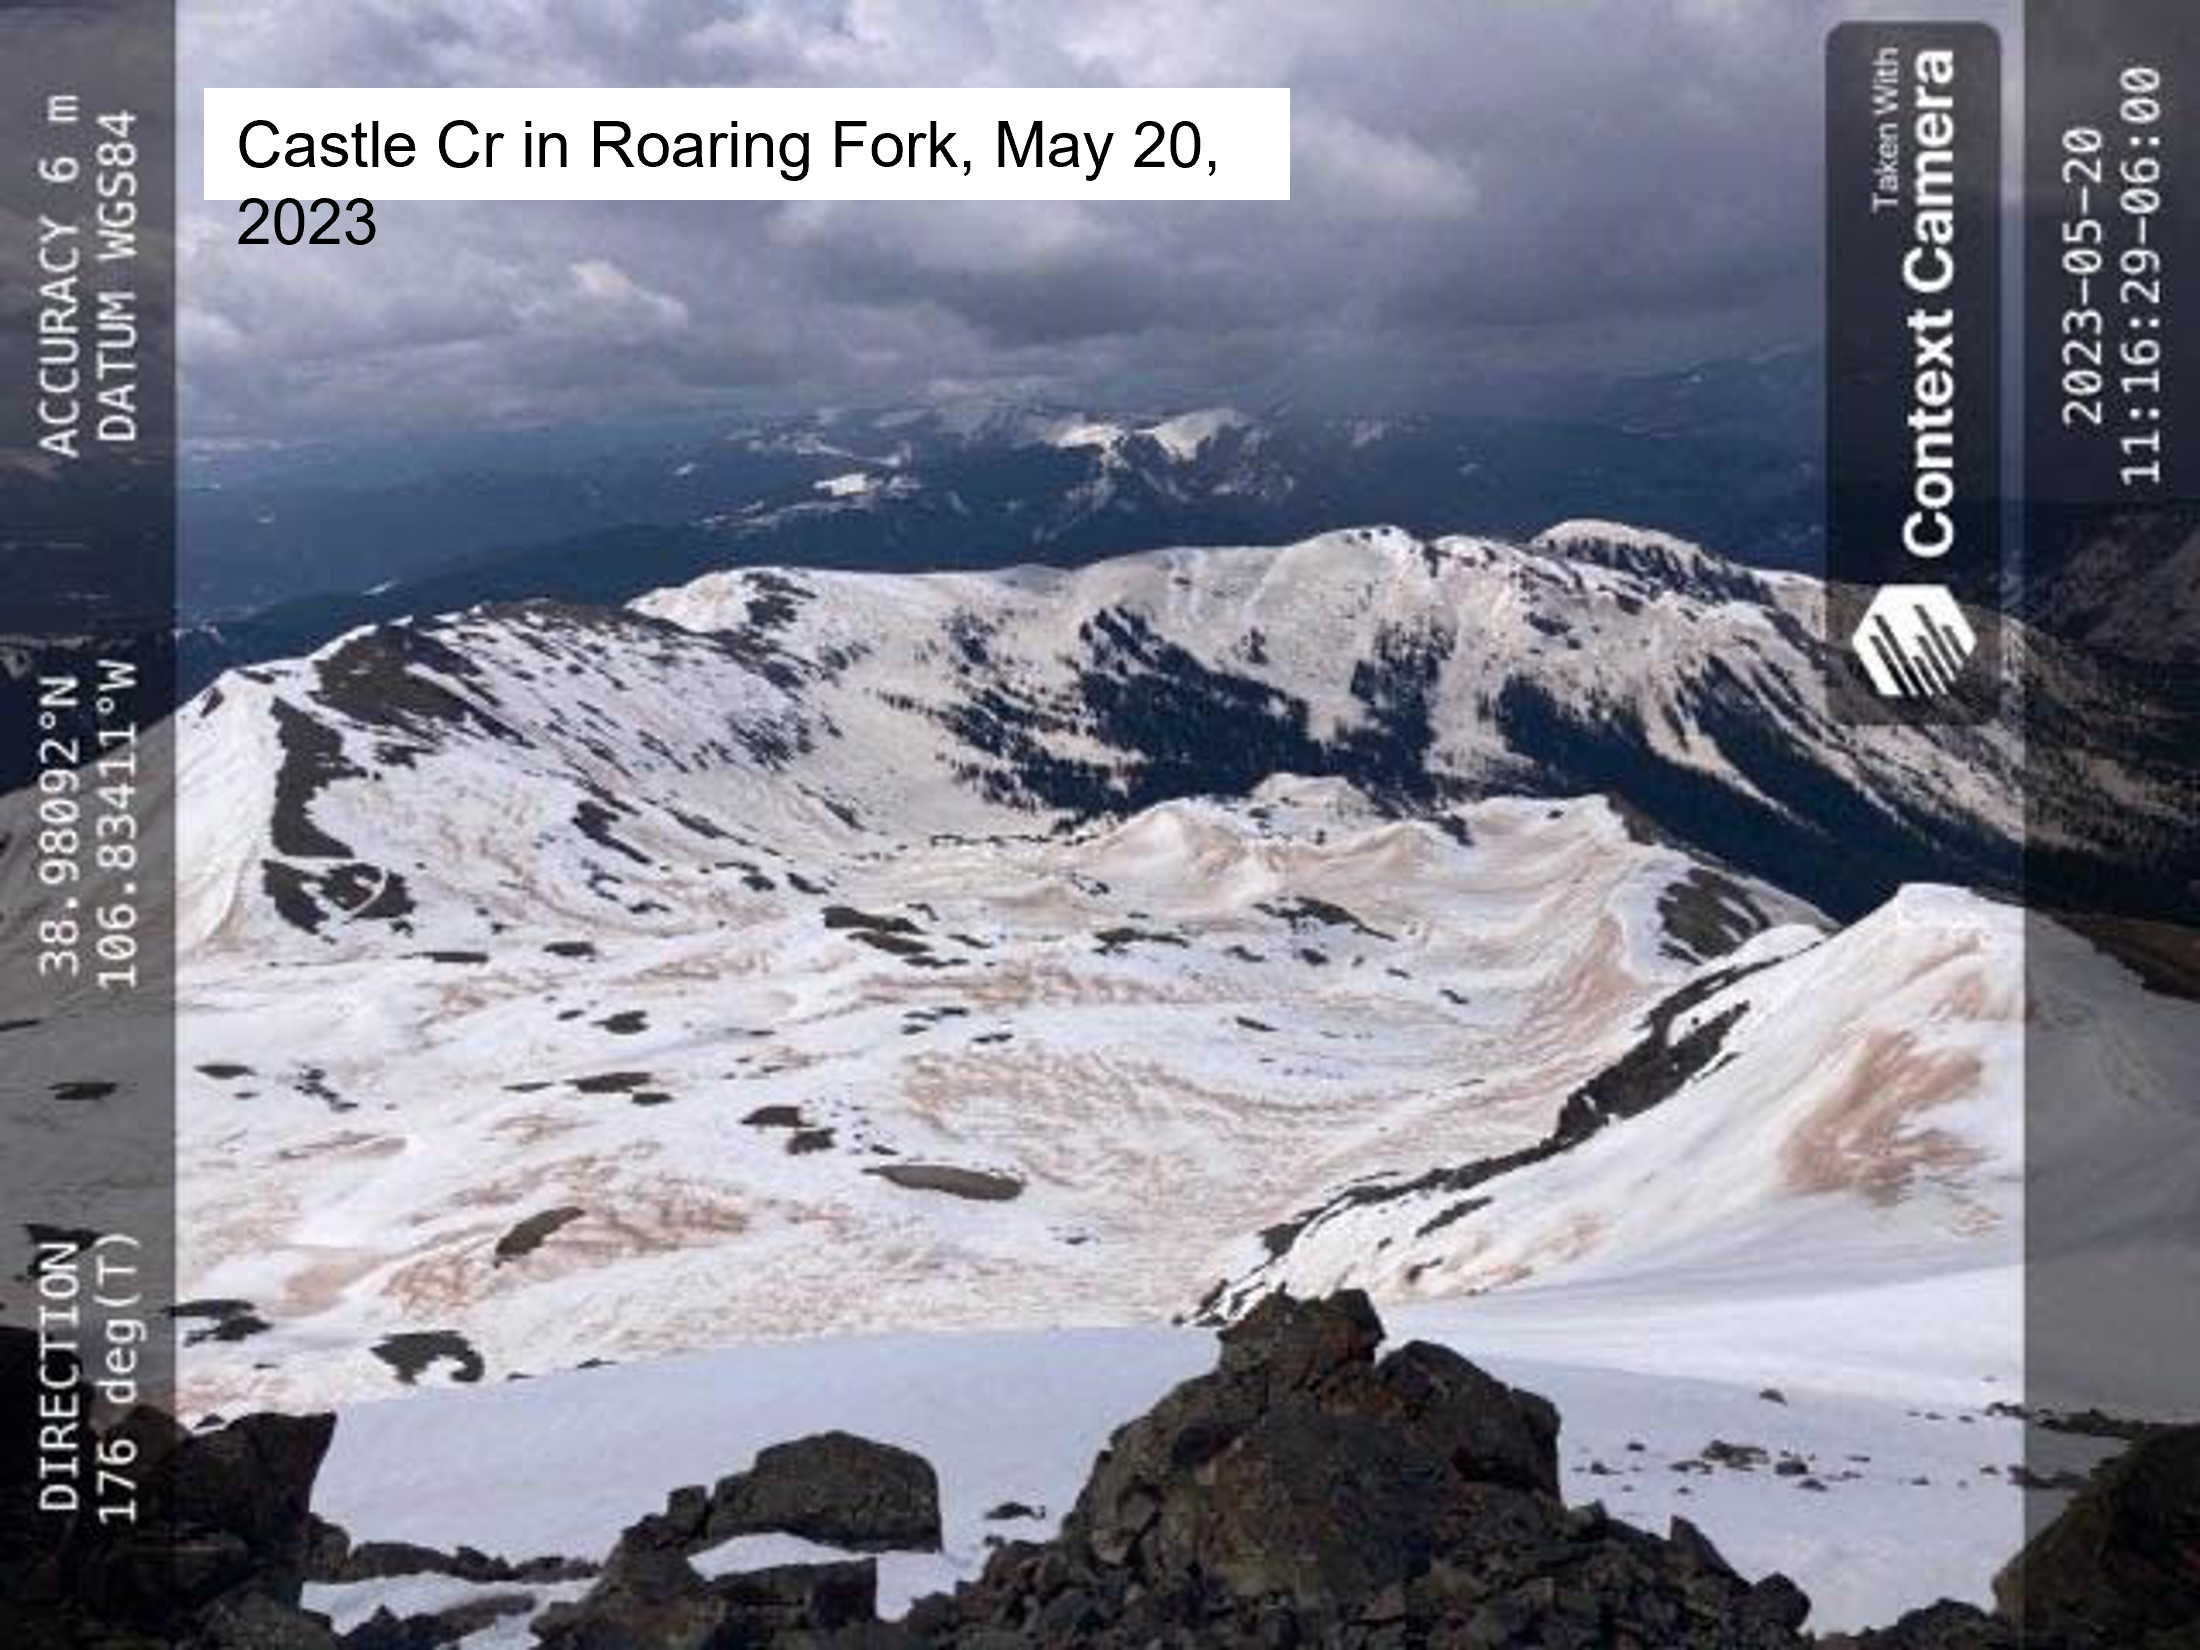
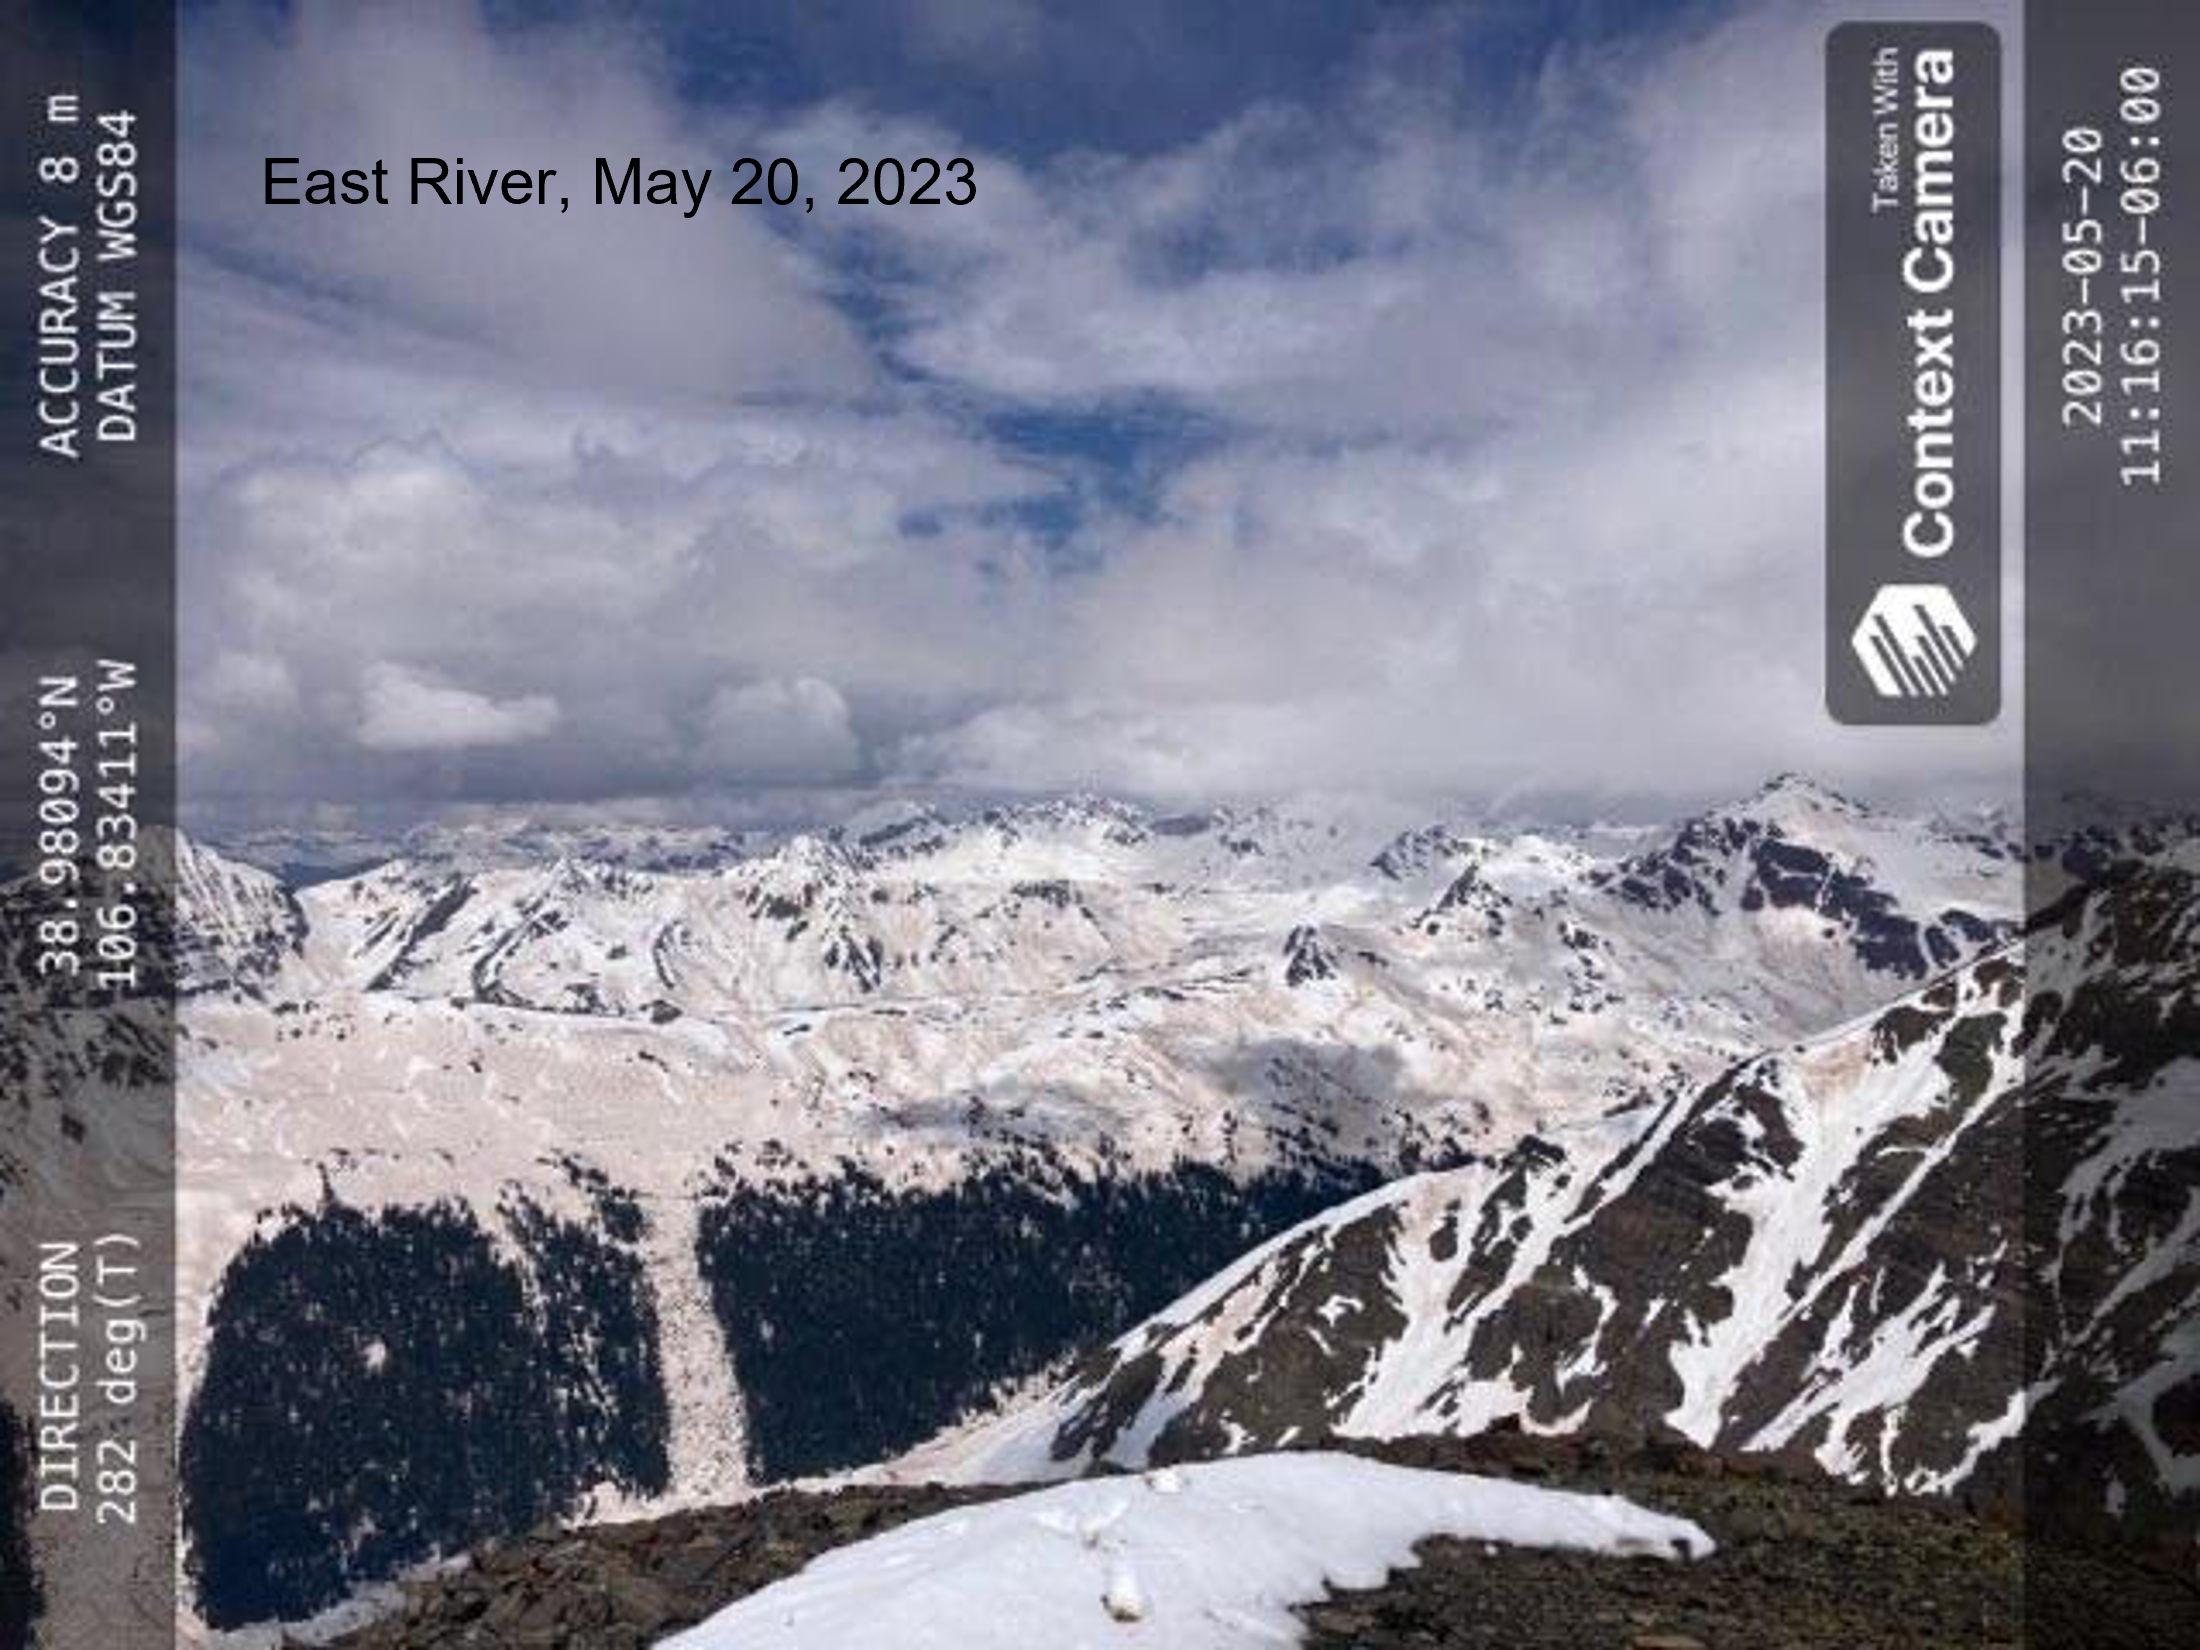
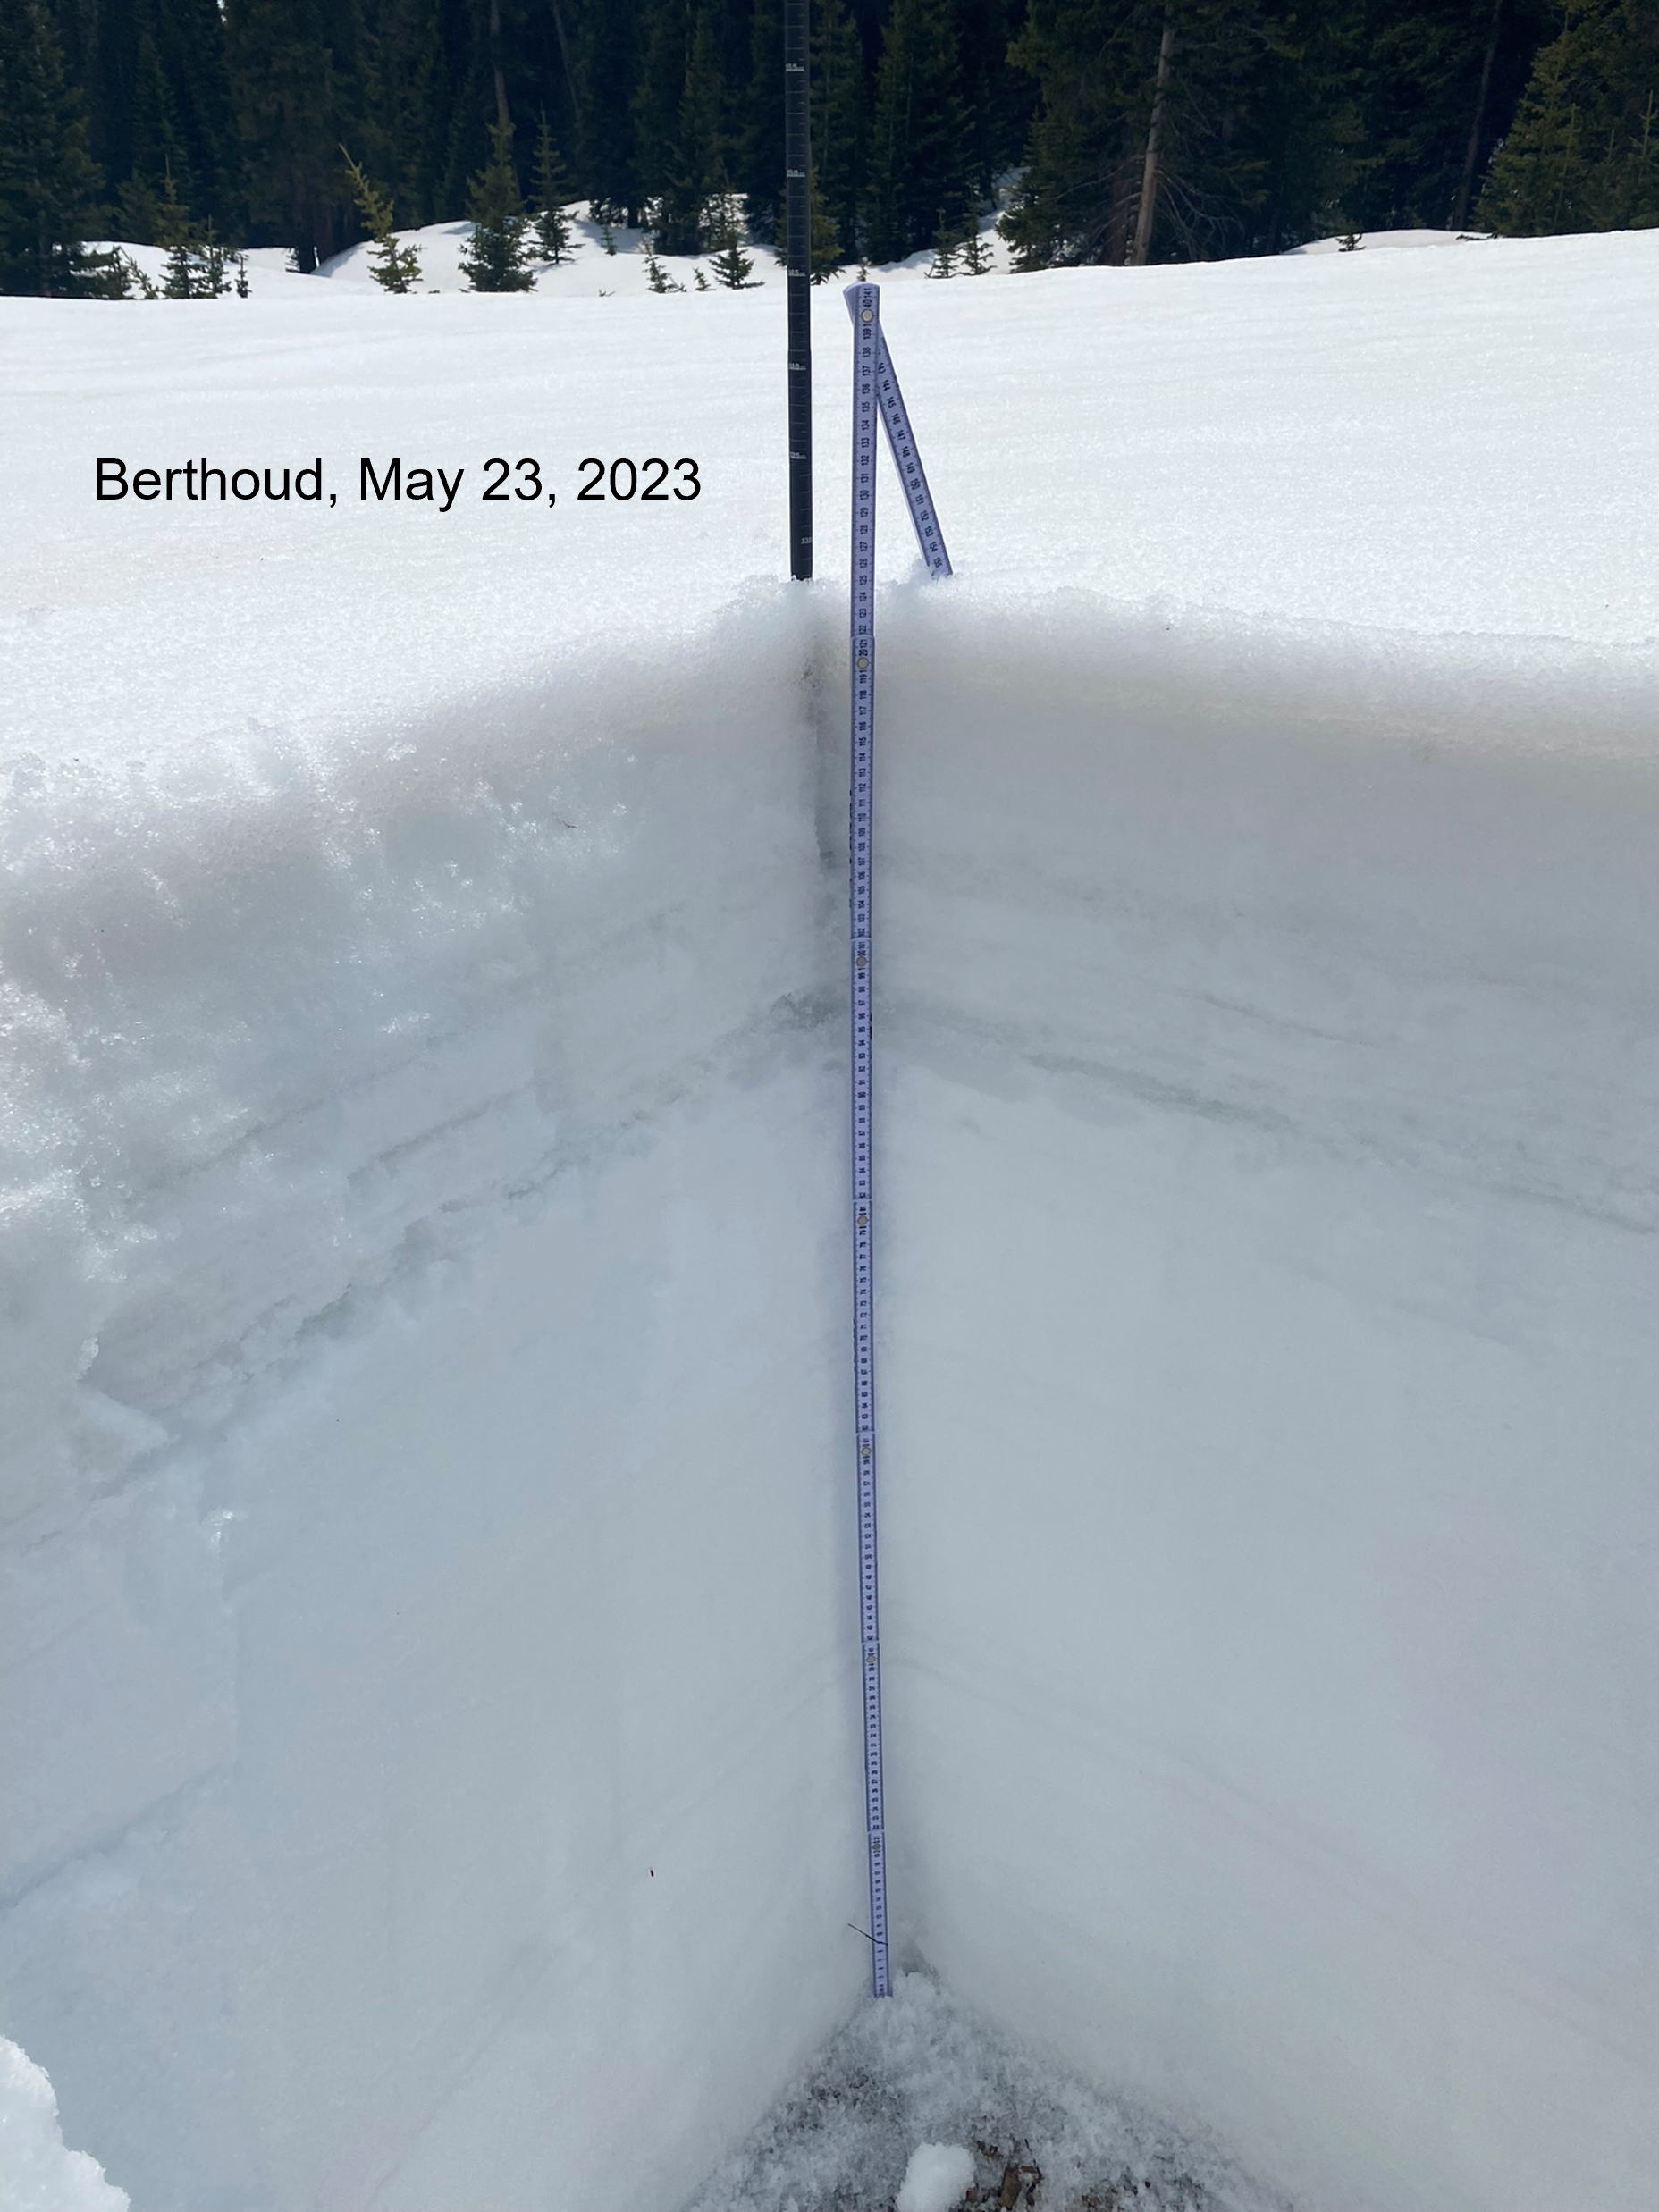
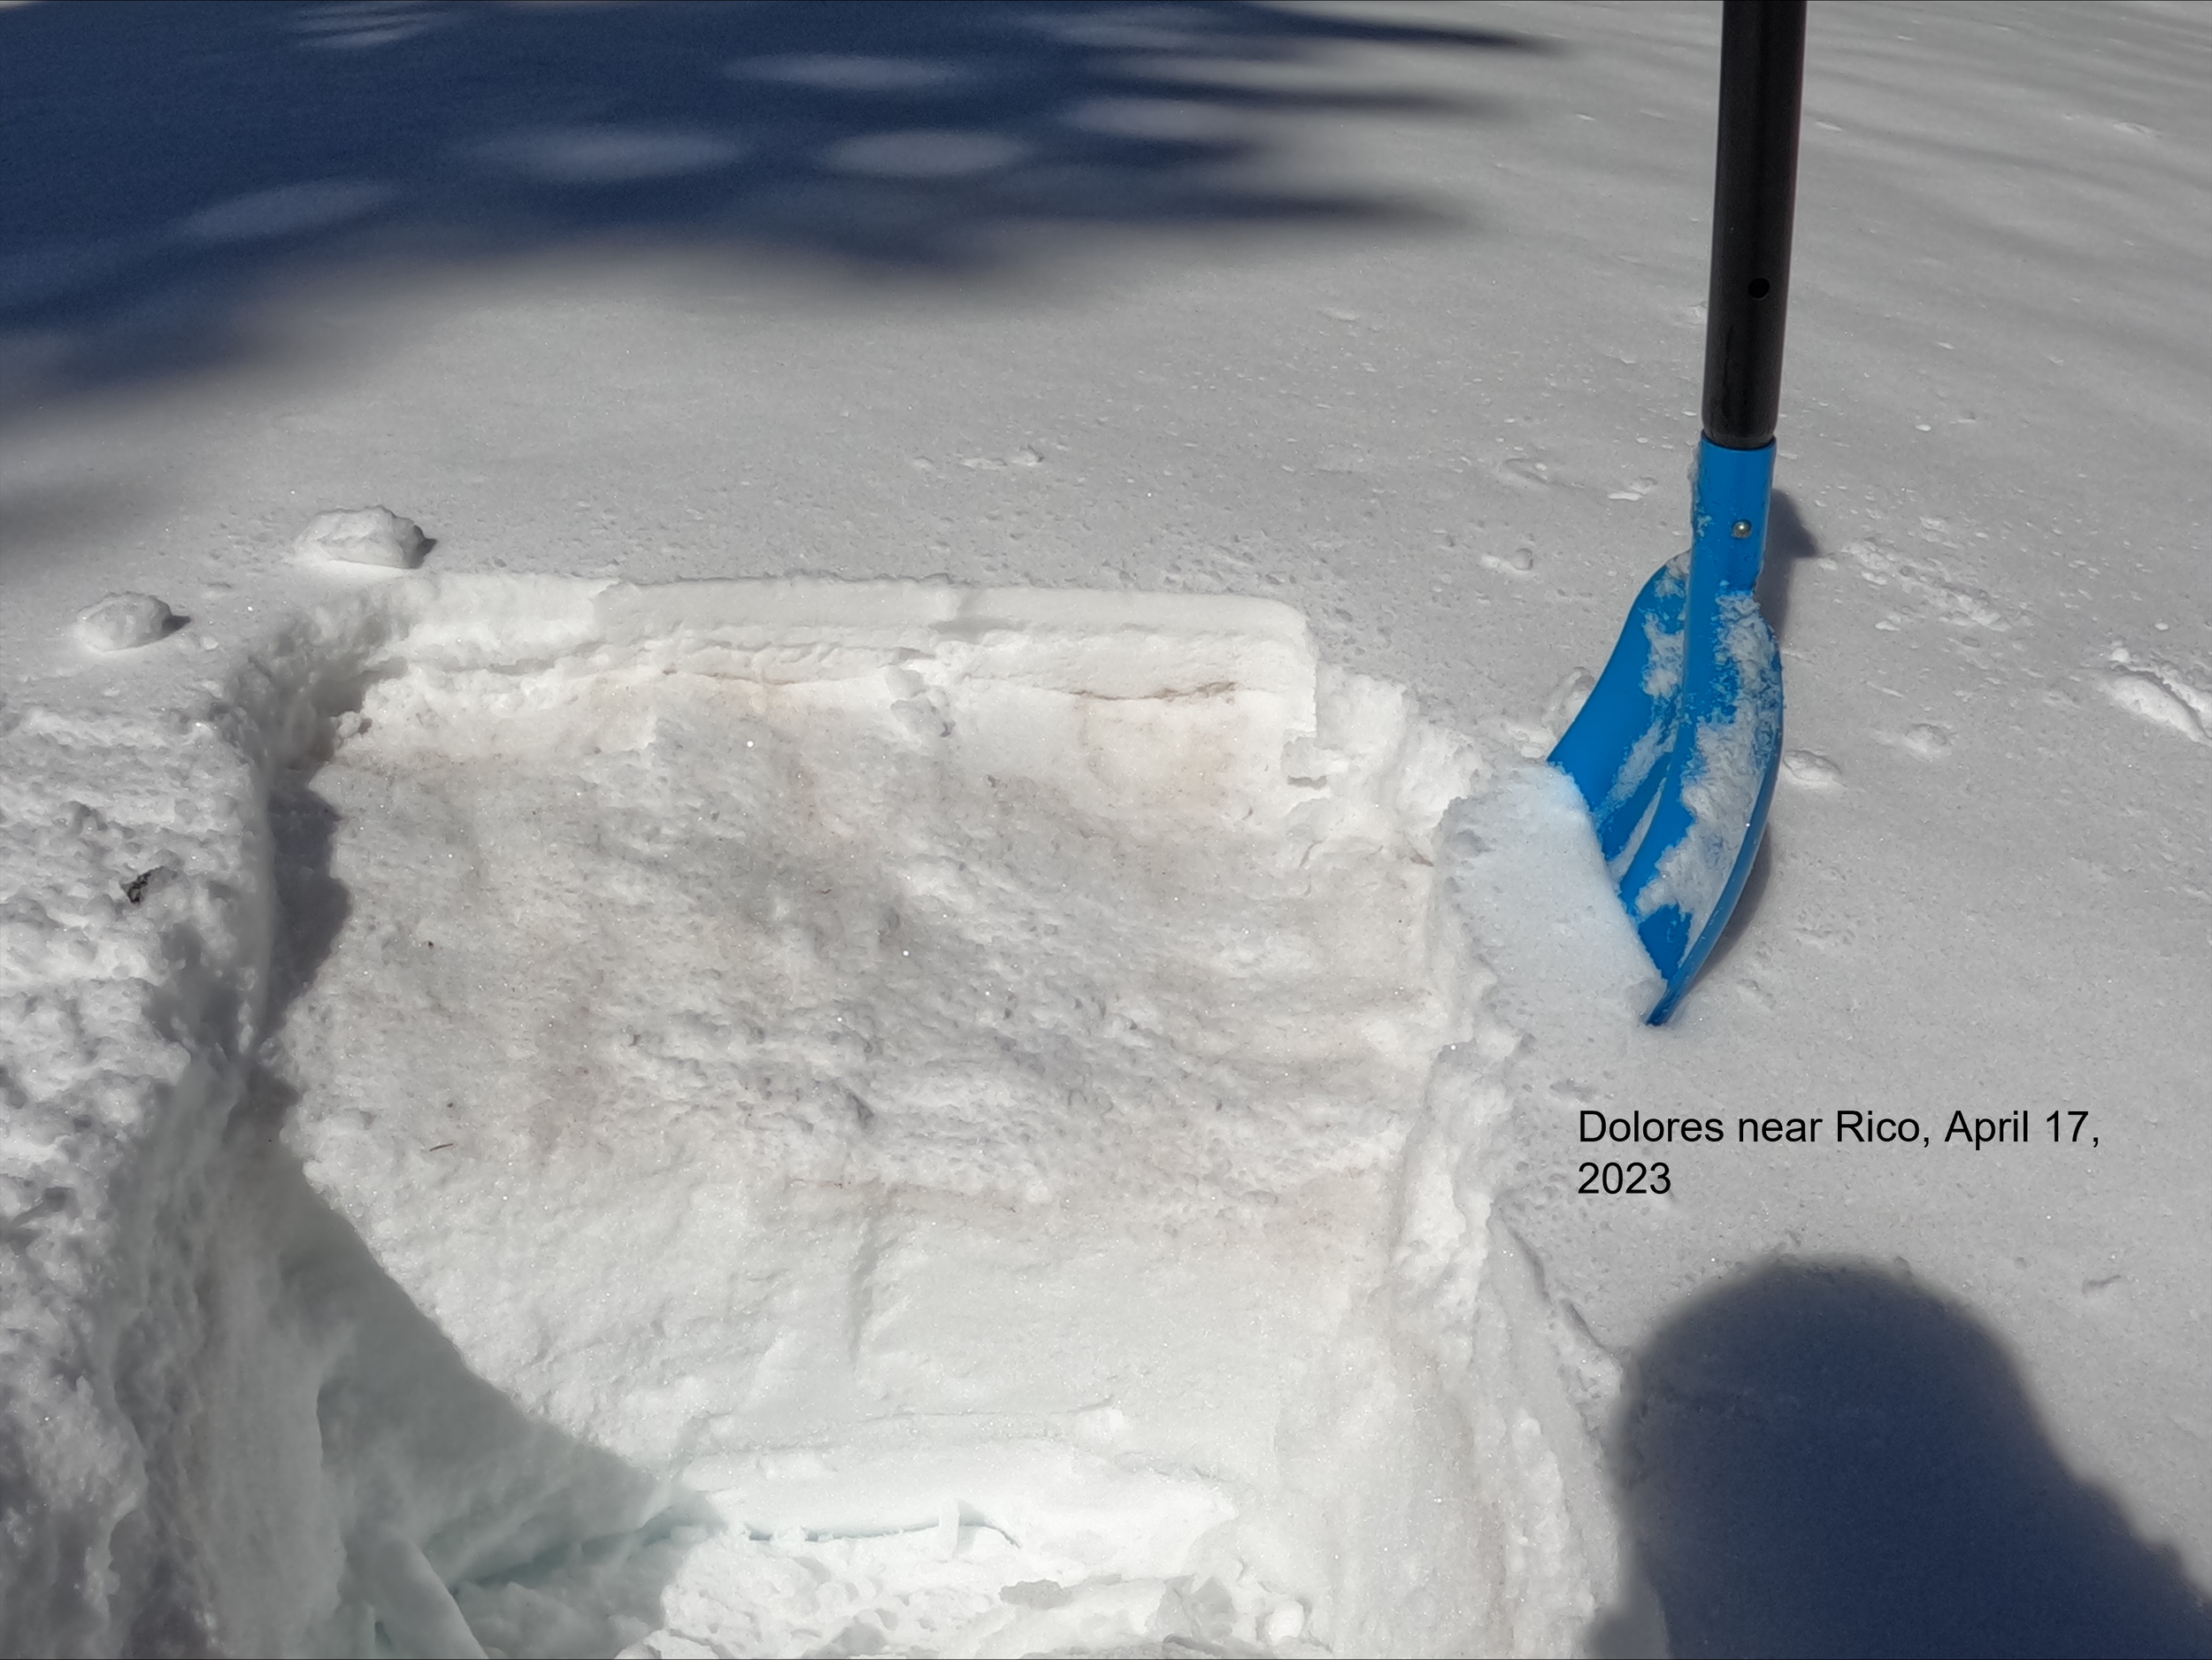
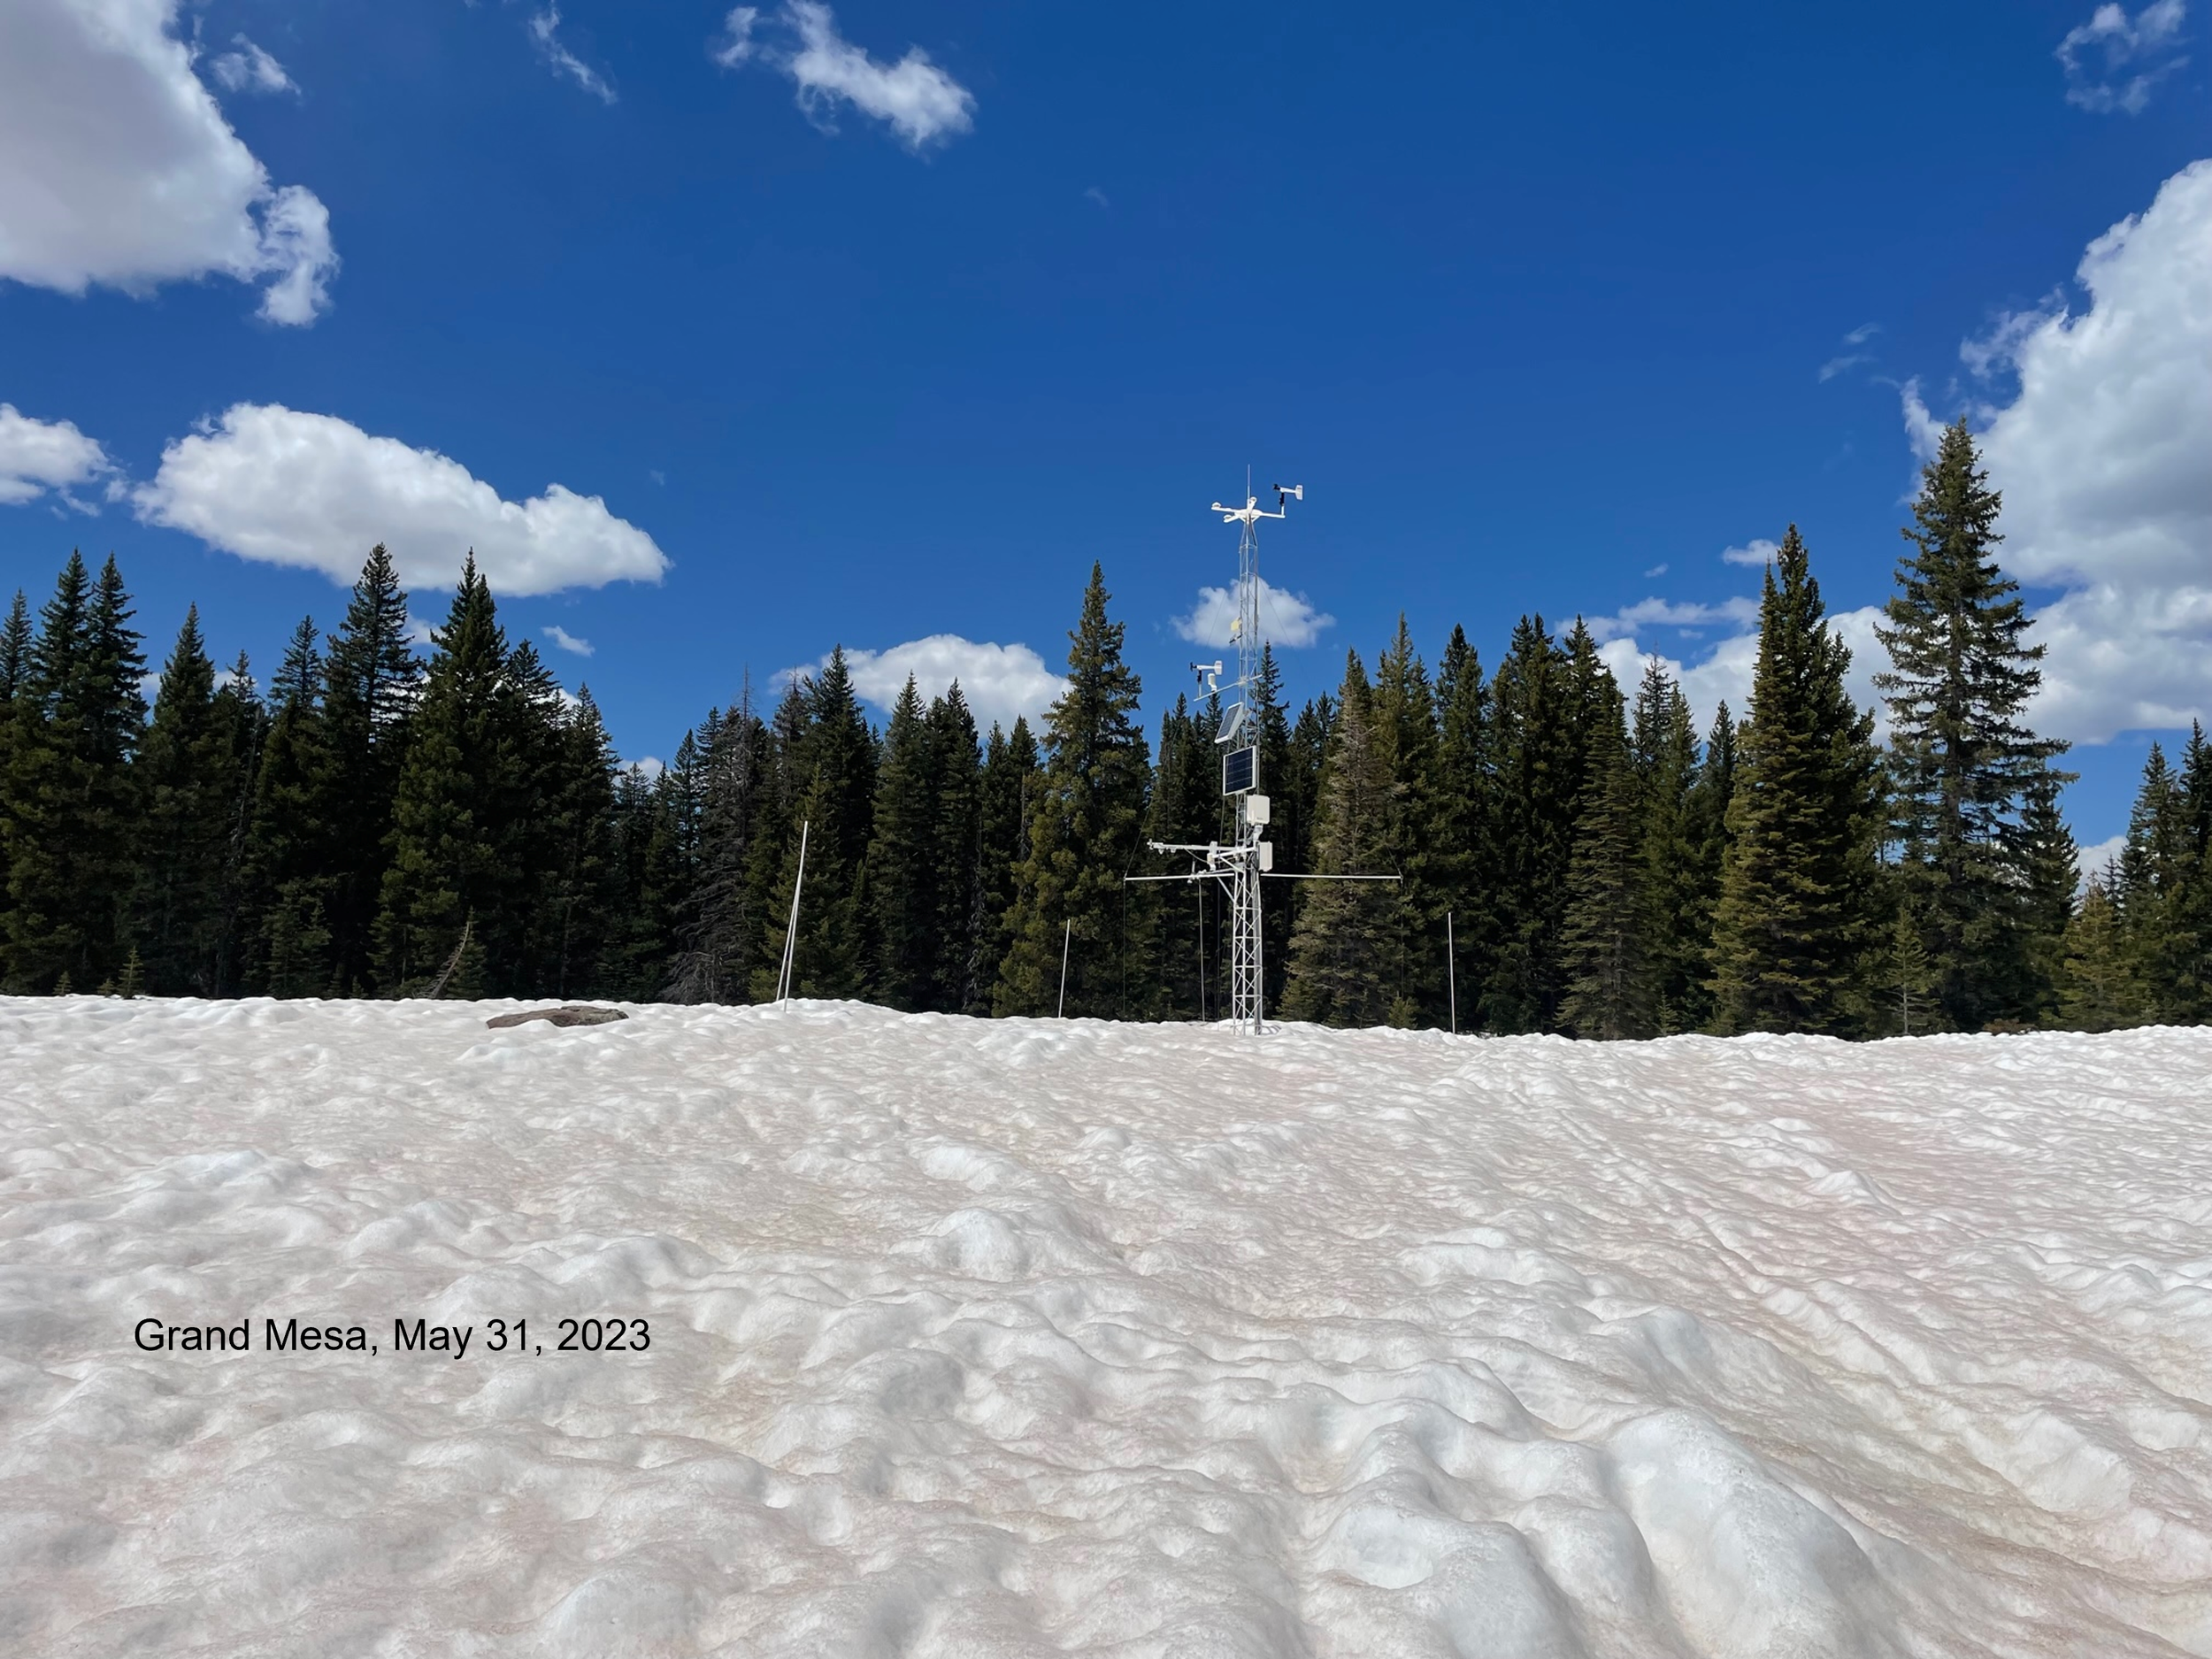
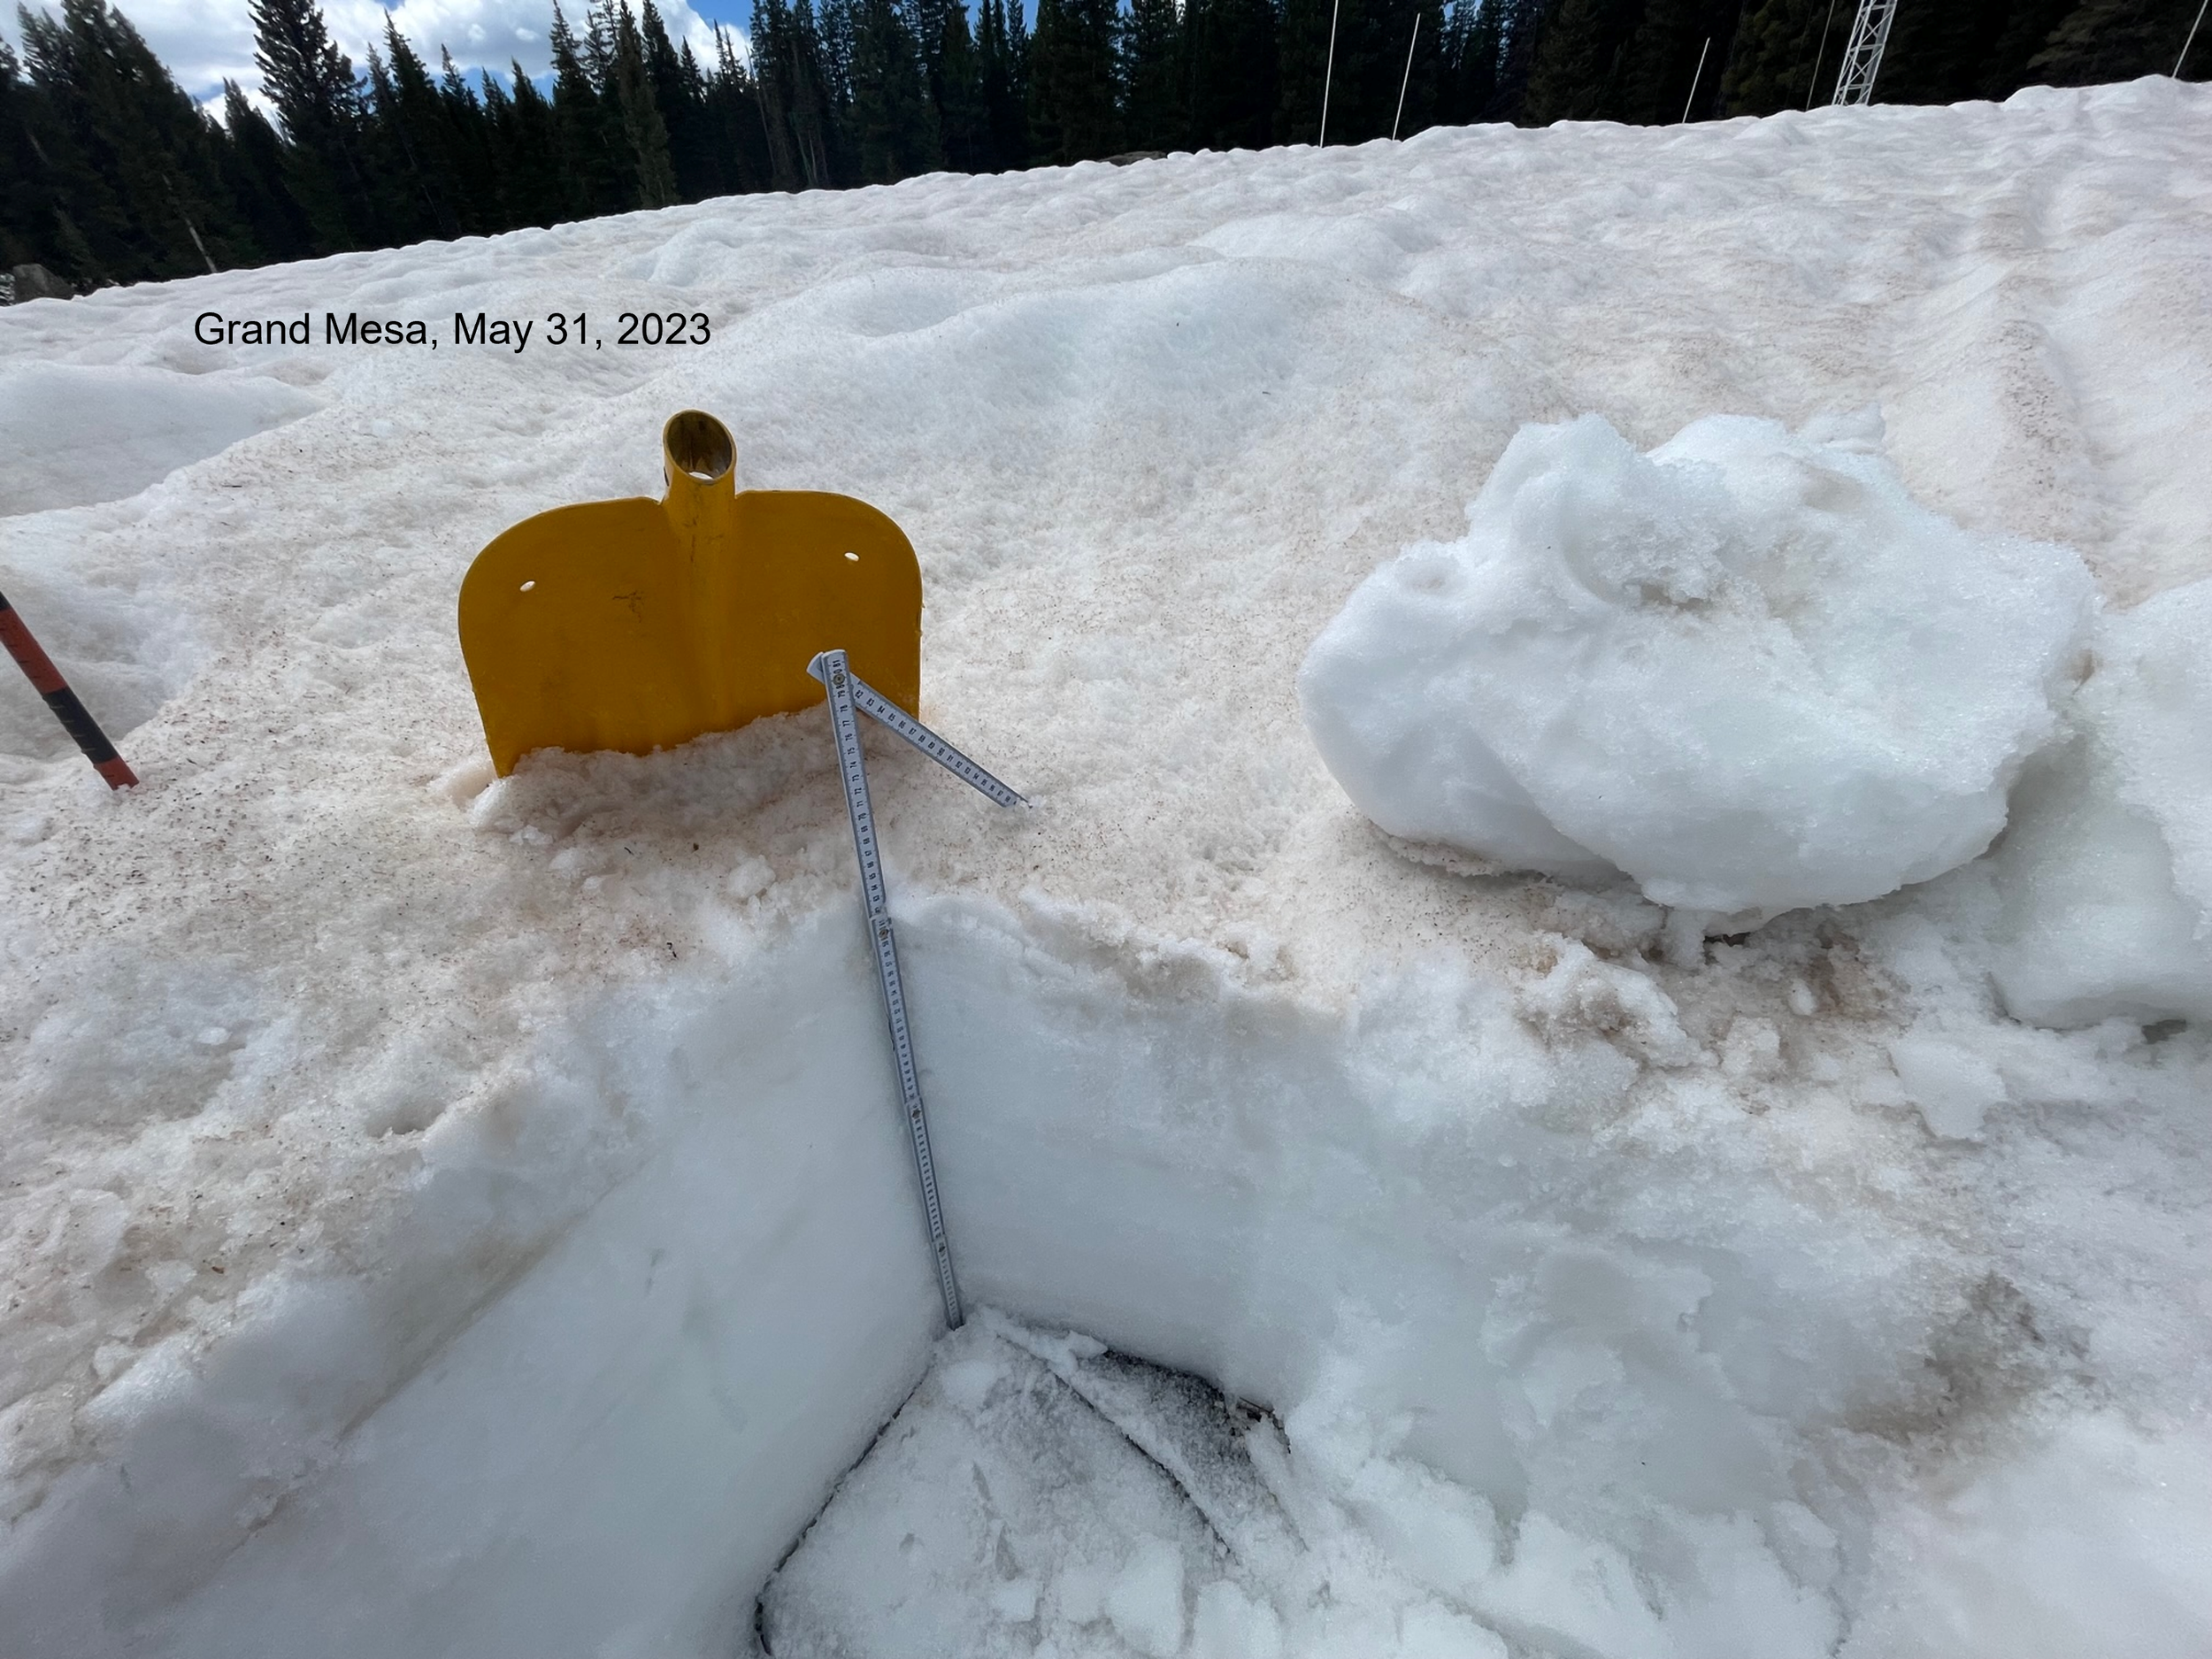
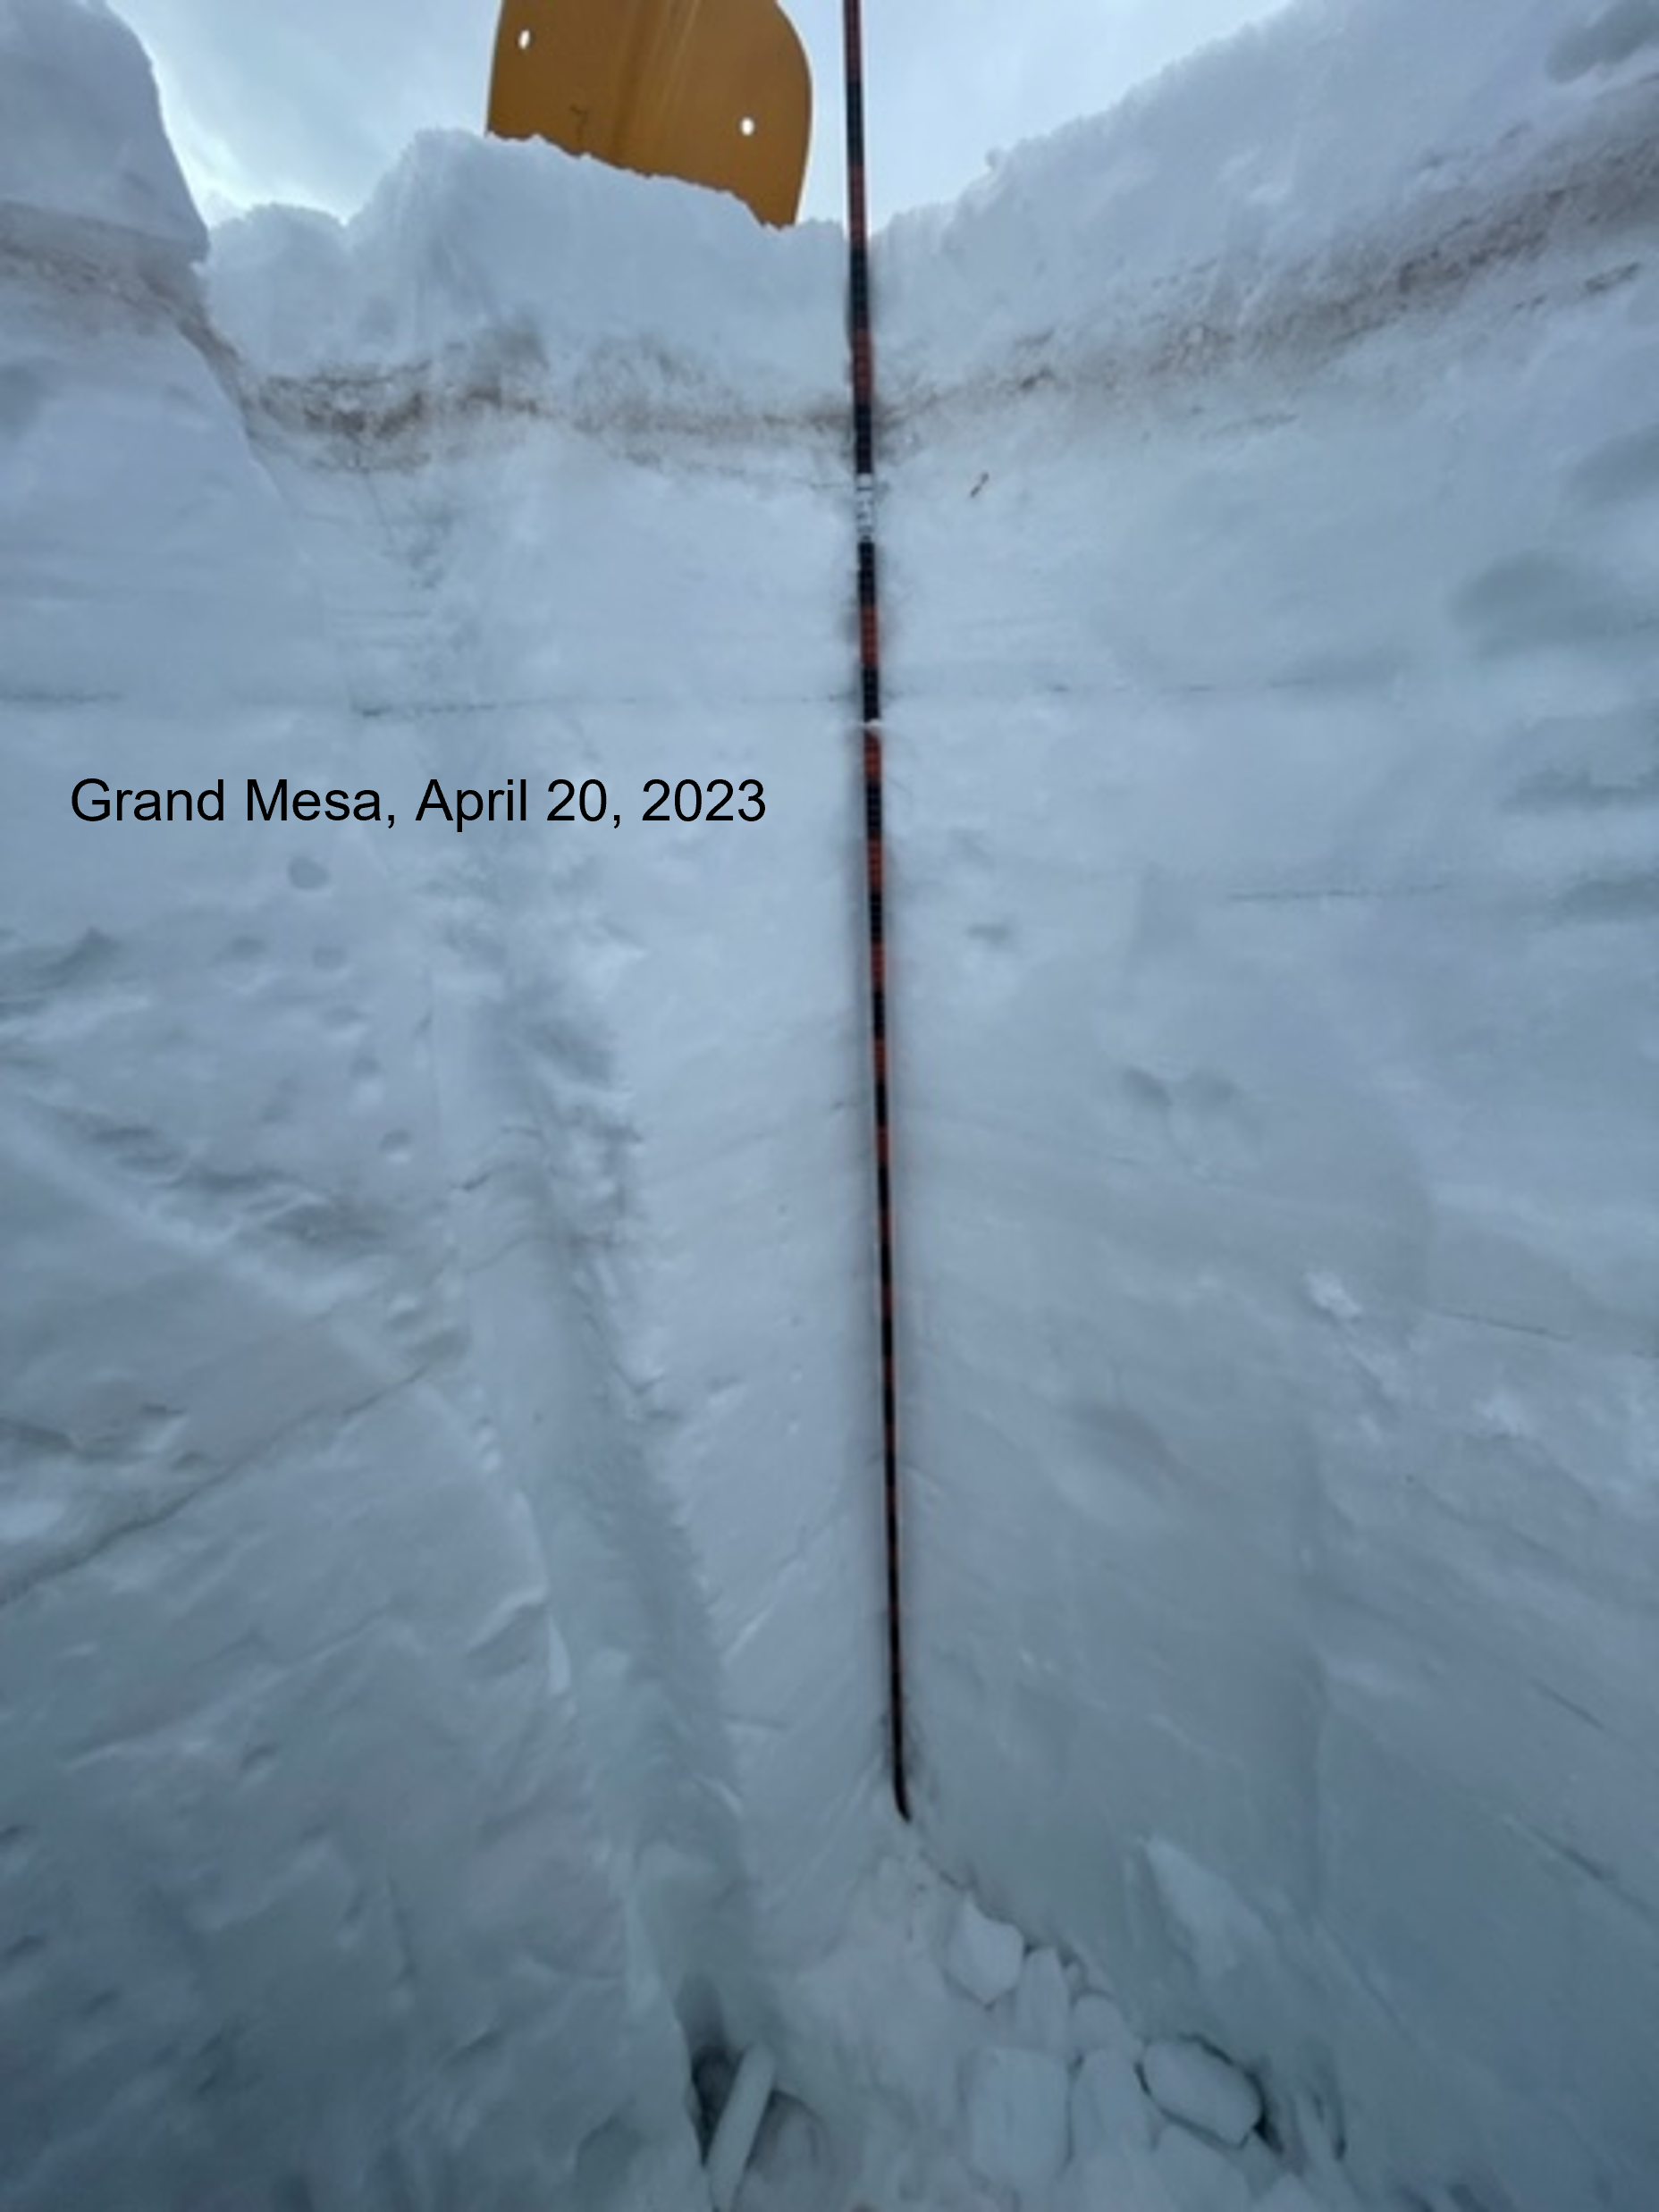
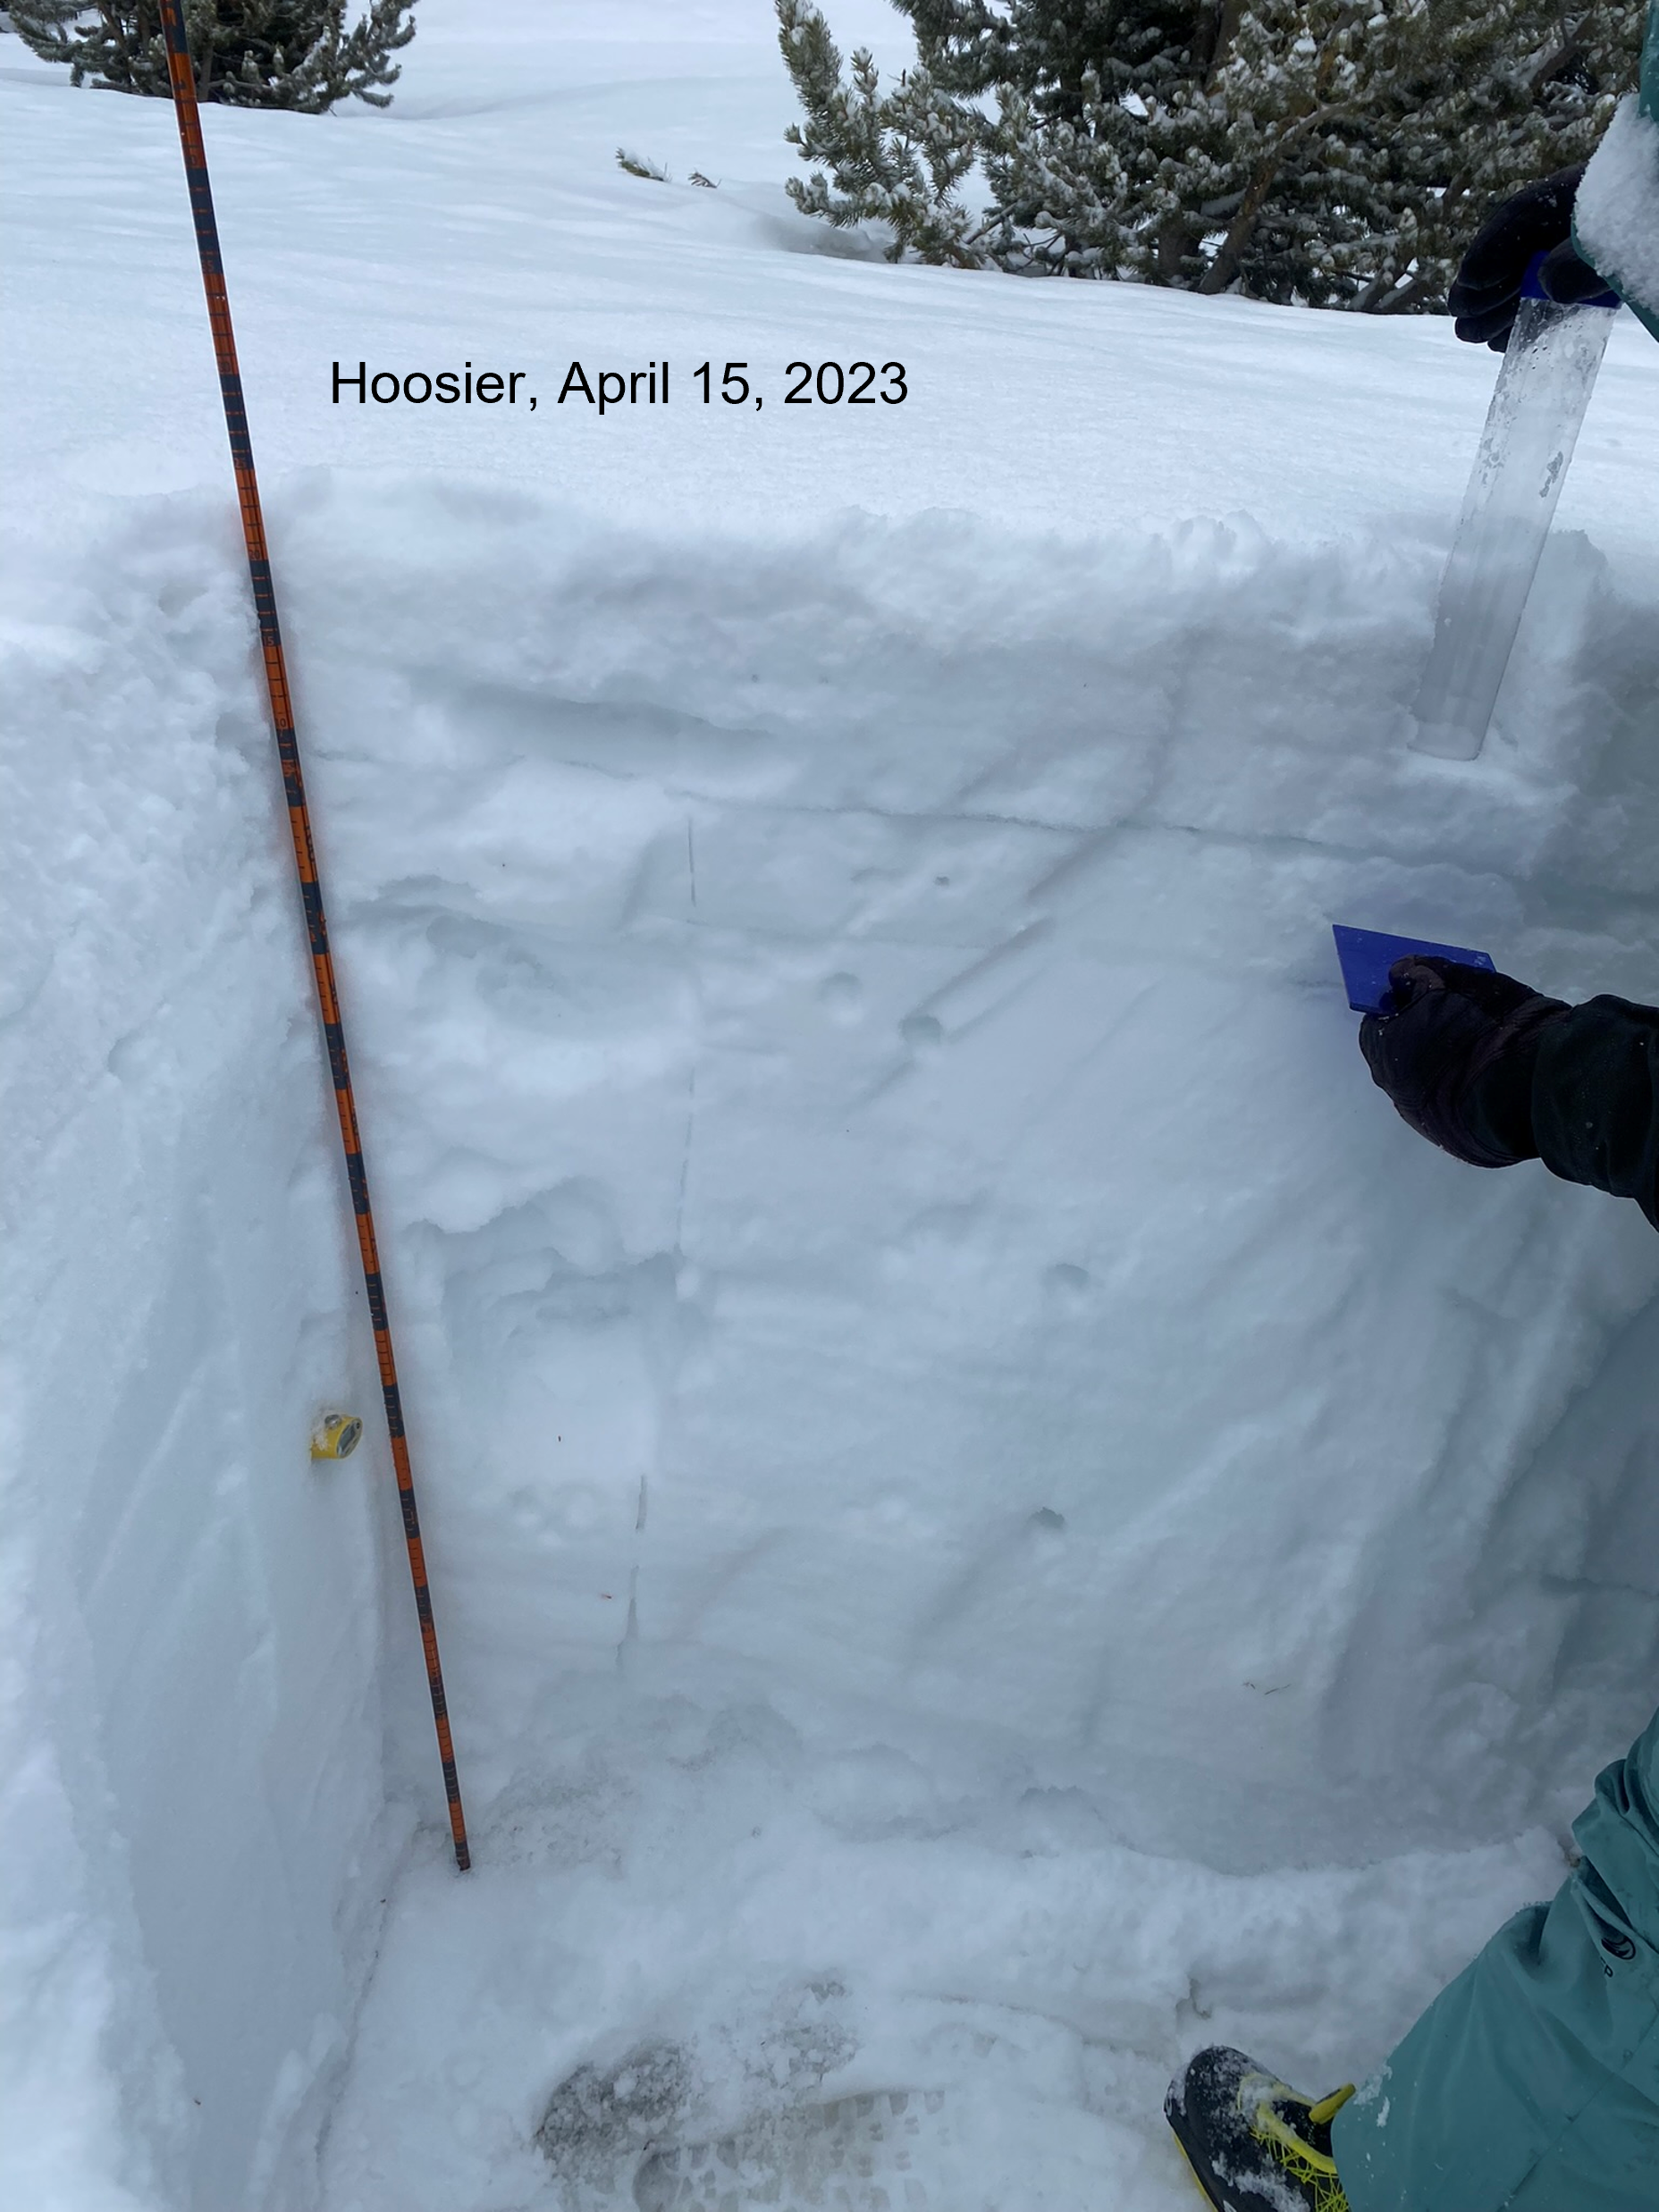
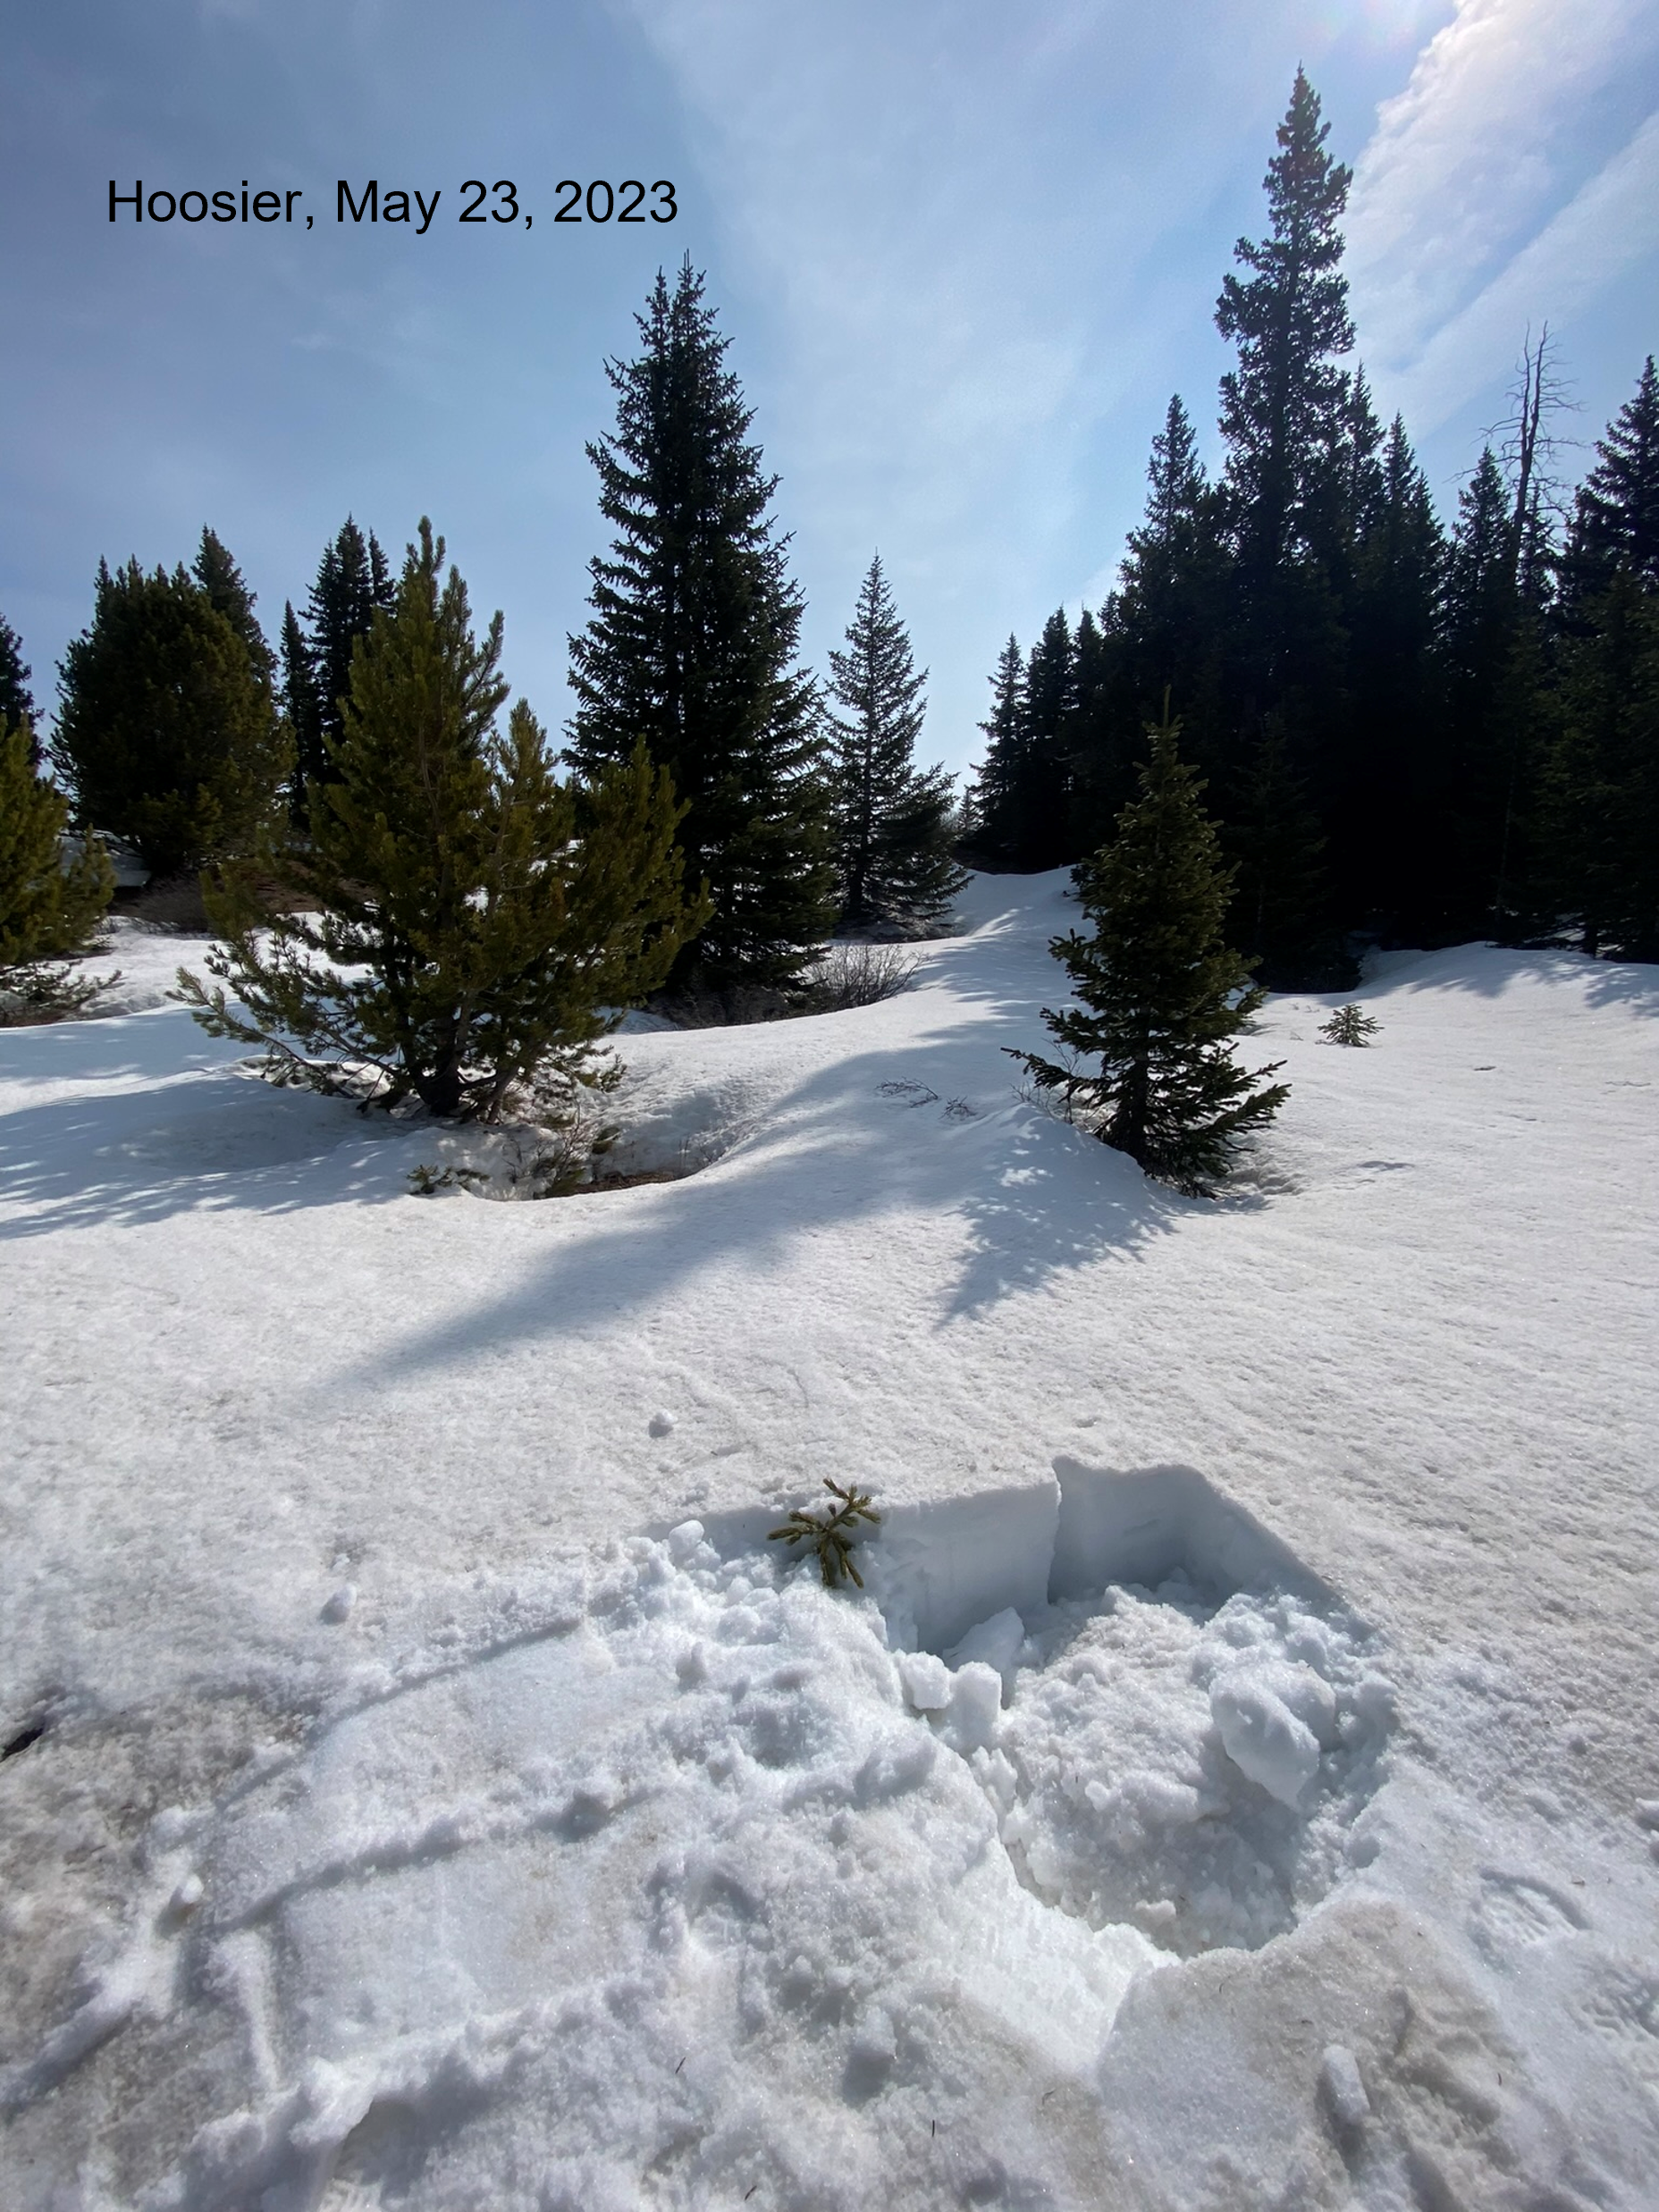
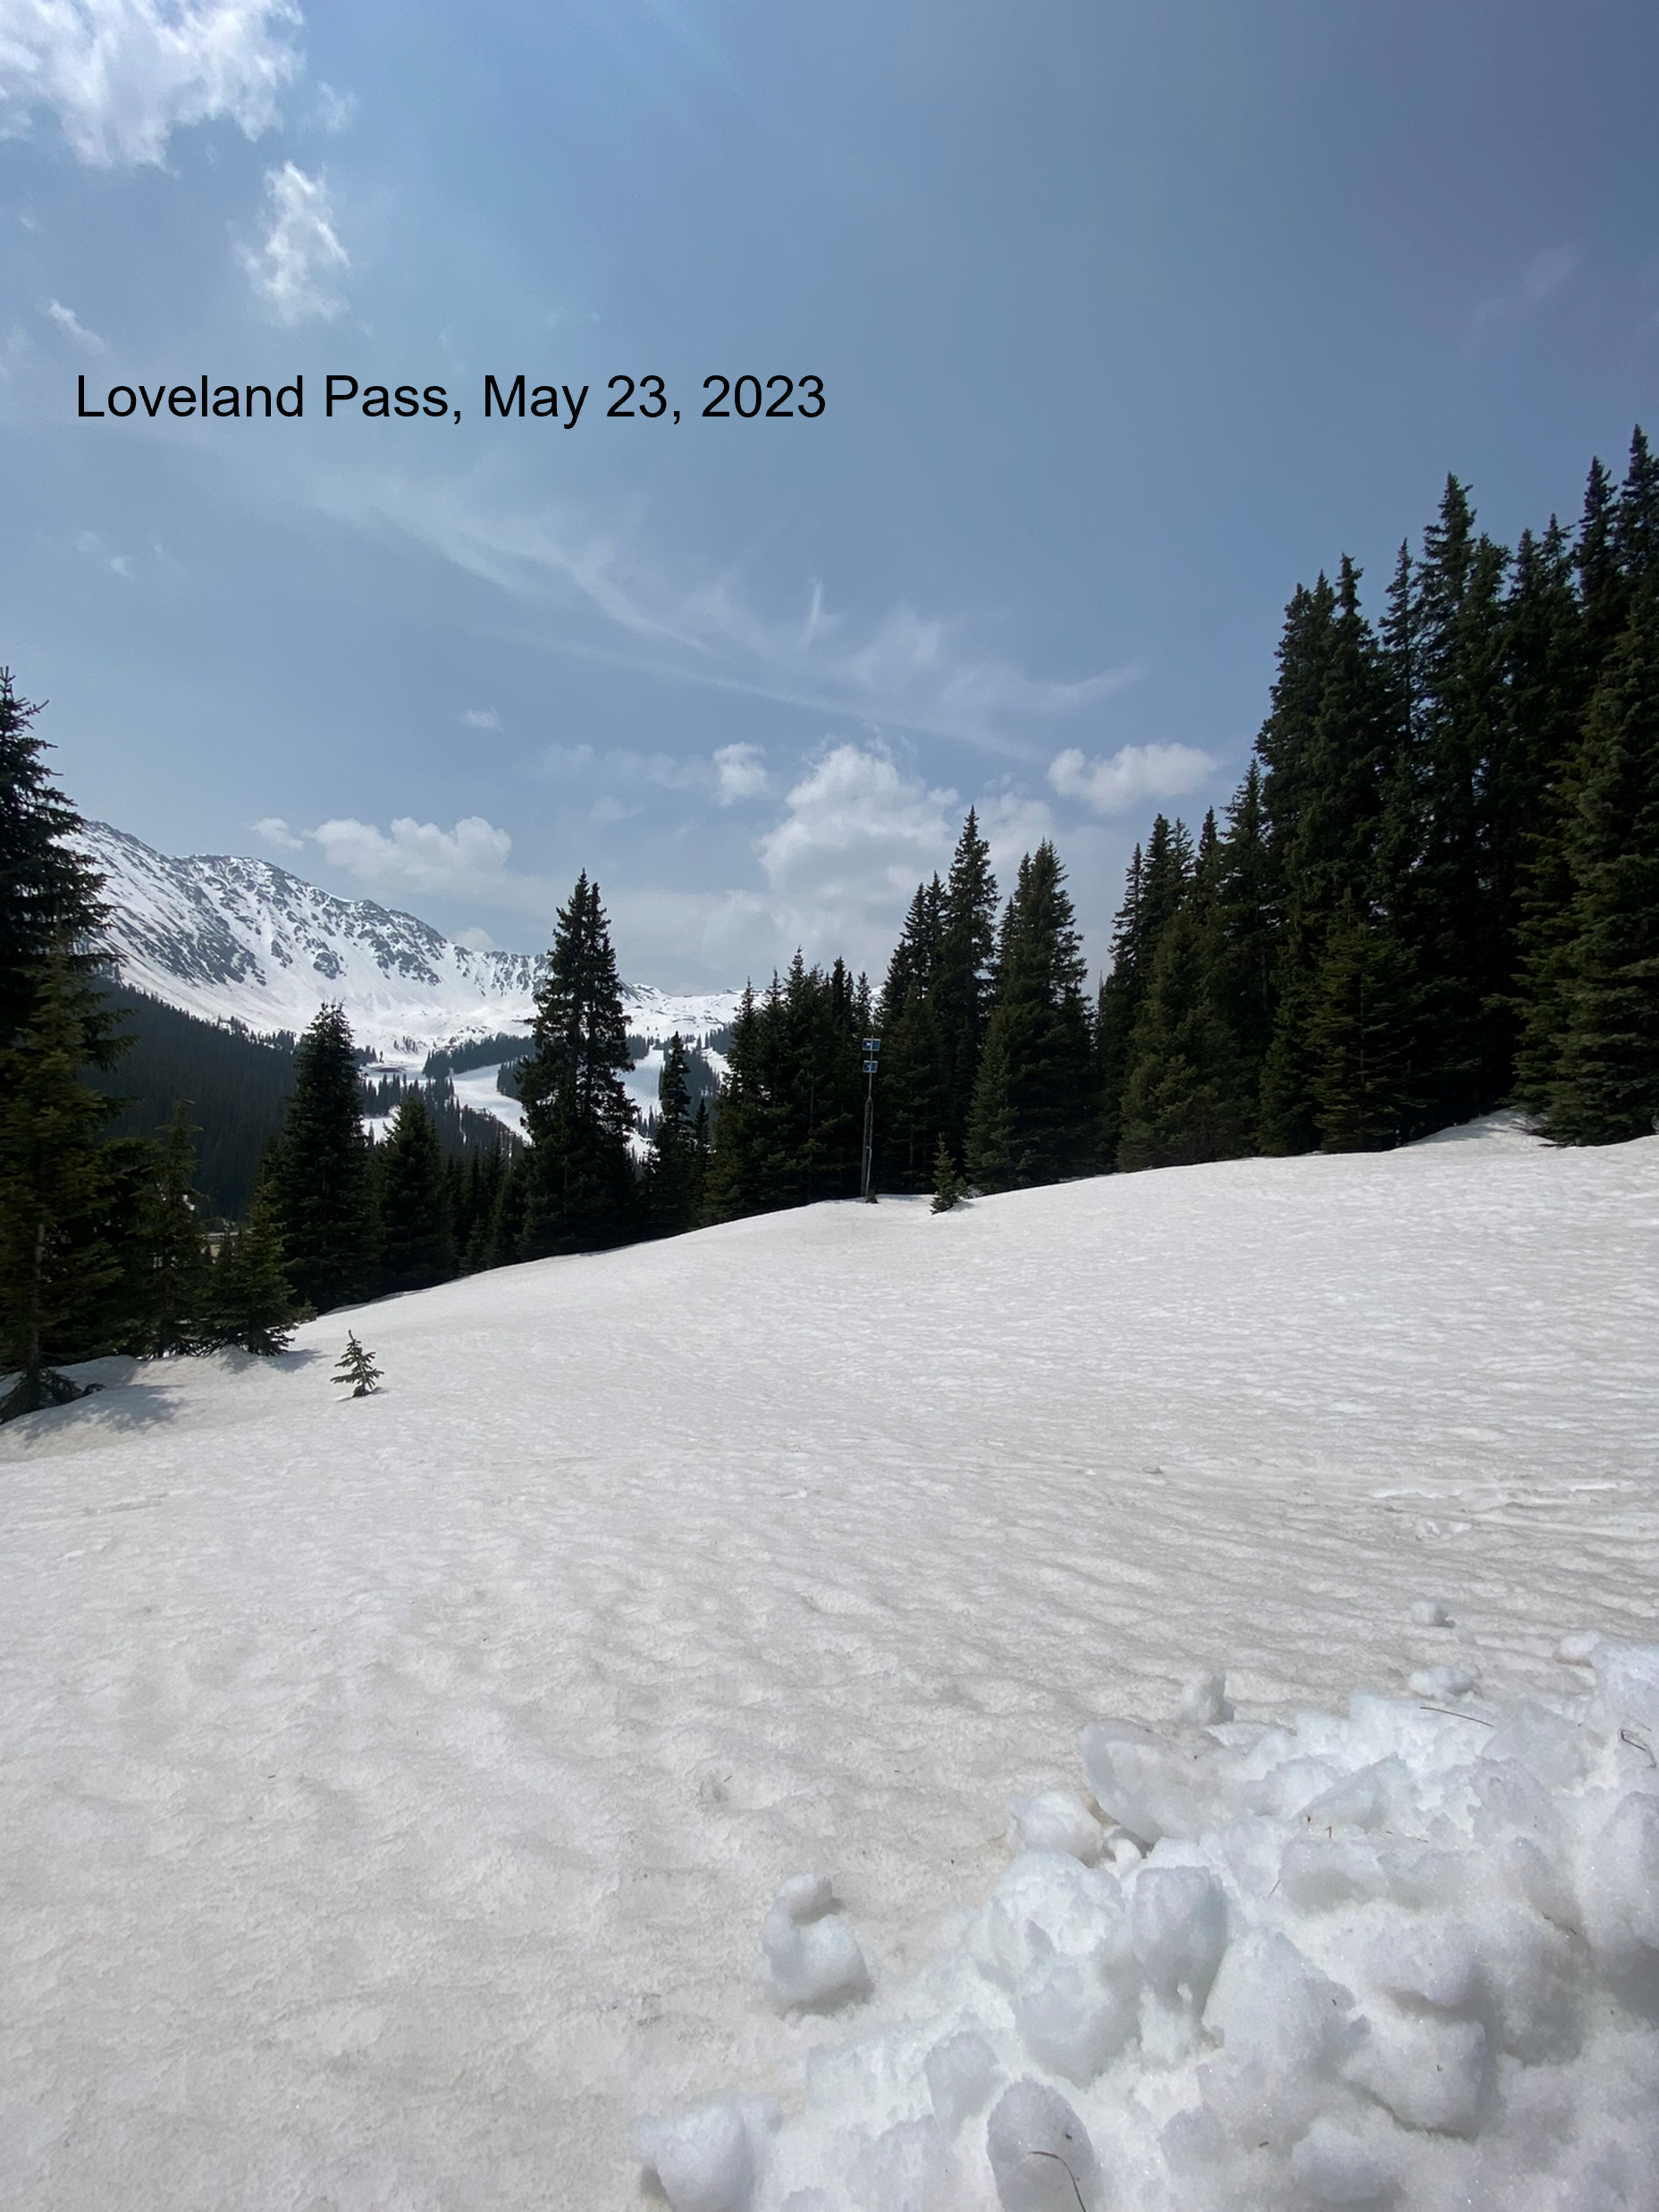
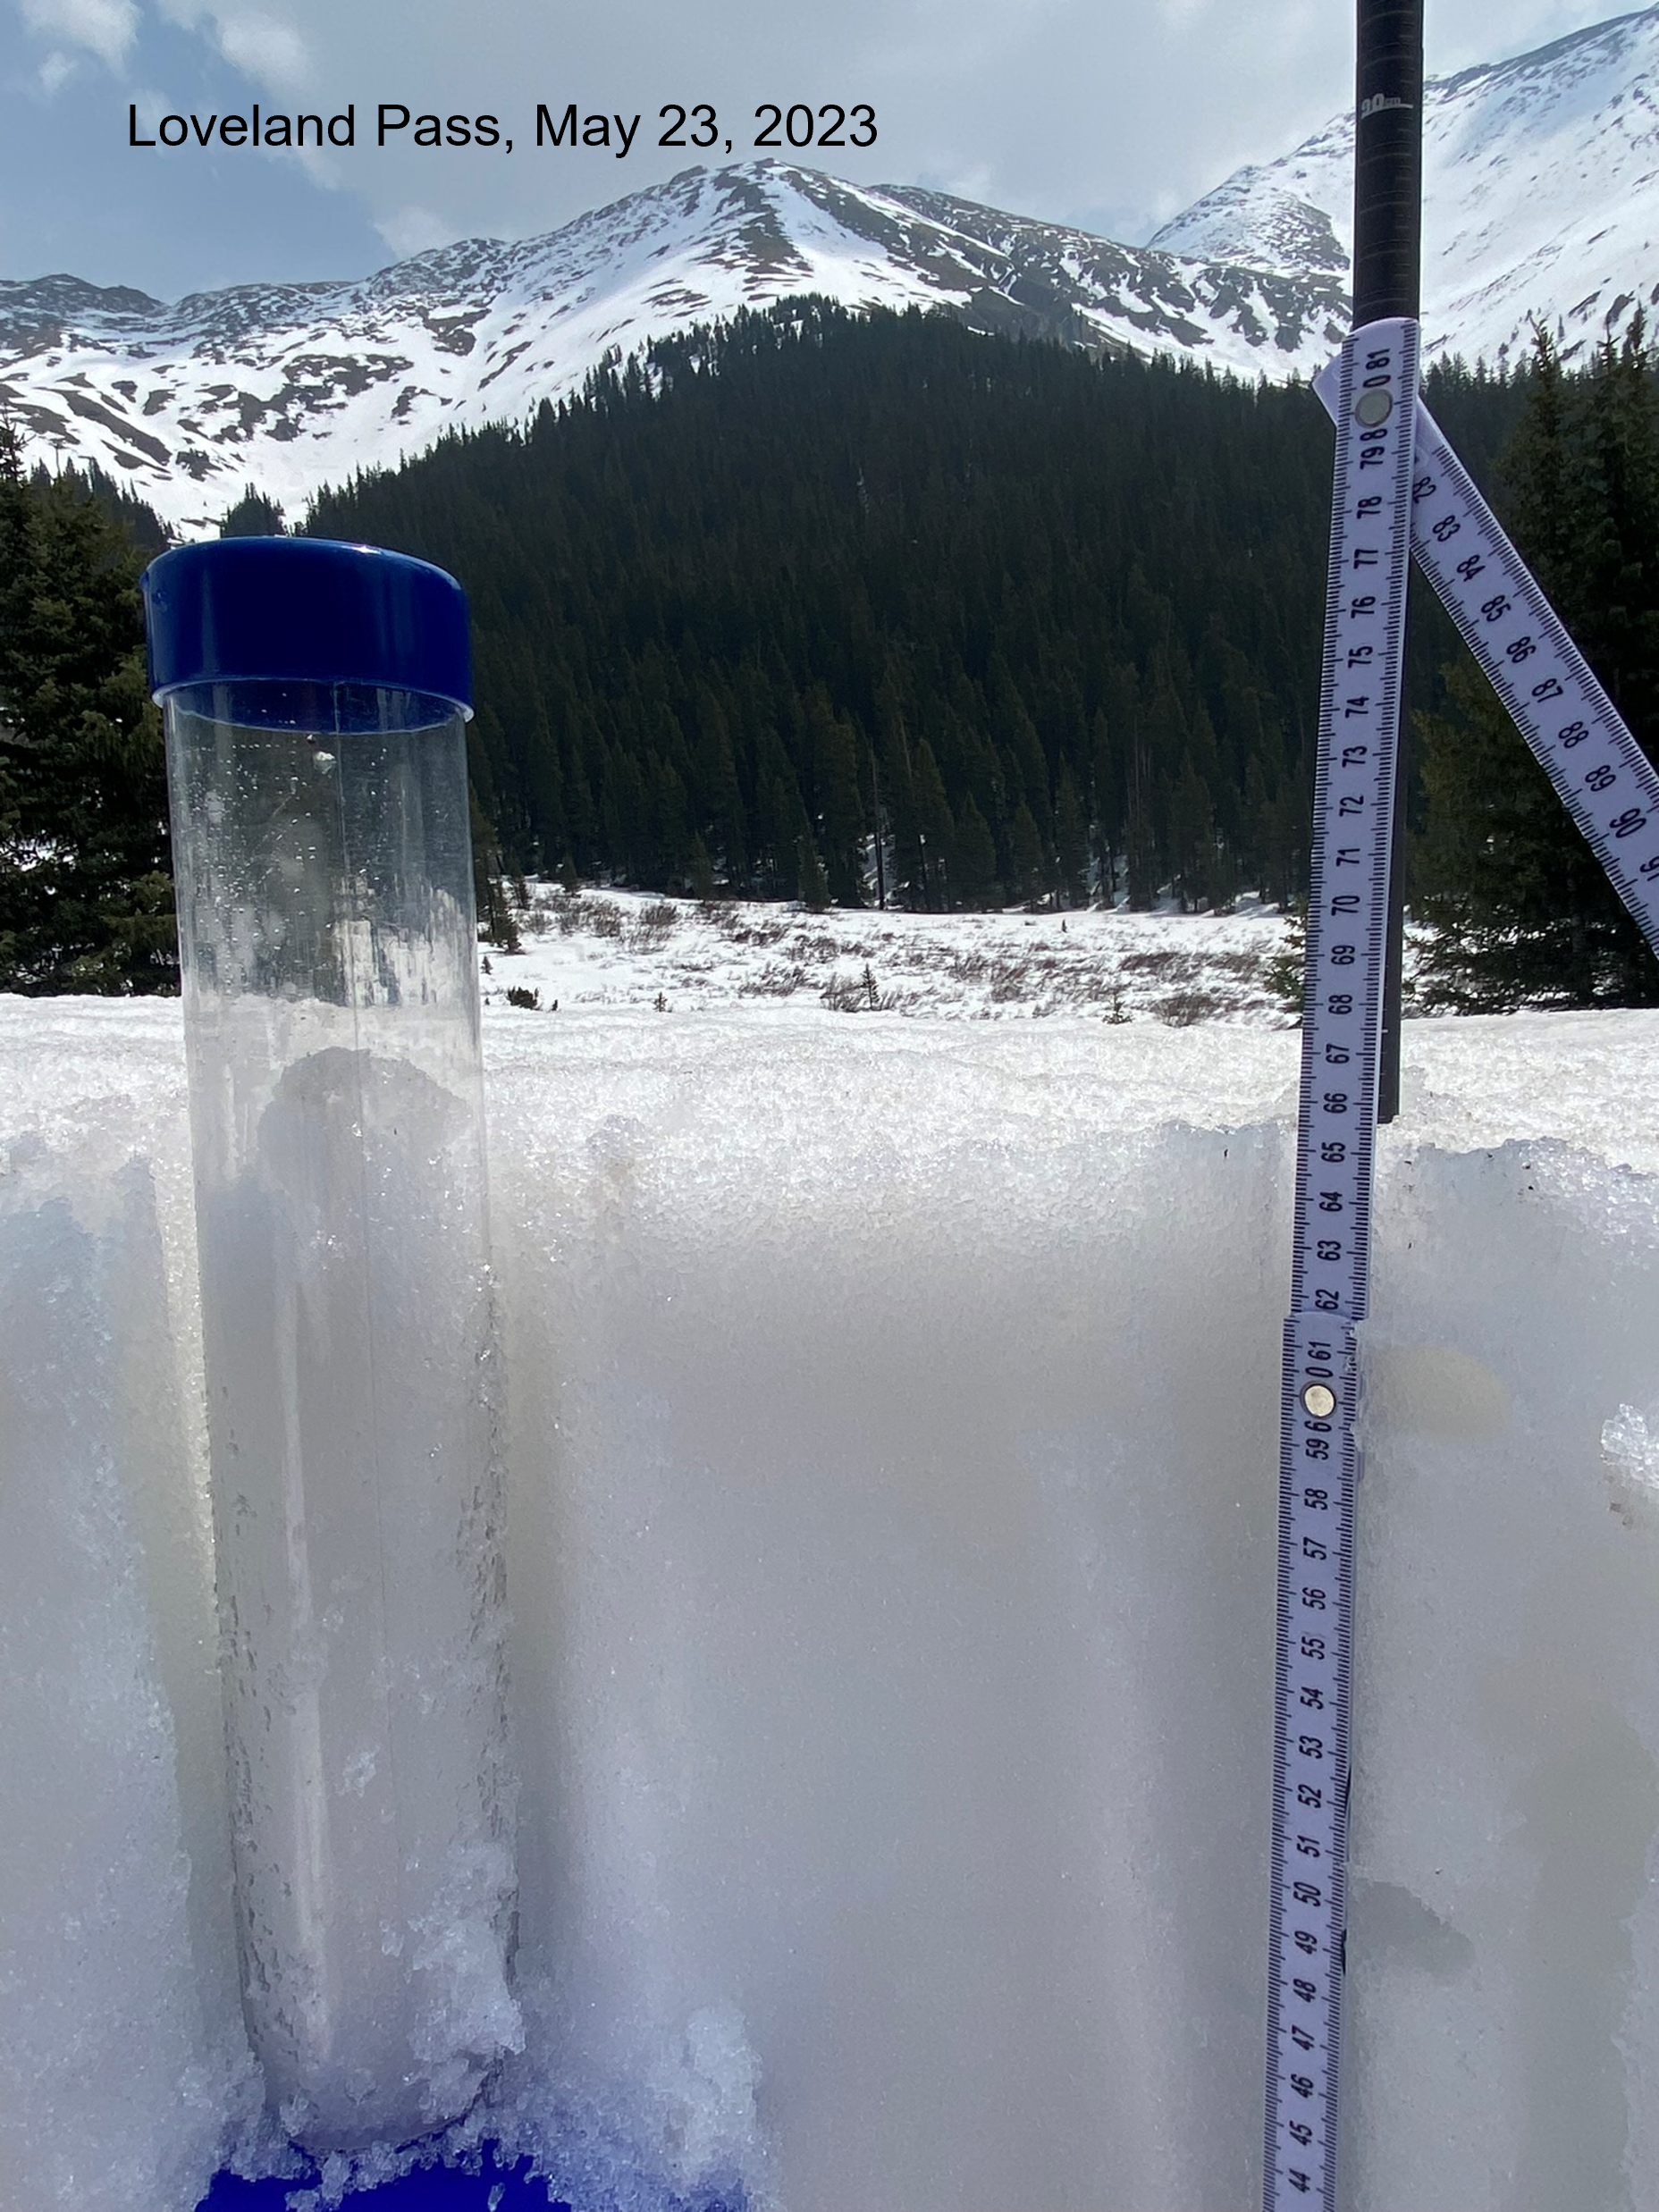
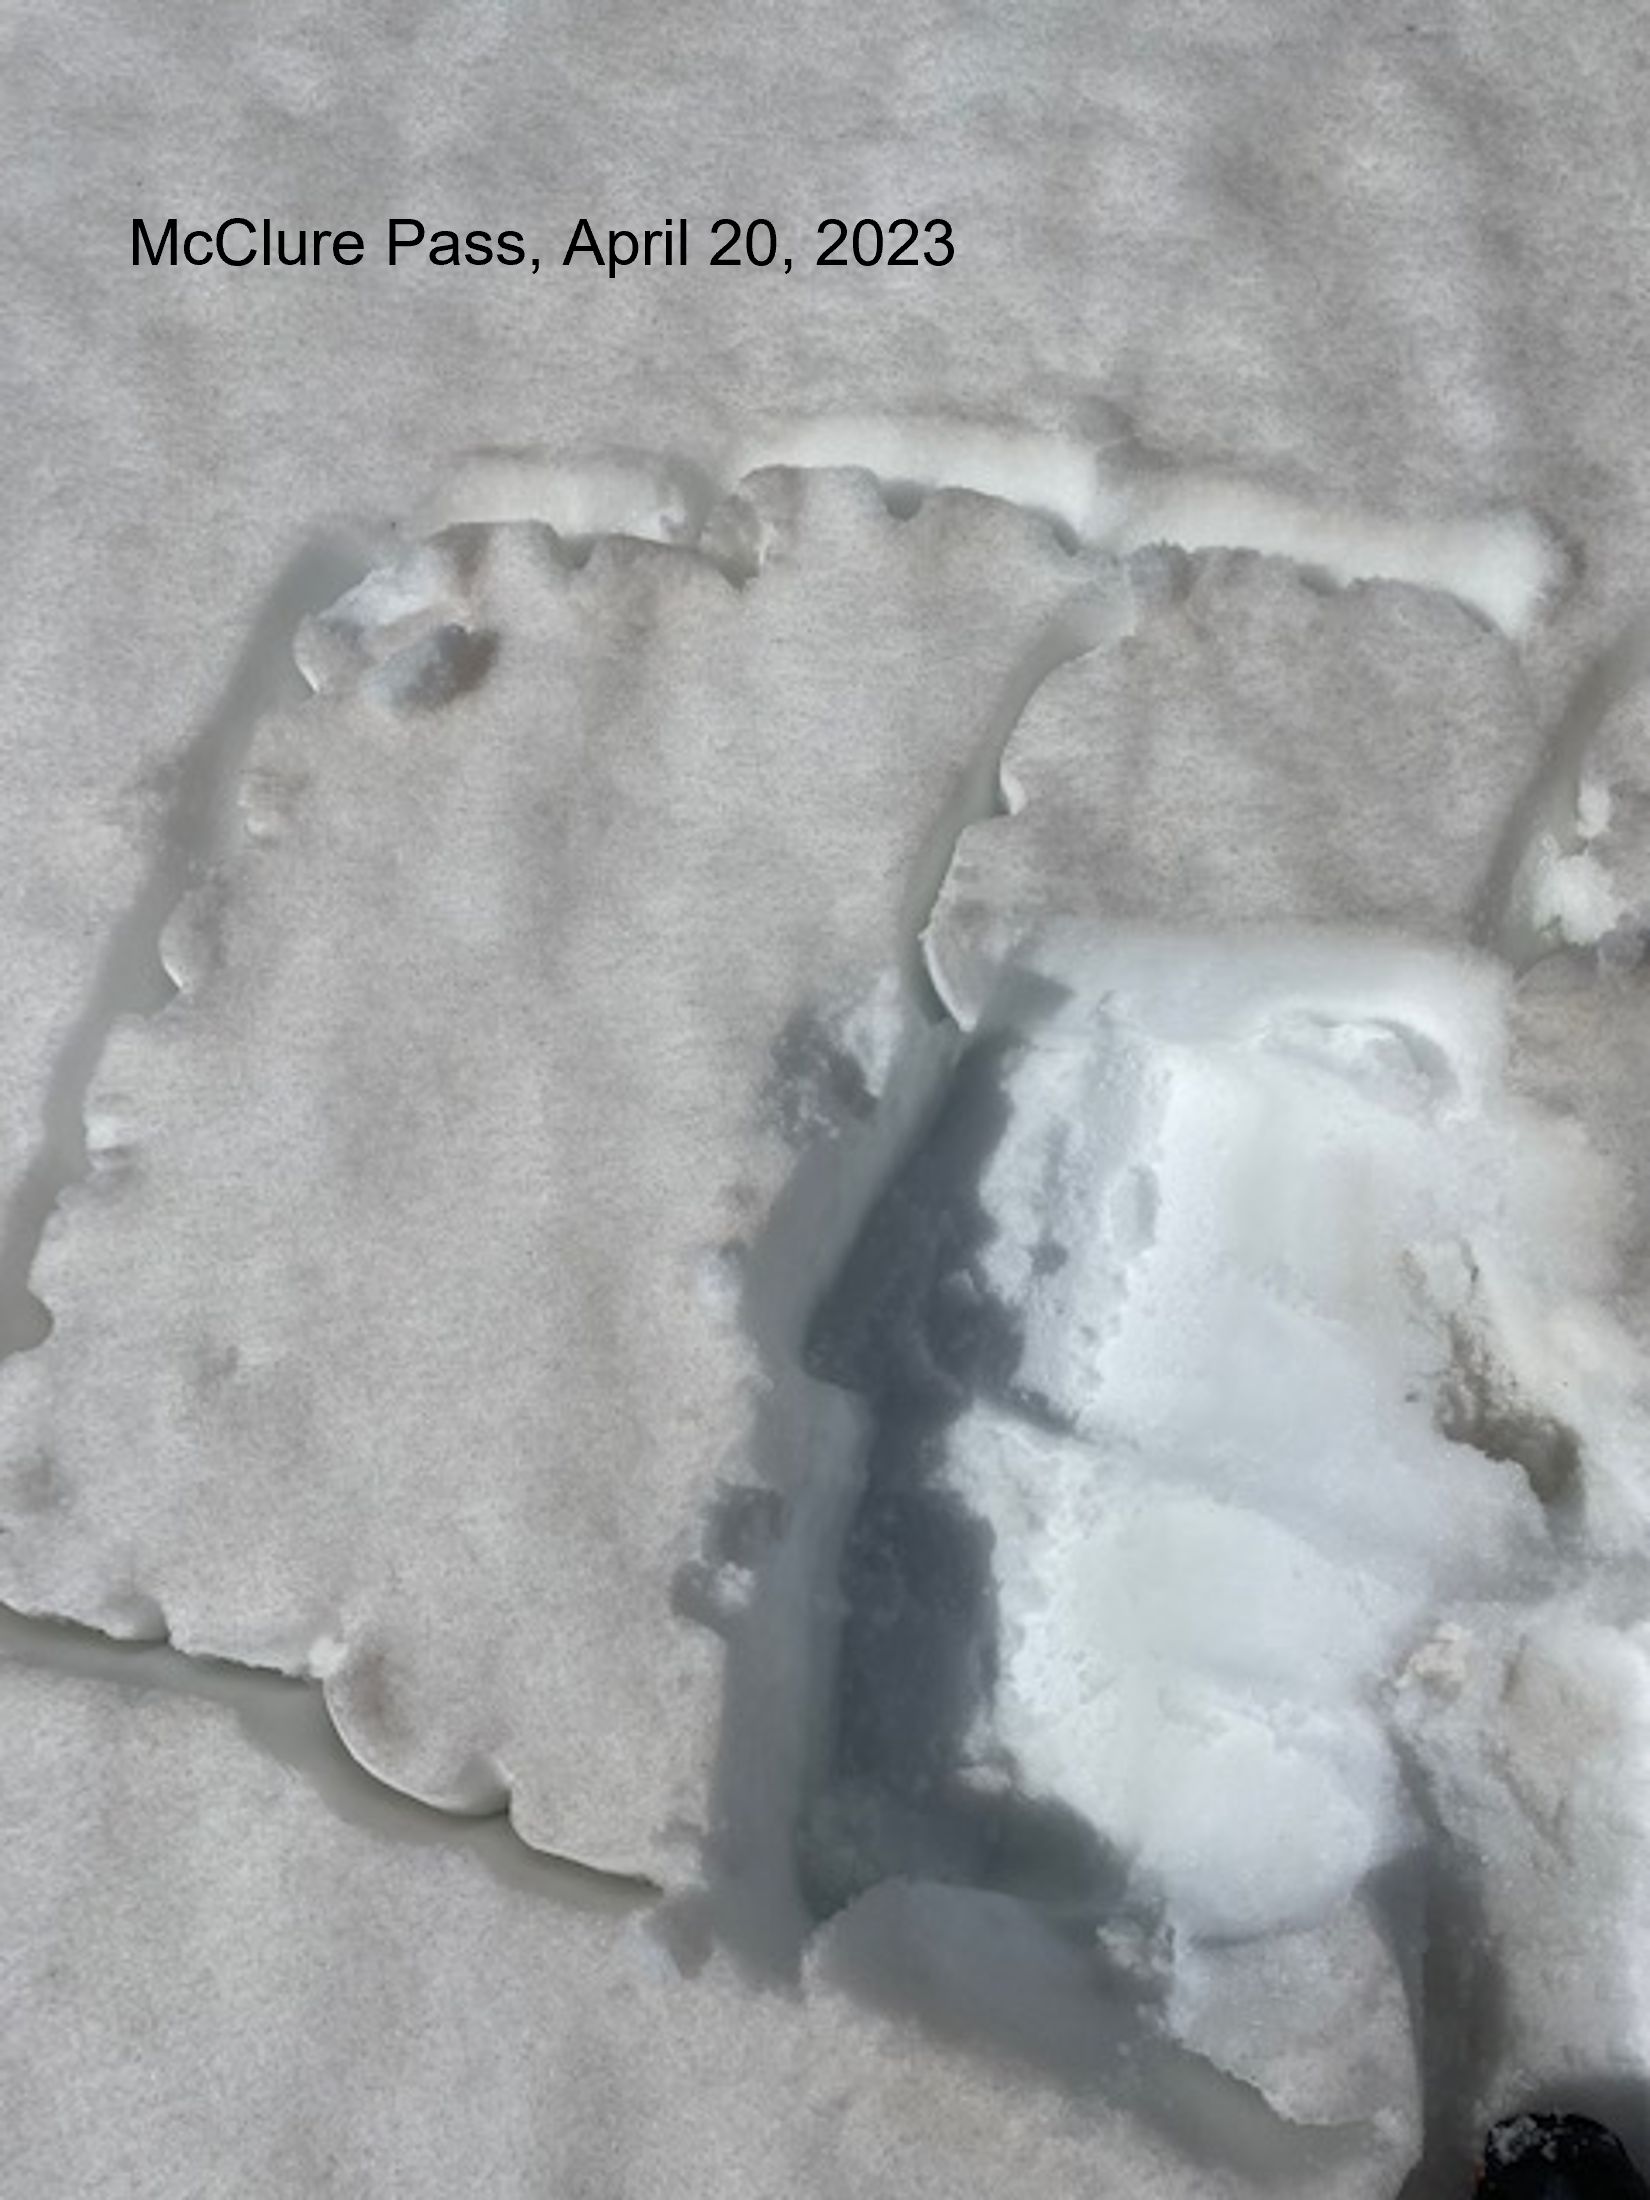
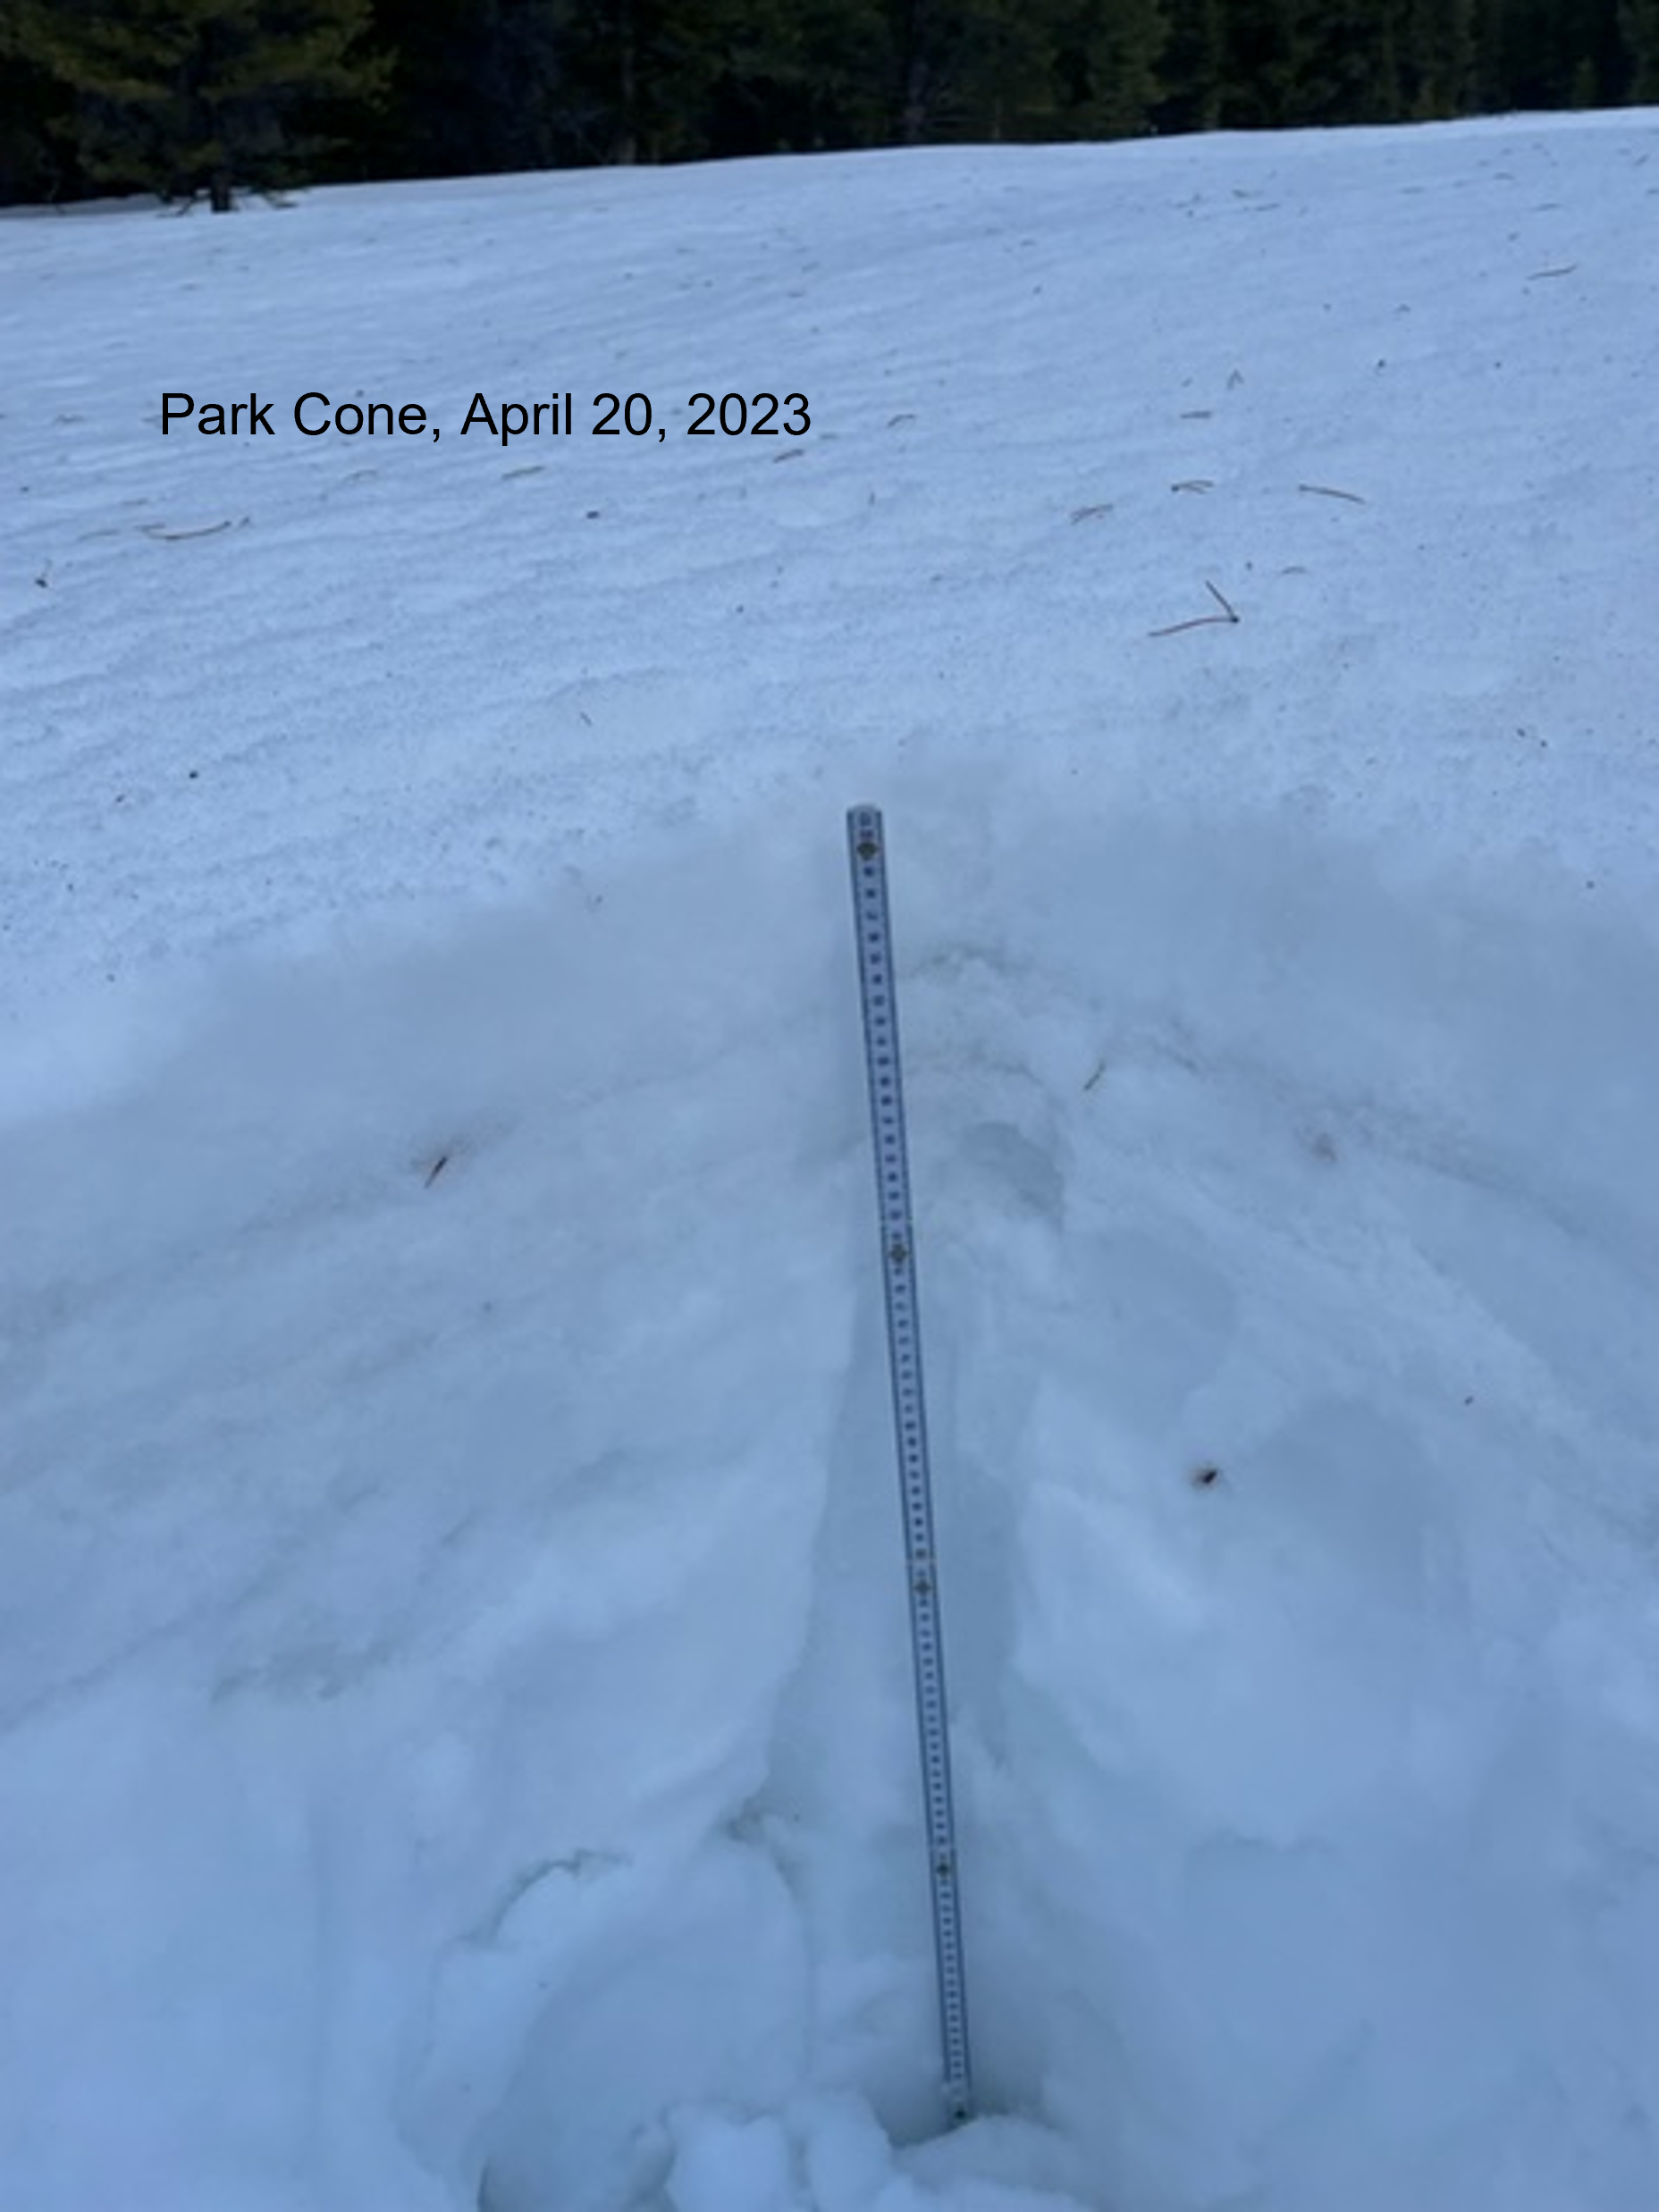
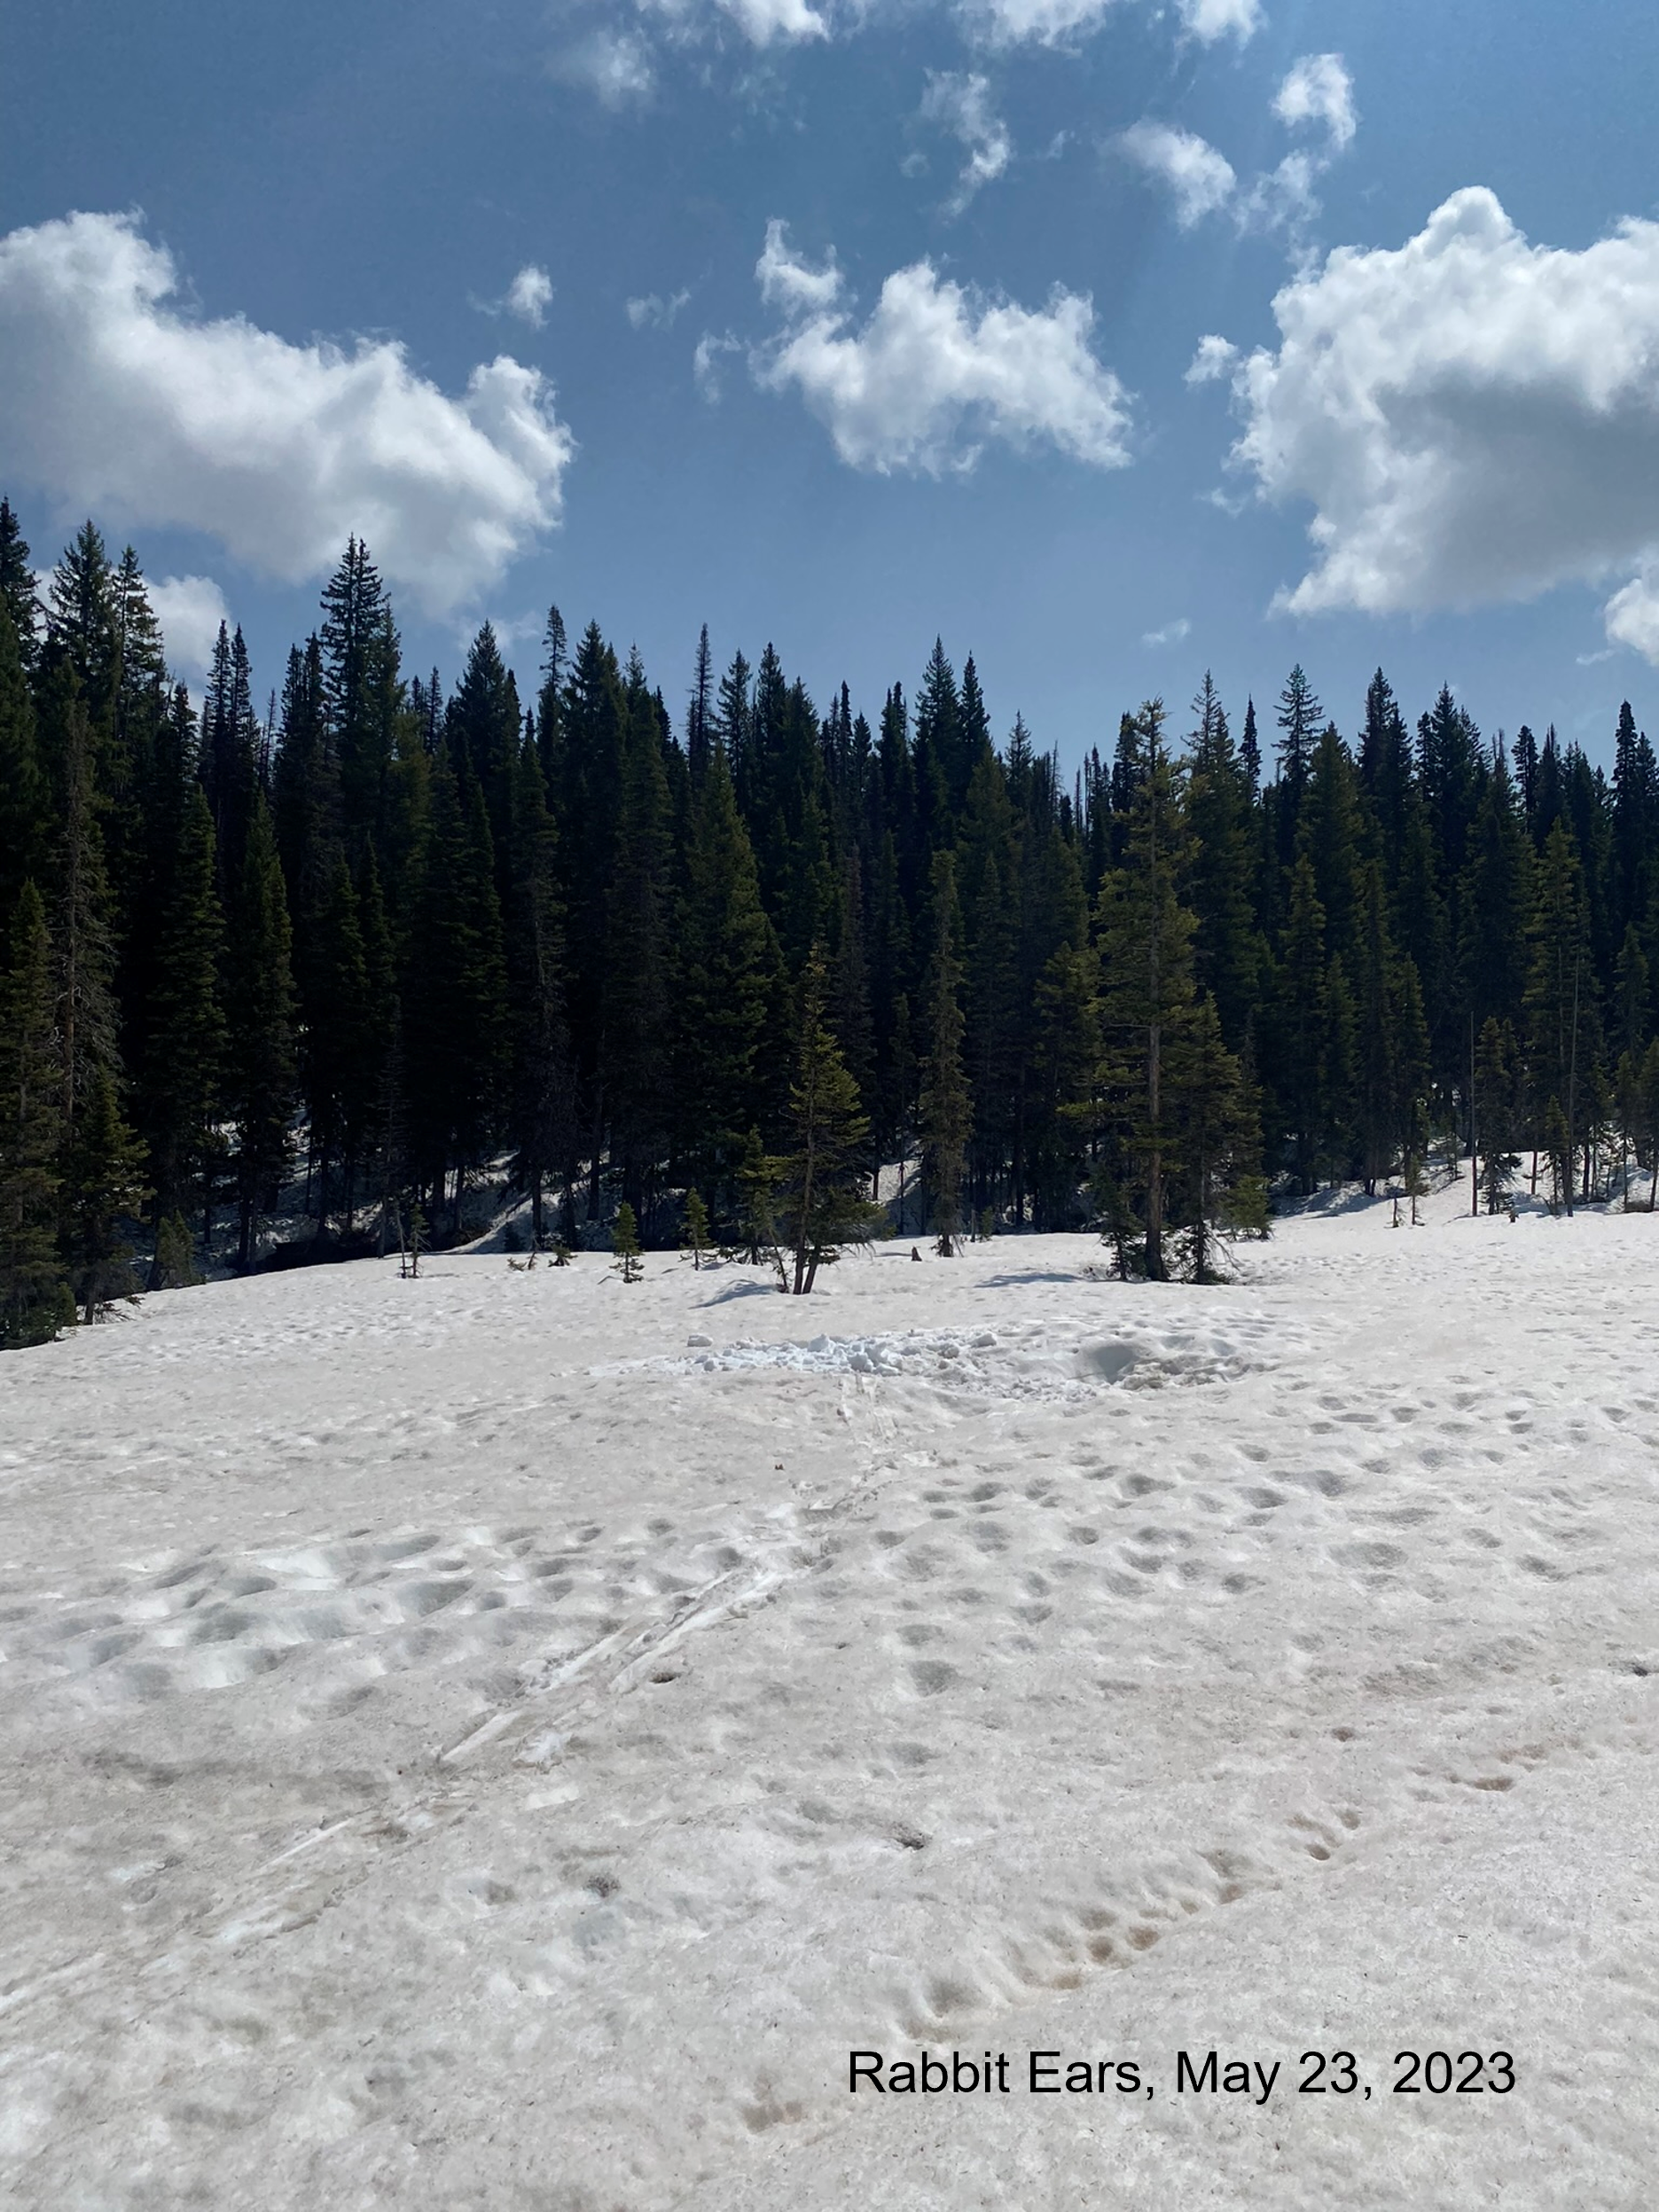
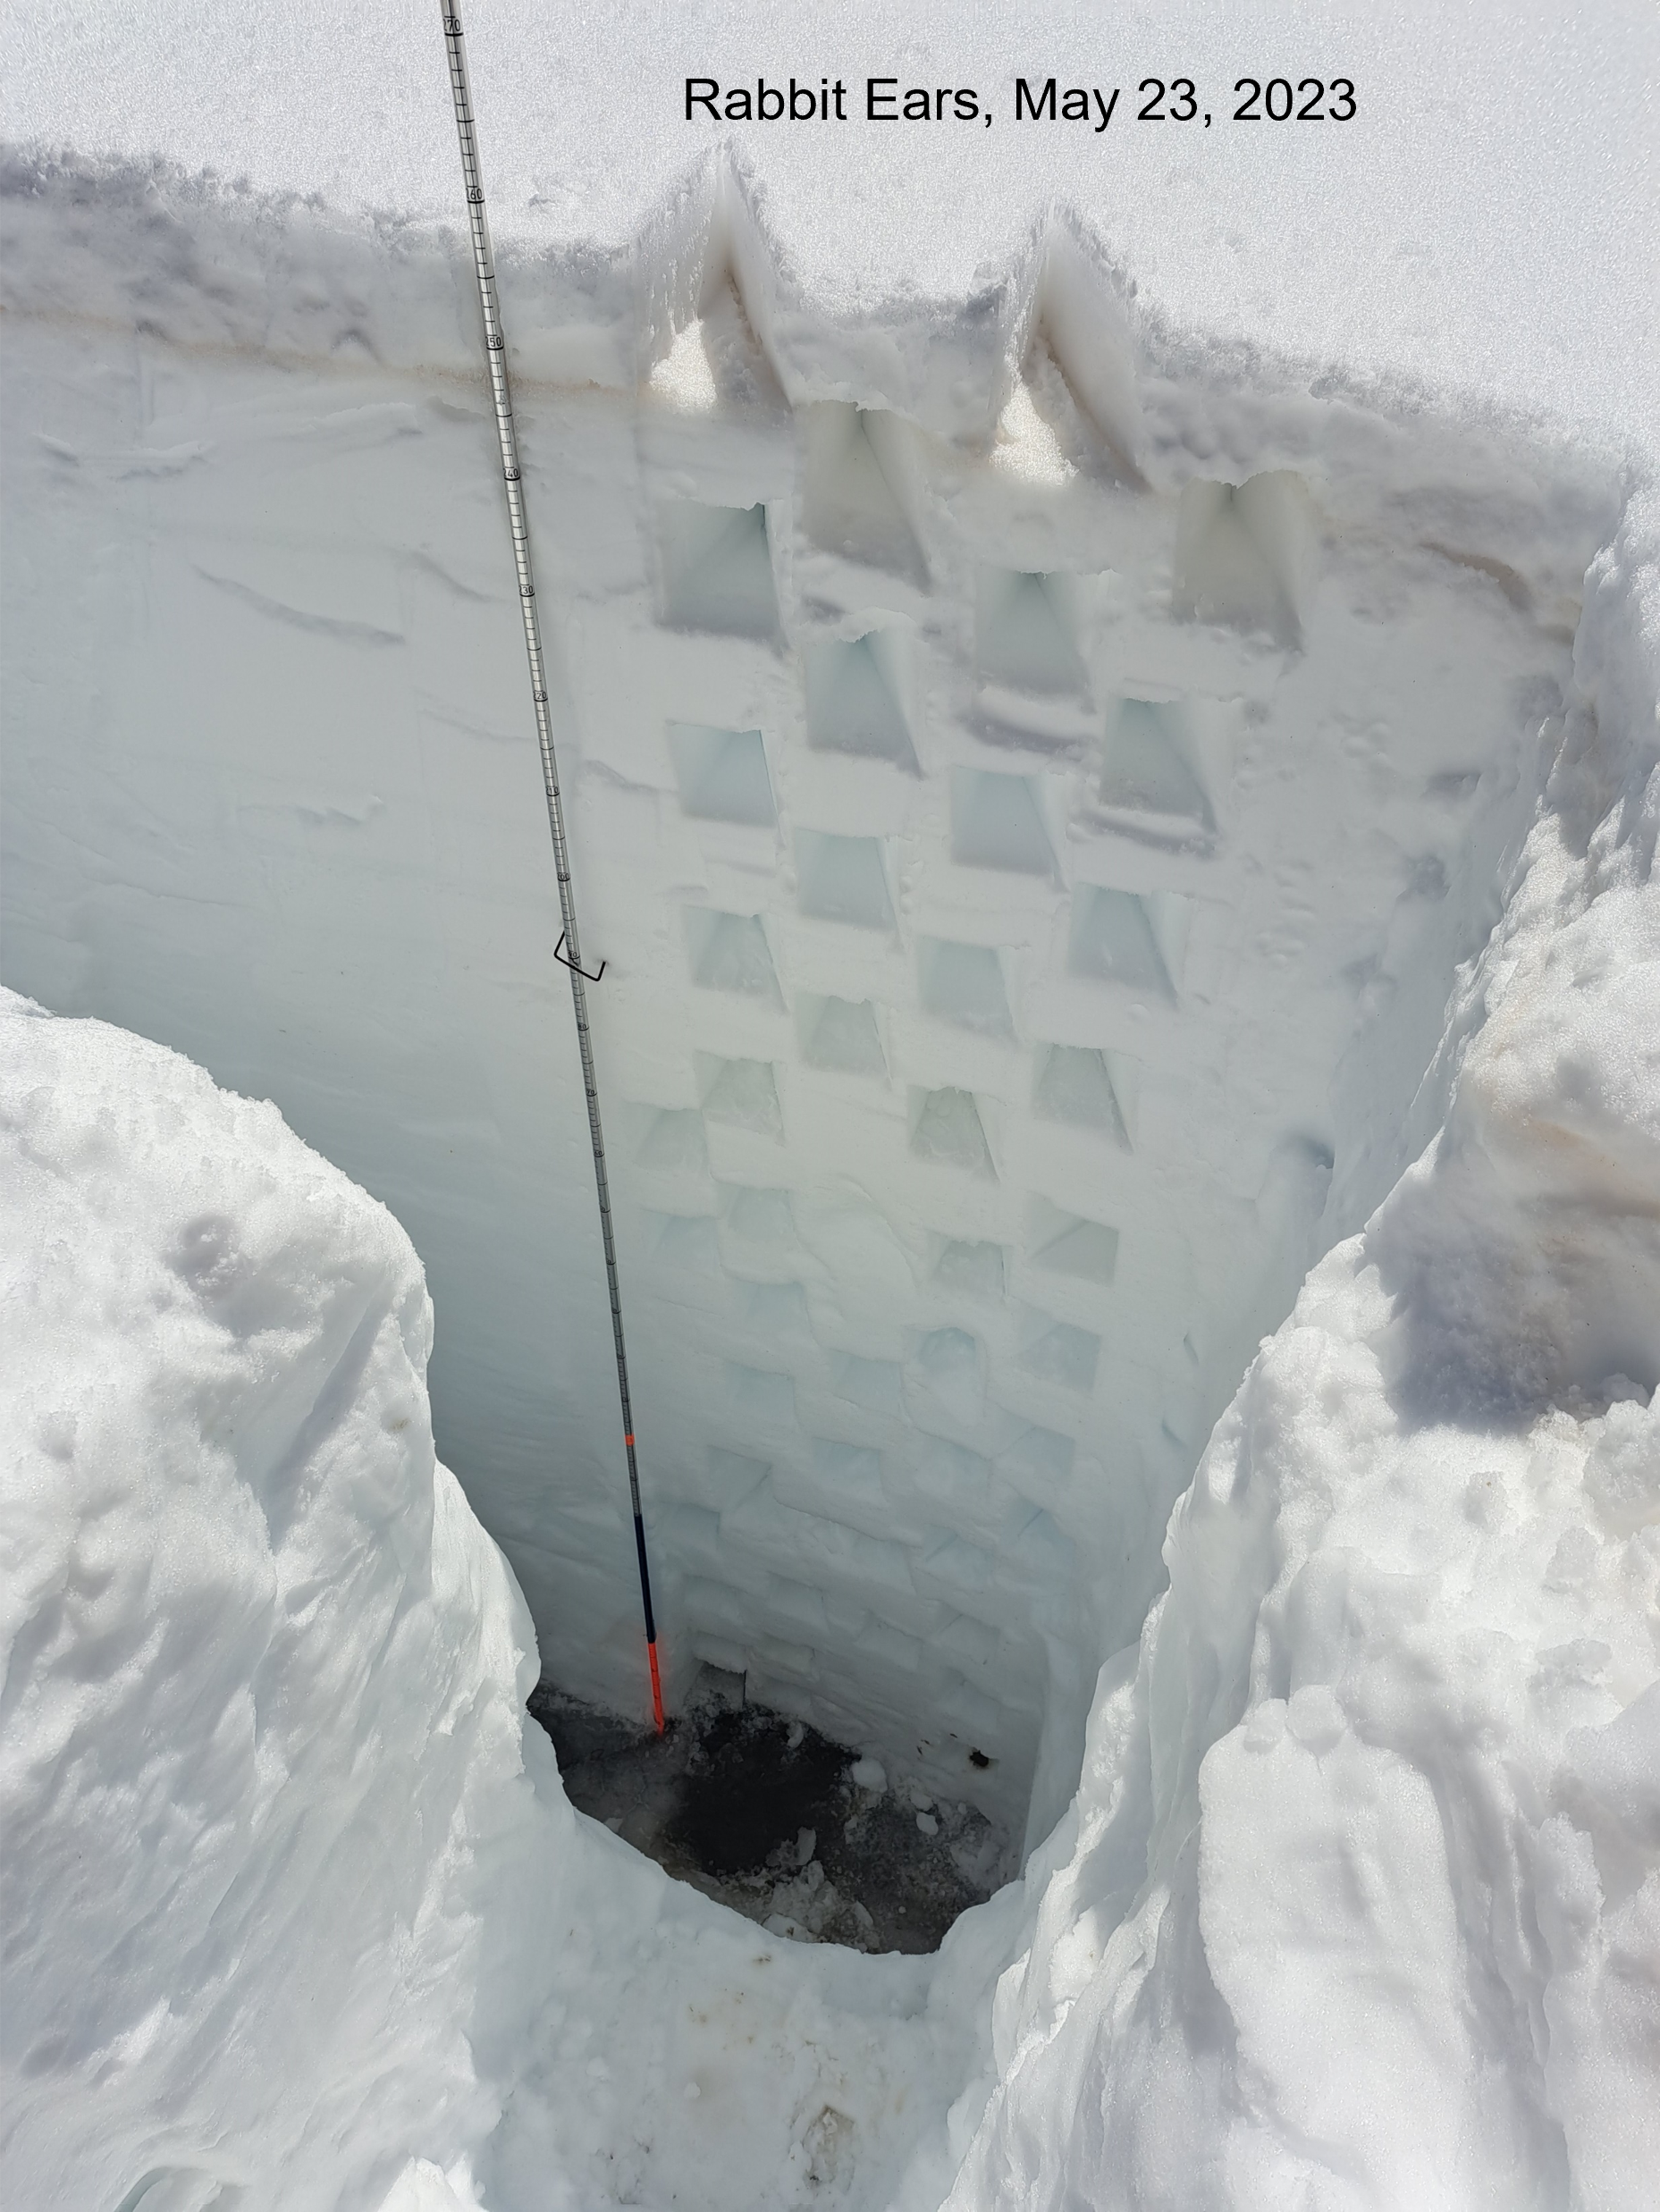
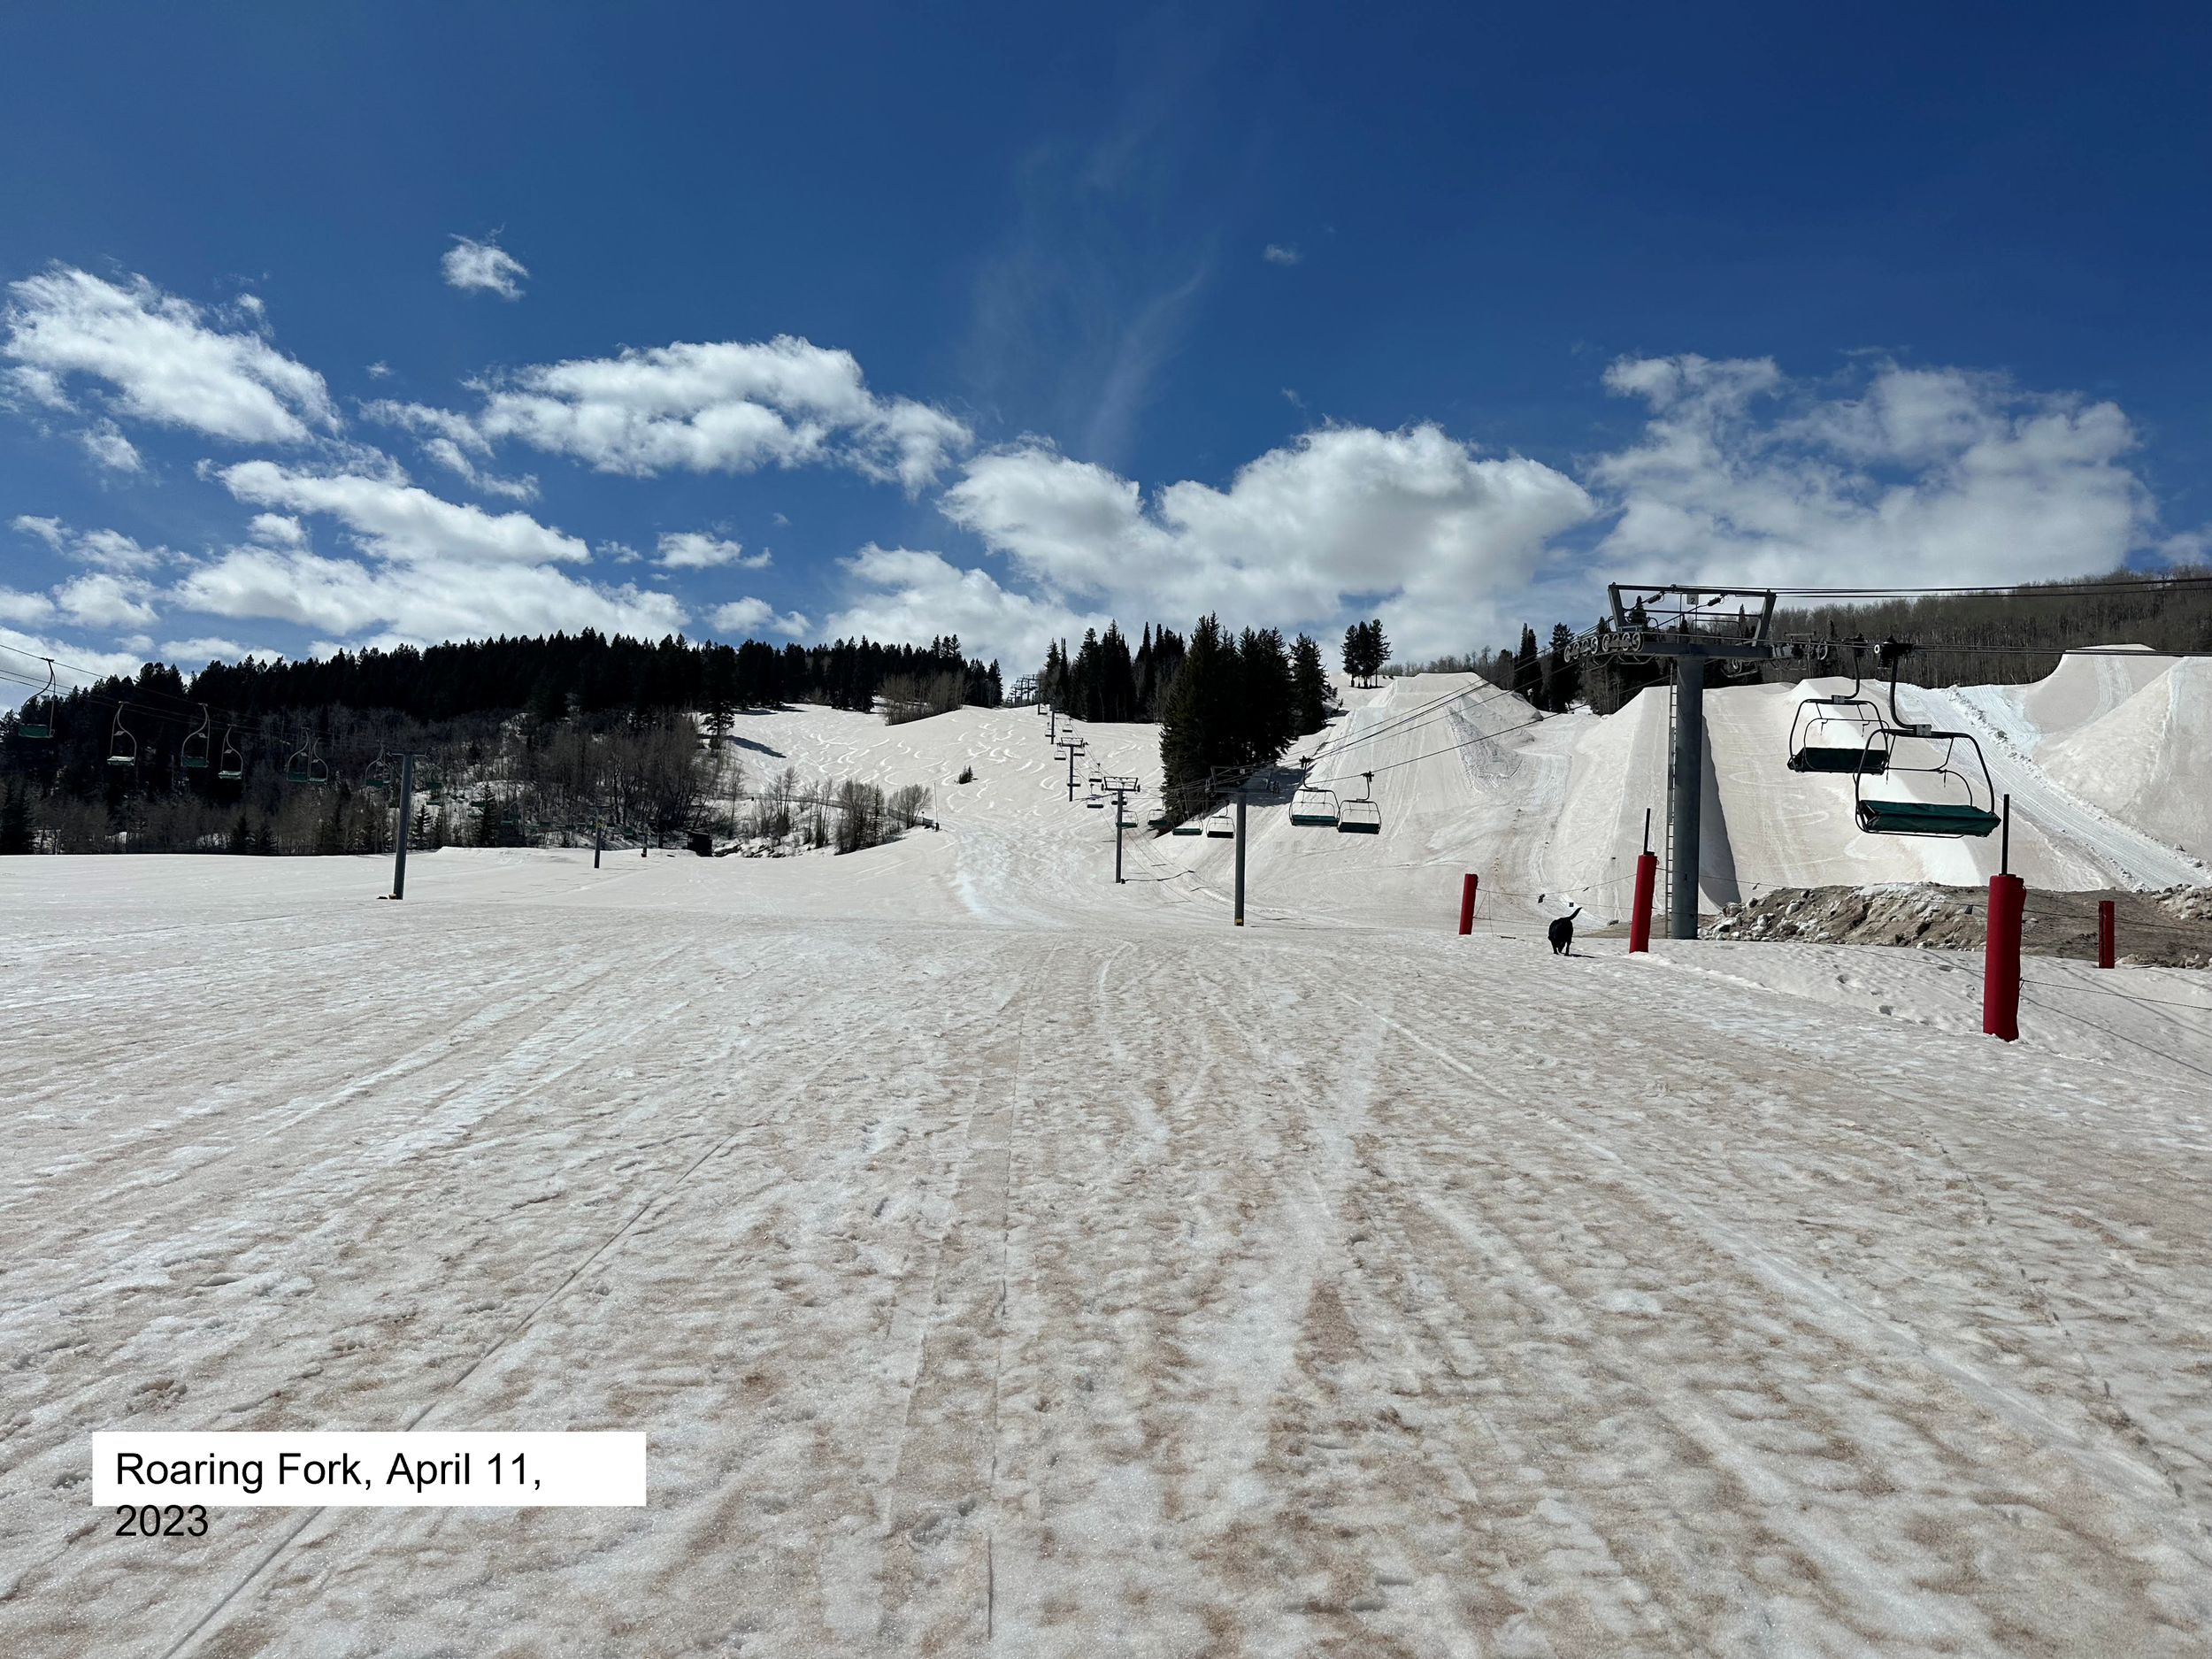
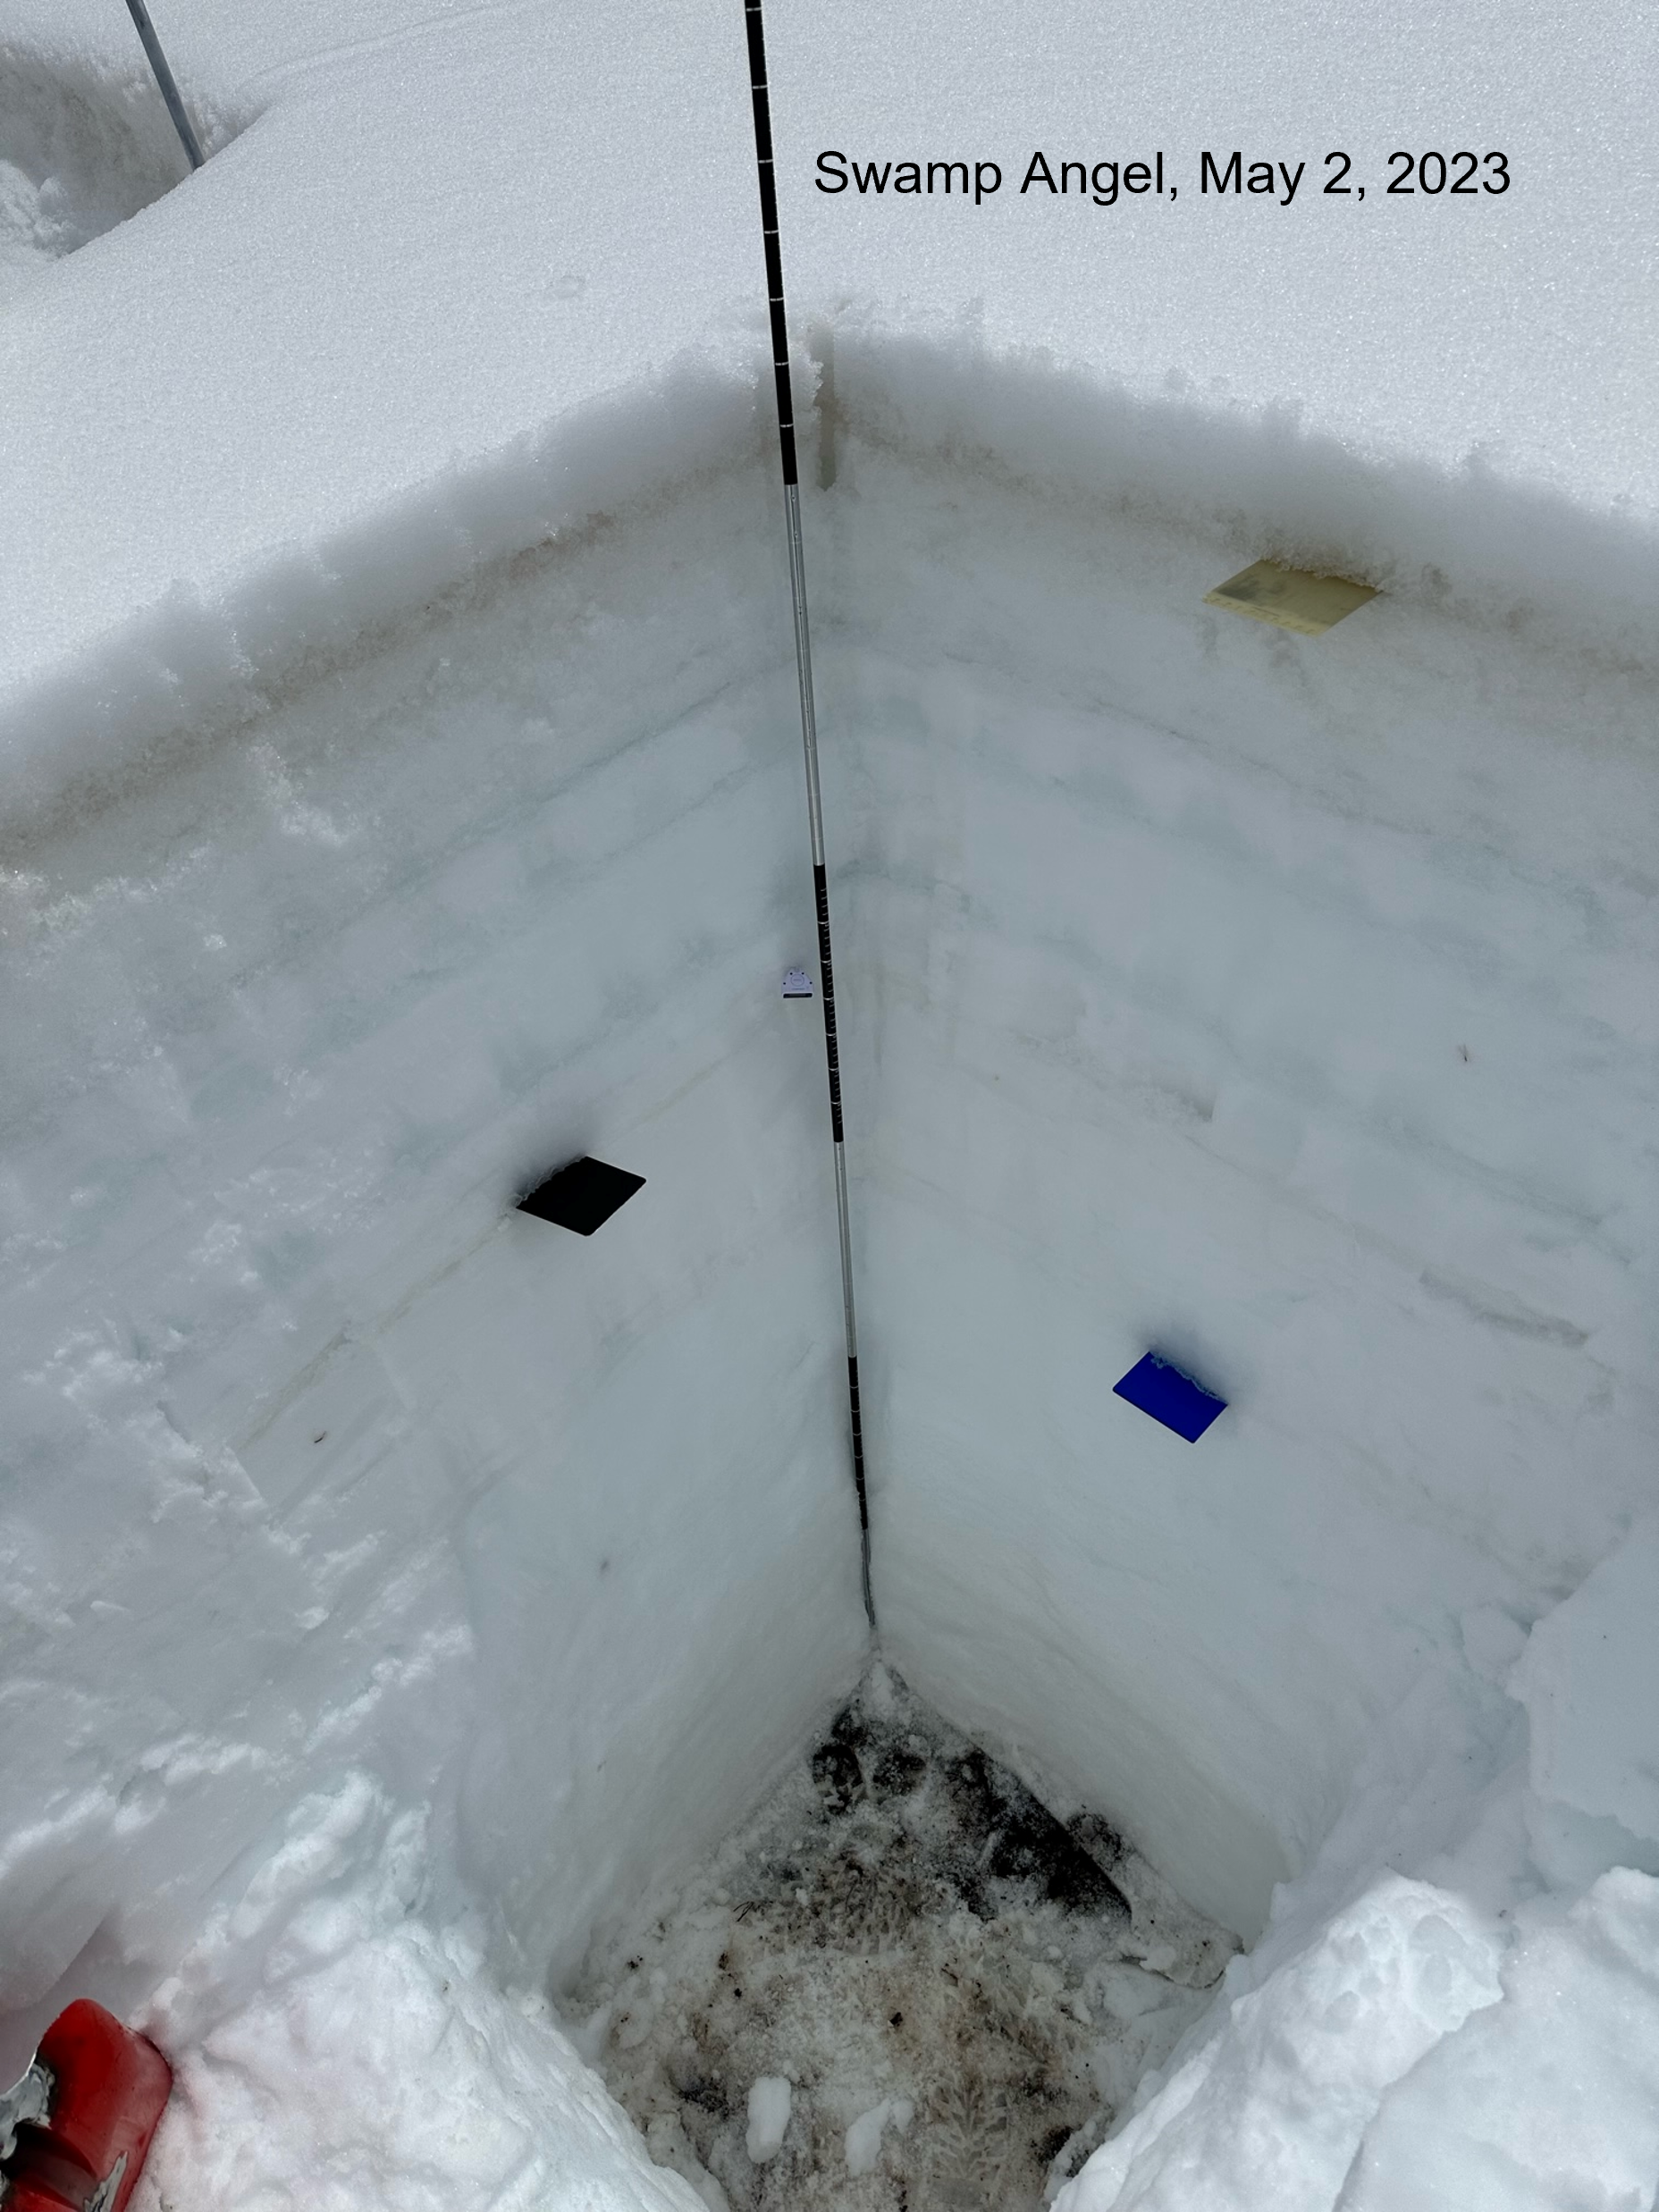
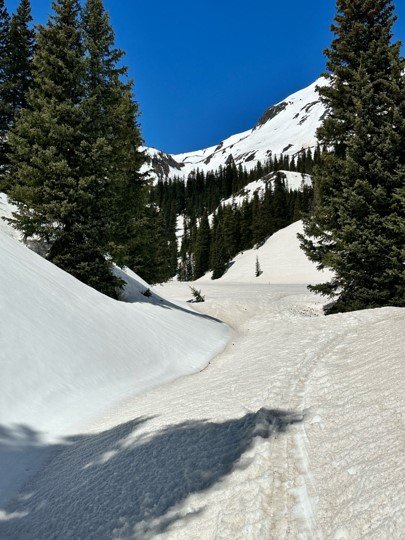
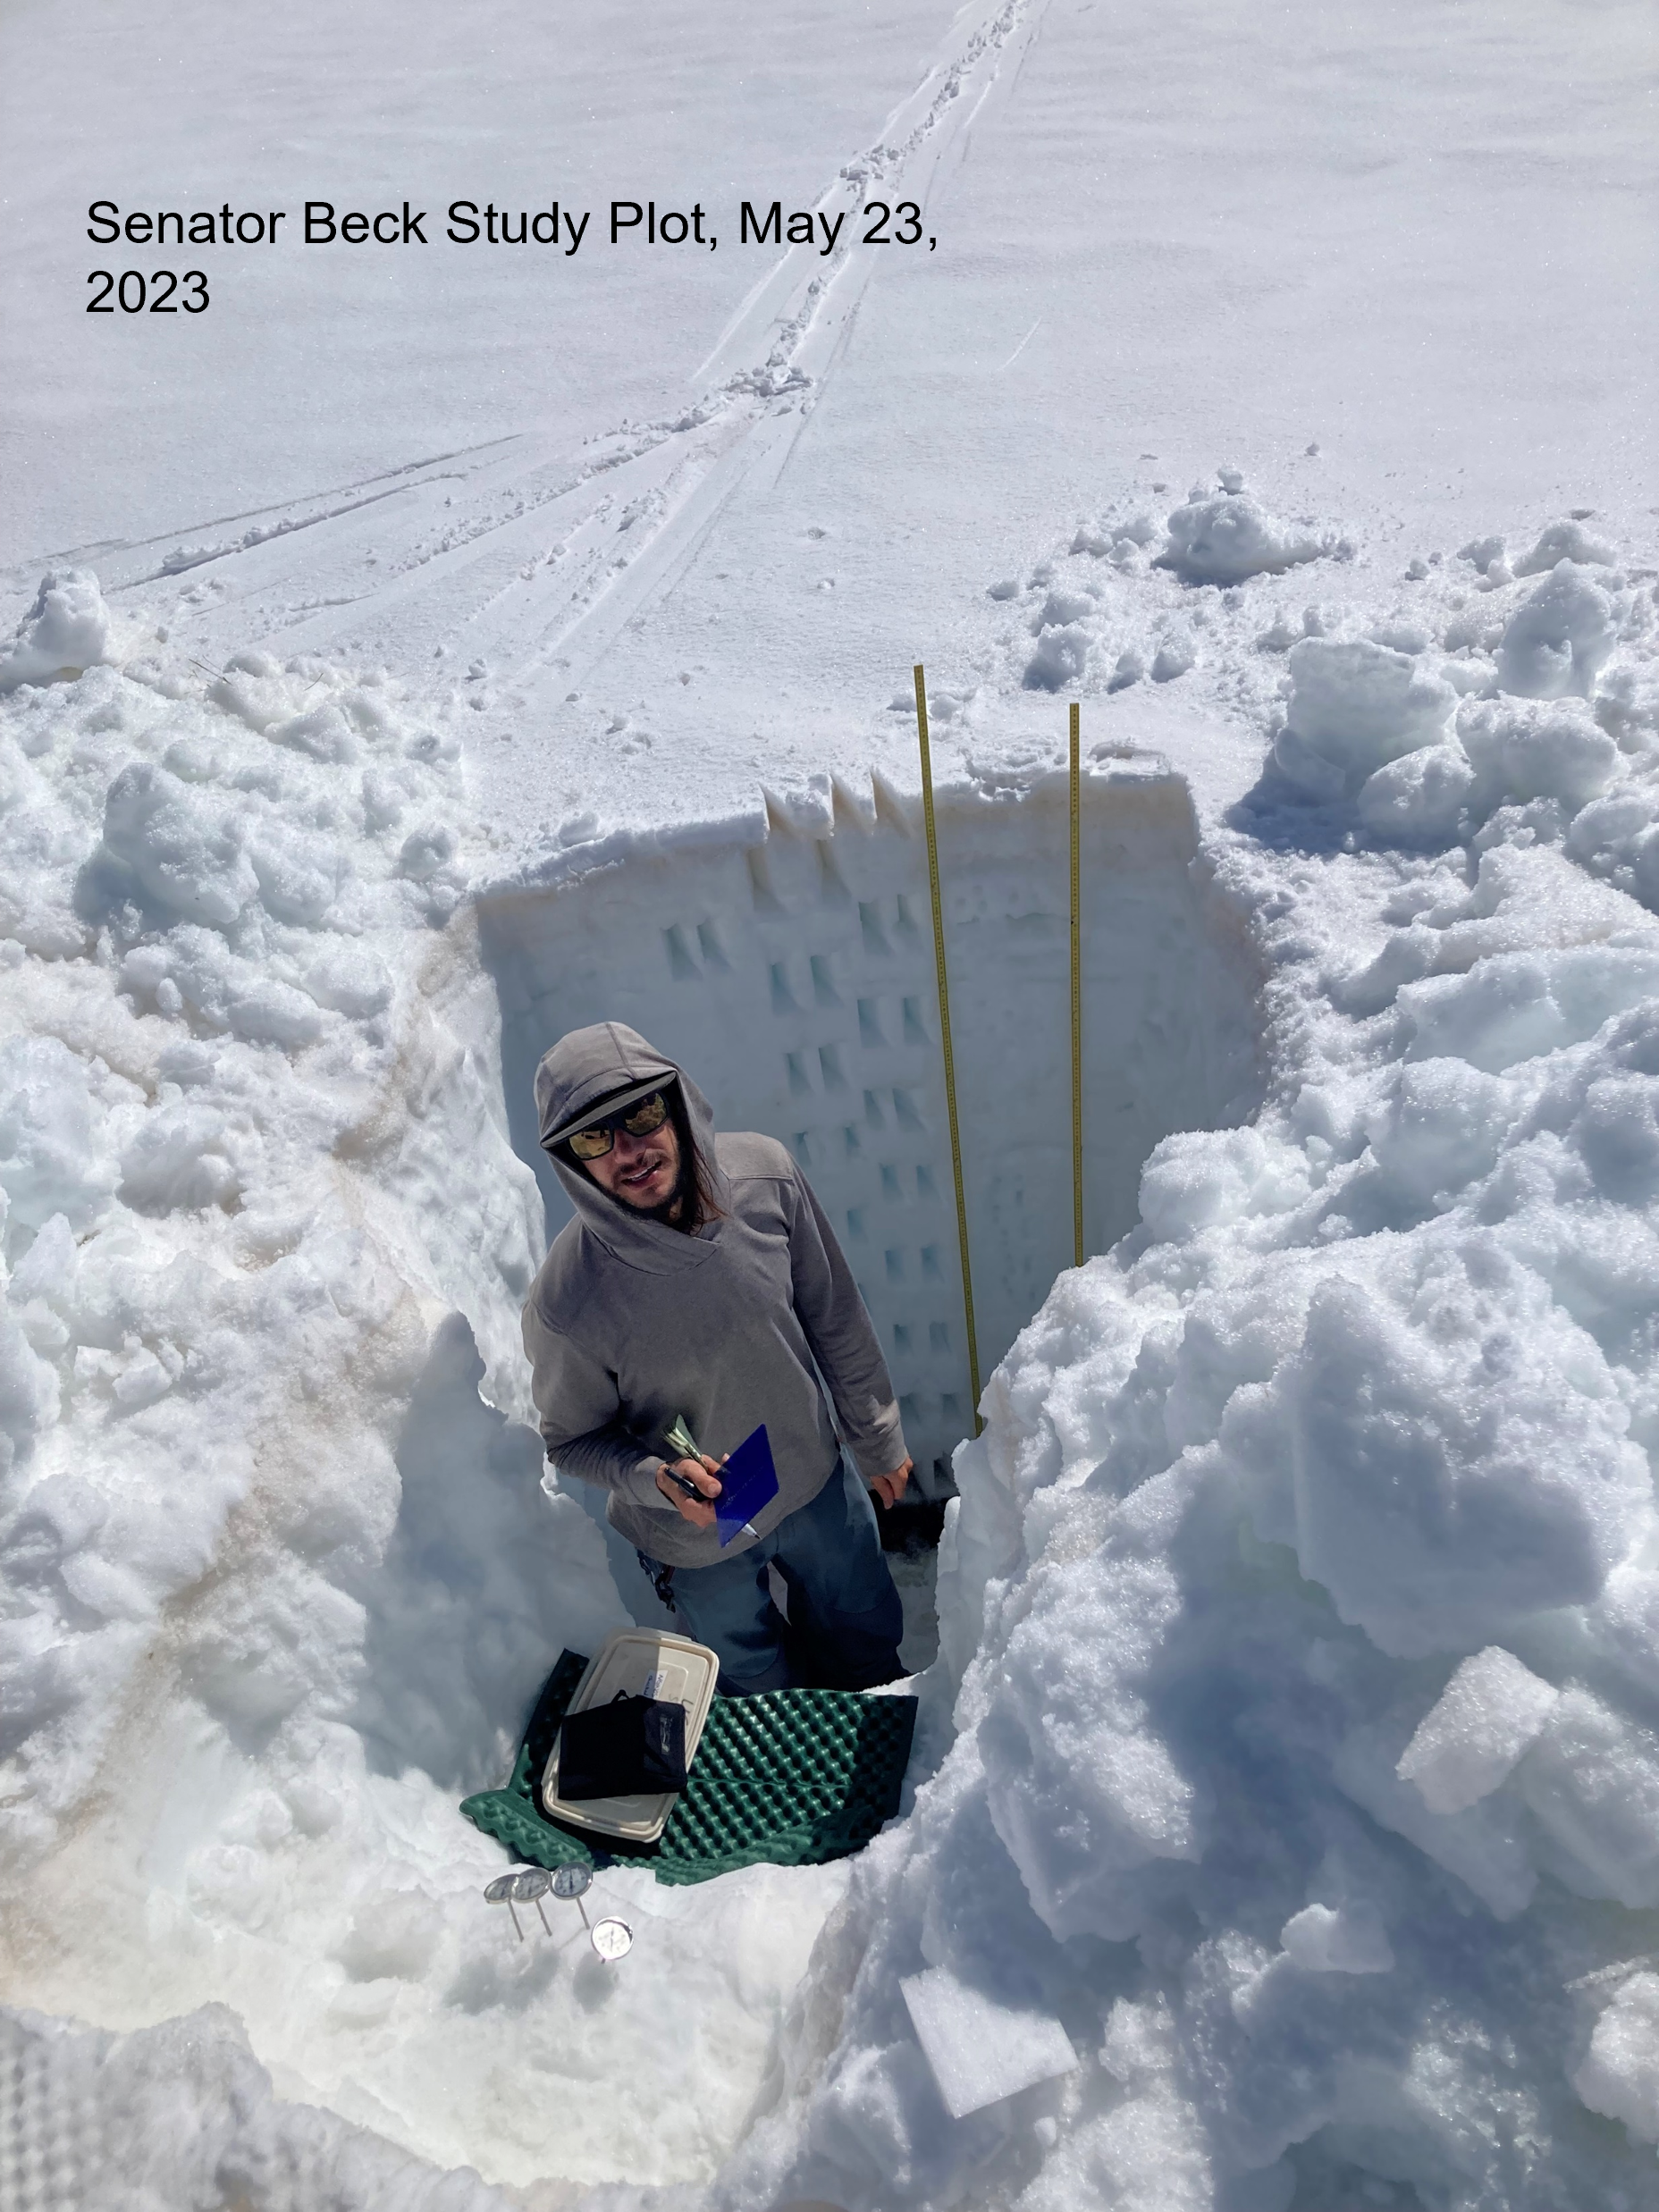
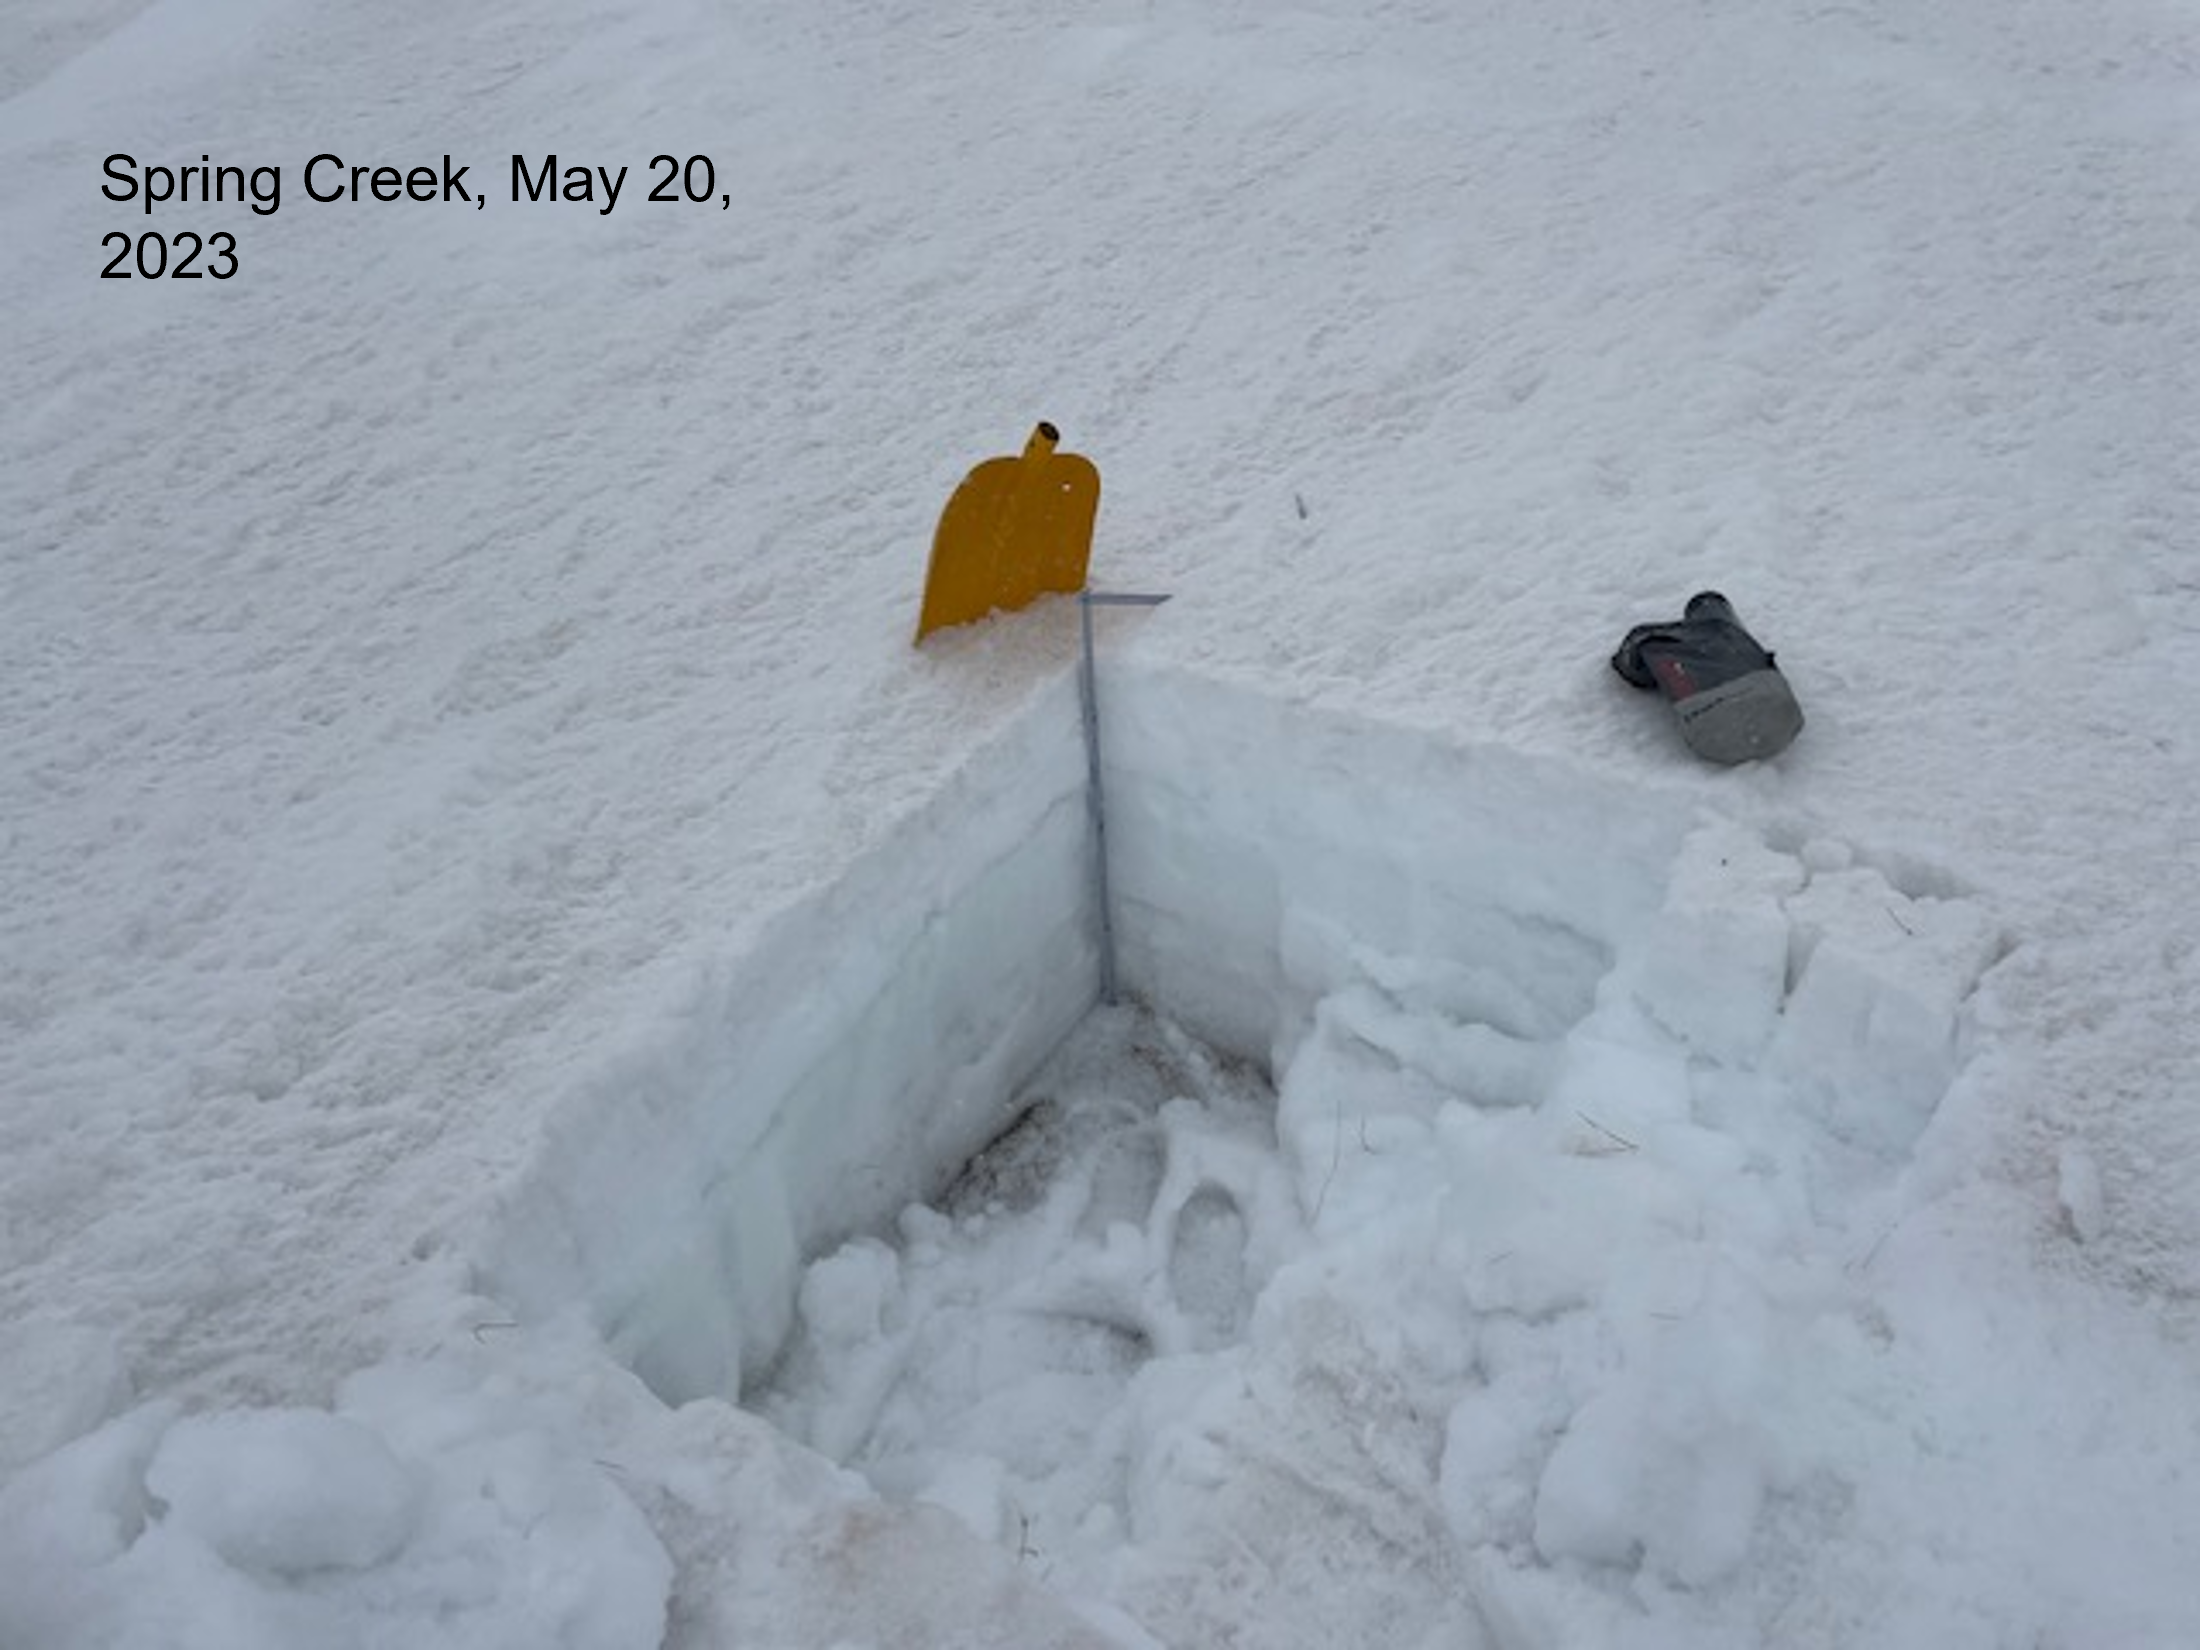
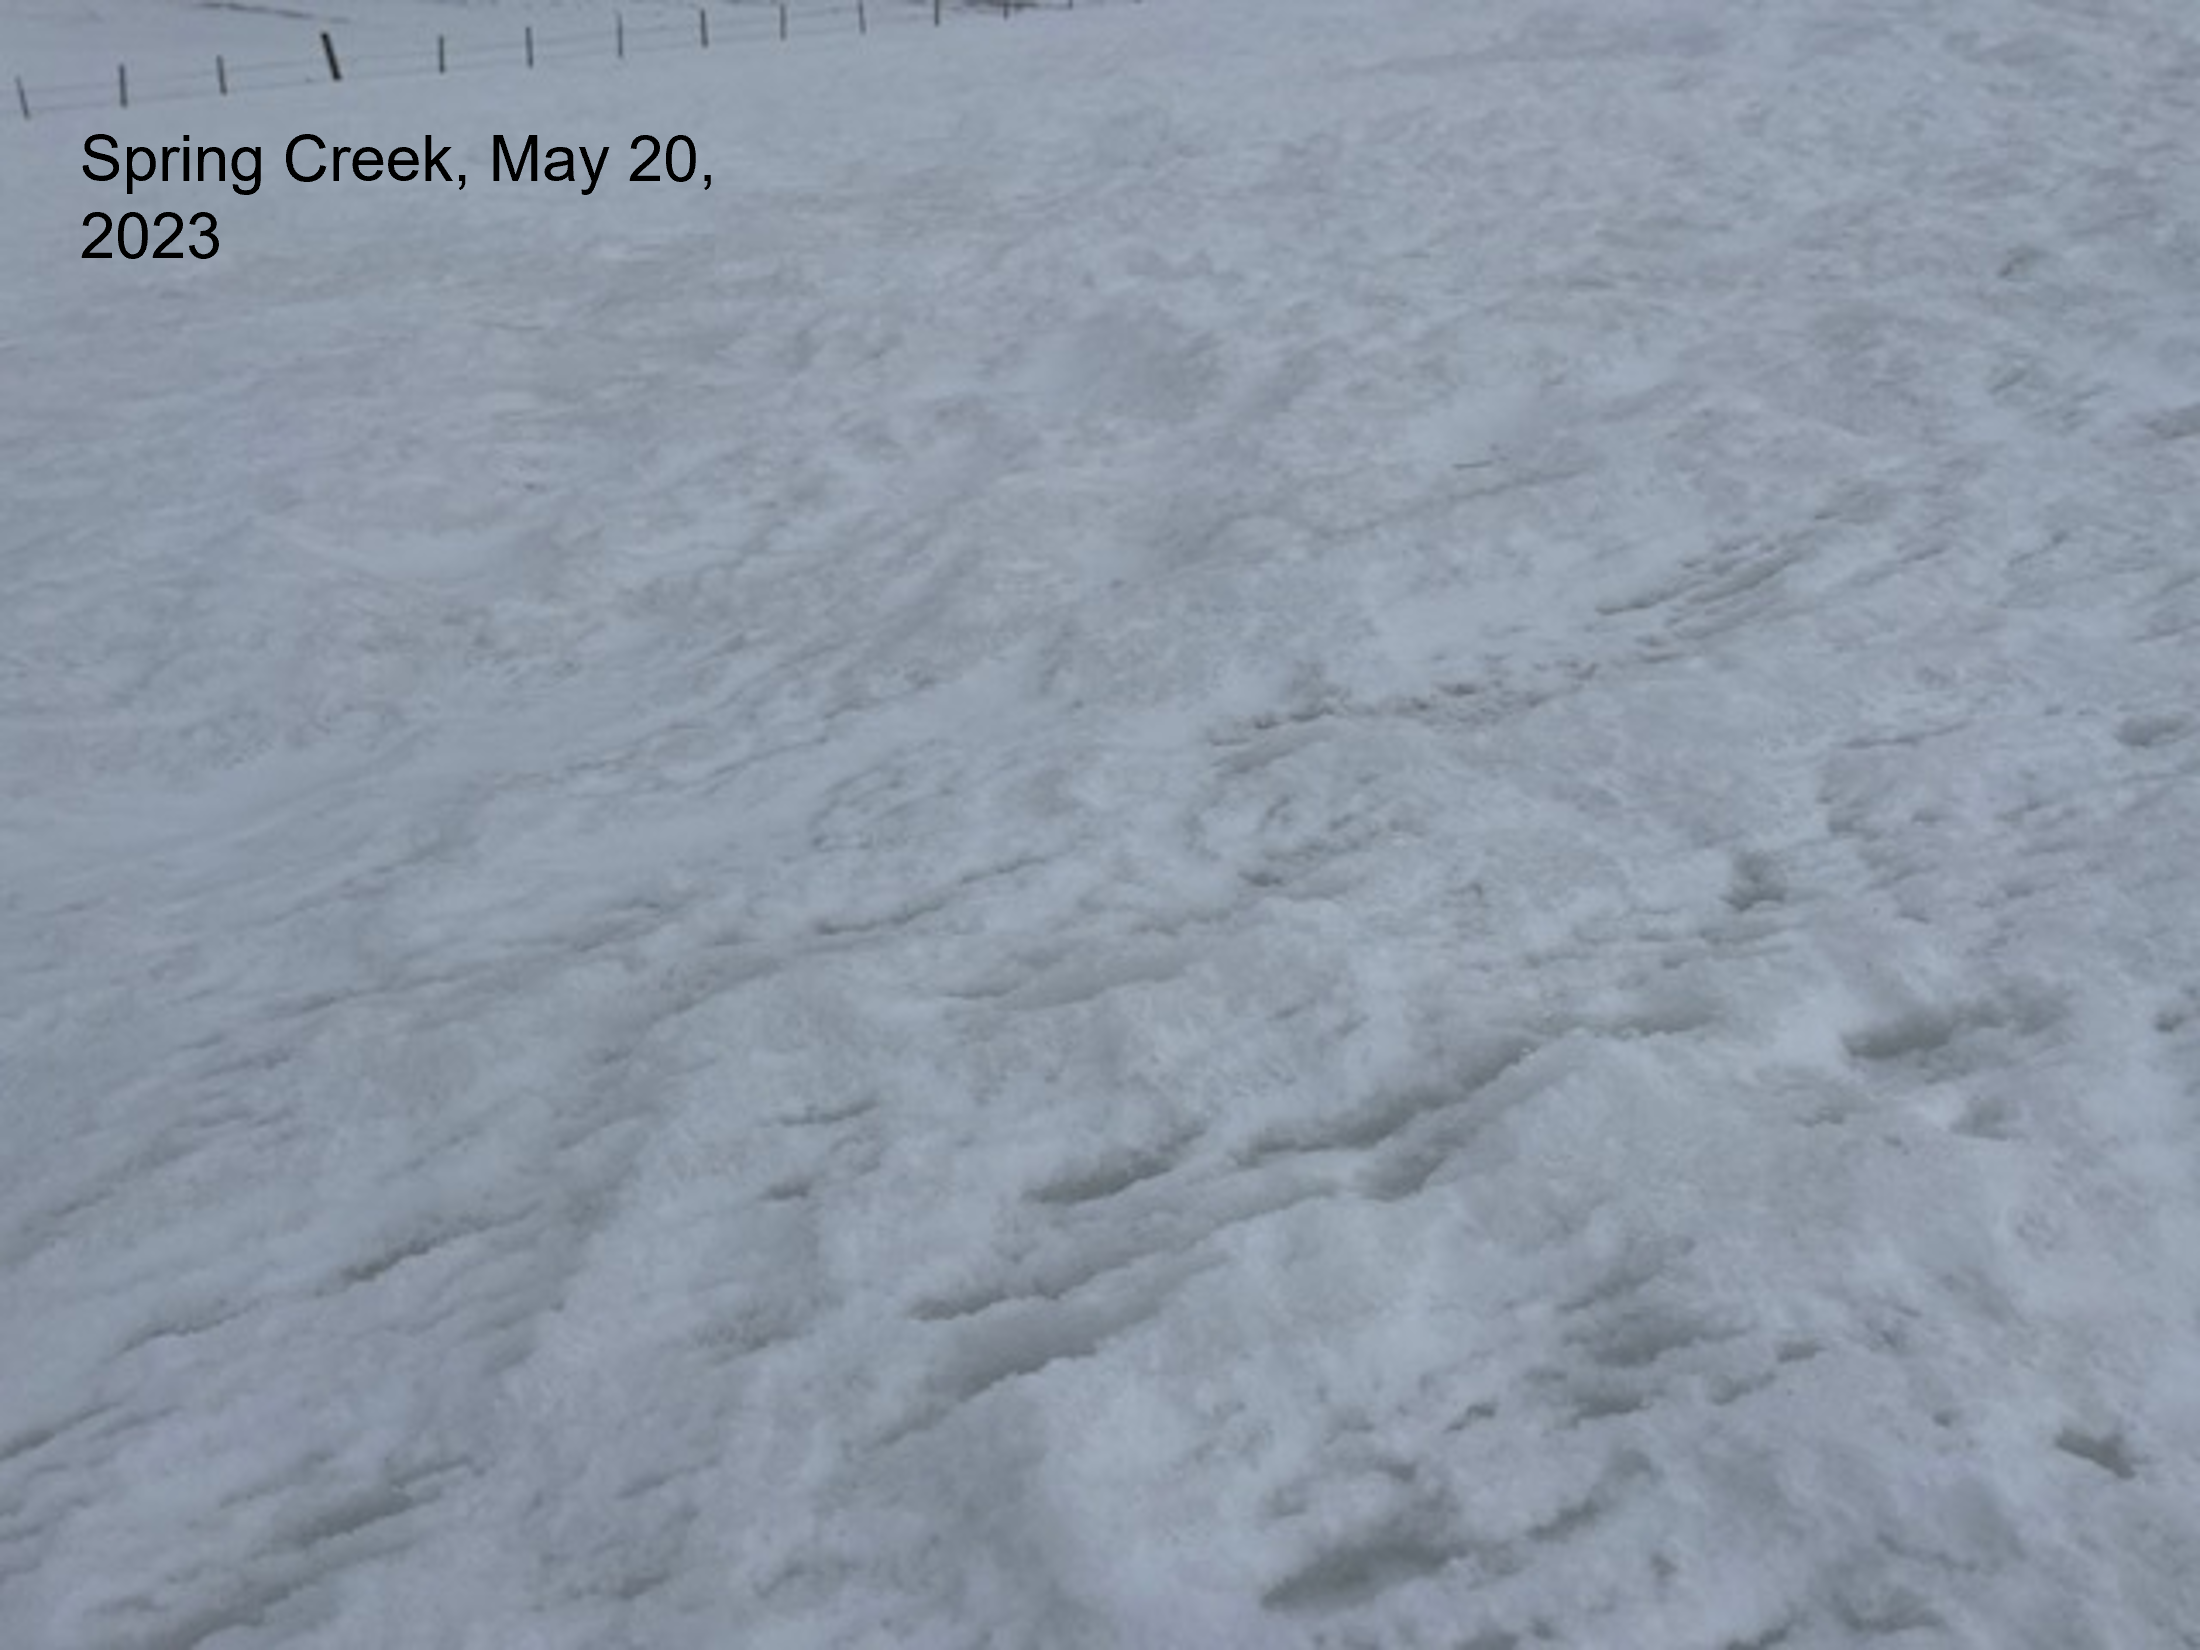
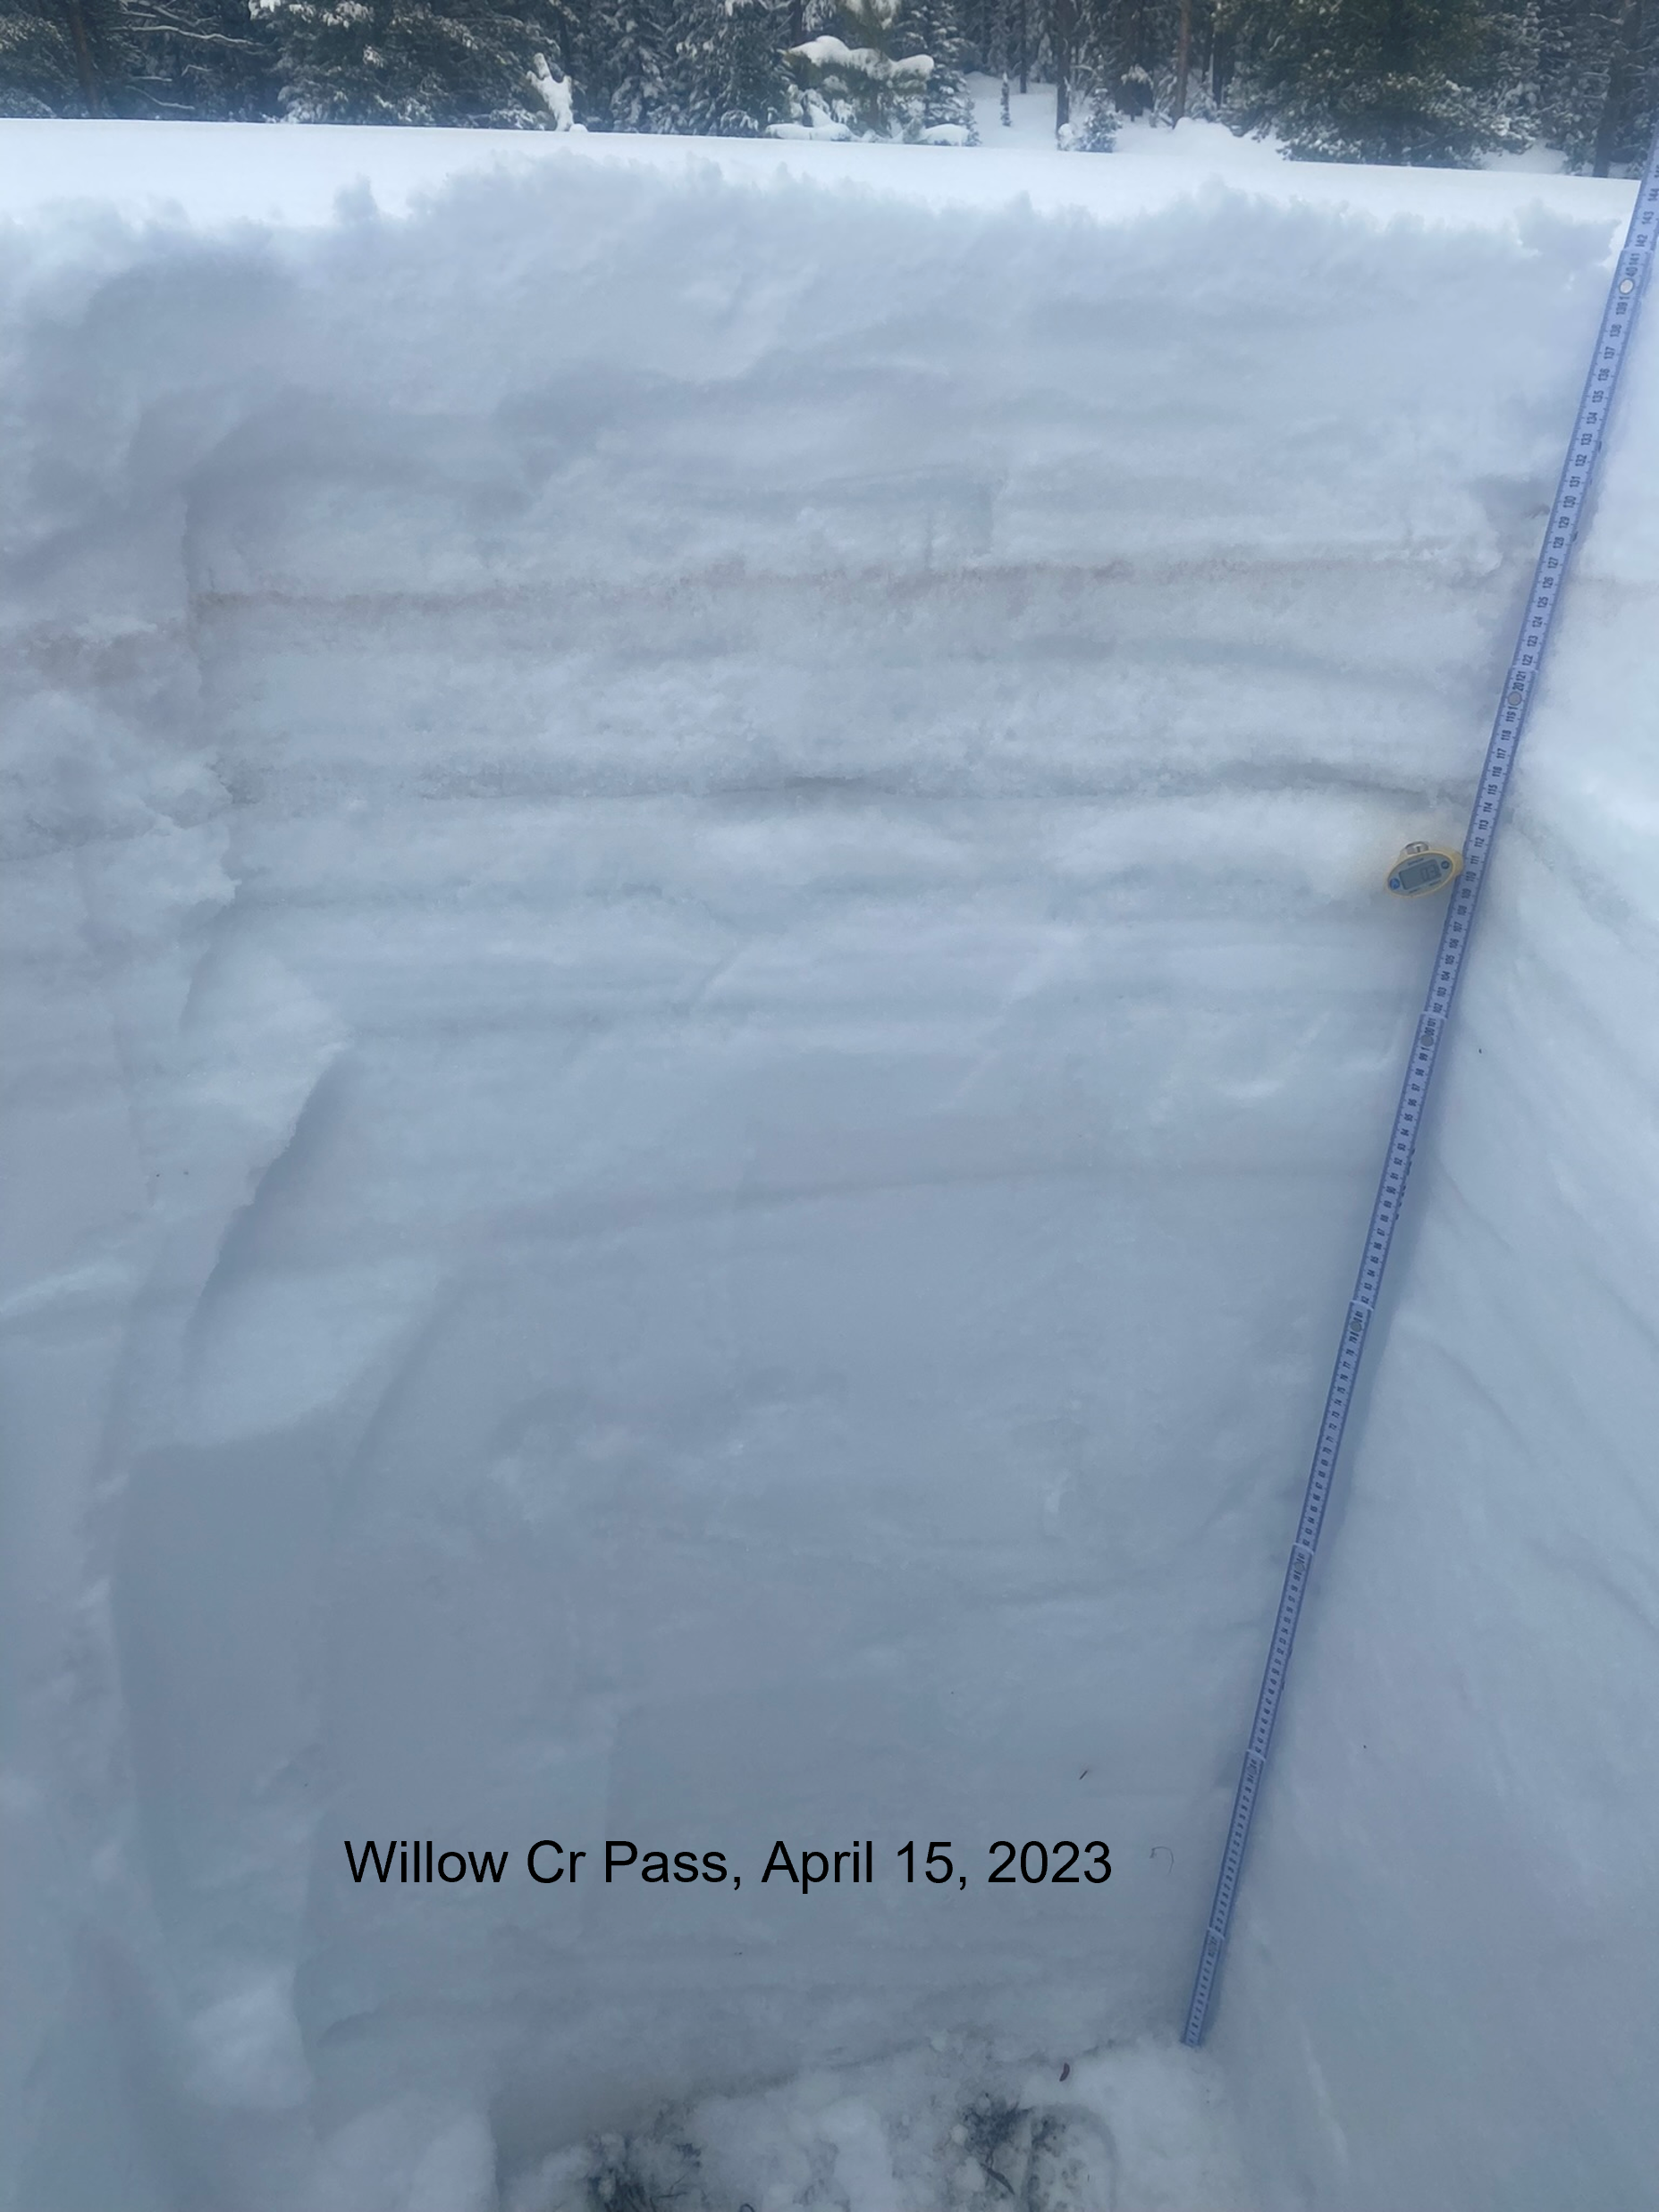
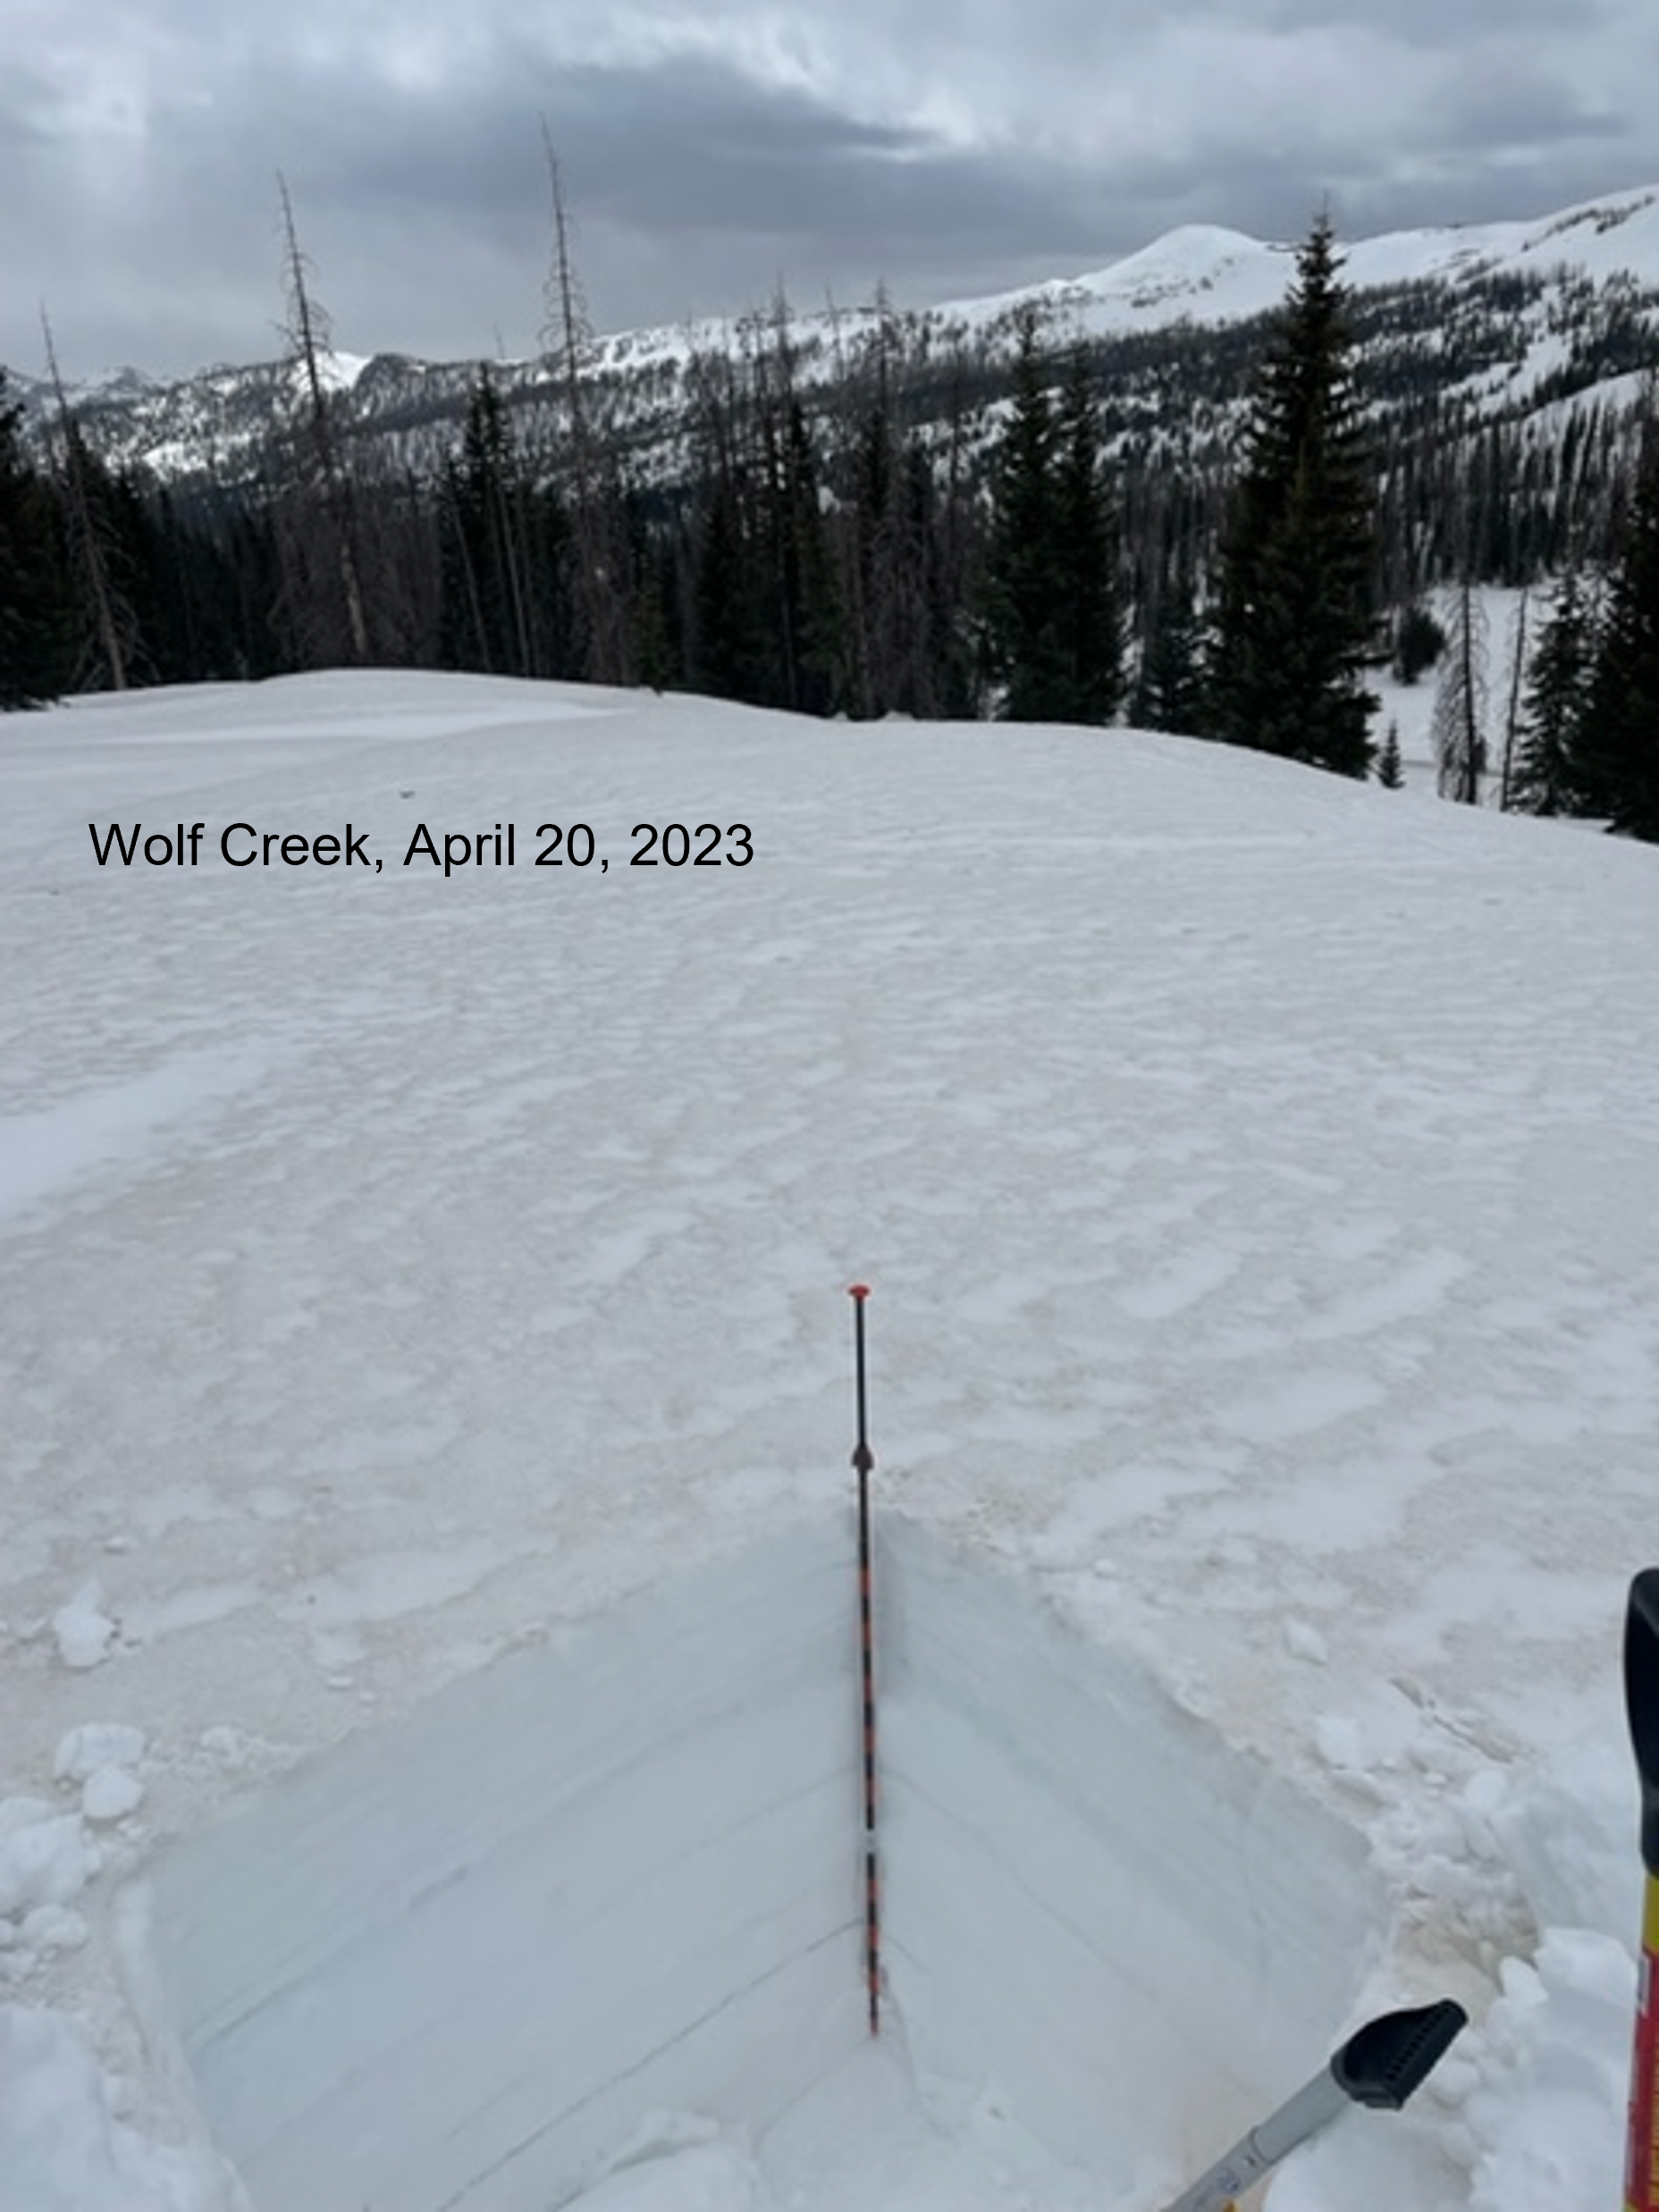
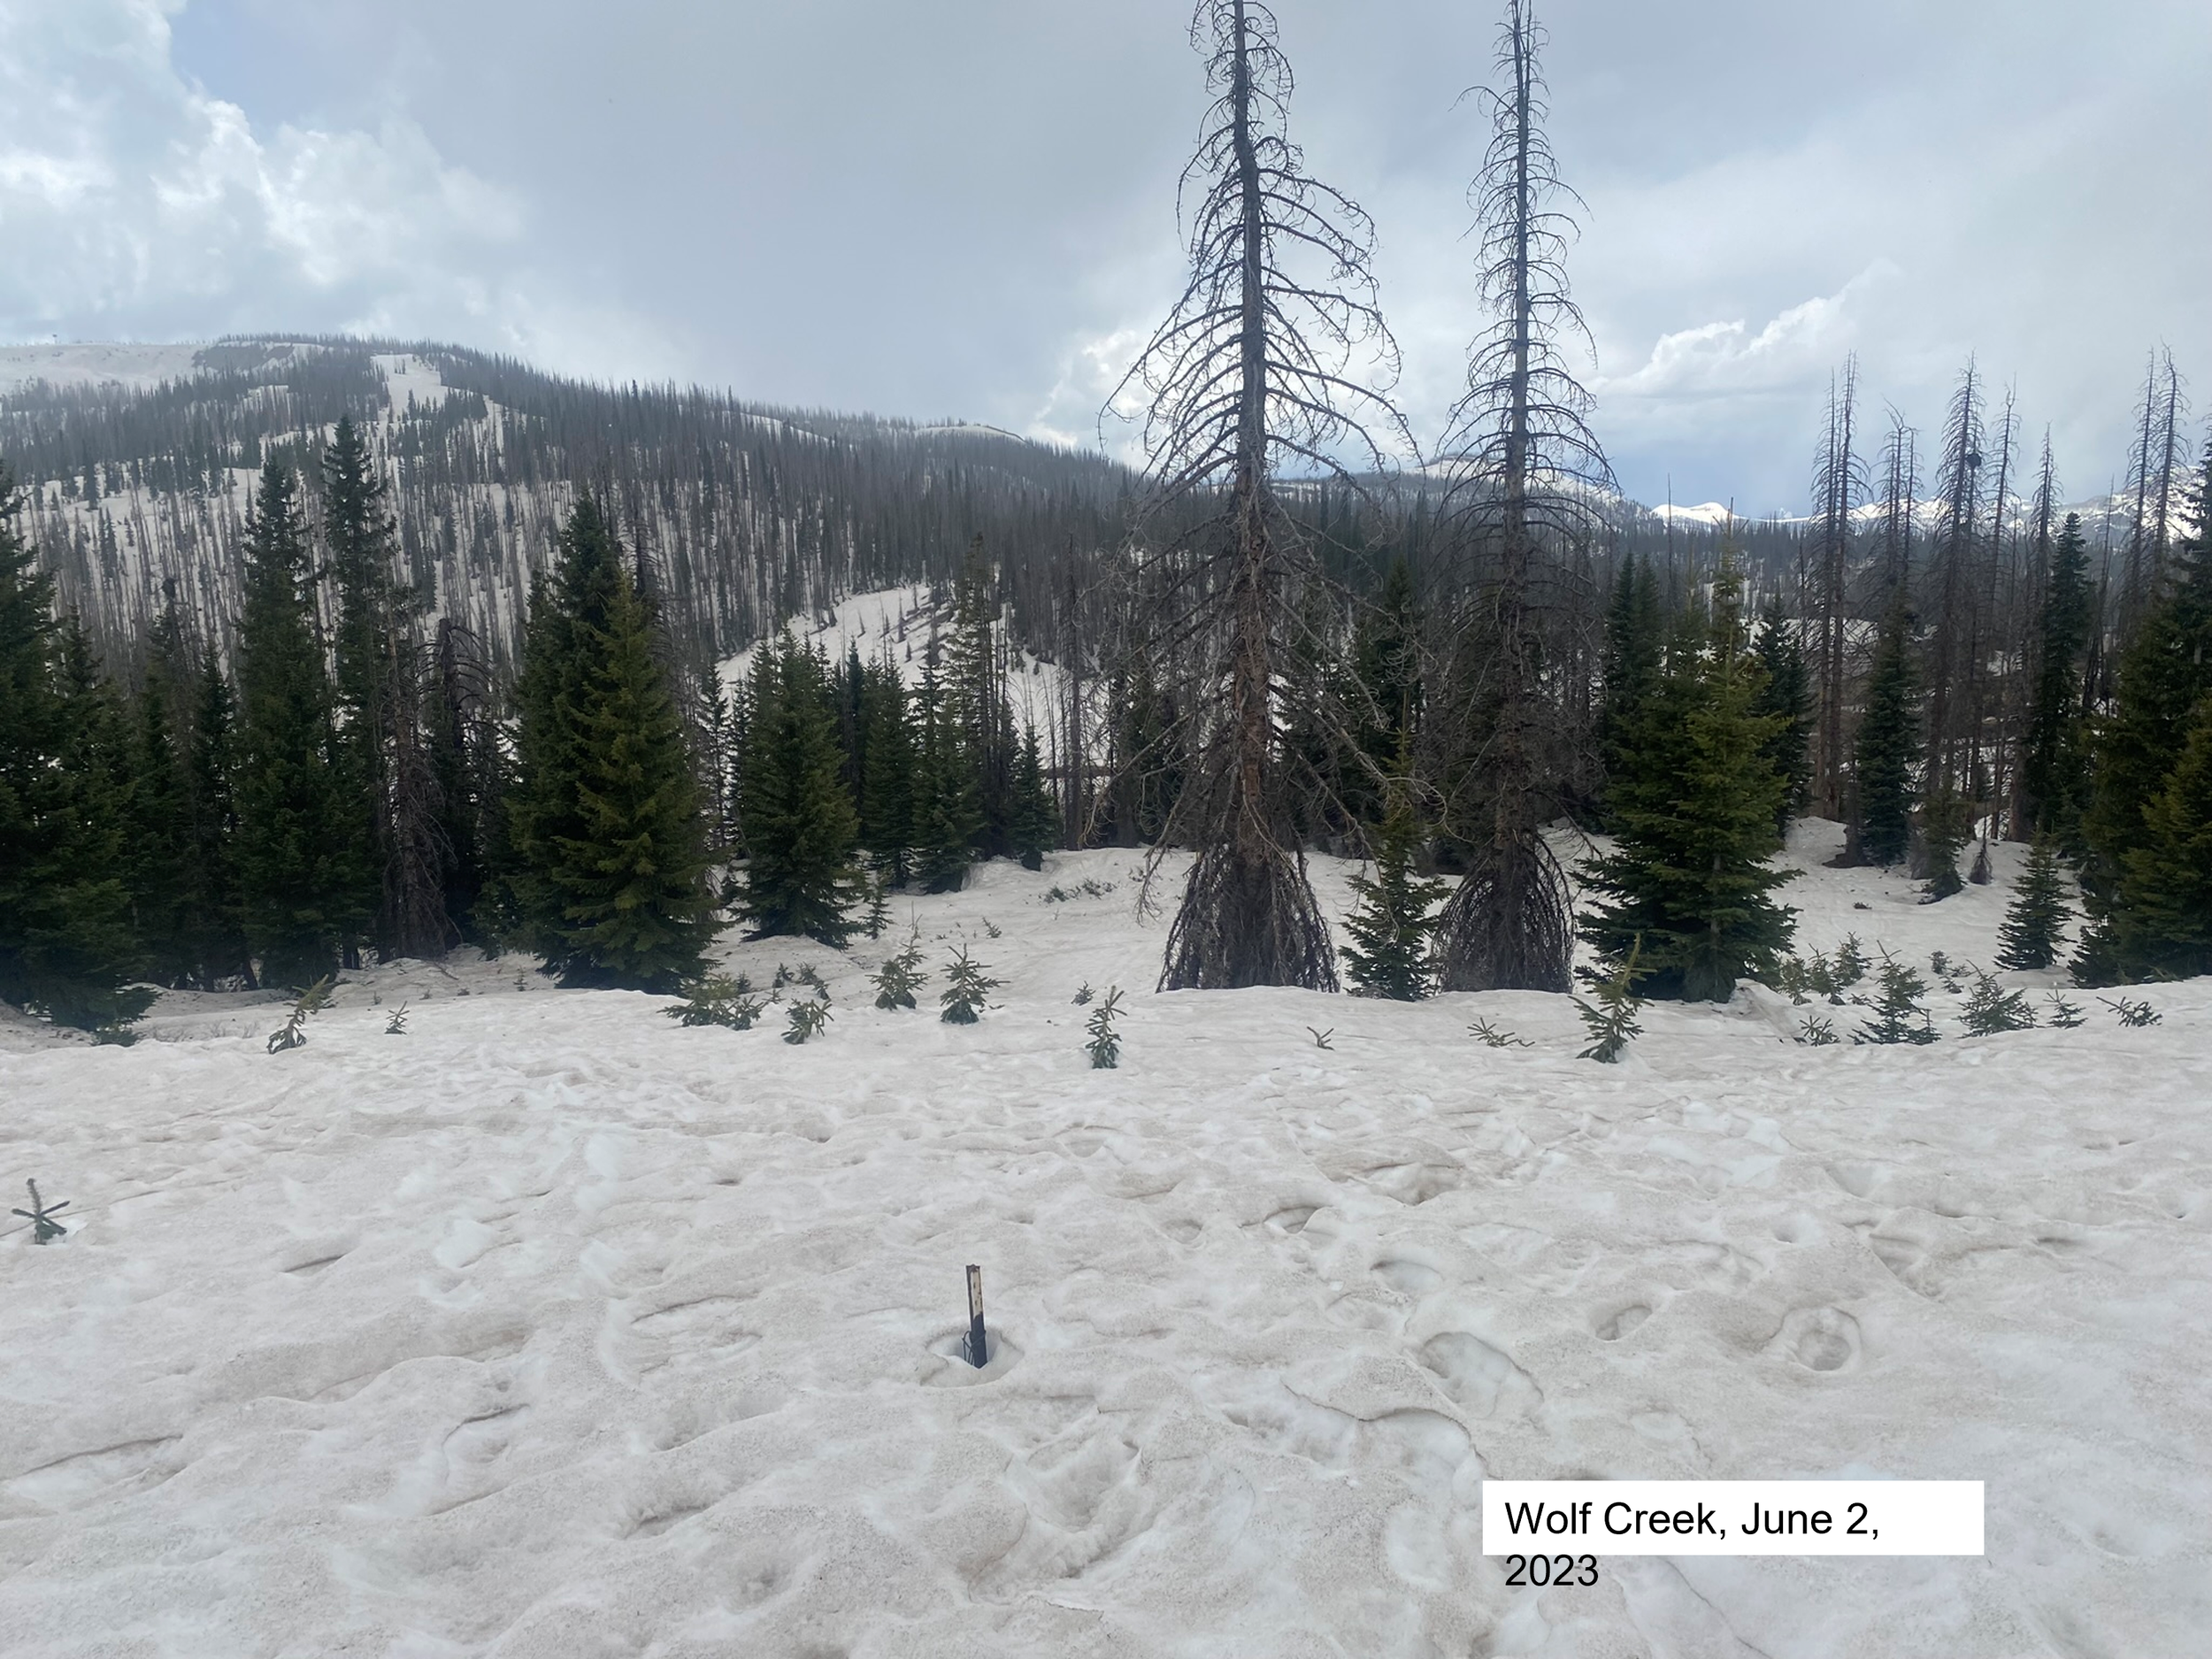
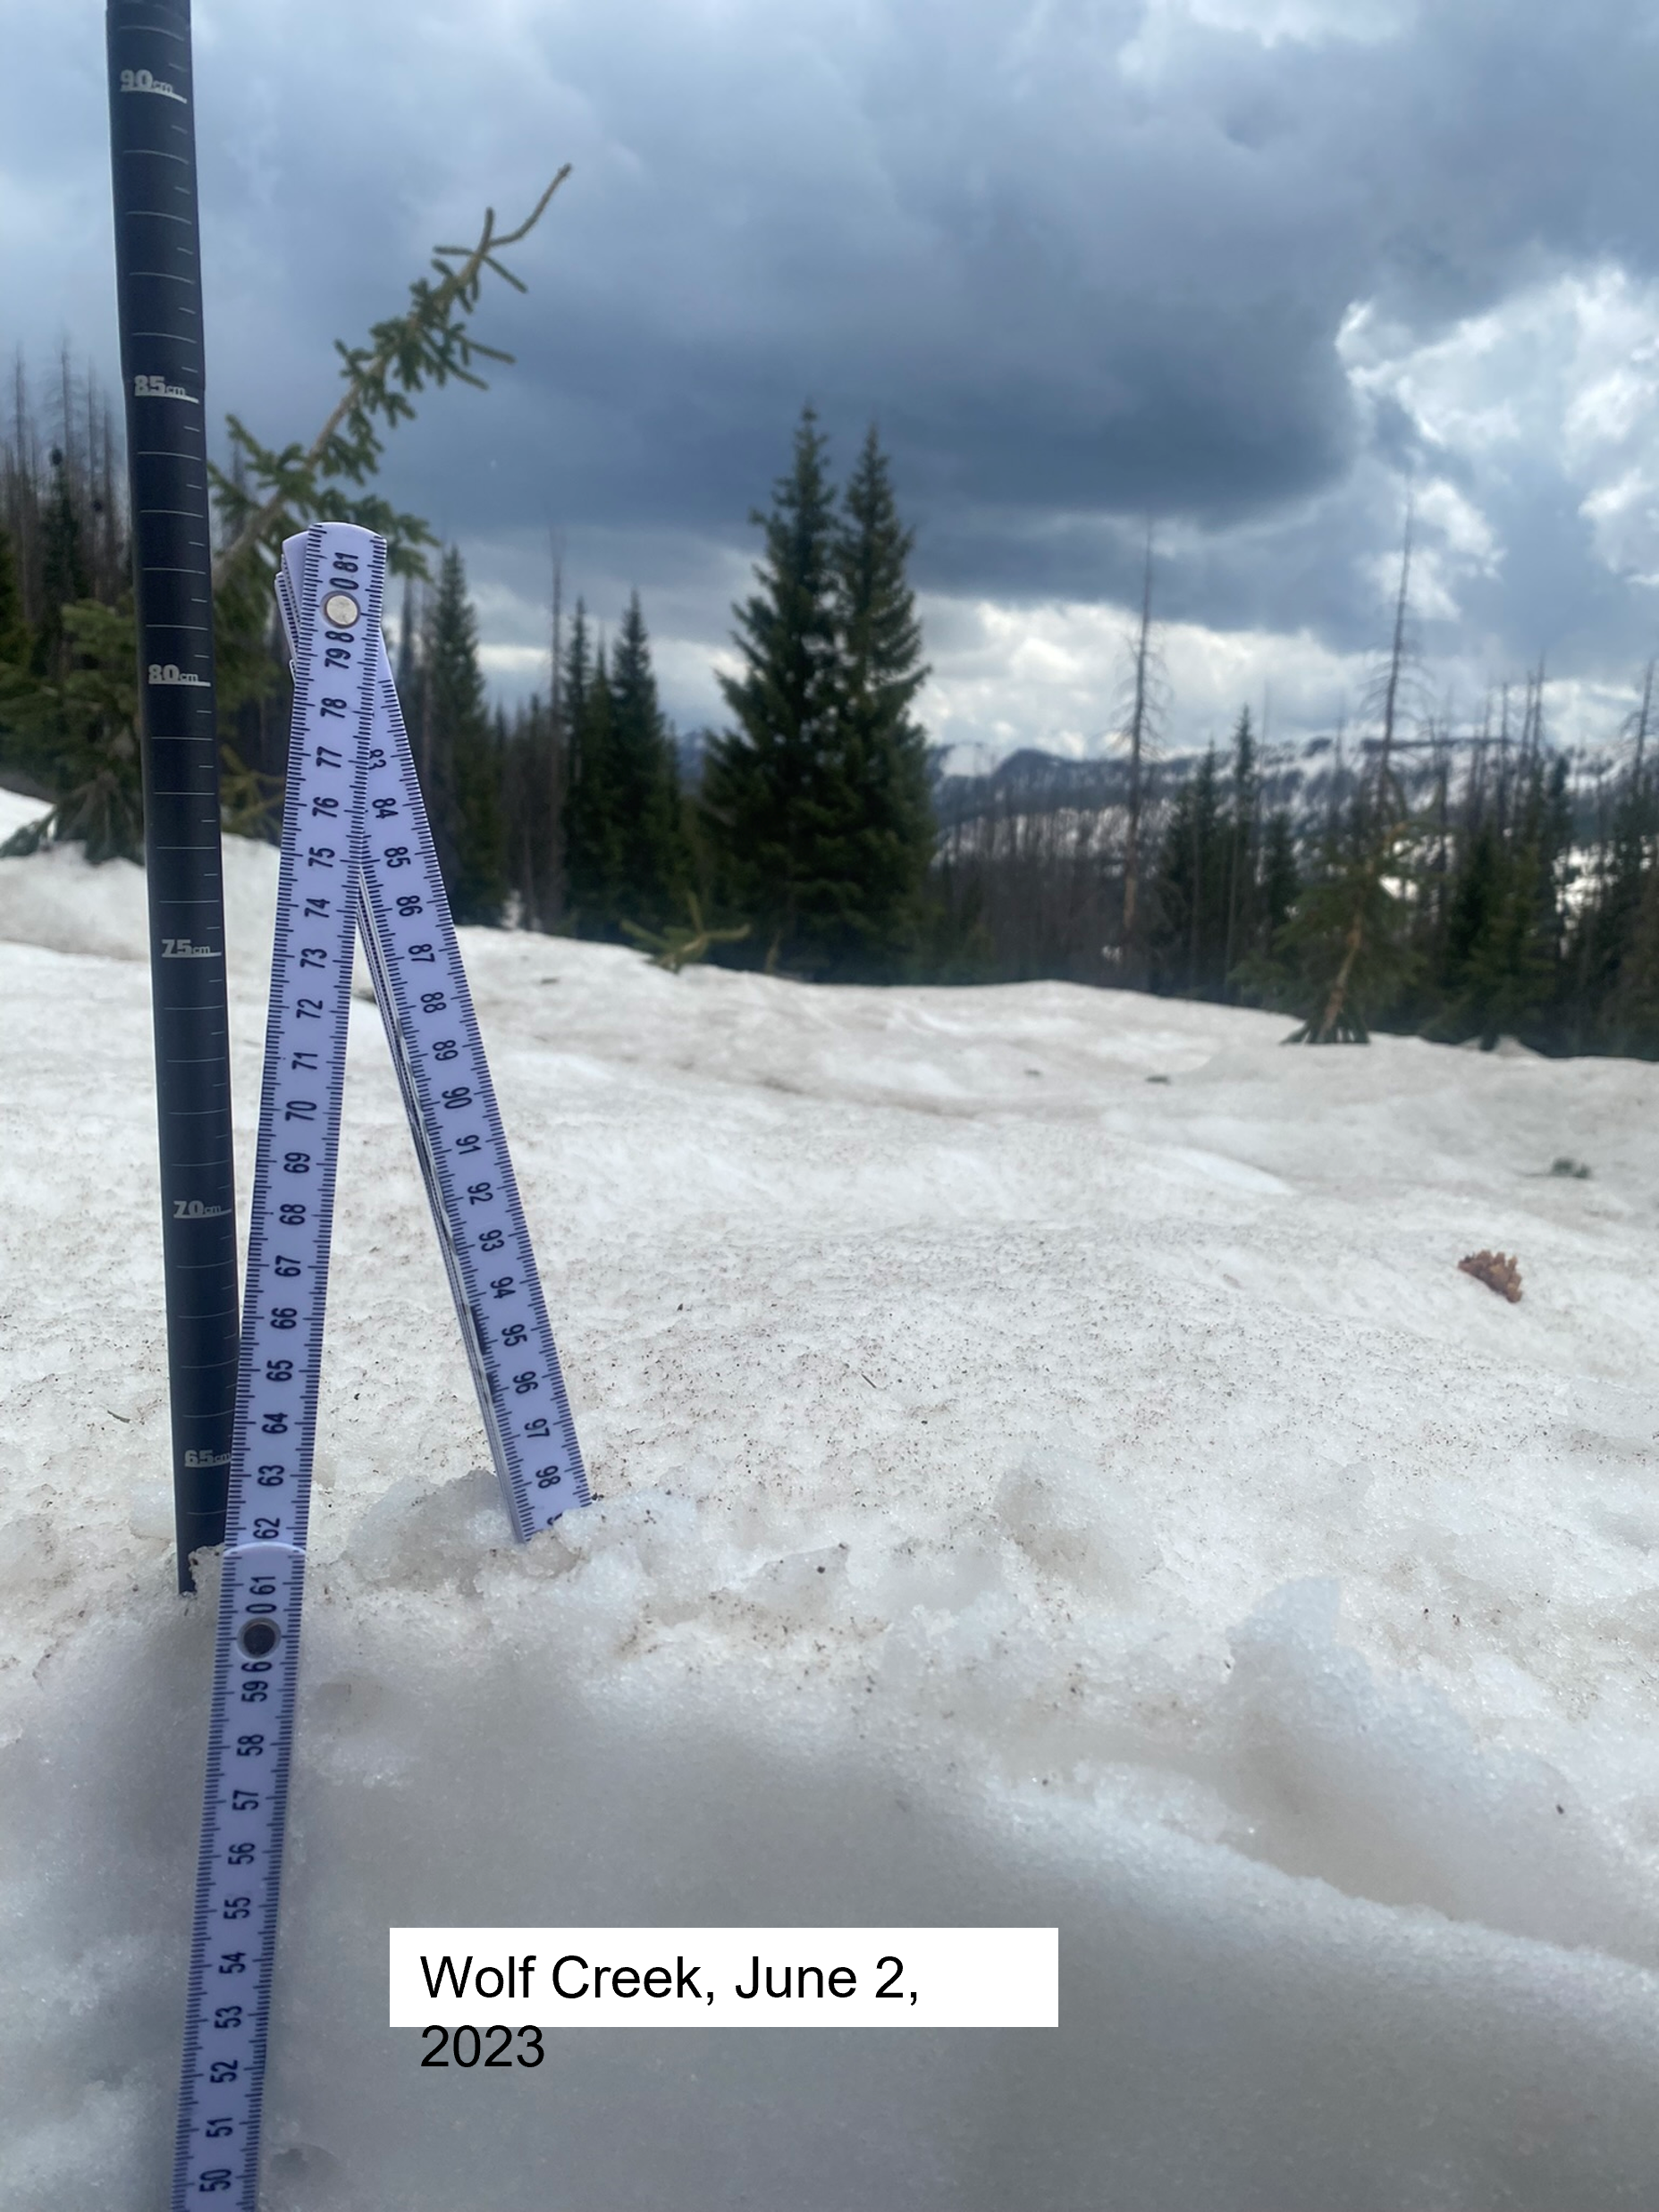
Below: Select photos of dust-on-snow and snowpack conditions for winter WY2023.


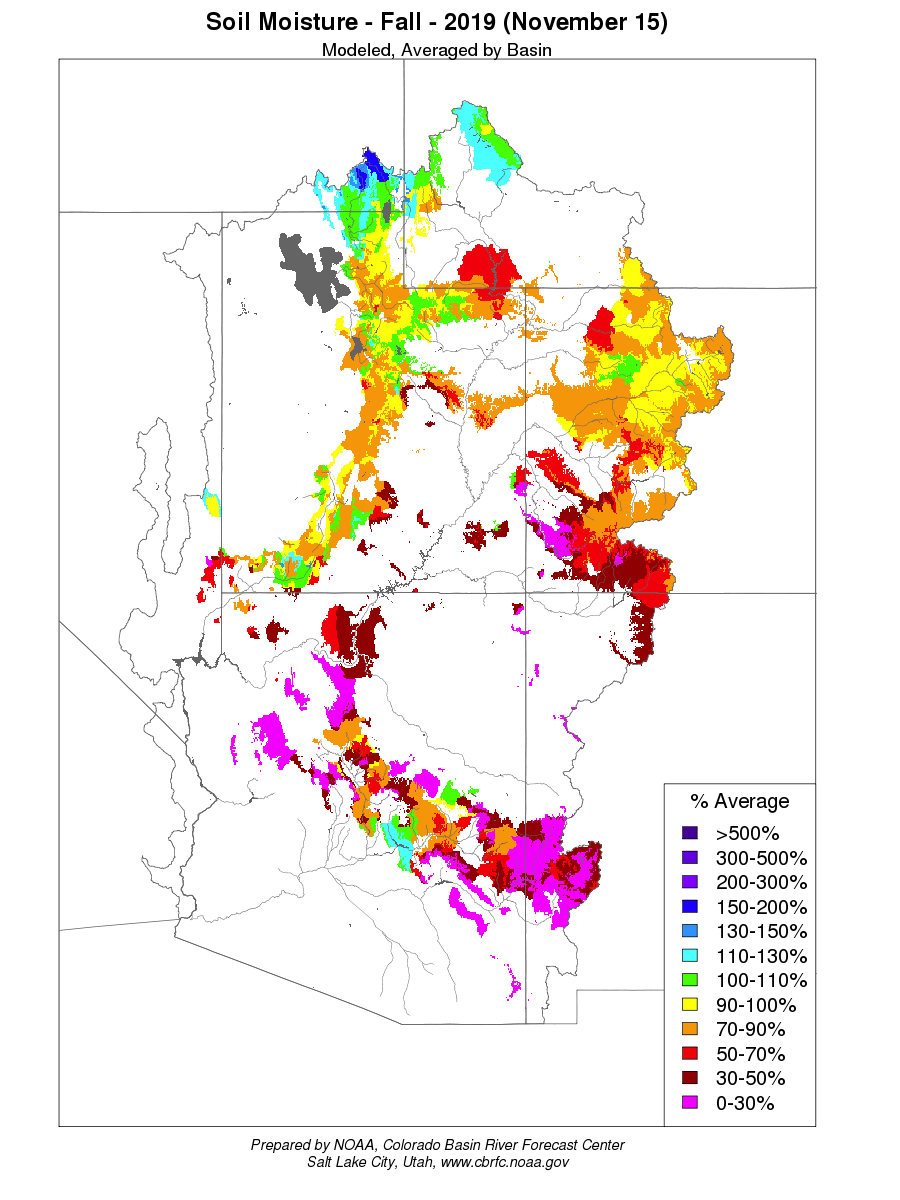
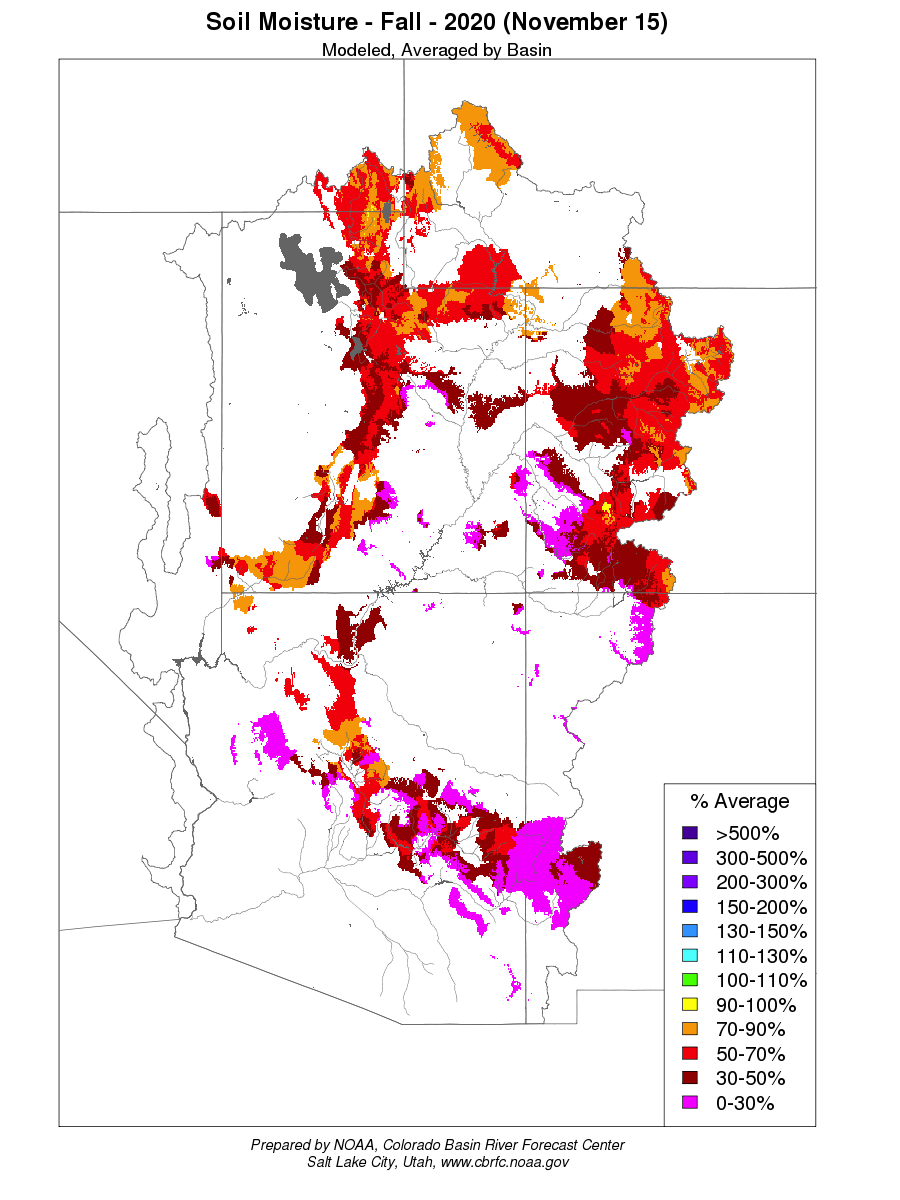
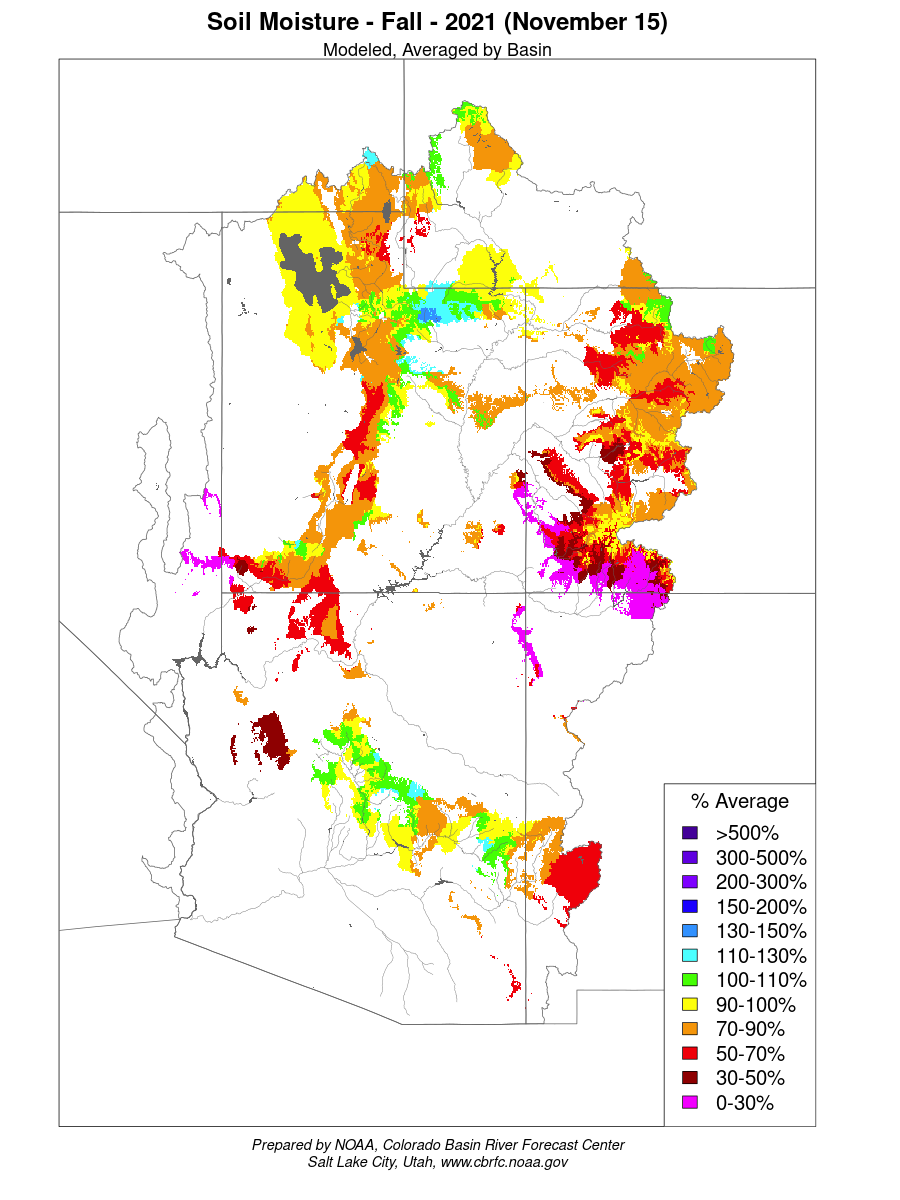
Below: Soil moisture conditions going into winter for the last four years. The beginning of WY2023 soil moisture was better than the previous few years due to improved monsoon activity and a few early season storms. Healthy soil moisture conditions generally improve the likelihood of more efficient snowmelt runoff.

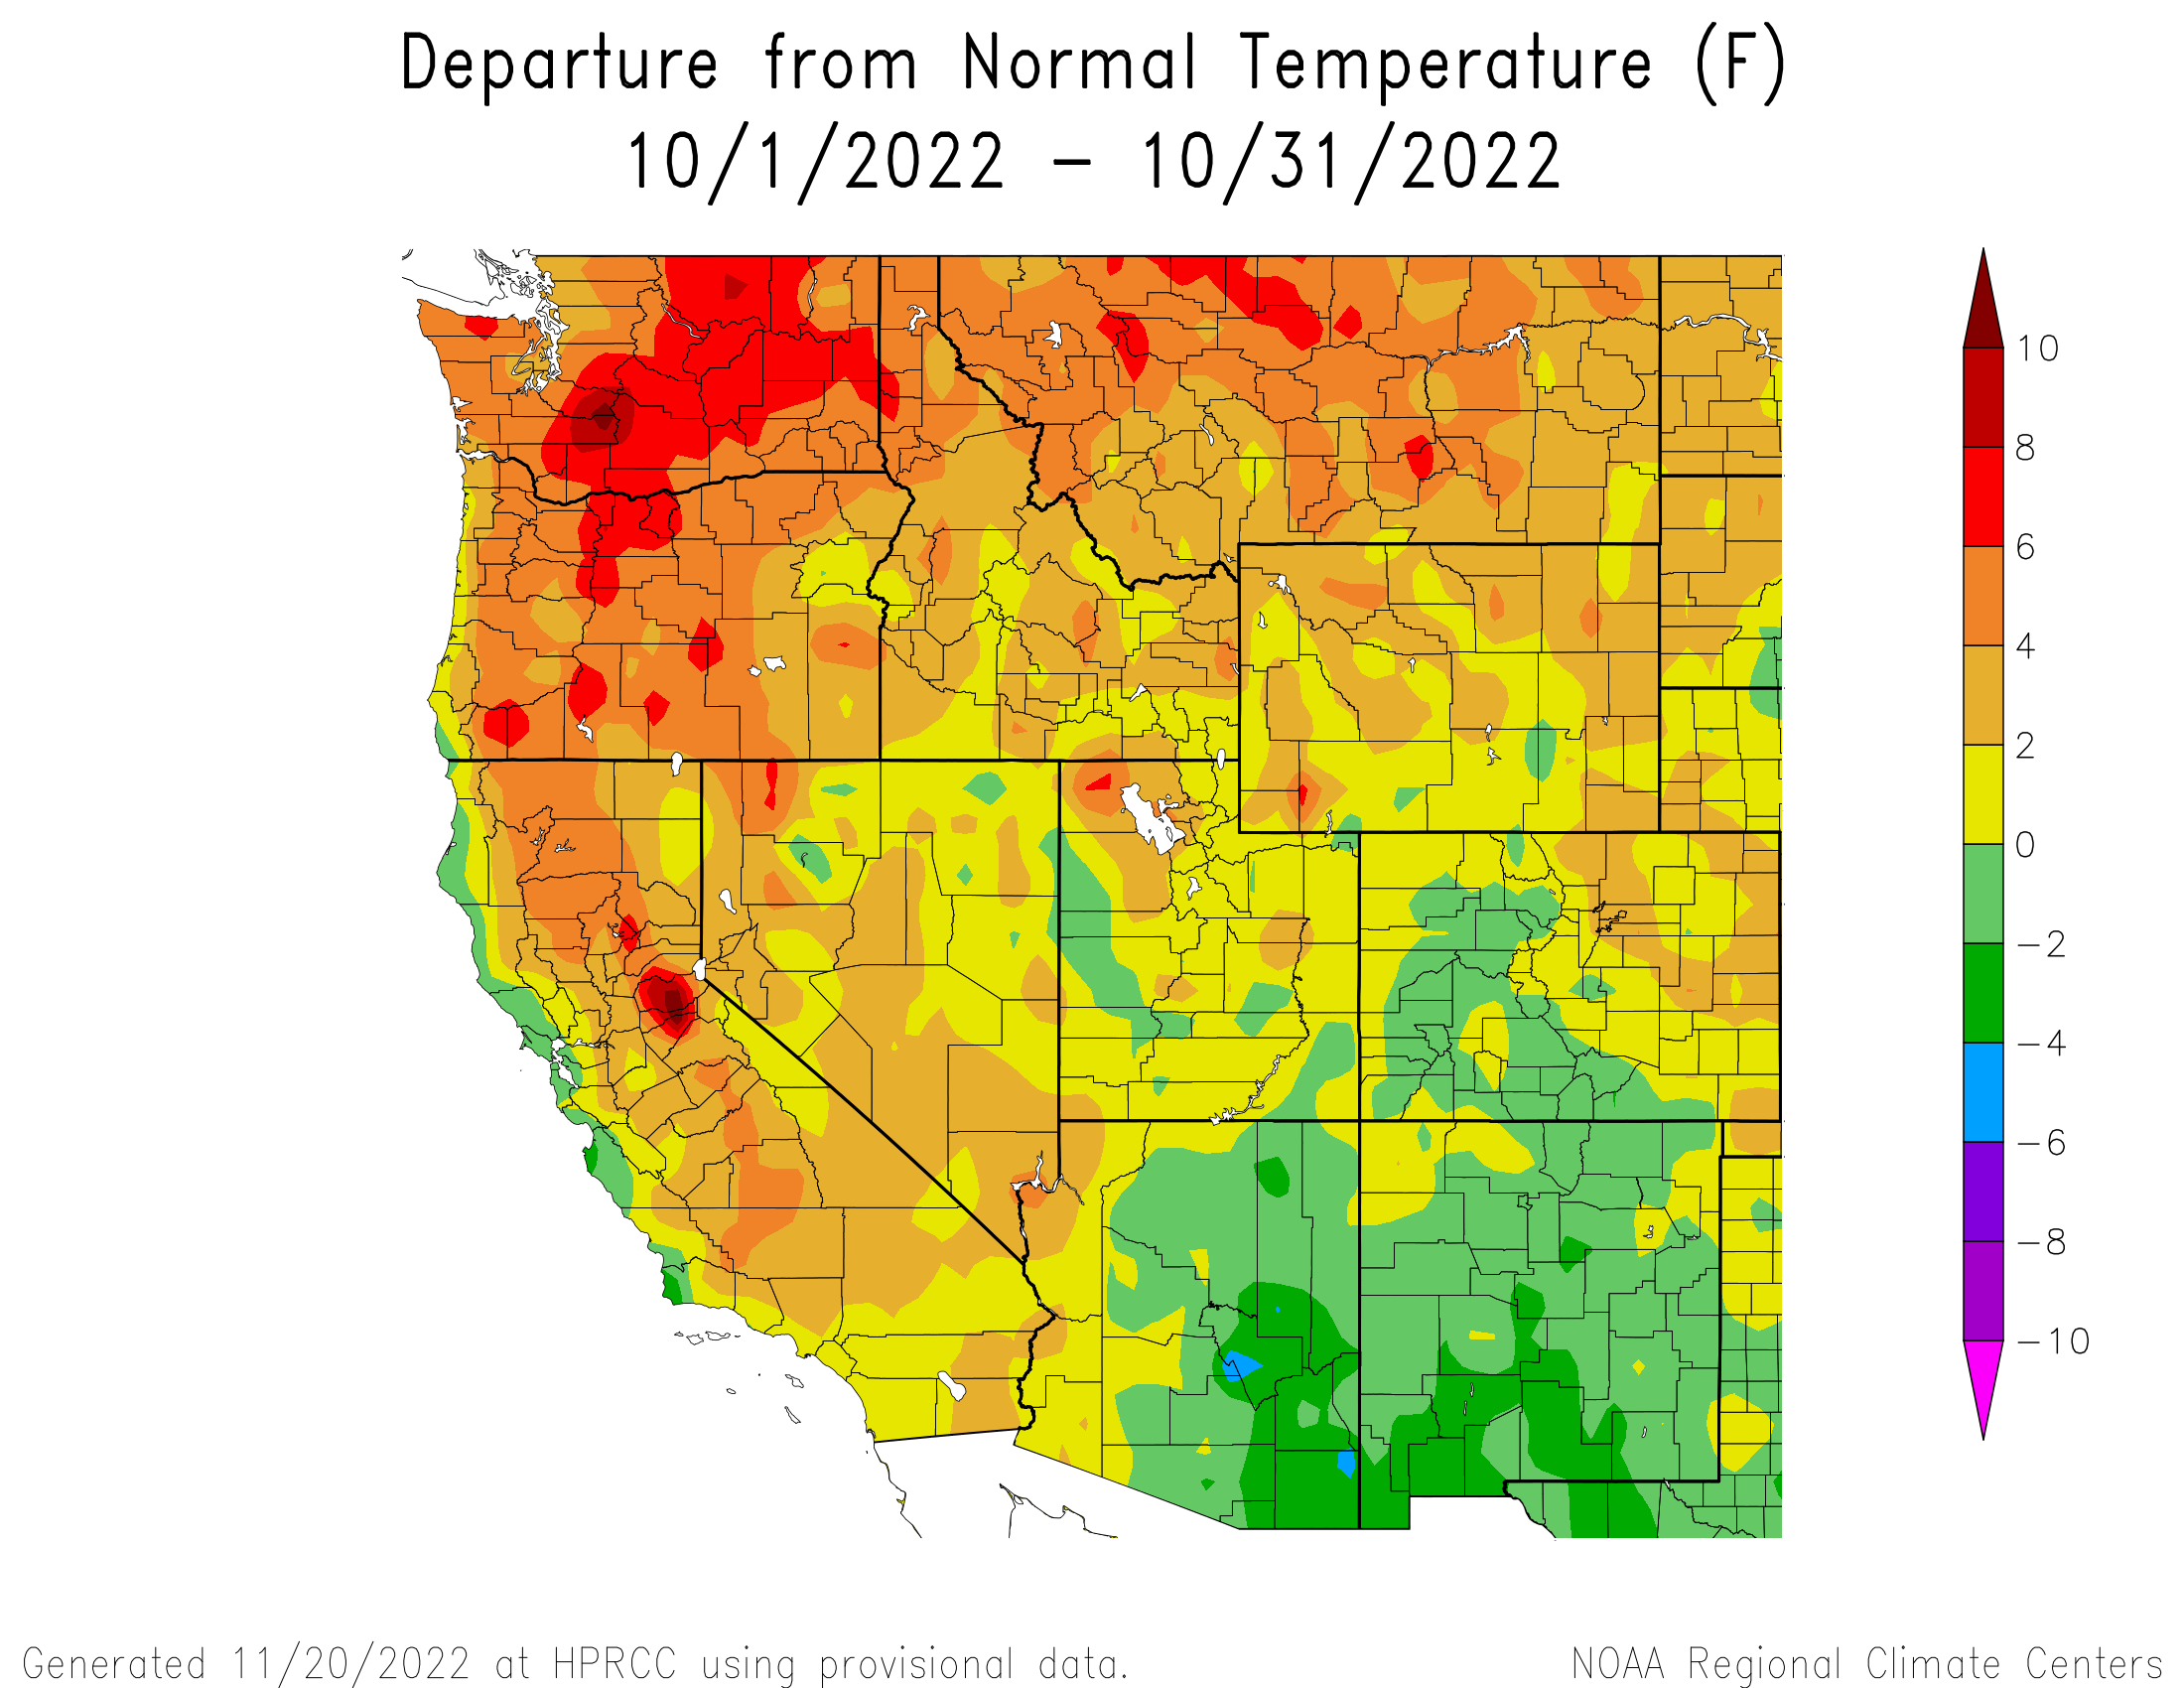


Above: From the outset of water year 2023 precipitation and snow accumulation started off solidly and kept improving as the season progressed. Most major basins saw 150%-400% of normal precipitation in March. The summer monsoons were very late in arriving (mid-August as of this writing) have recently become more active, particularly Southwest Colorado. The Front Range enjoyed a wet June and well-timed rain events in July/August, enough to keep vegetation mostly green, a nice change from recent summers.

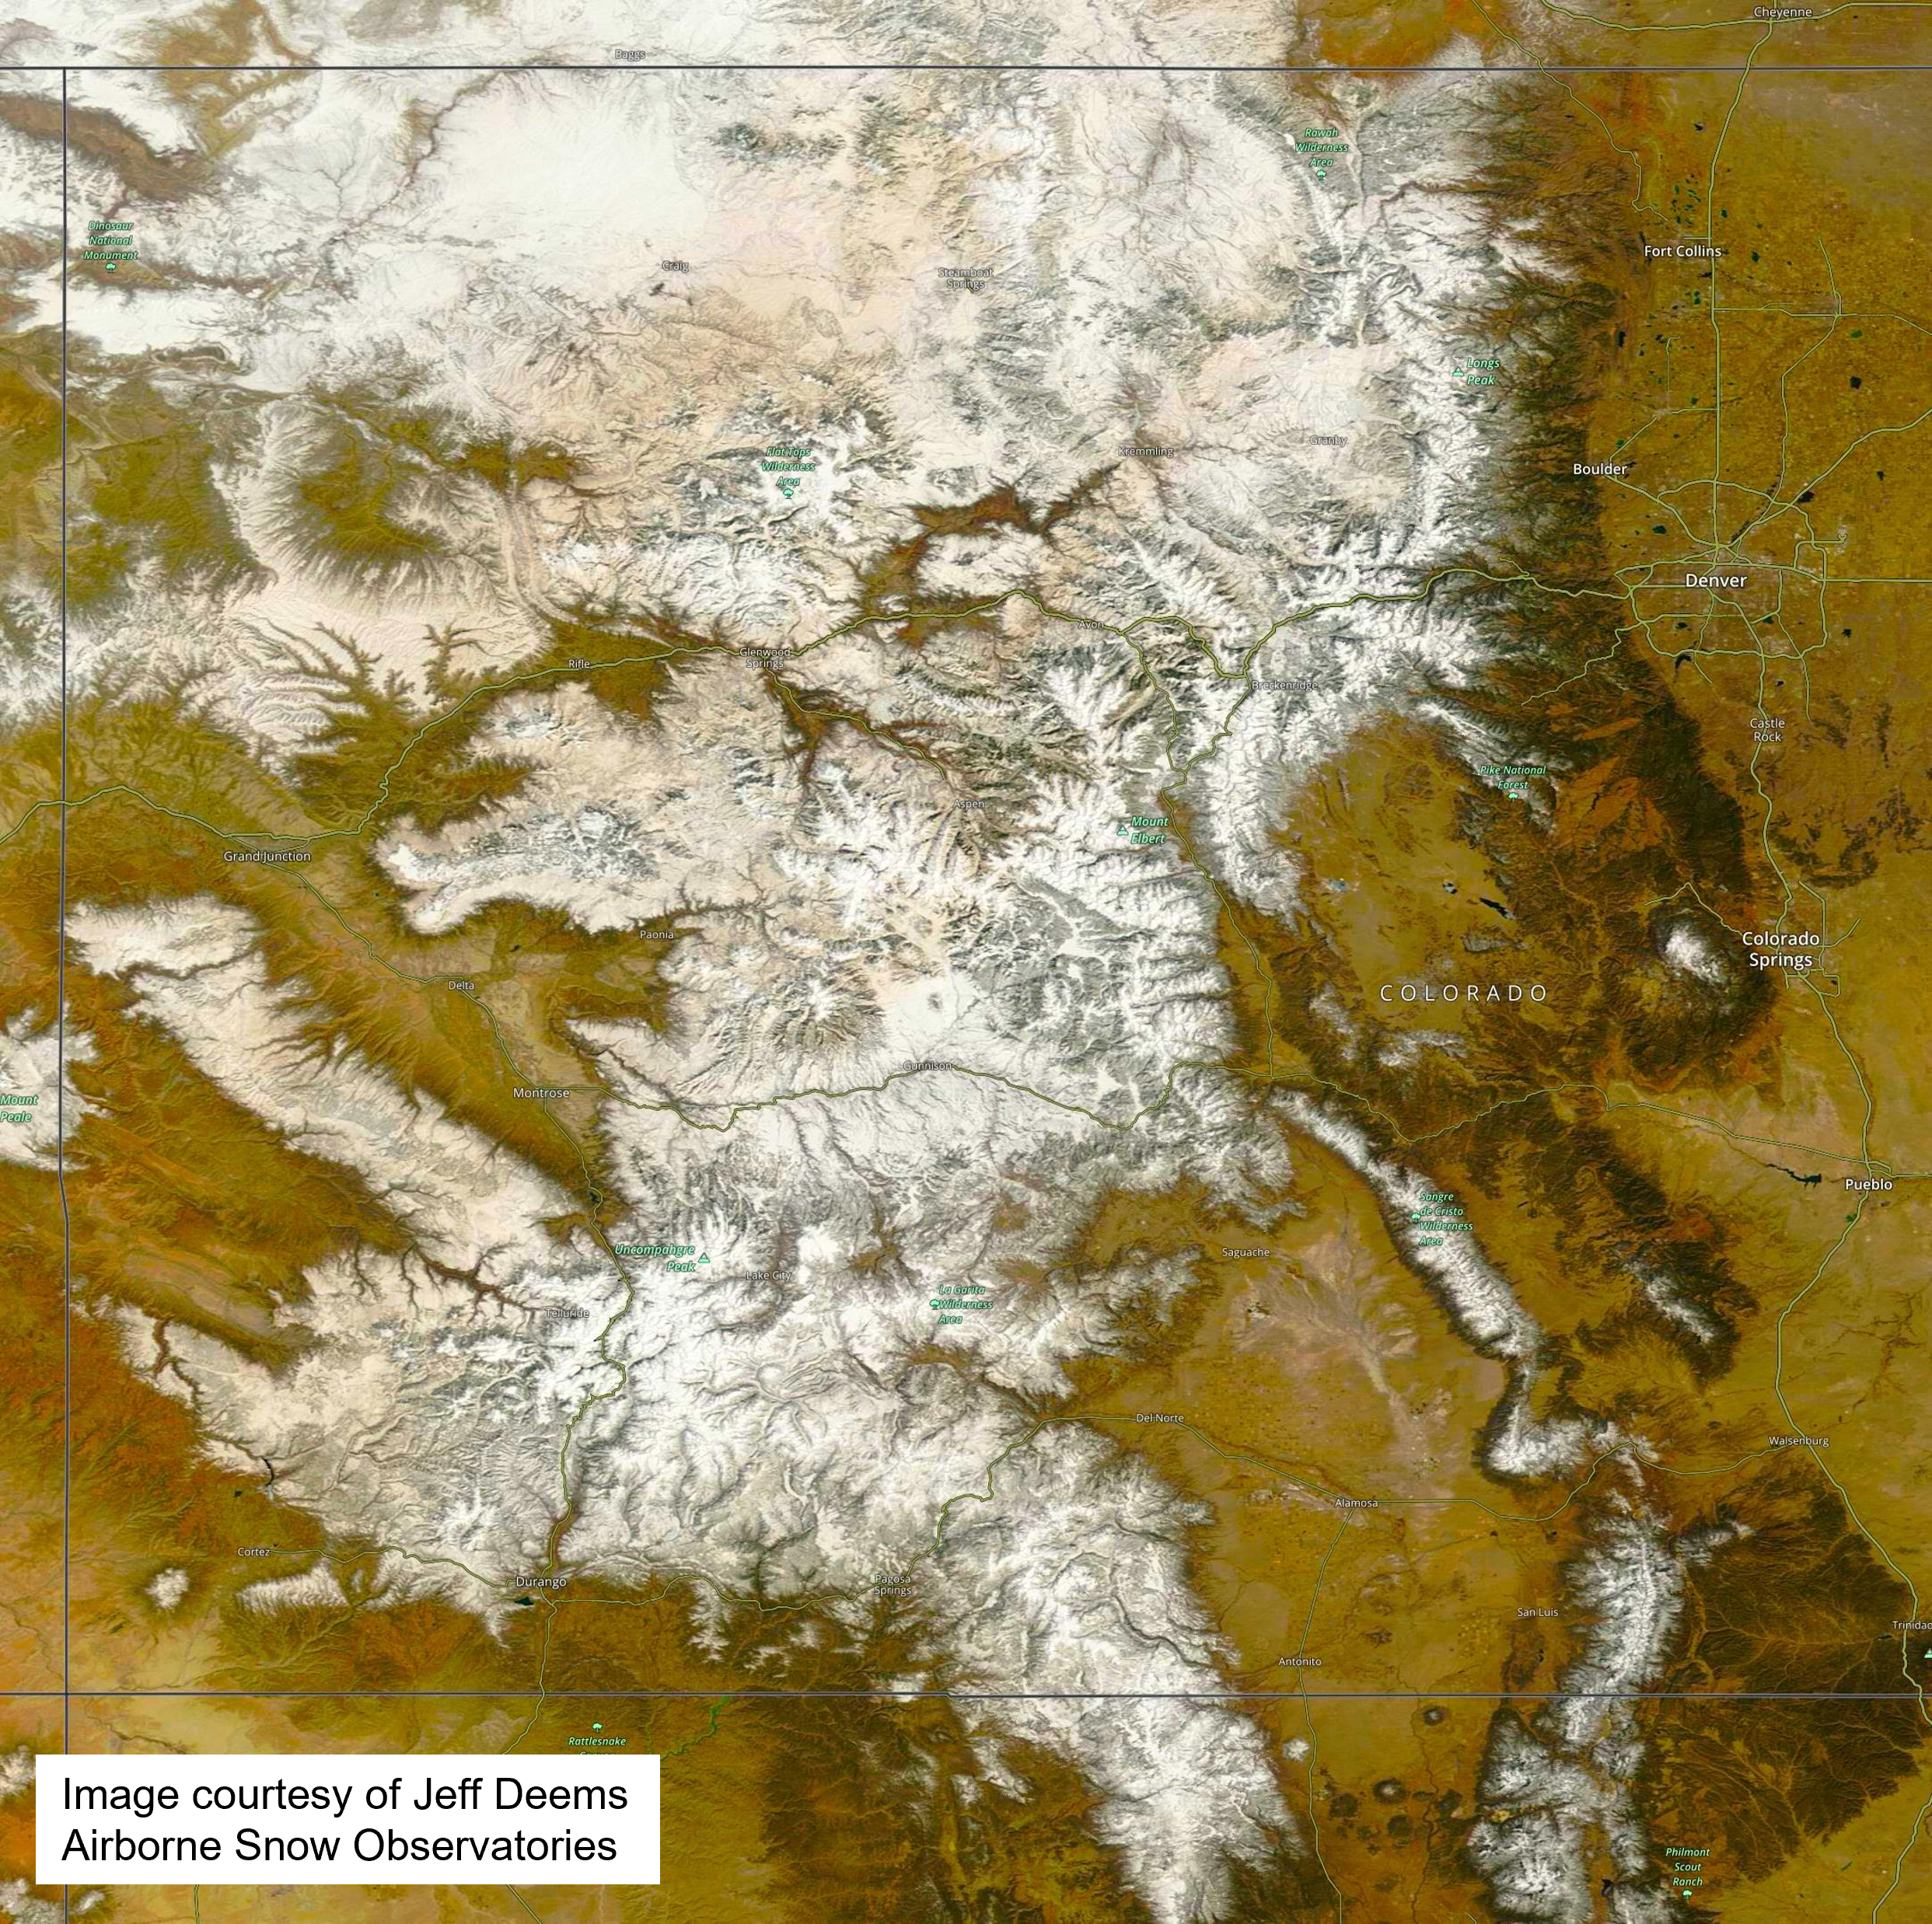
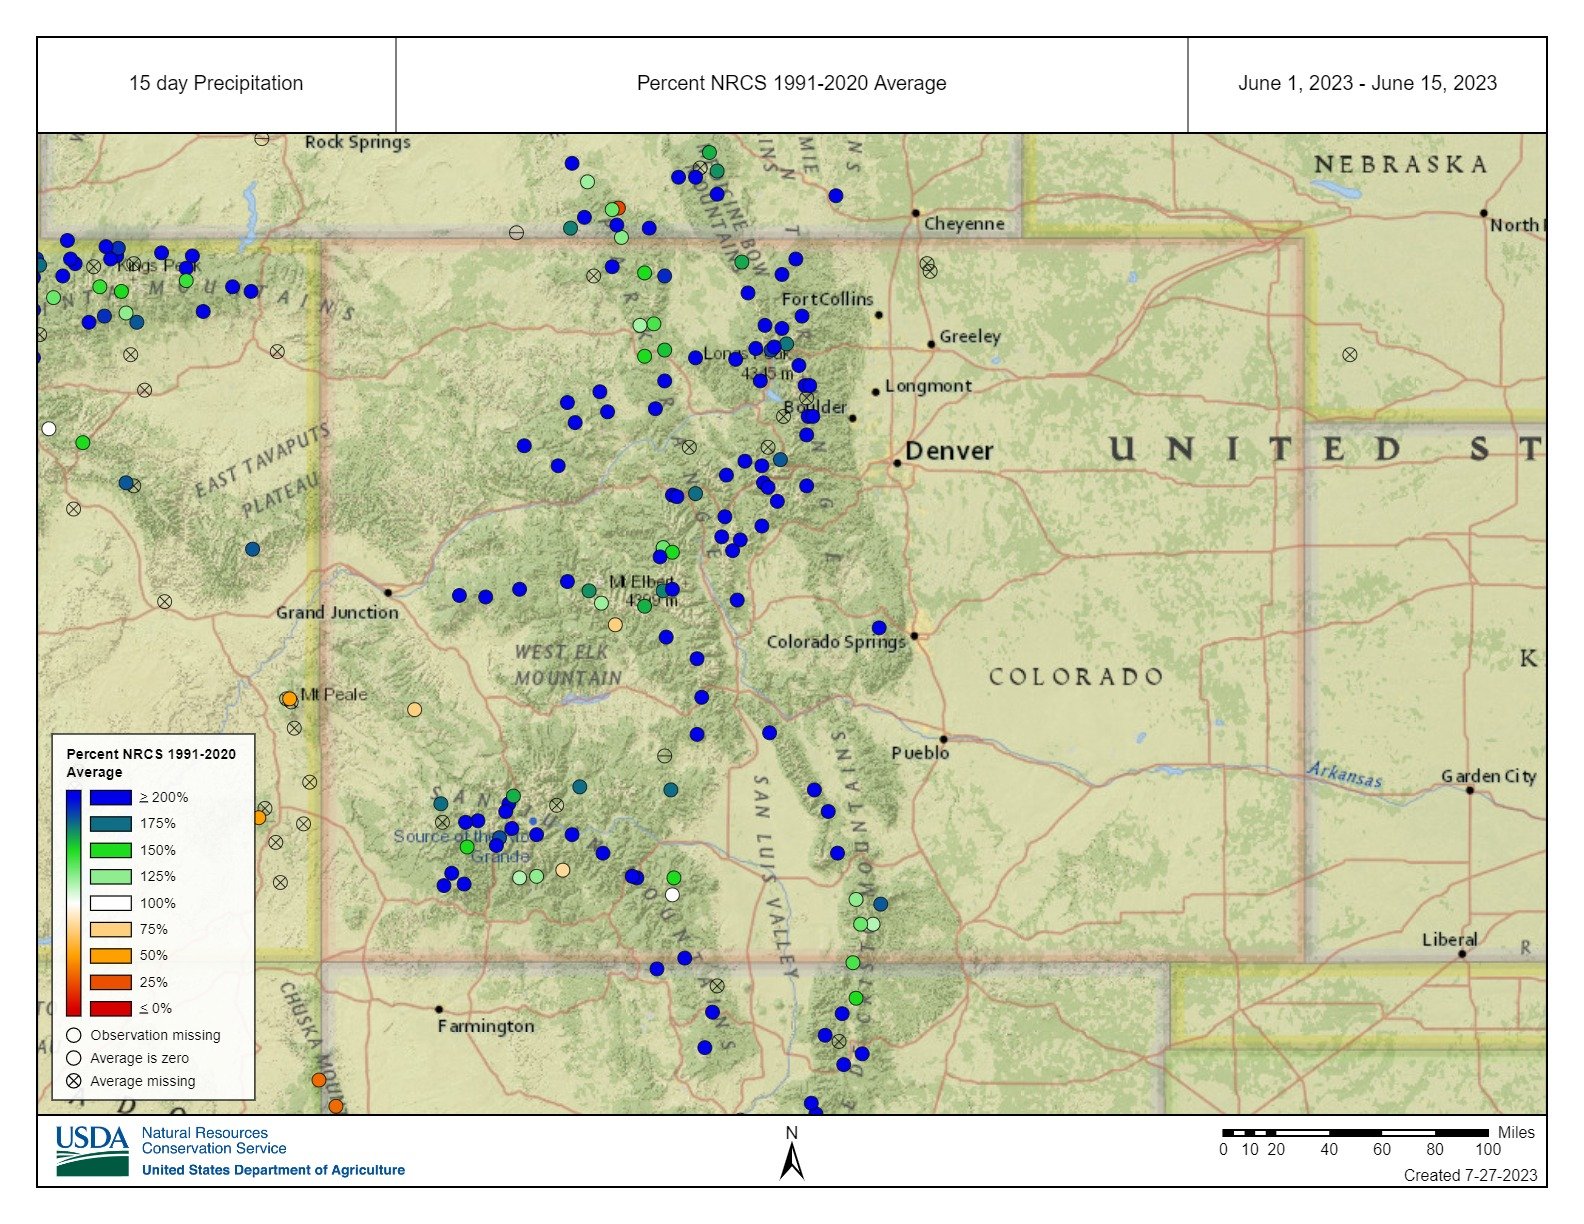

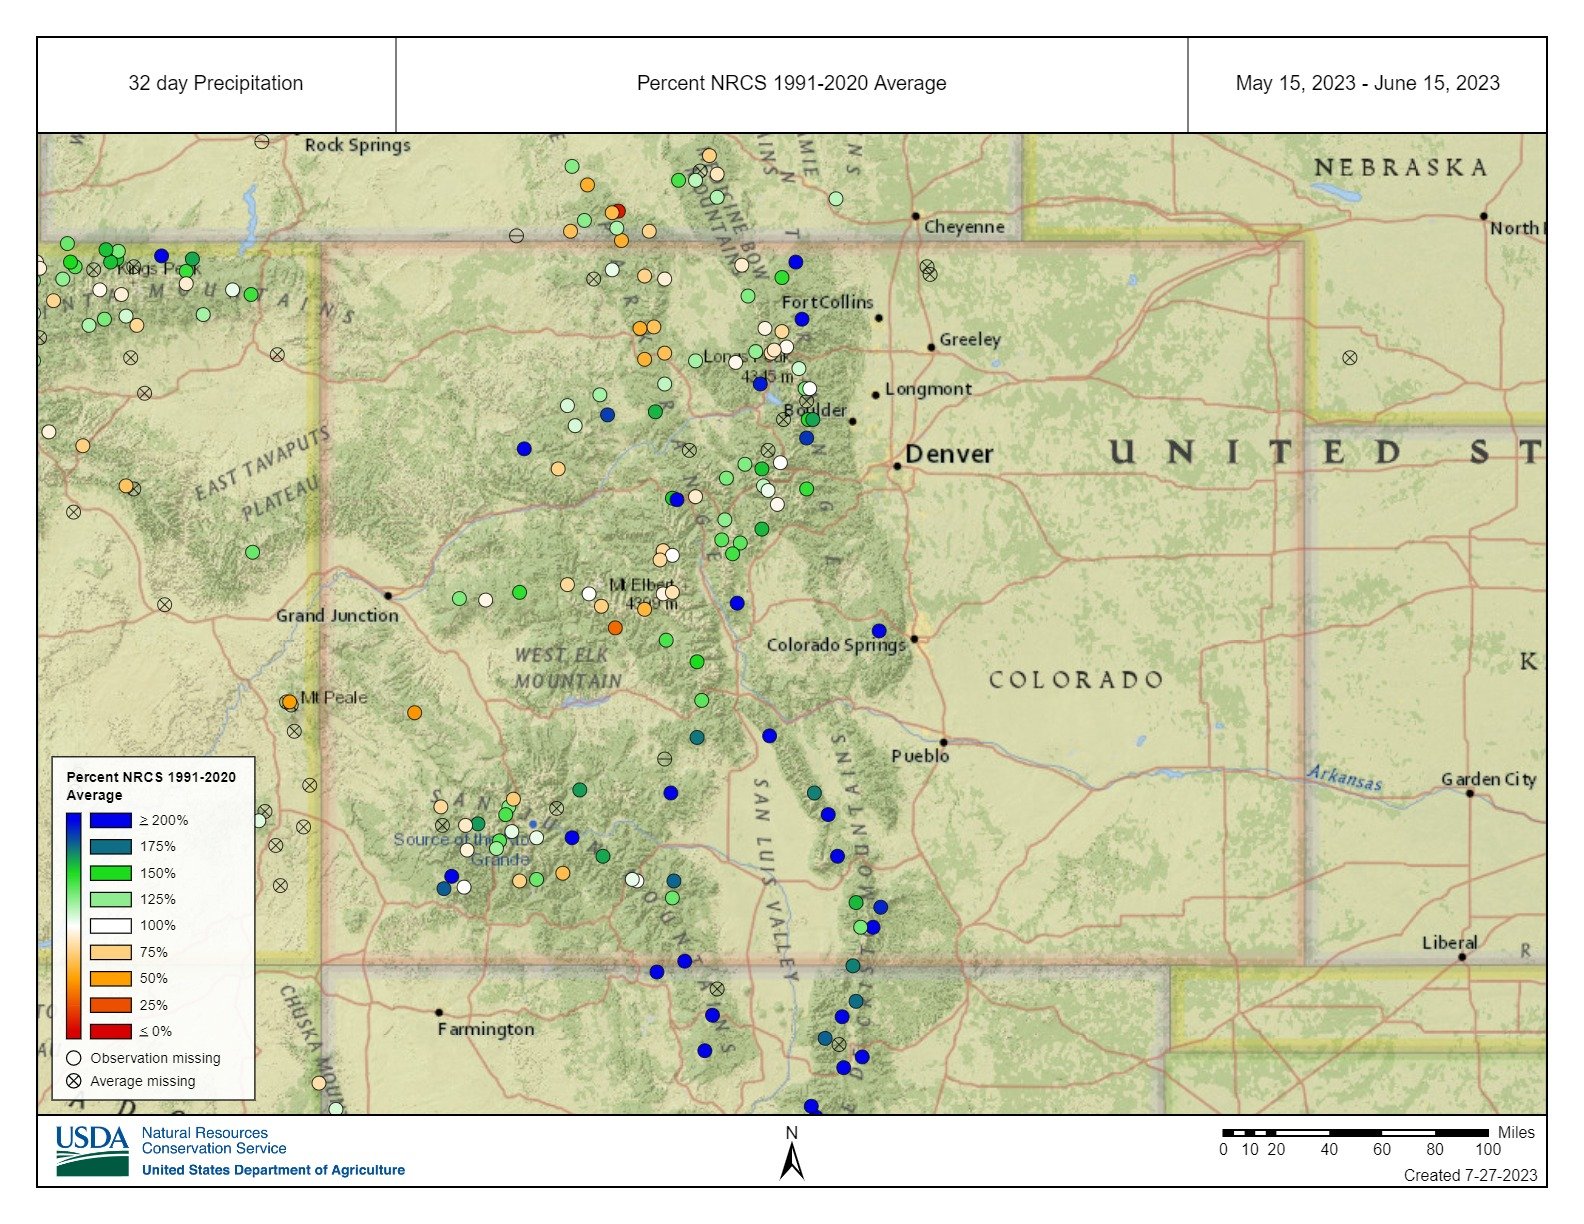
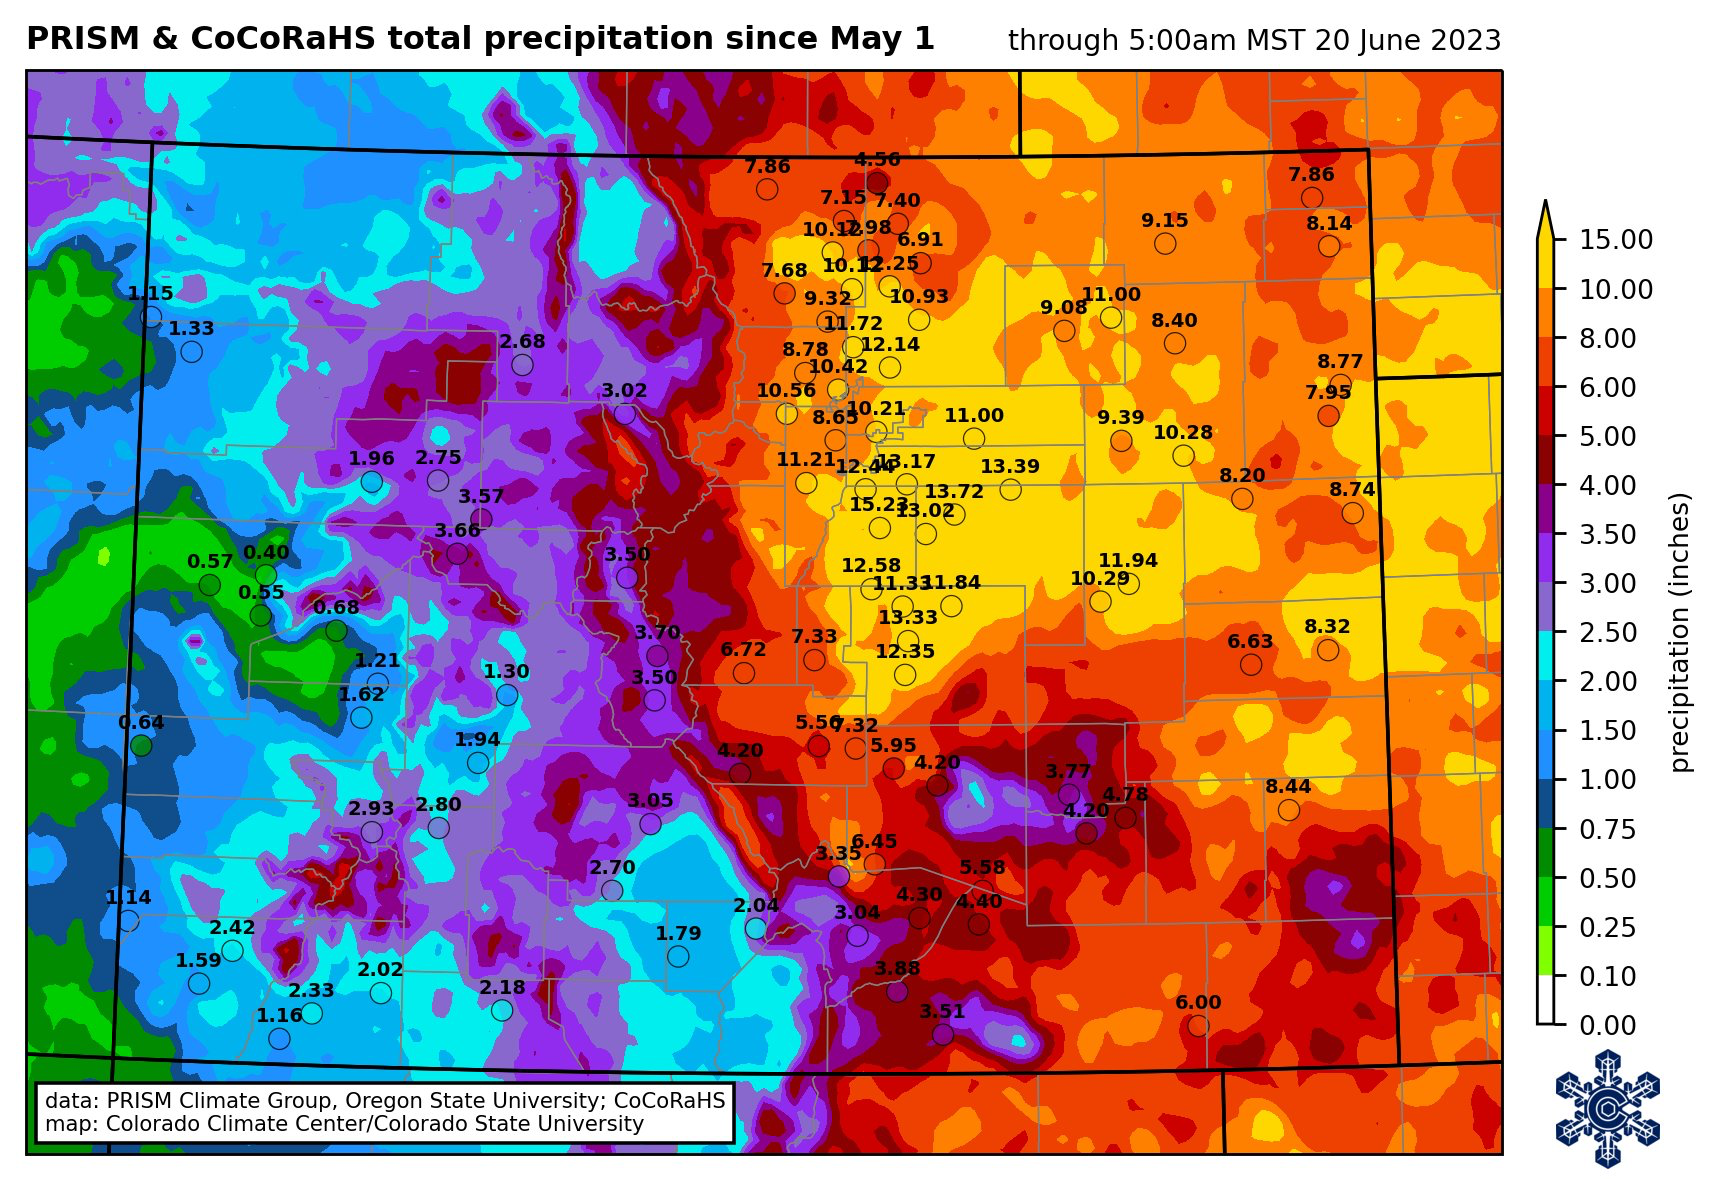
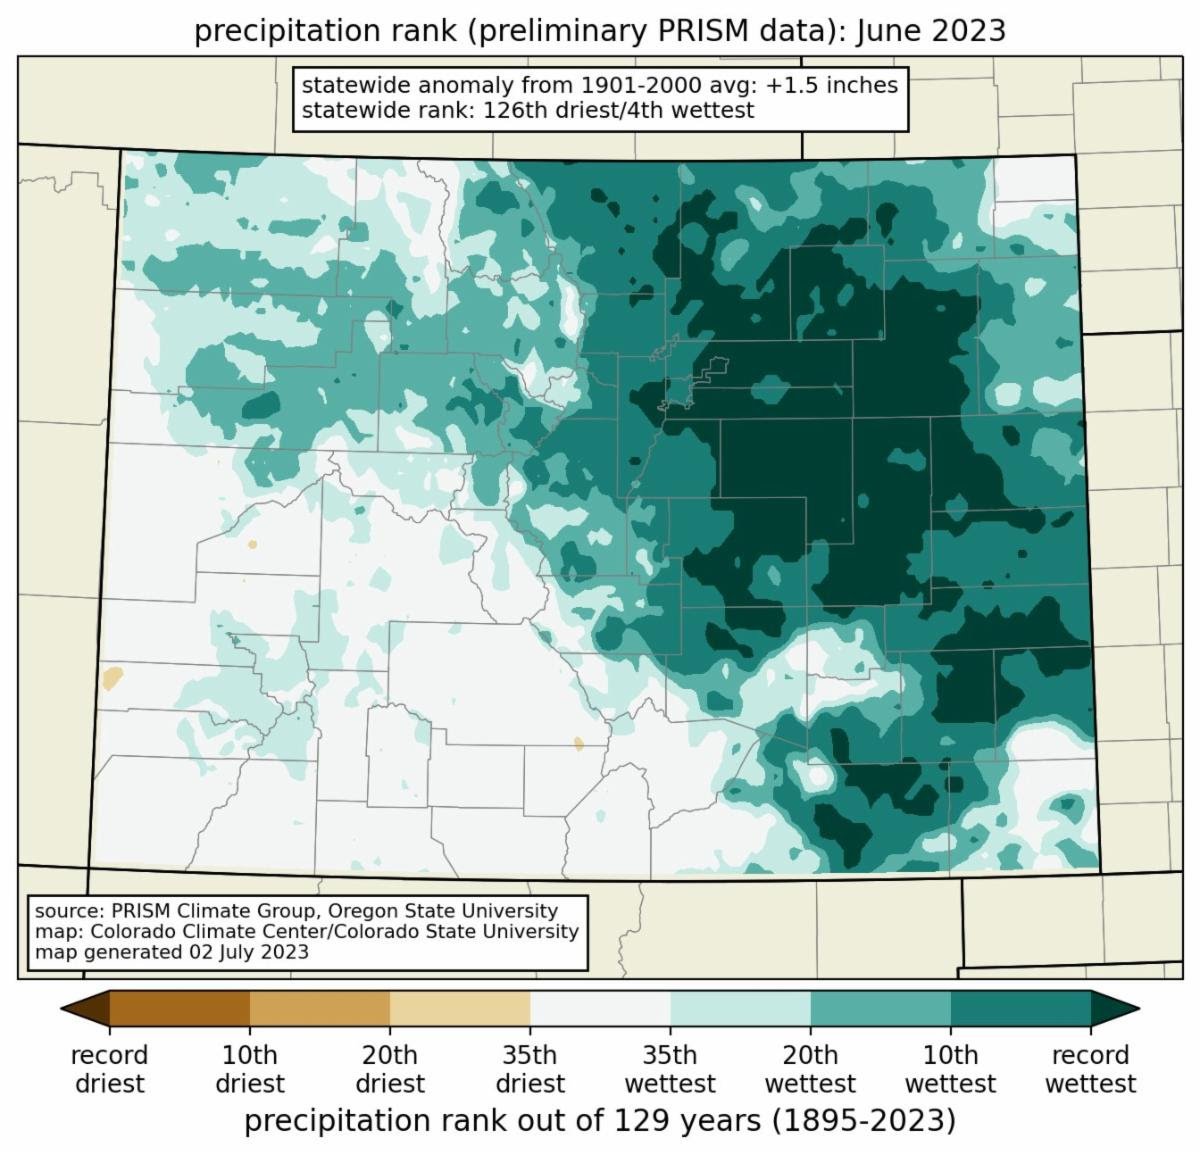
Above: Images that help illustrate WY2023. Starting at the first slide: 1) GOES image showing the big dust event of the year on April 4 making its way to Colorado (brighter pink), 2) MODIS image showing the dust on the snow surface a few days after the April 4 dust event, 3) Maps showing how anomalously wet May/June was for much of Colorado.
SENATOR BECK STUDY BASIN DATA
This section describes conditions and data collected by the Center for Snow and Avalanche Studies at our Senator Beck Basin Study Area (SBB) at Red Mountain Pass under our Mountain System Monitoring program, which includes the Colorado Dust-on-Snow Program (CODOS). At SBB, snowpack, weather, soils, and radiation conditions are monitored and measured at the well-sheltered subalpine Swamp Angel Study Plot (SASP, 11,060’) and at the more exposed, alpine Senator Beck Study Plot (SBSP, 12,180’). Nearby, wind speed, wind direction, air temperature, and humidity data are collected at the Putney Study Plot (PTSP, 12,323’), located to minimize the influence of local terrain on those measurements. Finally, SBB streamflow discharge is continuously measured at the SBB pour point at the Senator Beck Stream Gauge (SBSG, 11,030’), in a broad-crested, notched weir.

All total we received 24 storms, the average amount for a season. A storm is defined as receiving 12 mm (0.5”) or more of precipitation with no break in precipitation greater than 12 hours. Winter storm reports can be viewed at the snowstudies.org website.

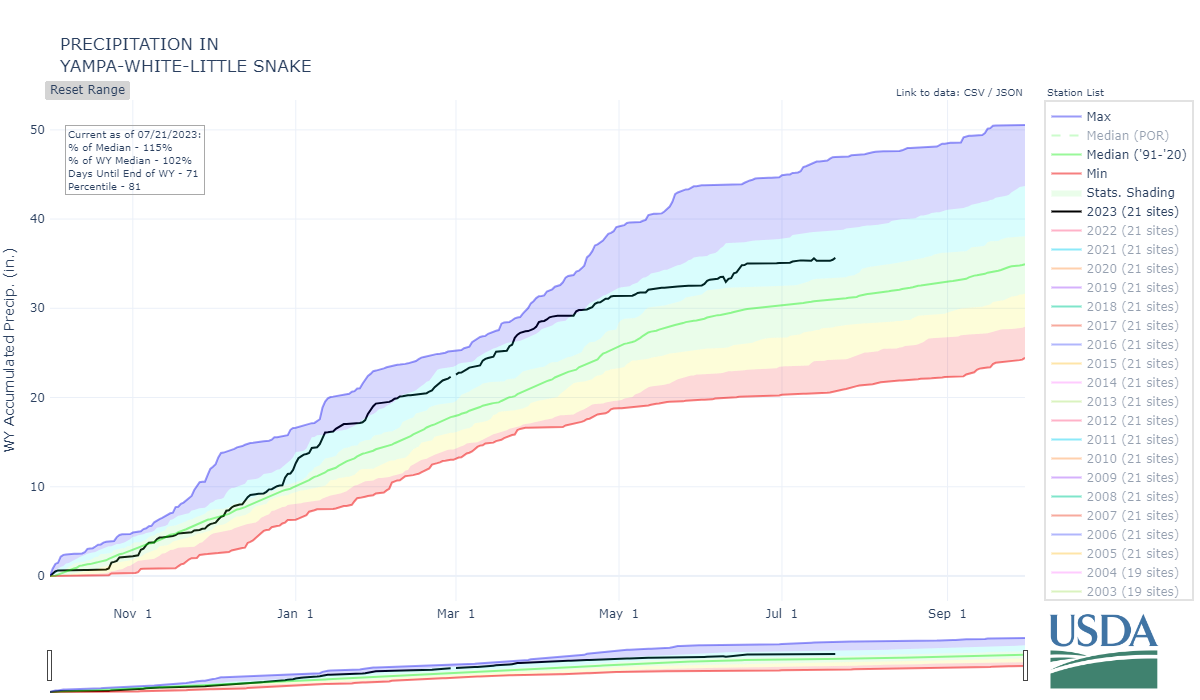
The above graph shows precipitation at SASP with snow depth at SASP and SBSP. A solid season throughout Colorado particularly in the Southwest corner of the state. October was rather dry but for the far western edge of the state, November was mostly dryer than normal but for the northwest corner however air temperatures in both months were much cooler allowing the snow events to stick around and start building the snowpack. January was a blockbuster for most of the West in general and February continued the high precip along the western and southern edge of the state. The snowpack was very healthy going into March (except for the Arkansas) and then really ramped up throughout western Colorado with precip being 150%-400% of normal. April was dryer but May returned to wet from the southwest corner thru the northeast corner of the state. June continued the trend for most of the mountain regions and record breaking for the Front Range and Eastern Colorado.

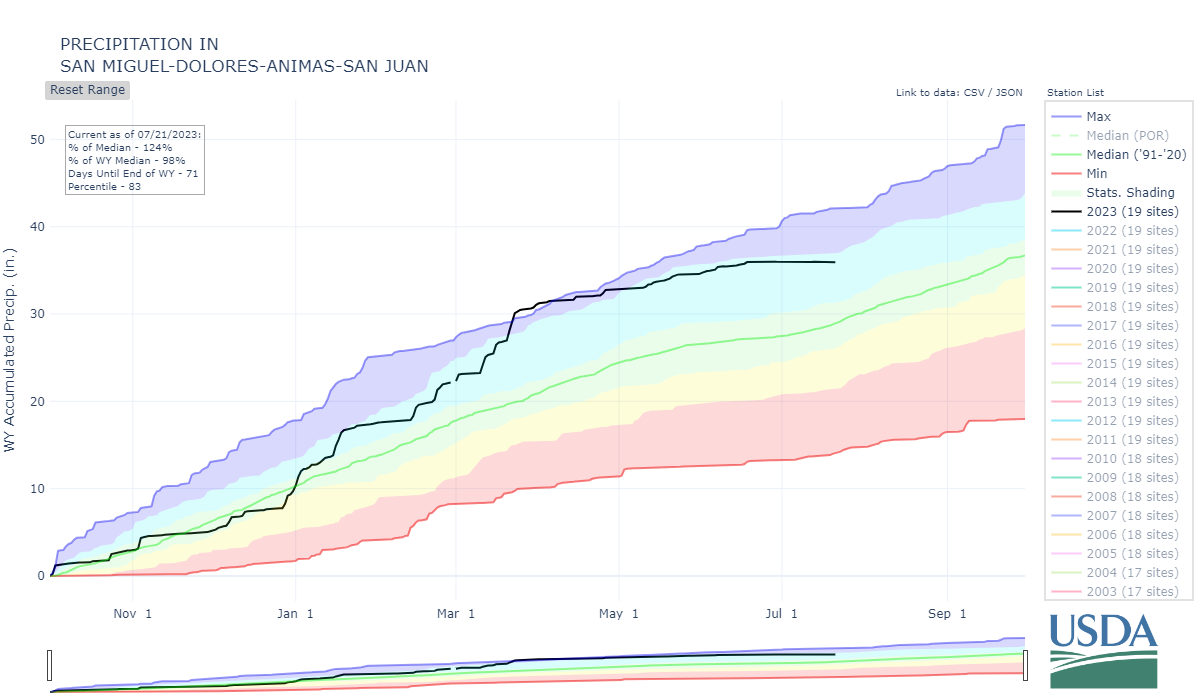
Above: Water Year 2023 cumulative precipitation, in January we received 28 days with precipitation. We received 8” precipitation for each month of January and March . The average is approximately half that.
SNOWPACK CONDITIONS
The winter season overall was much cooler than normal which set the scene for snow to start accumulating early and stick around longer into June. This, accompanied by numerous periods of plentiful precipitation made for a generally successful season. Western Colorado in October had spots that were wetter than normal which helped pre-winter soil moisture conditions being wetter than at least the last five years.
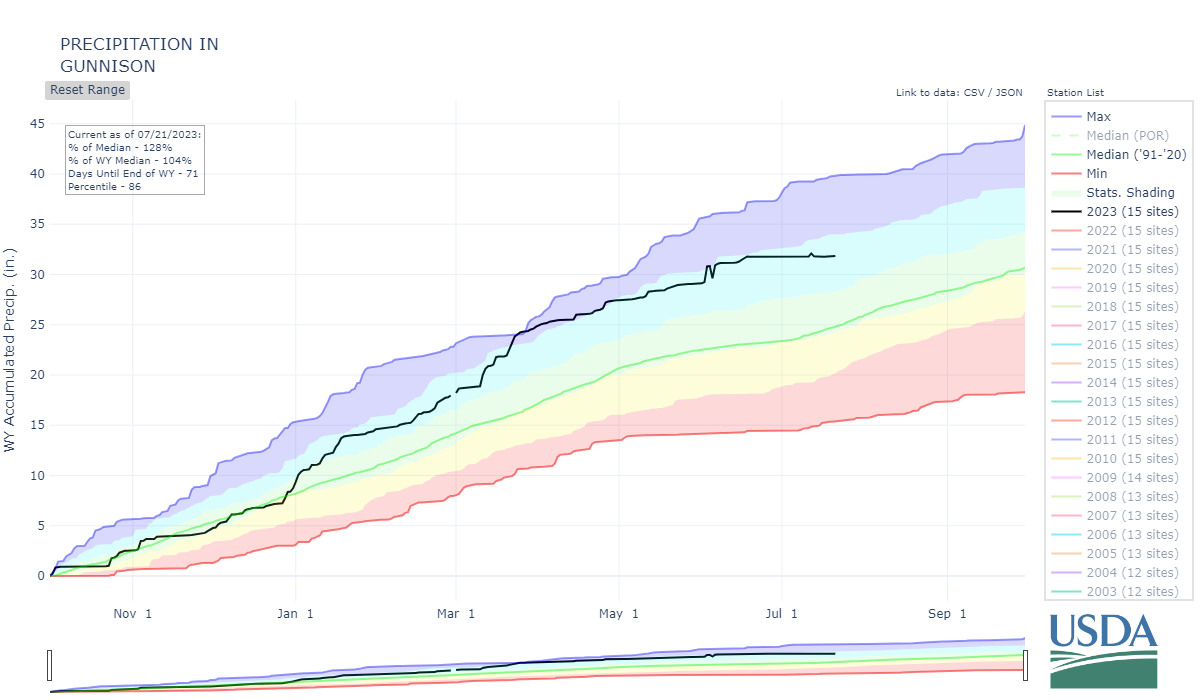
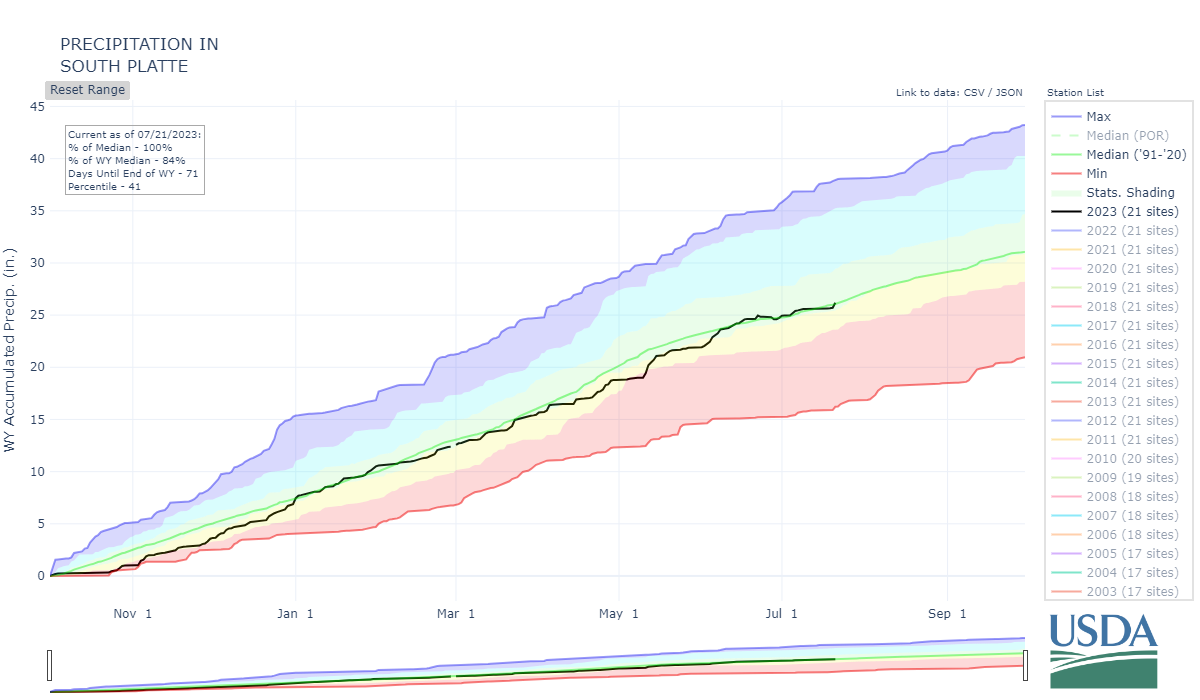
Four winter storms over the months of October and November got the snowpack going to about average accumulation levels. December largely continued the trend but fell a little short in Southern Colorado. January was the month that things really kicked into gear, except for the Arkansas and South Platte Basins which held onto mostly average accumulation, there were large gains of the snowpack statewide. Even the Rio Grande which finished the month about average, recovered nicely from a flat December. February continued the big gains towards the western and southern edge of the state, but the remainder was quite dry. Fortunately air temperatures remained much cooler than normal statewide. Going into March the thought was (or least my thought) “if we have an average month then when April 1st arrives we should still be sitting pretty good”. But March doubled down and we saw even bigger gains particularly in the Gunnison, Rio Grande and Southwest Colorado, with precipitation being at least 150% of normal and well over 200% being more common, and it was much cooler than normal throughout the state. We observed 18 days with precipitation in March. Even the Arkansas basin rebounded to near normal SWE by the end of the month. Following the anomalous month of March the river forecast center (CBRFC) dialed in (and ramped up) the April-July volume estimates to a much greater accuracy. April swung around to dry conditions for the entire state except for the southeast corner, but still remained cooler than normal! As typical April ushered in the beginning of snowmelt and after the hum-drum month things got interesting again. May brought 11 days of recorded precipitation at Swamp Angel and a little less than normal precipitation (2” vs 3”), sometimes in the form of rain. Statewide it was wet for most of Southern Colorado extending diagonally to the eastern half of the state including the Front Range. The western portion of the state came in under normal precip, and overall conditions warmed up with near to slightly above normal temperatures. The precipitation events (rain at lower elevations) starting mid-May coincided with the rapidly melting of our large snowpack. This wet surge really kicked in the first half of June especially for eastern Colorado but also for majority of the mountains. June is typically our driest month so it was a big change from the norm; the Front Range saw plentiful springtime rain and the mountains saw additional water fall on the snowpack and an added boost to streamflow from rain runoff. This complicated streamflow forecasts in many areas.
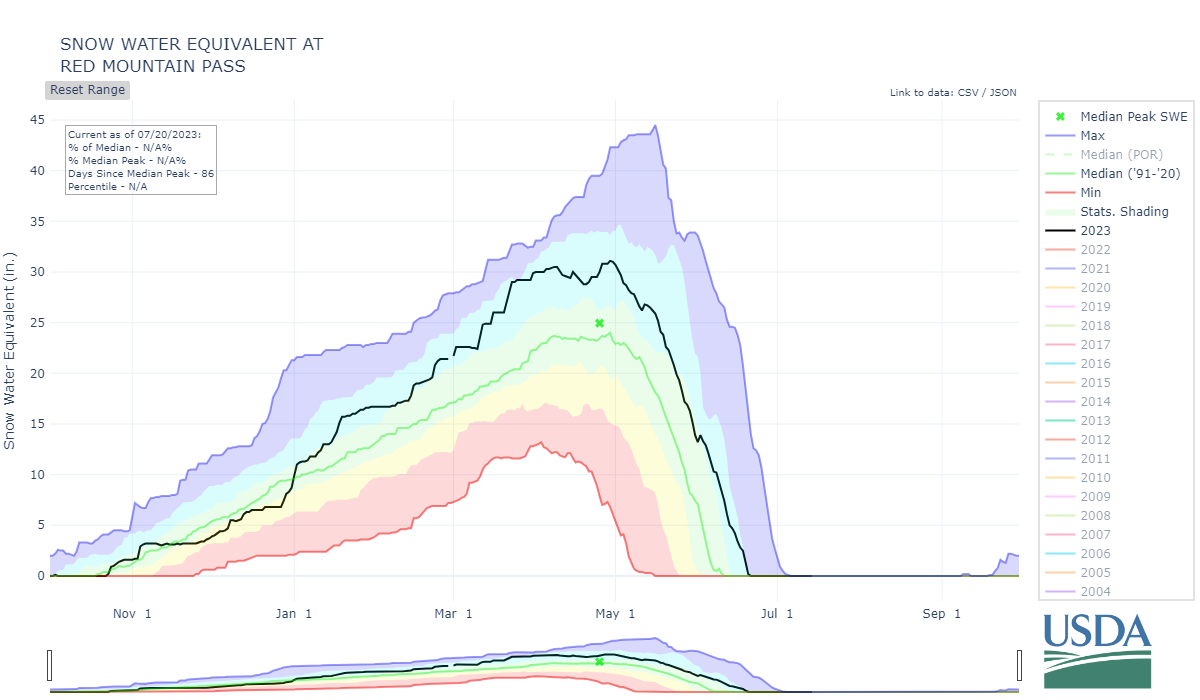
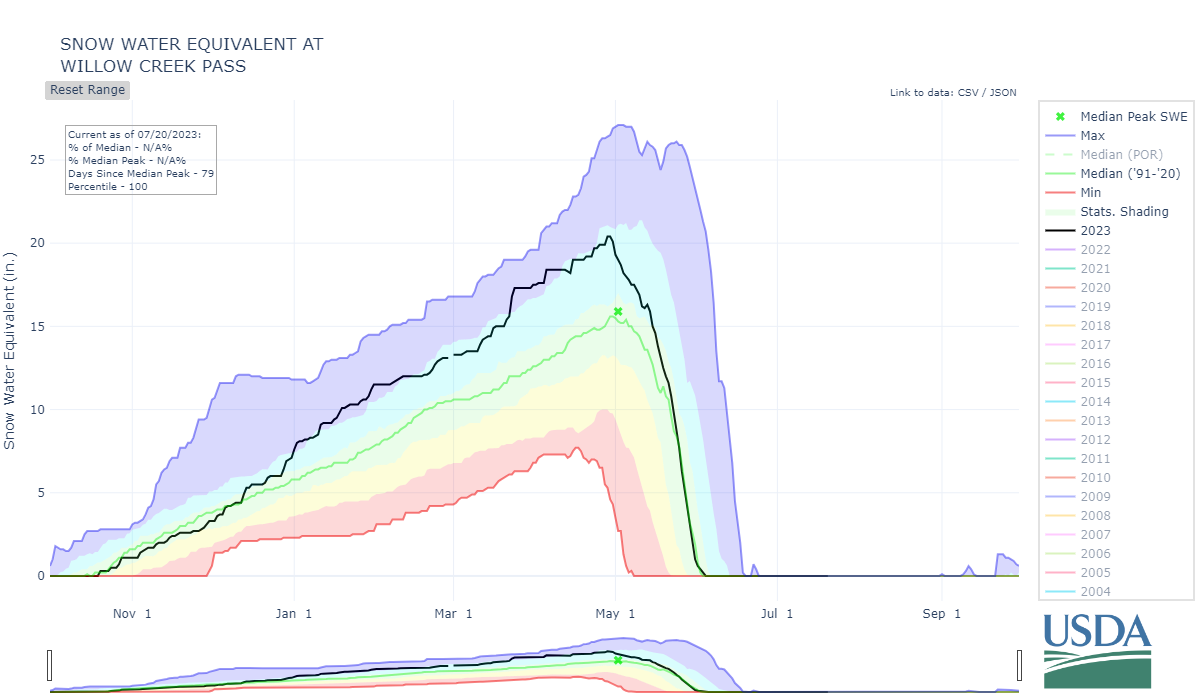
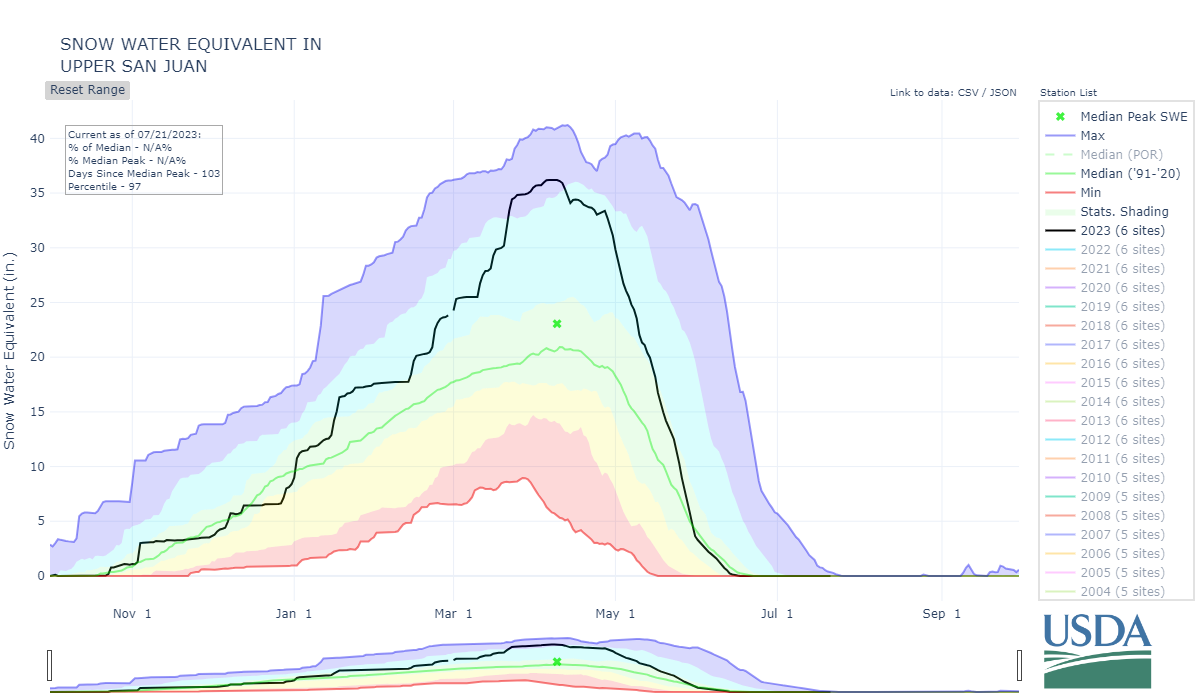
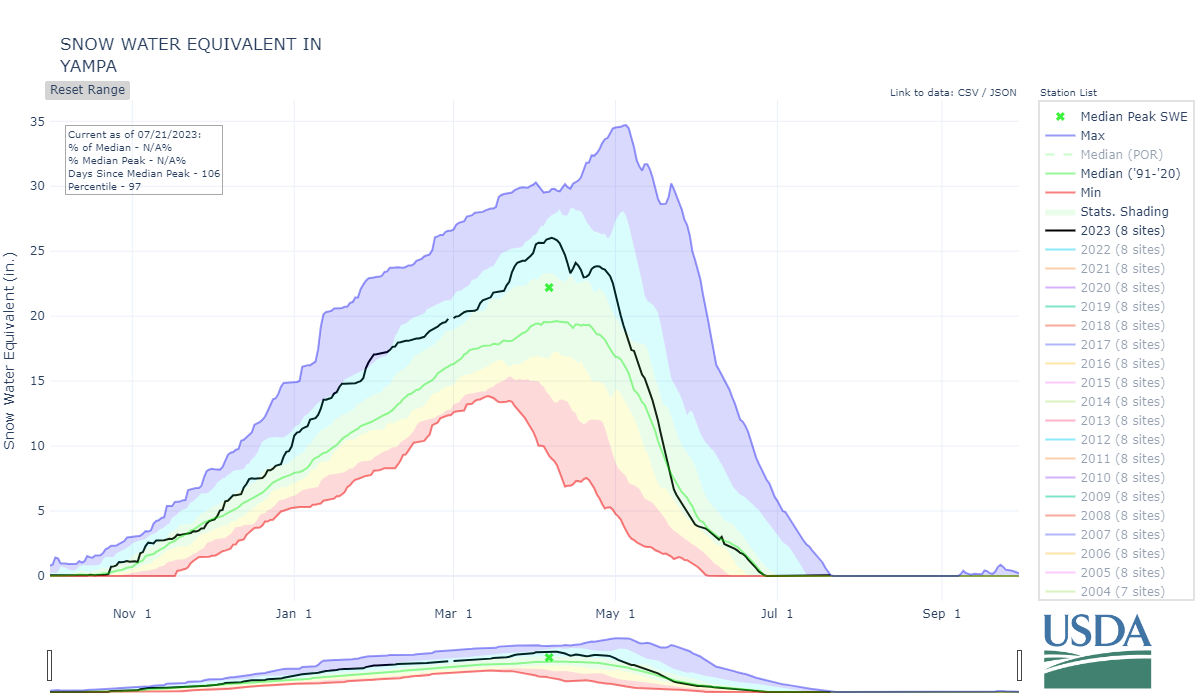
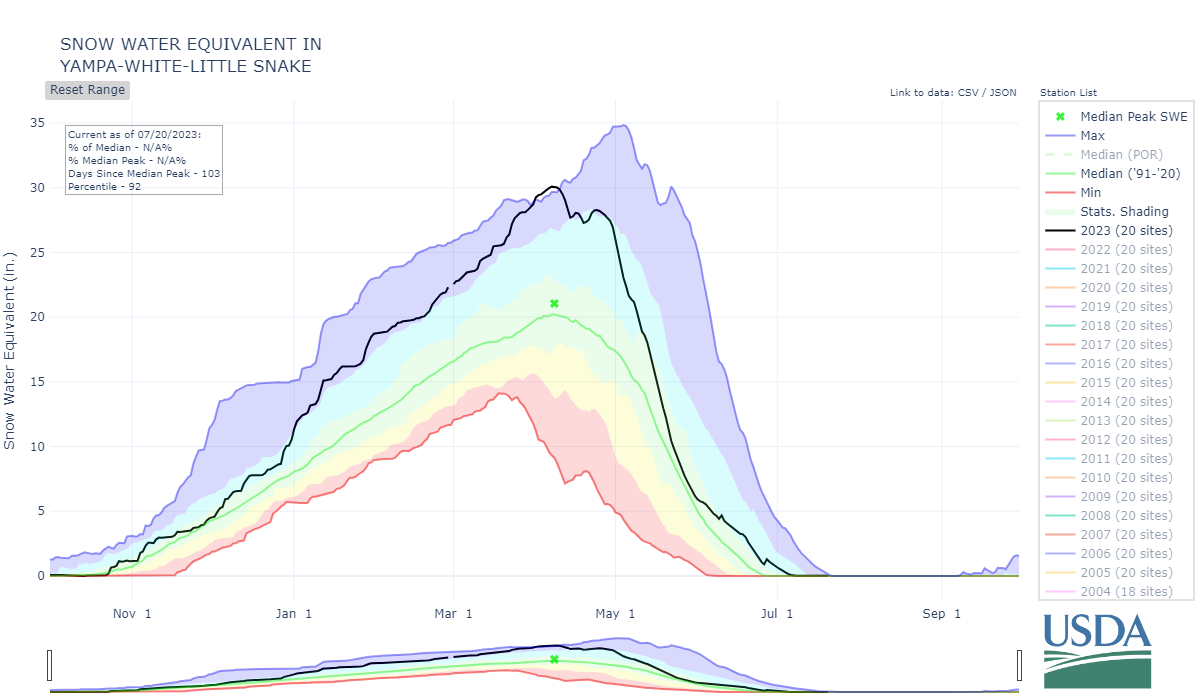
Peak SWE timing was generally during the normal timeframe. At lower elevations peak SWE was a bit late and the snow stuck around longer into spring as there was so much of it. Snow was gone at Swamp Angel (11,000’) on June 10 and Senator Beck (12,200”) site on June 22.


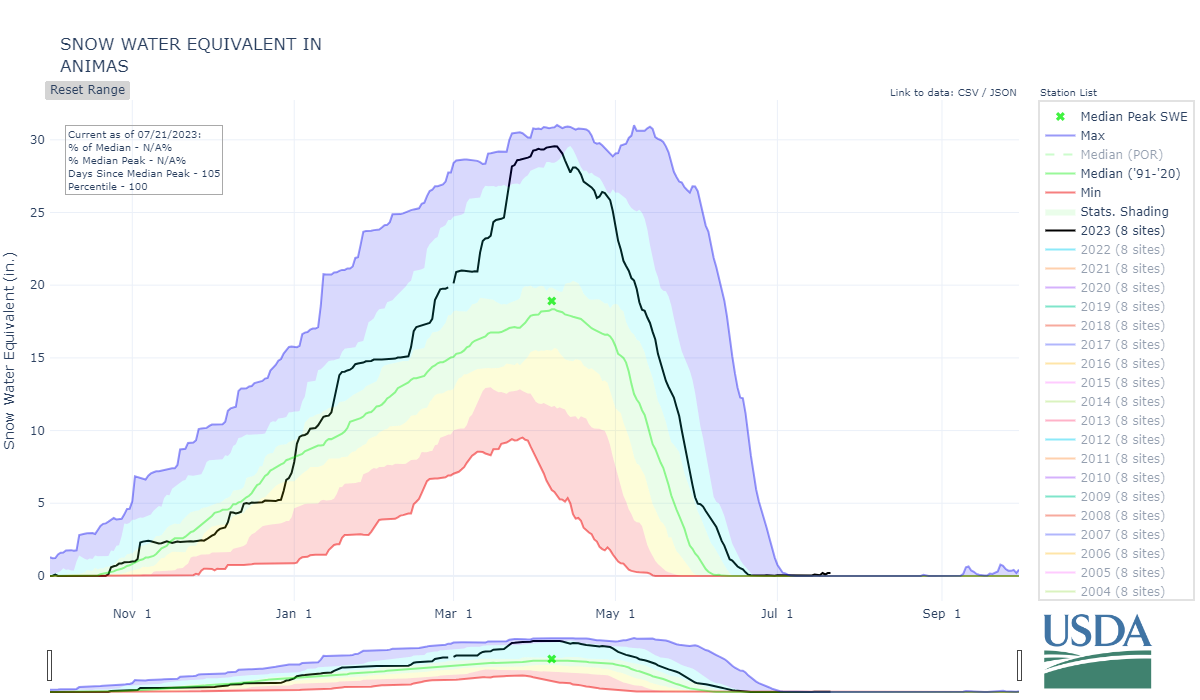

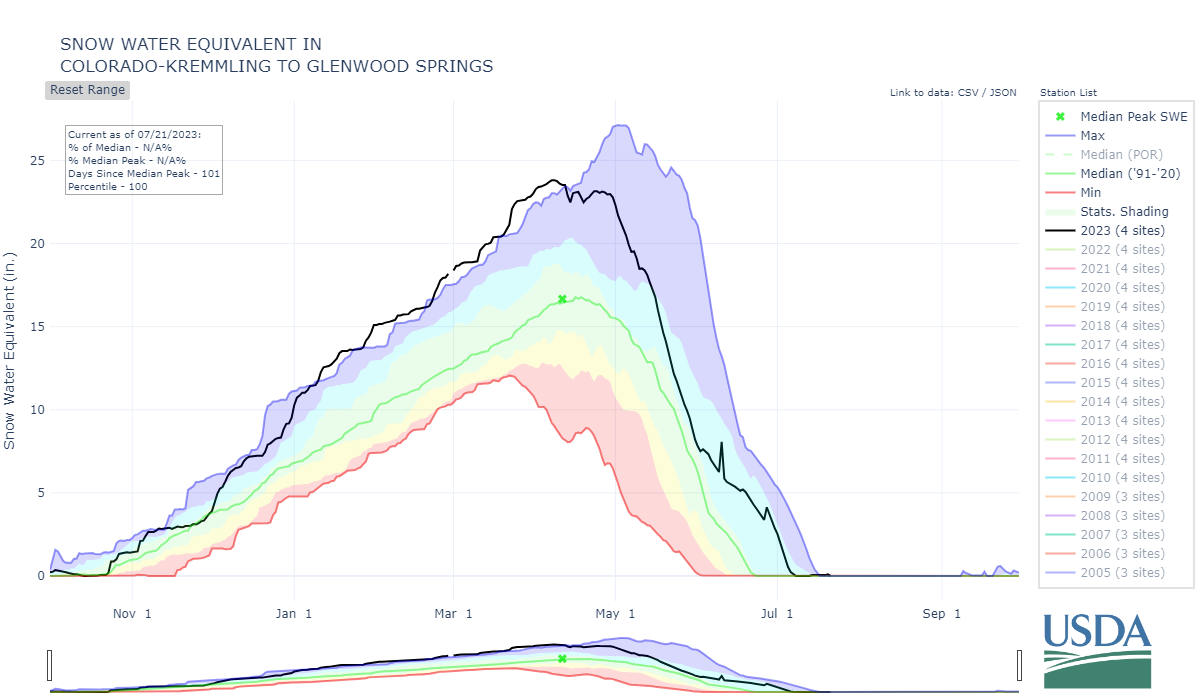
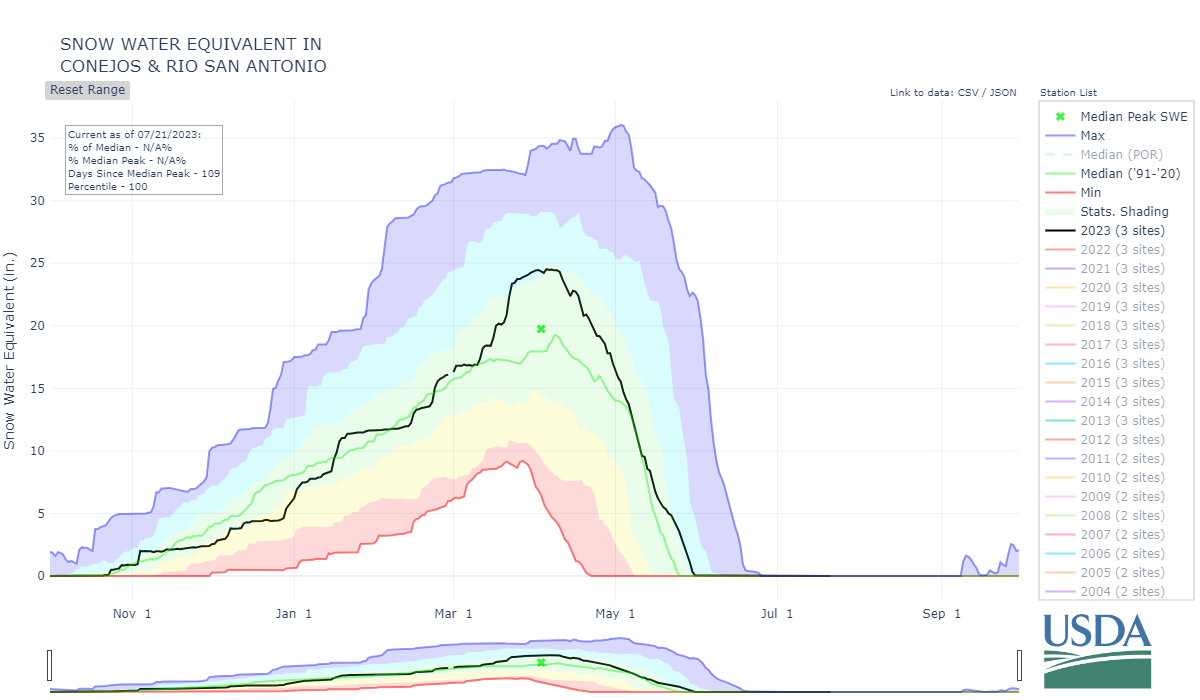

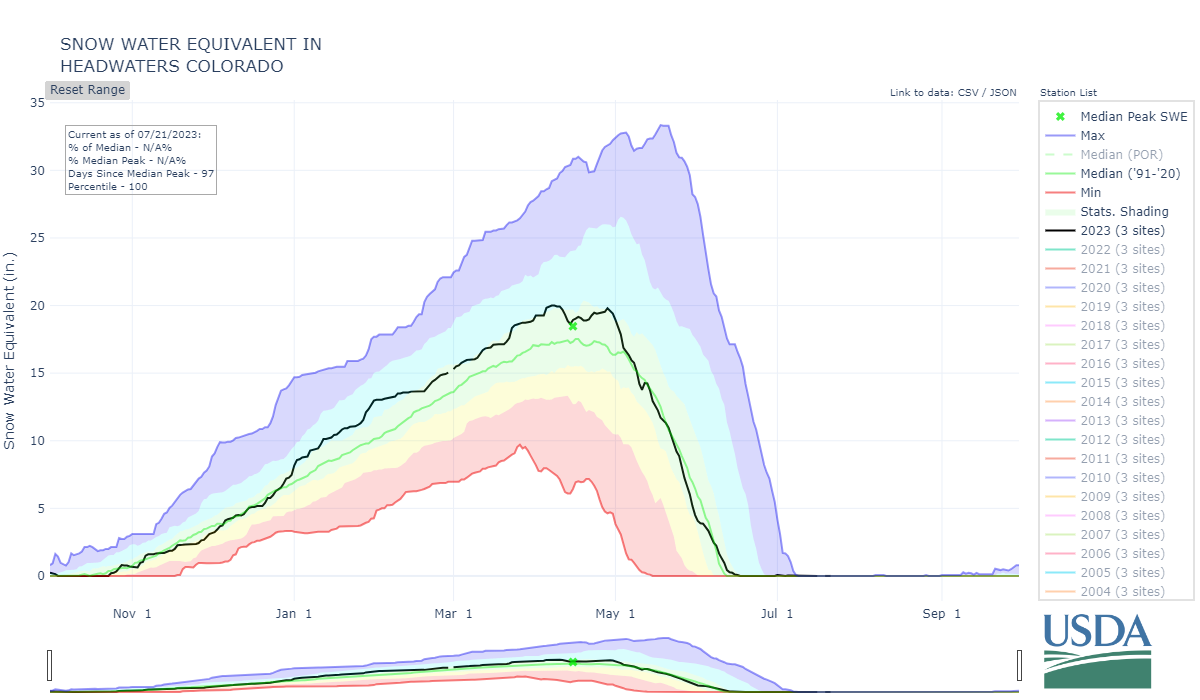
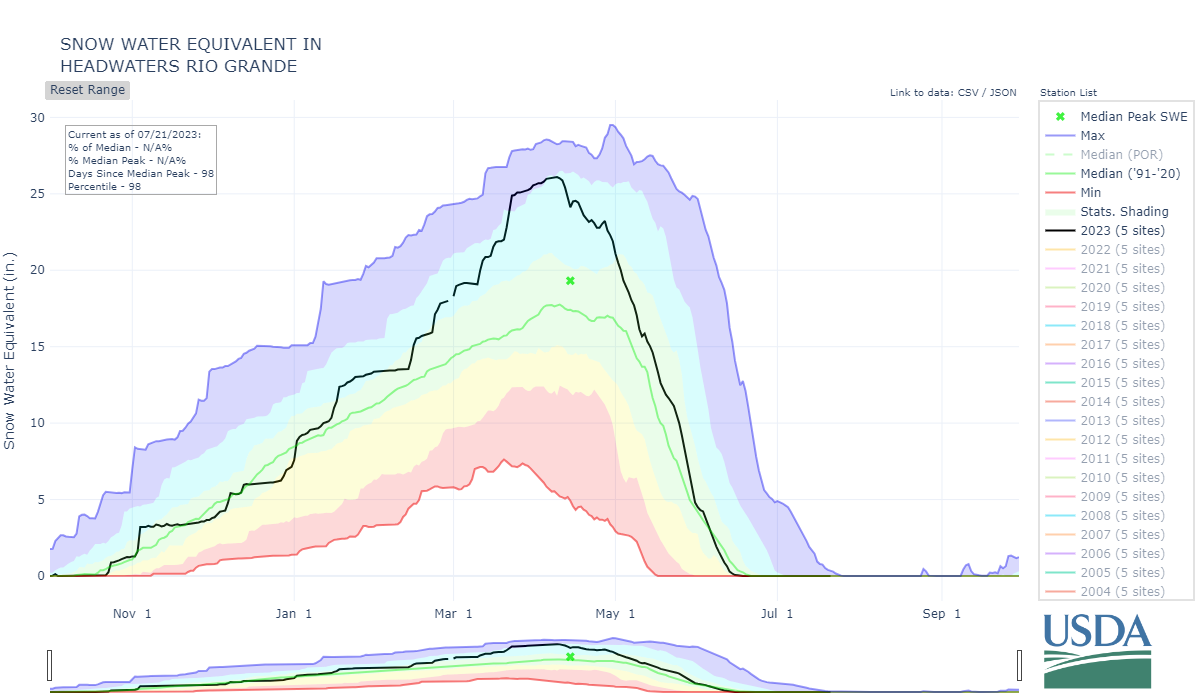
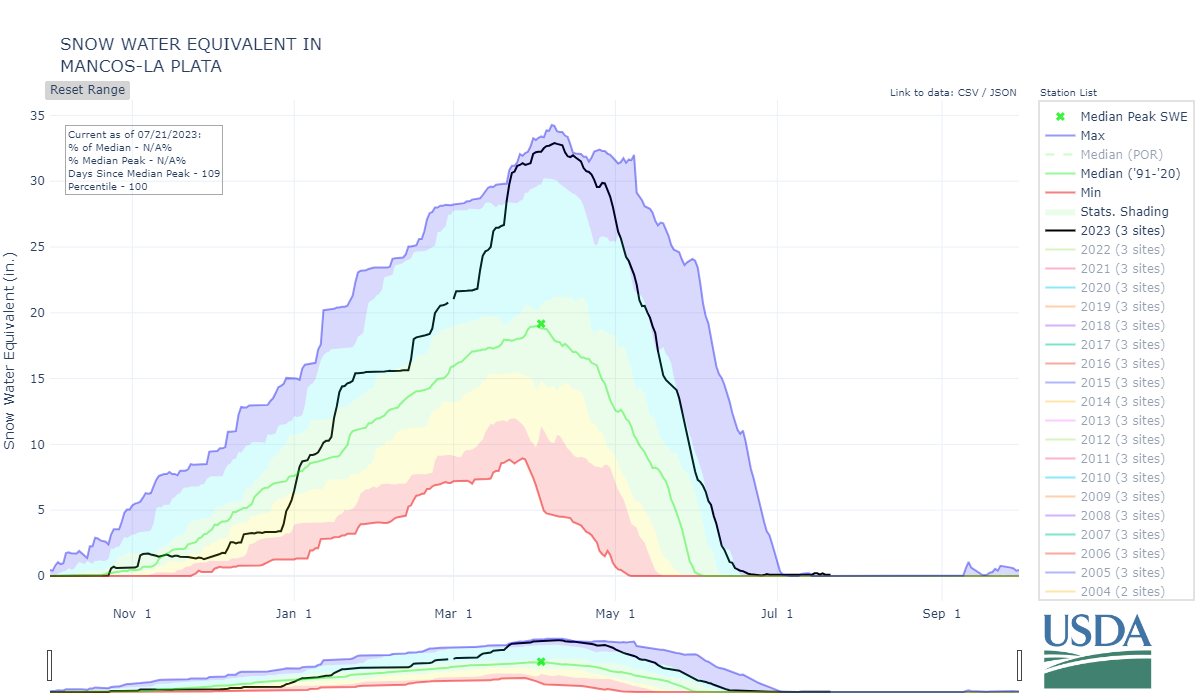
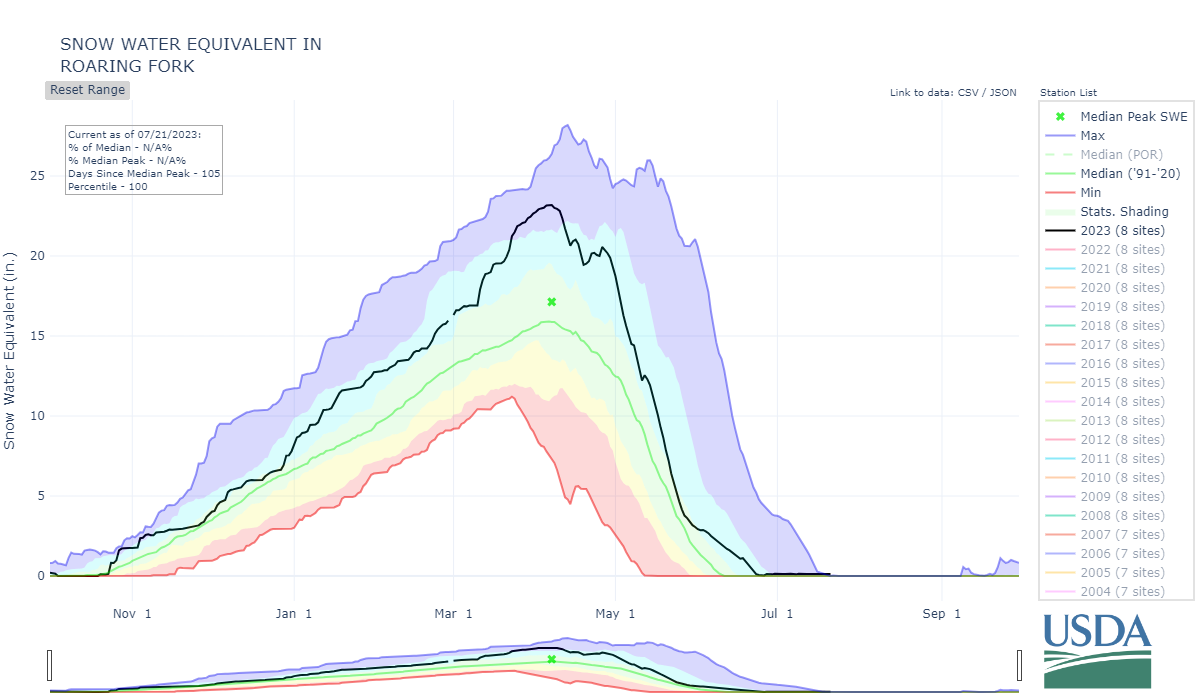
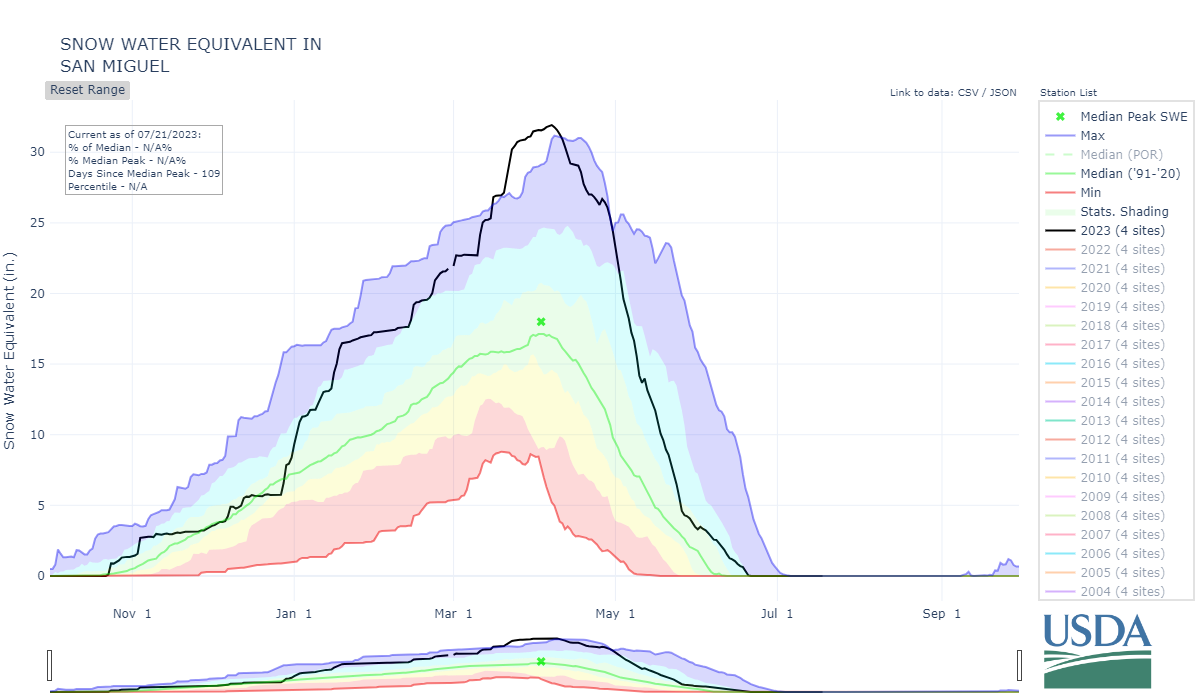
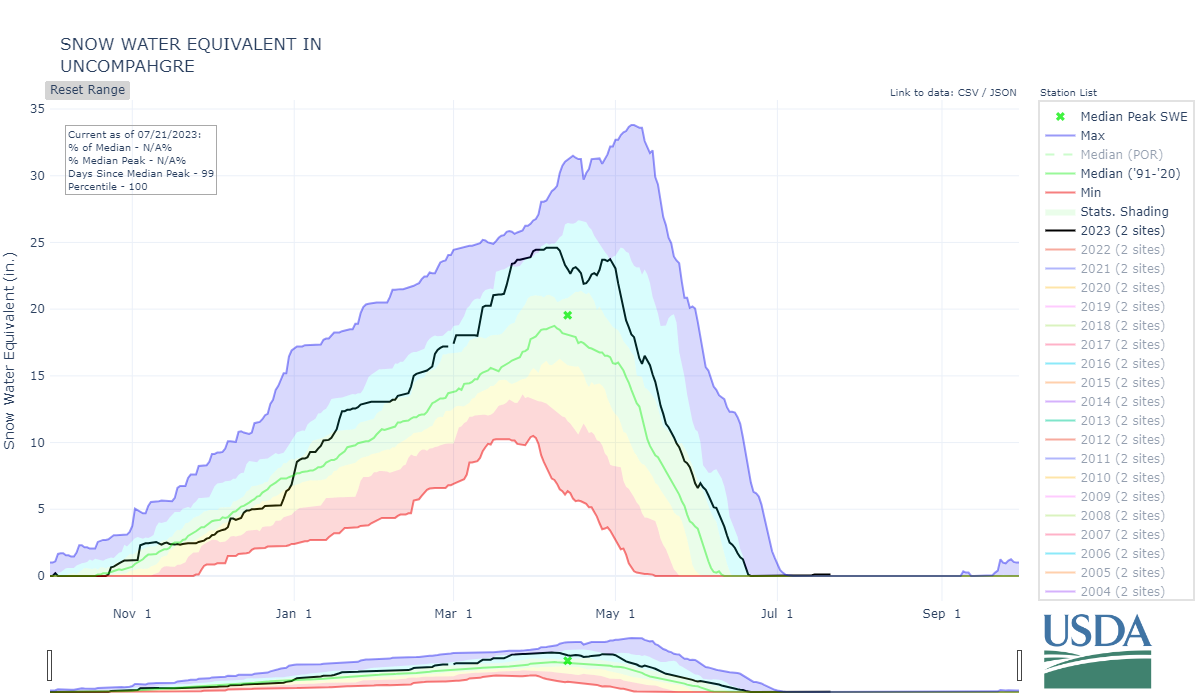
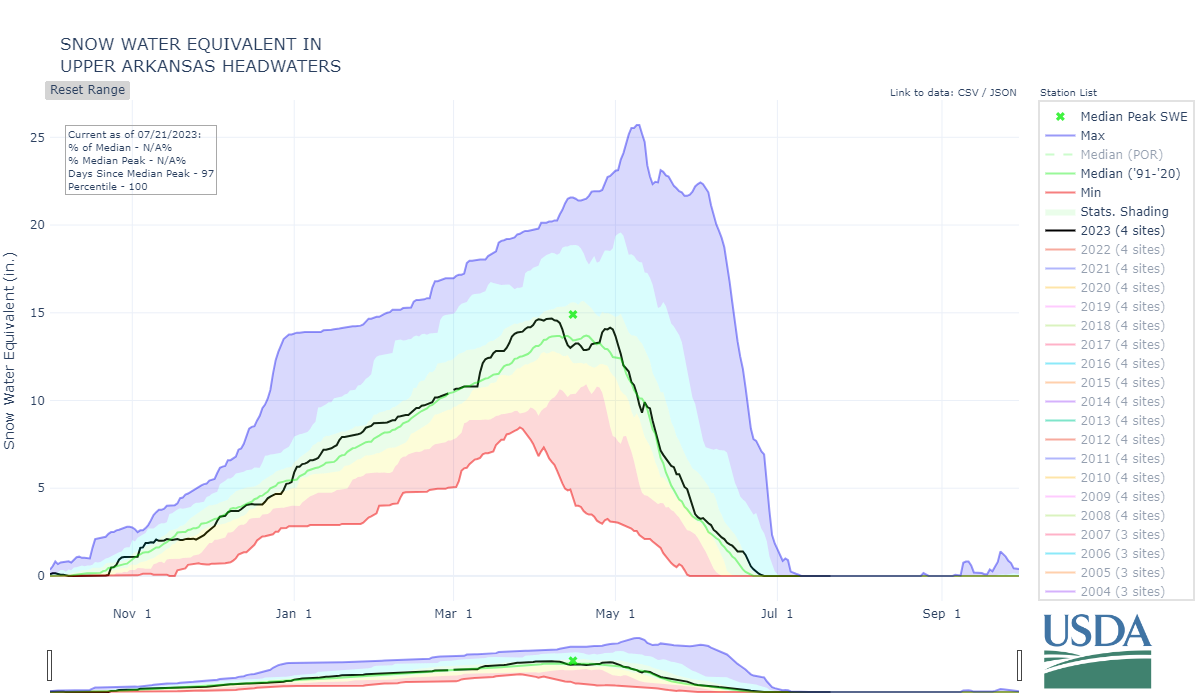
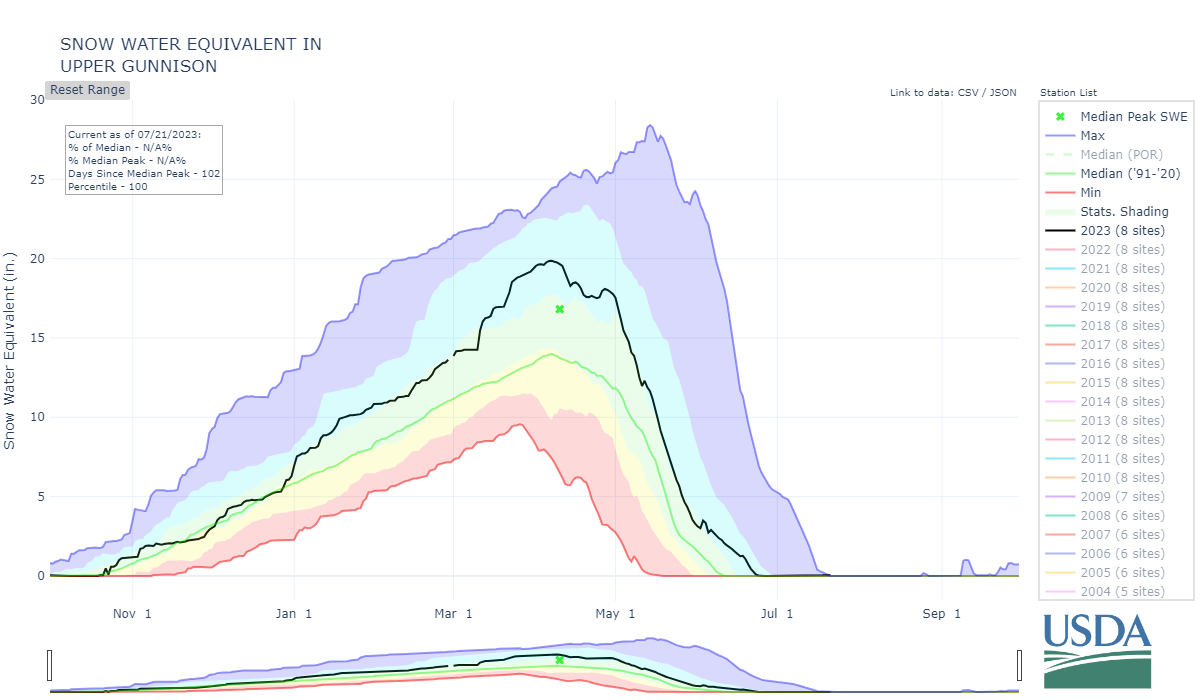
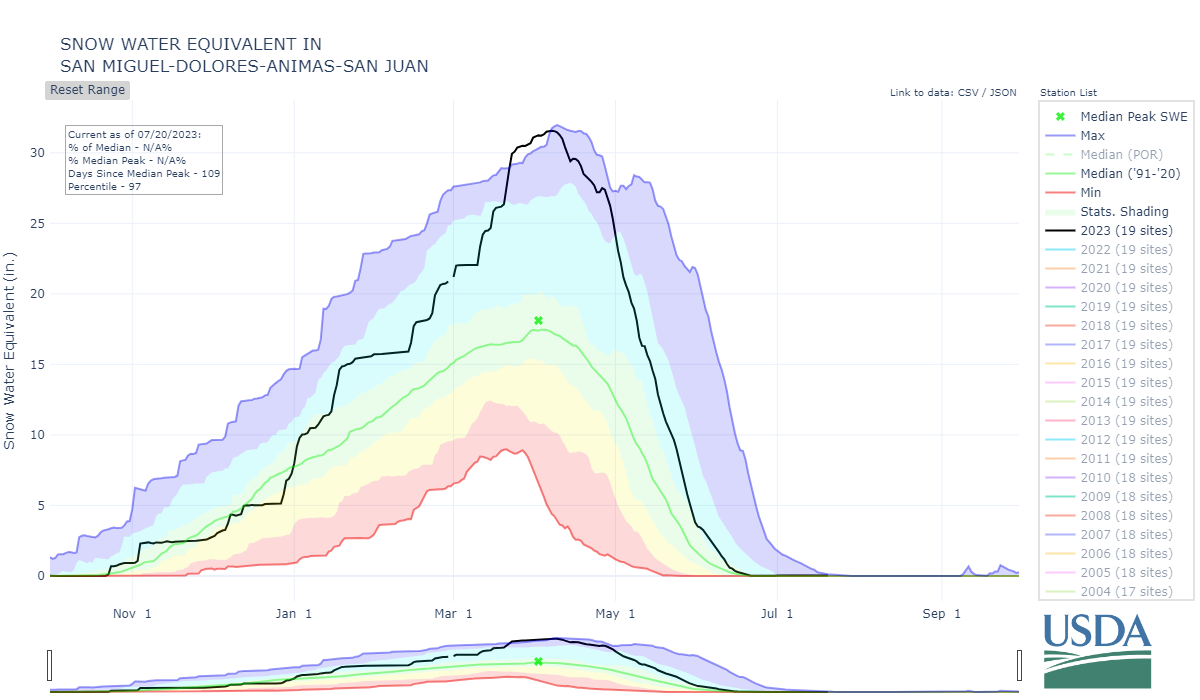

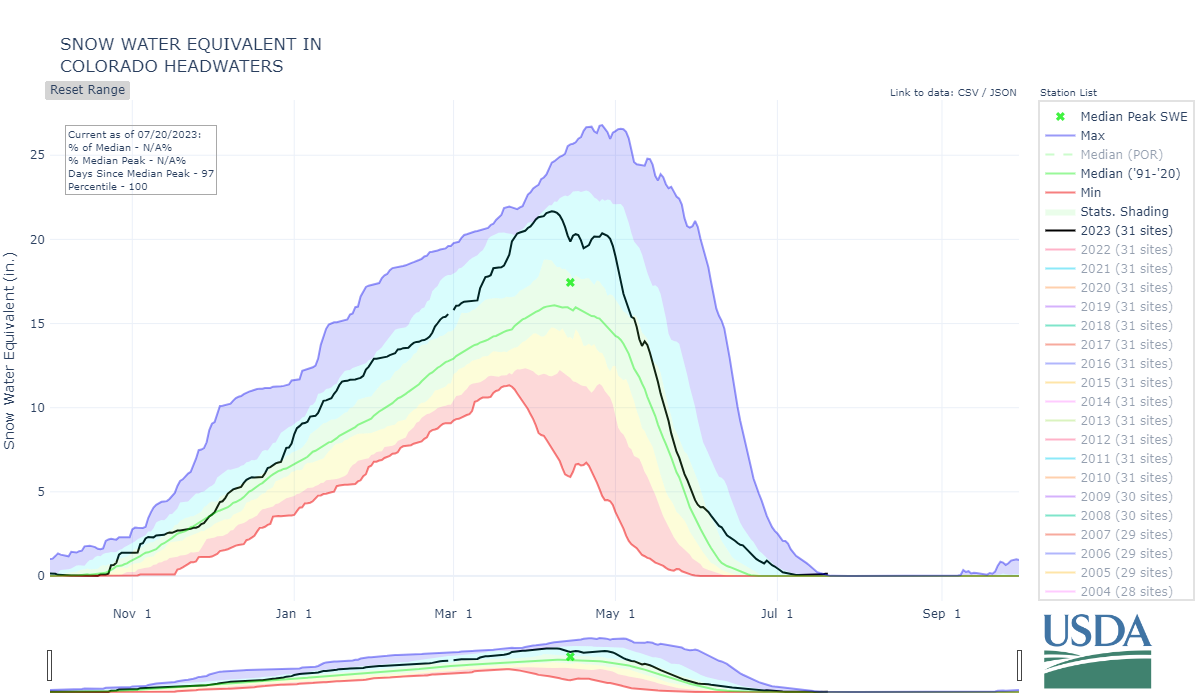
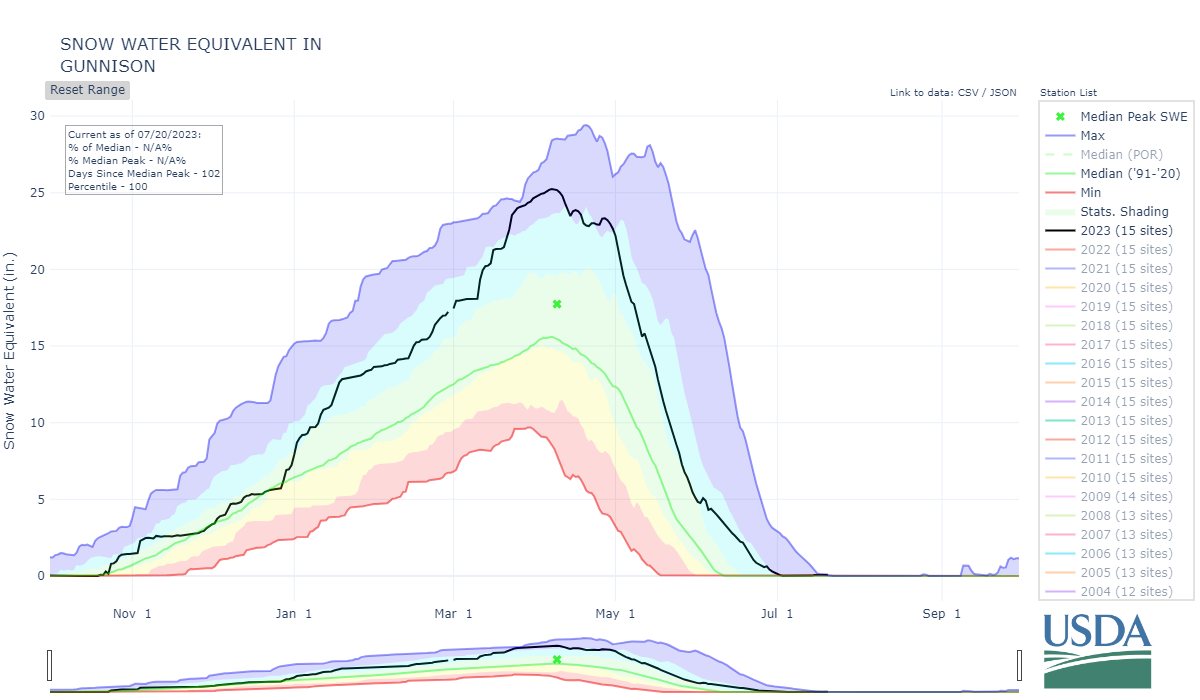
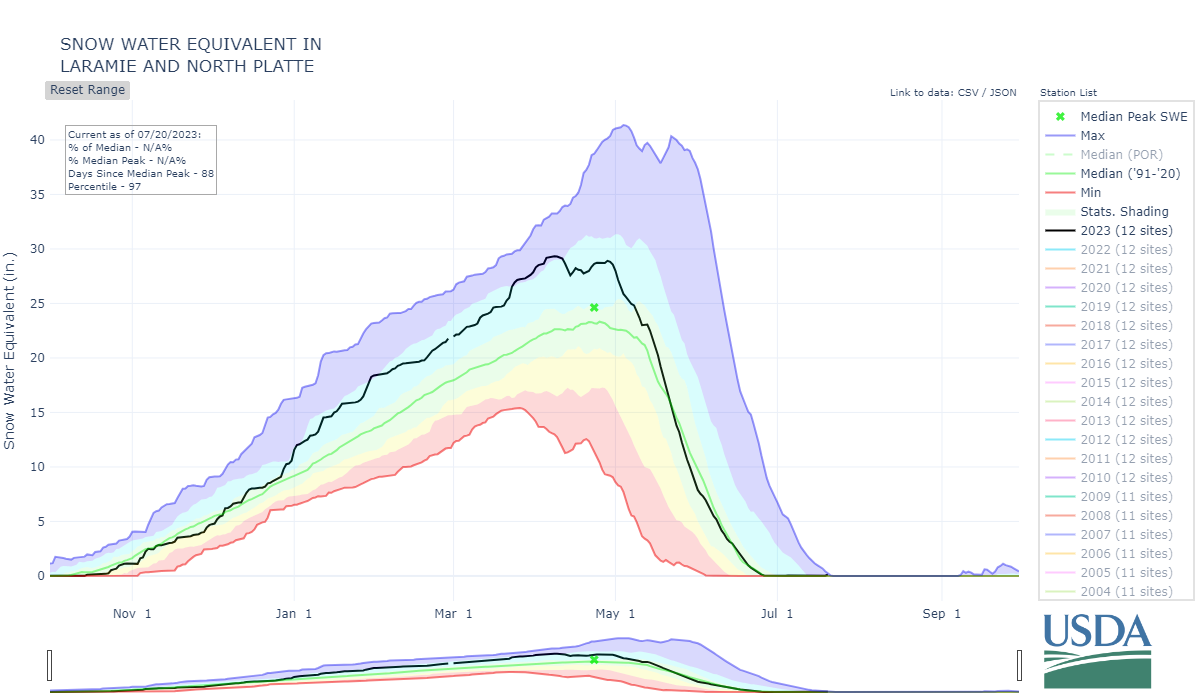
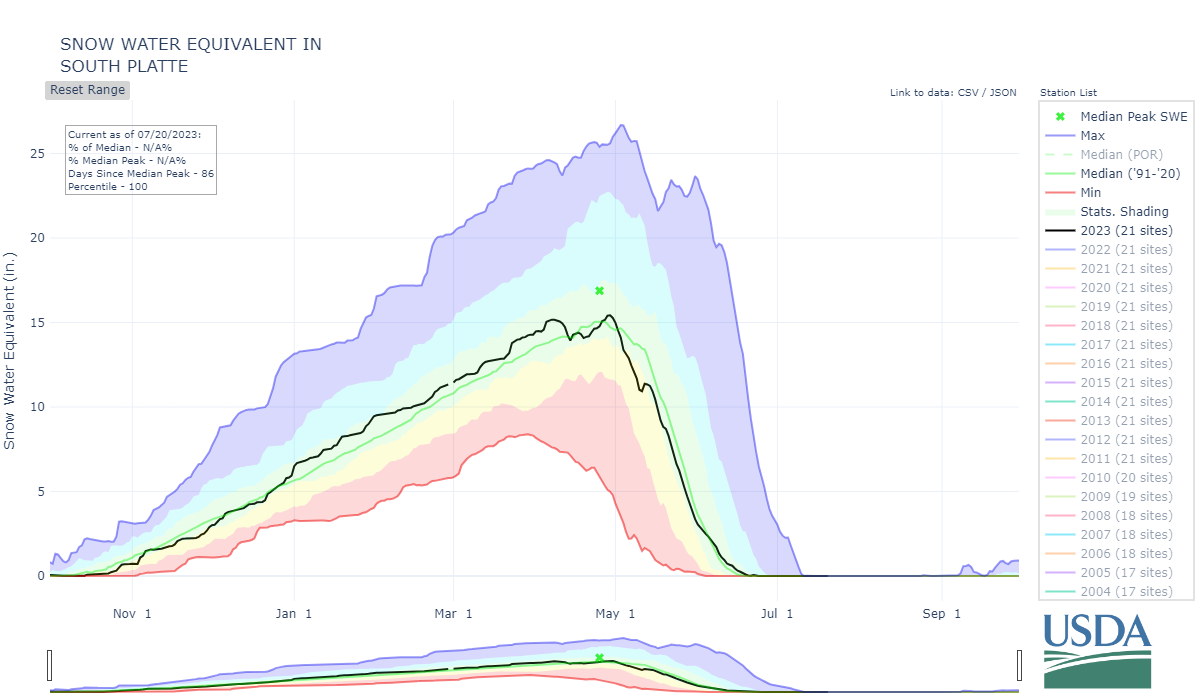
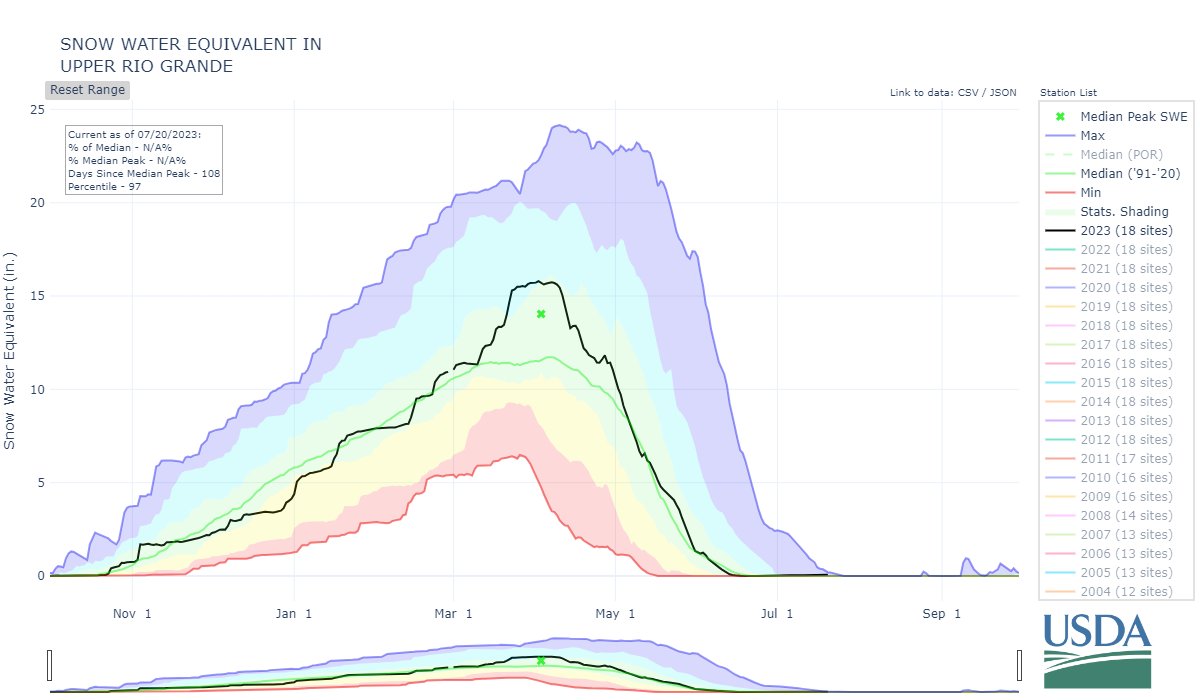
Above: Most Colorado watersheds attained a huge snowpack by April 1st, and was added to by the plentiful snow/rain in June. The two basins that struggled the most was the South Platte and Arkansas, but nonetheless they attained a near normal peak SWE.

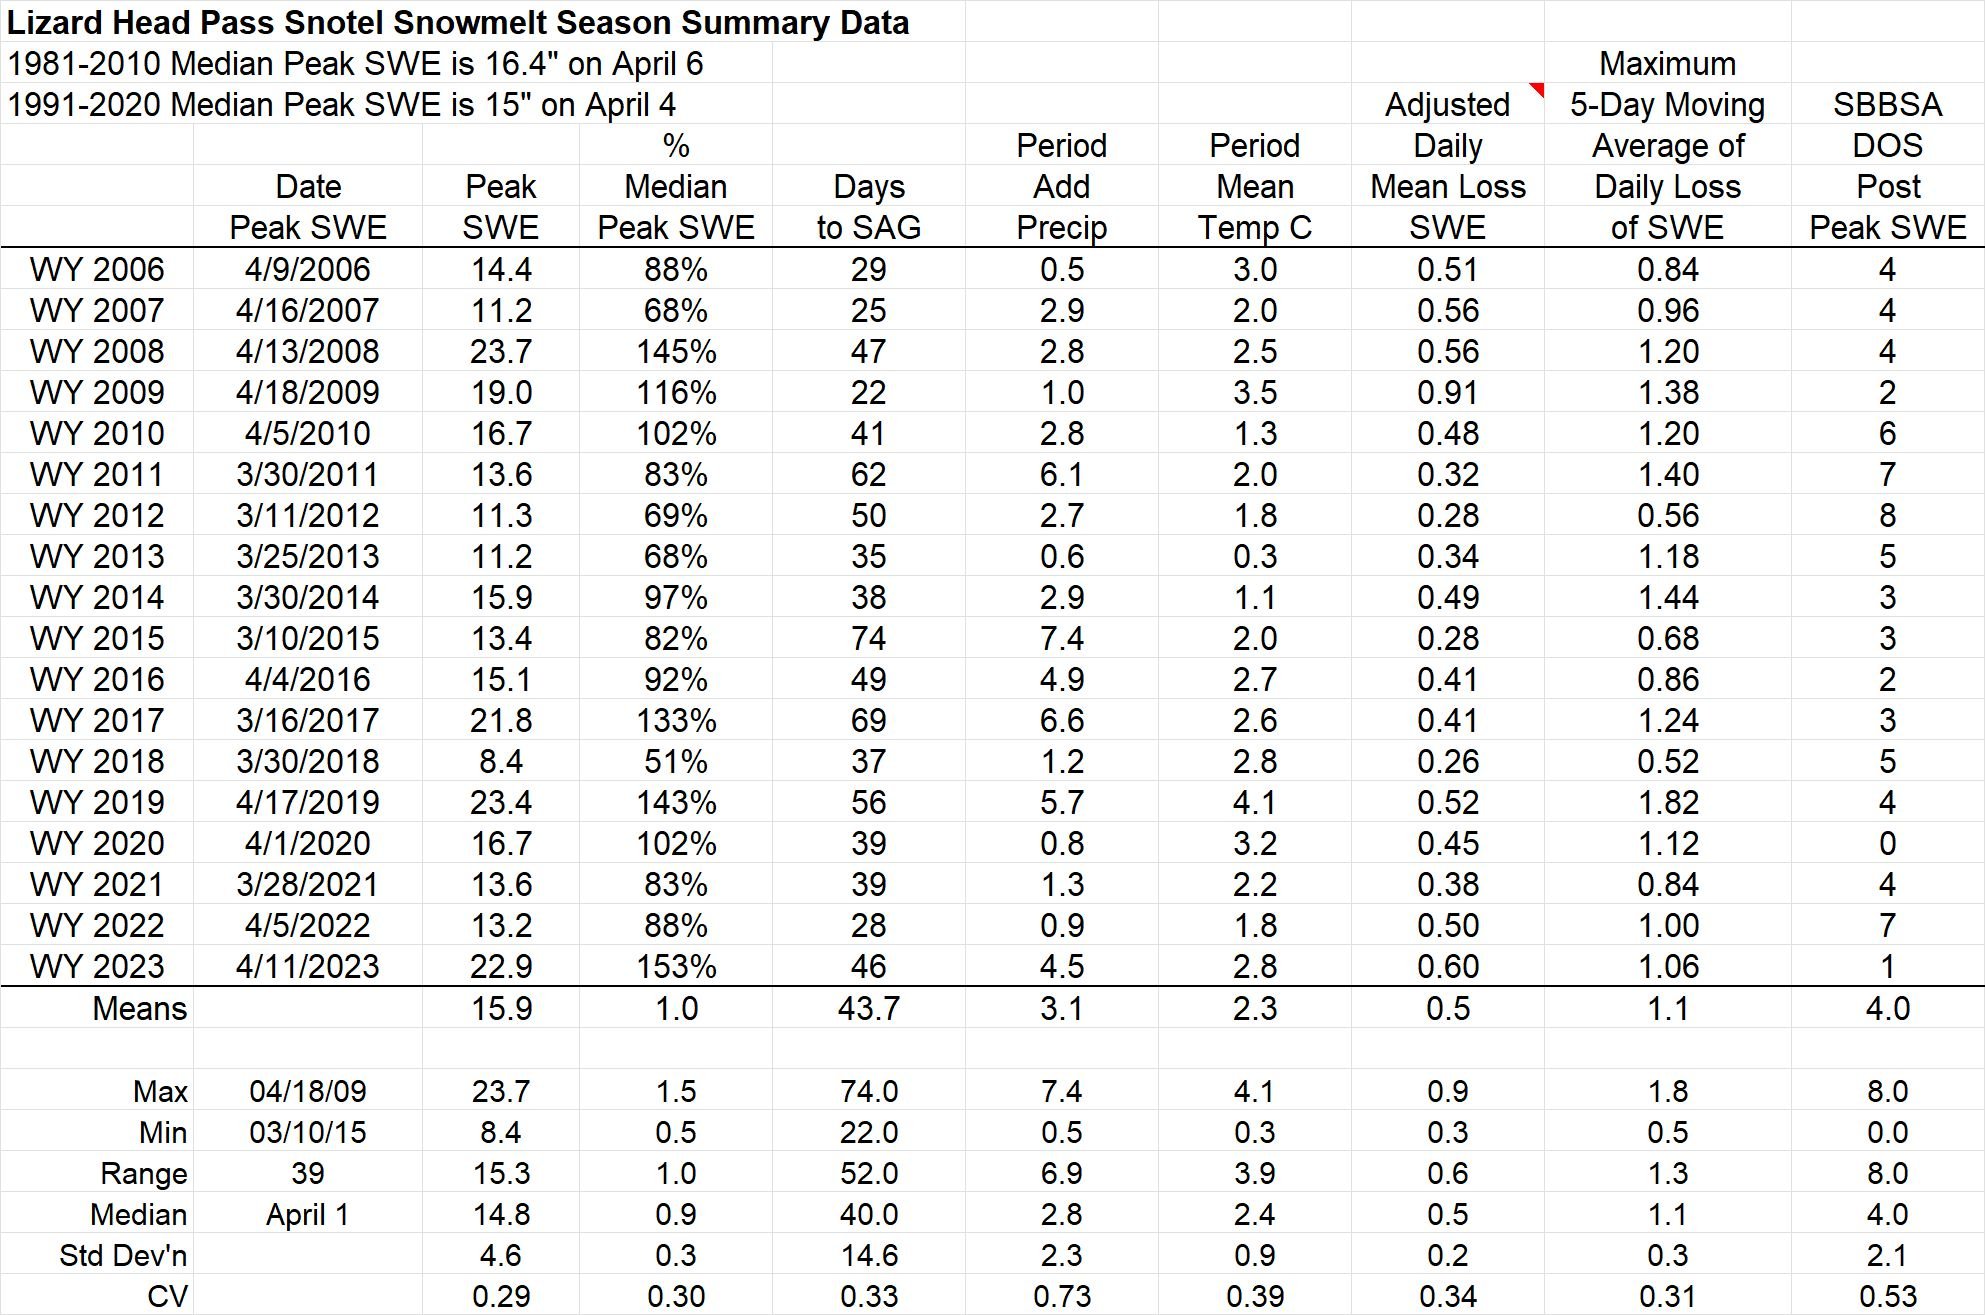

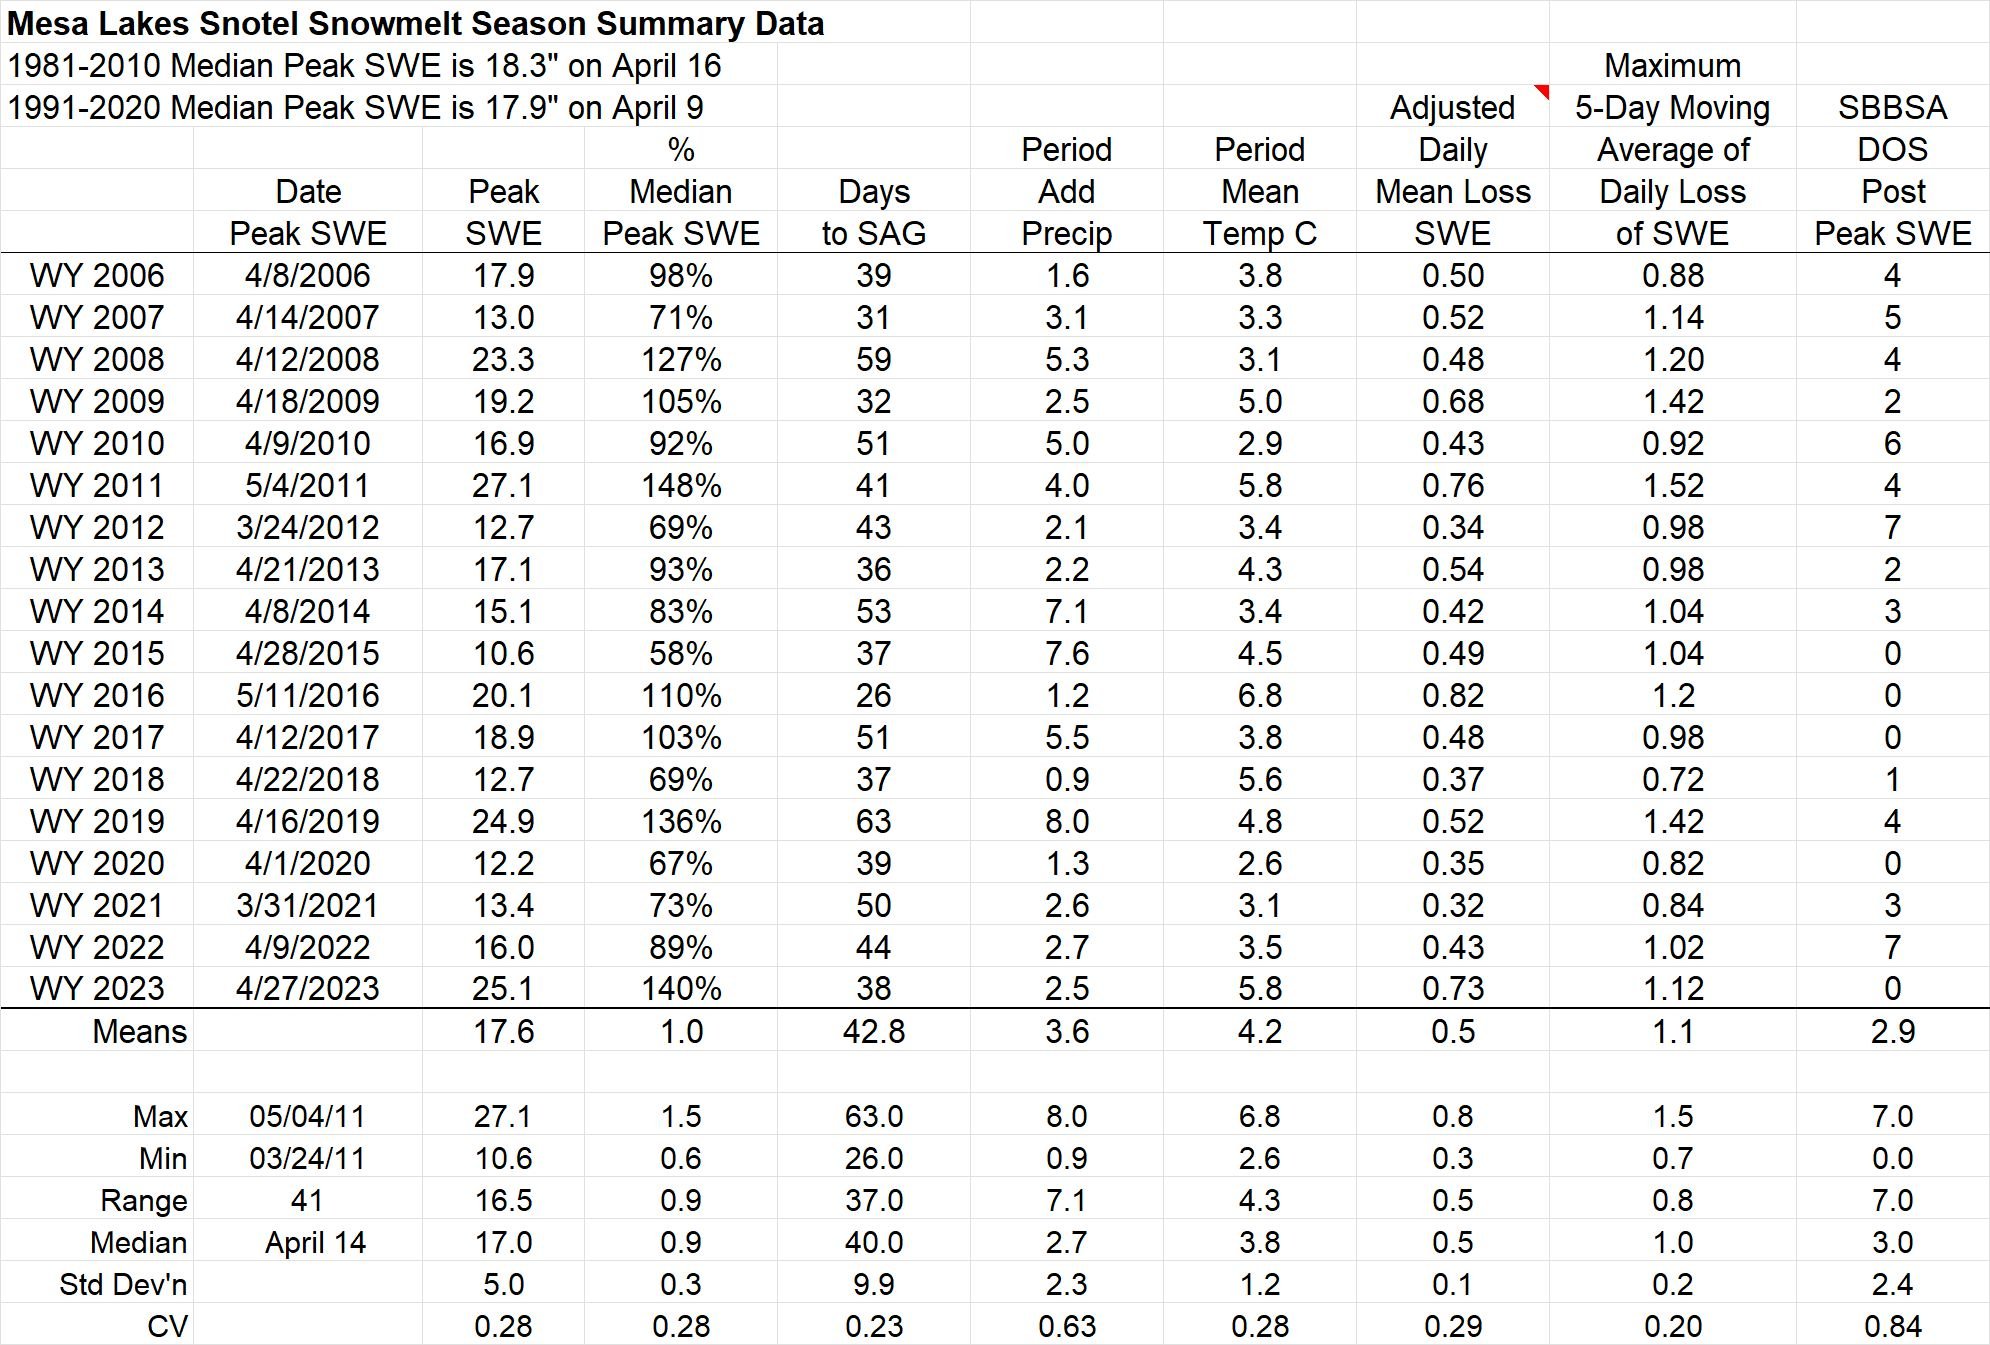
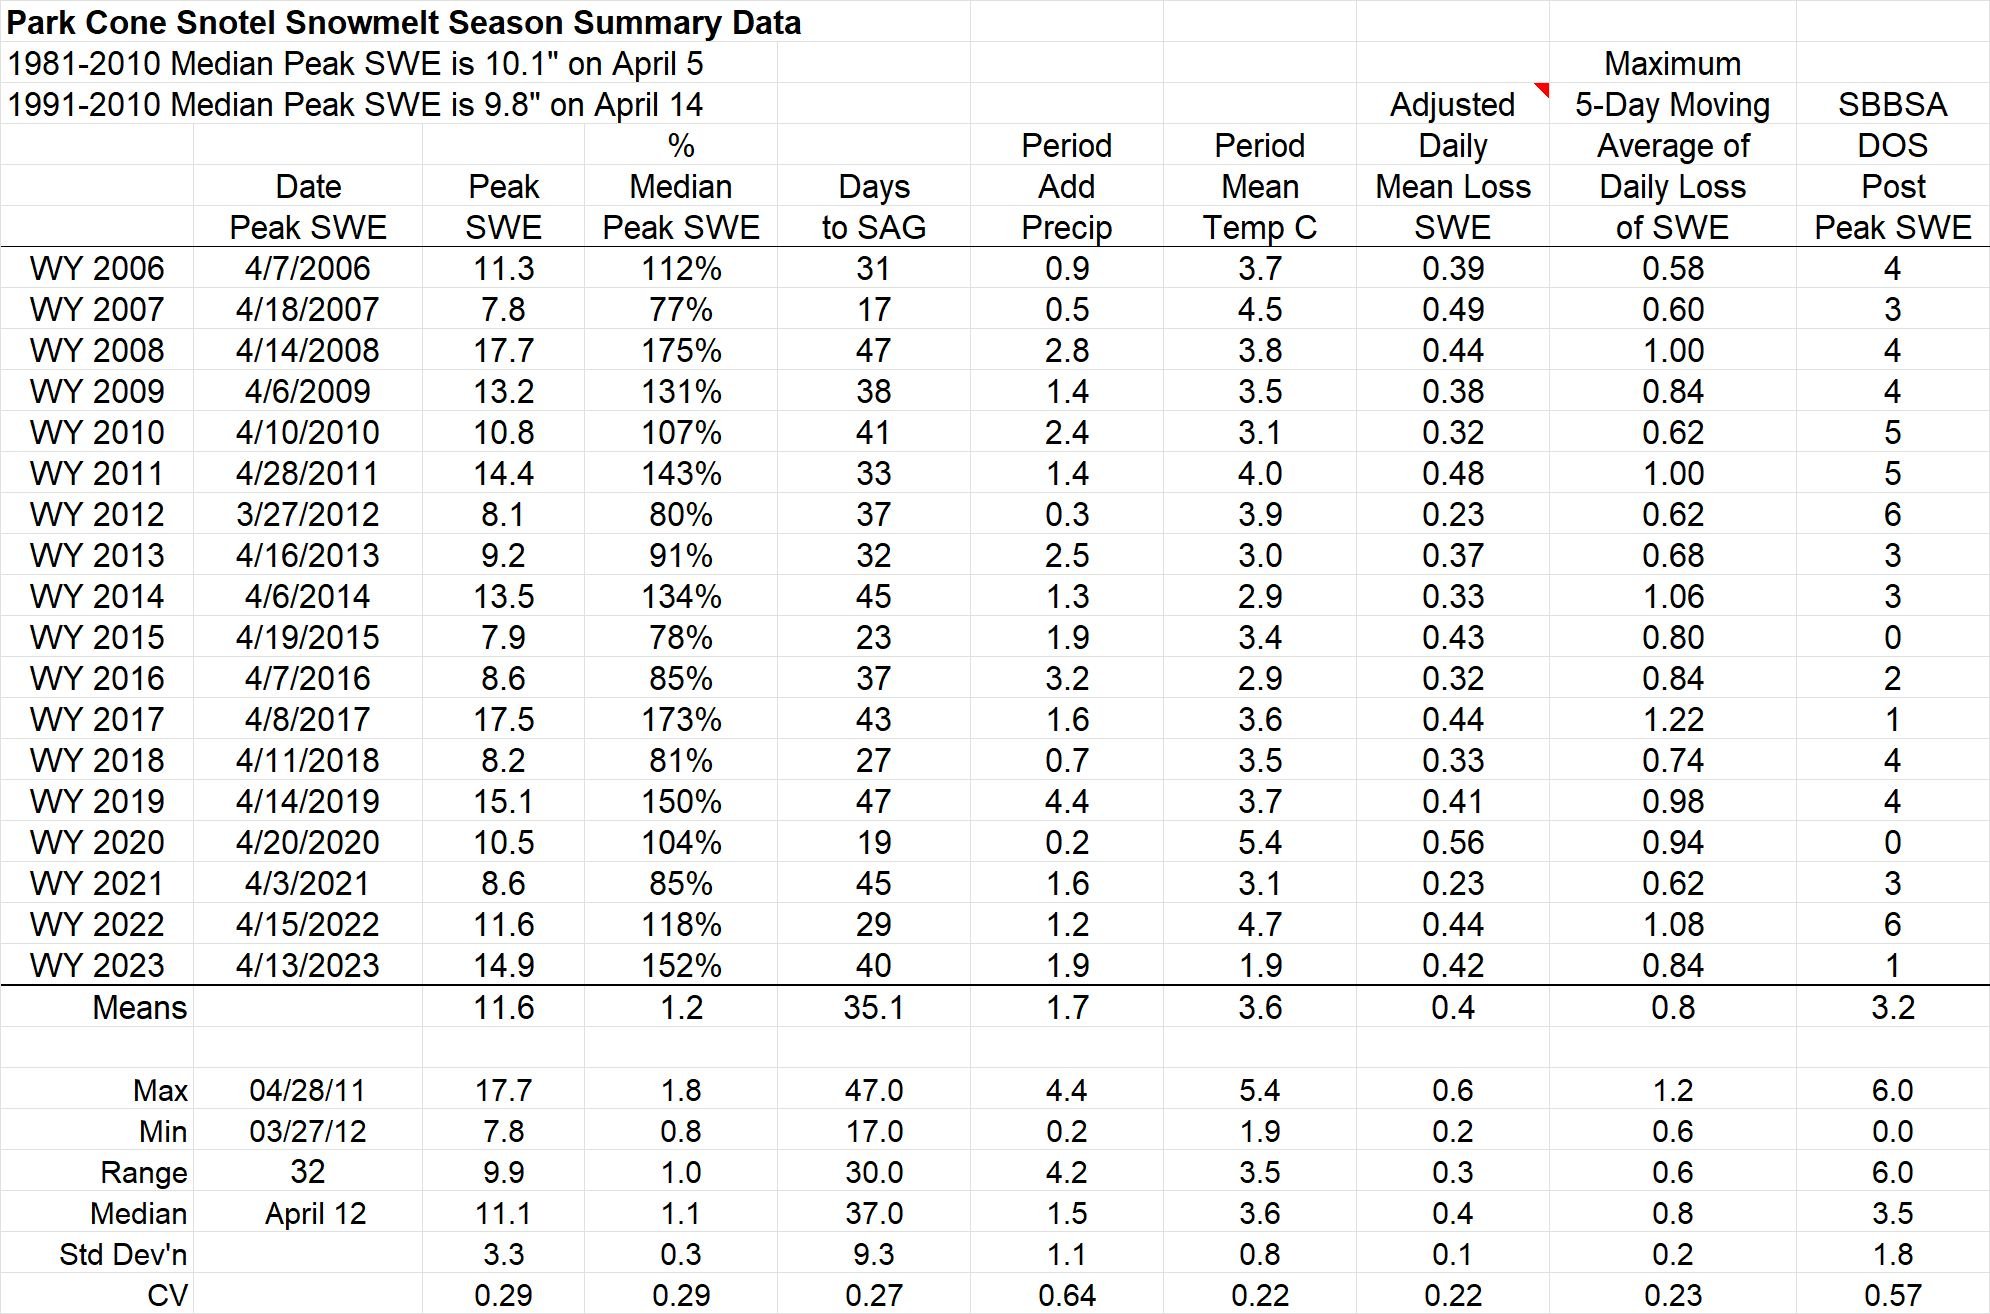
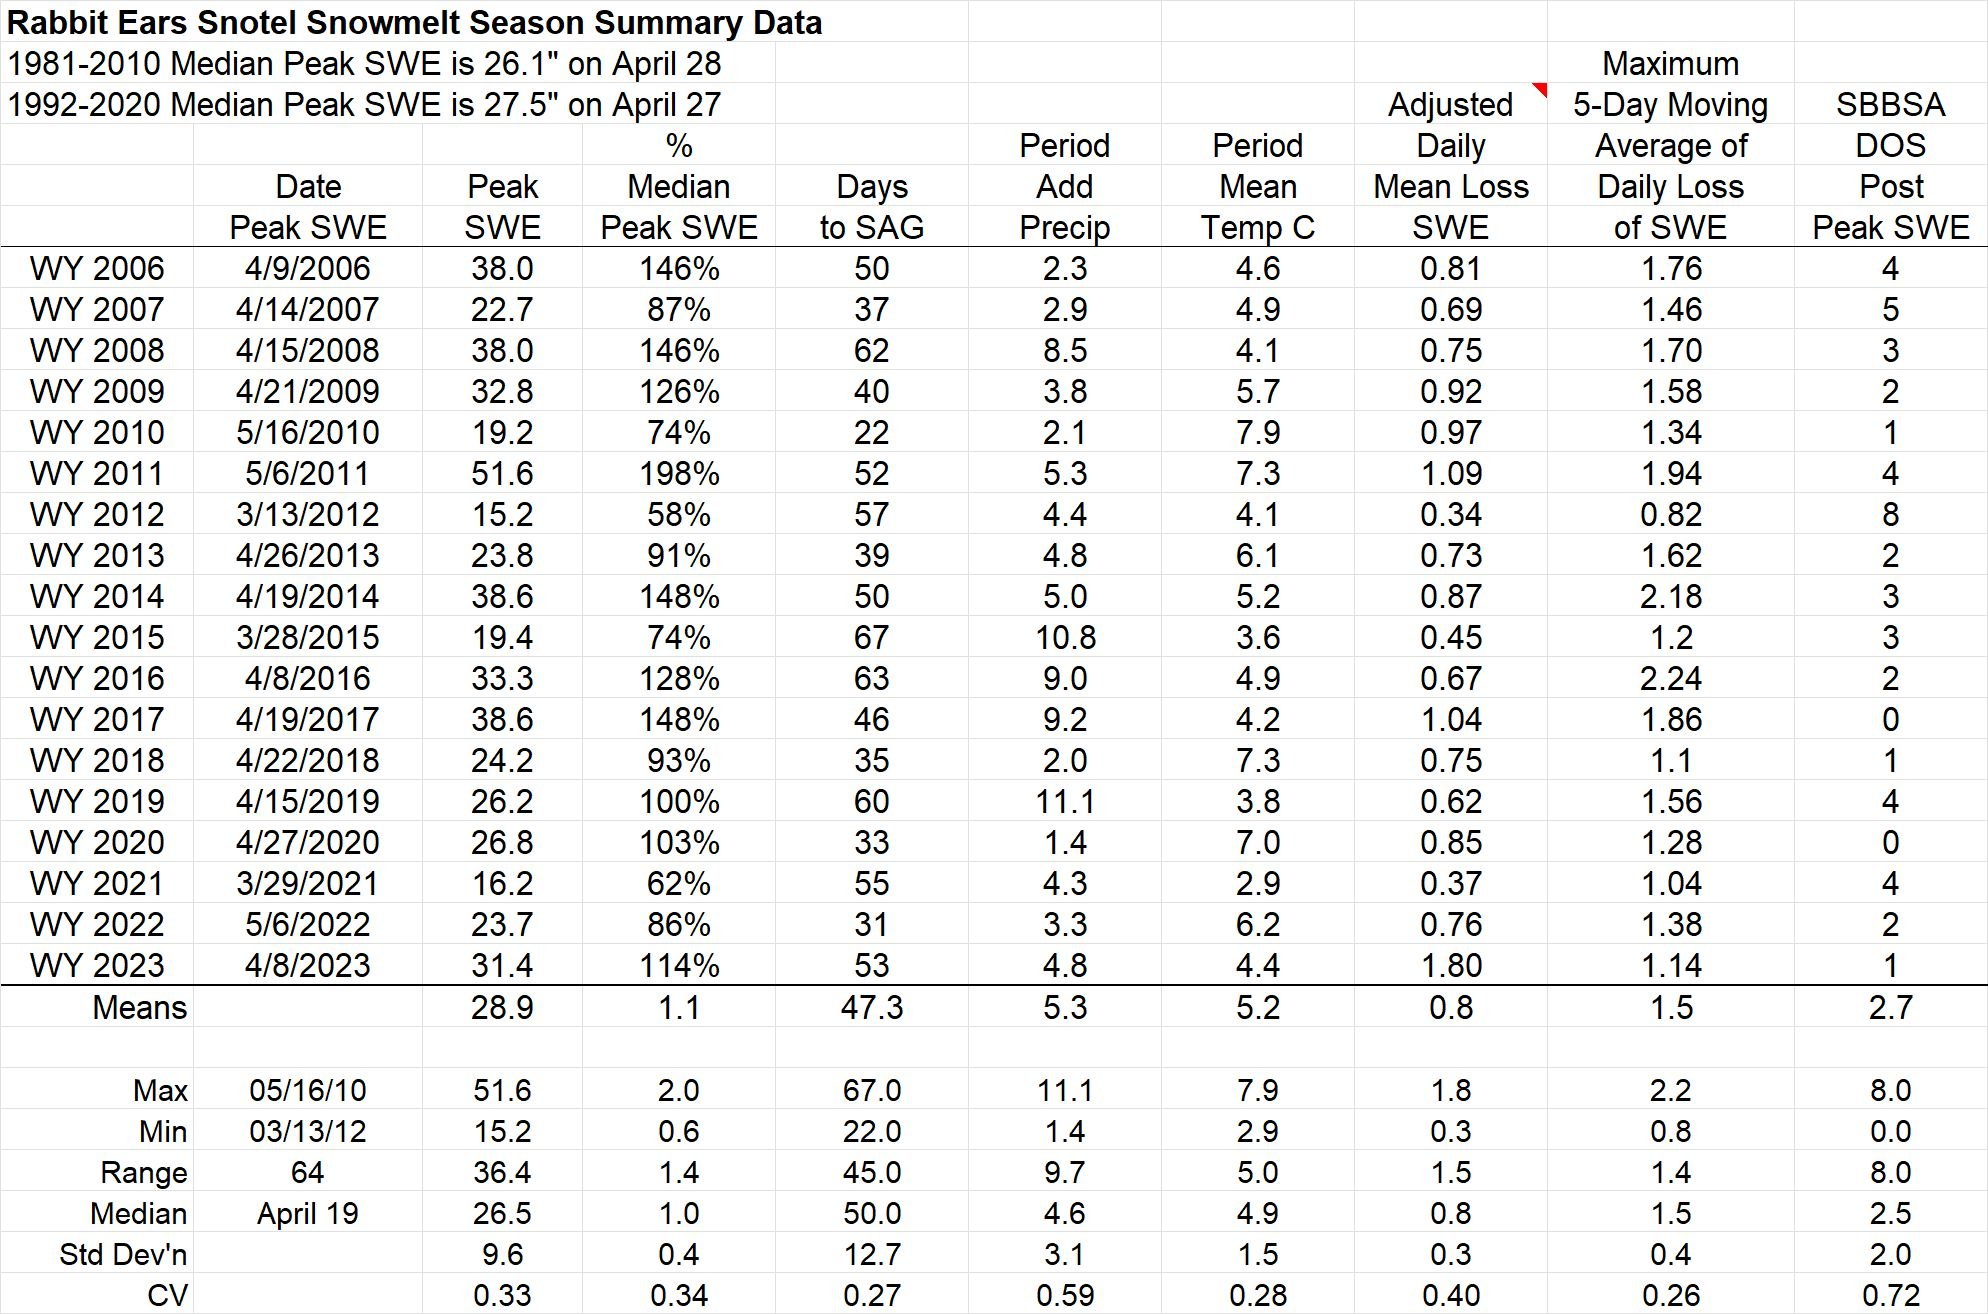


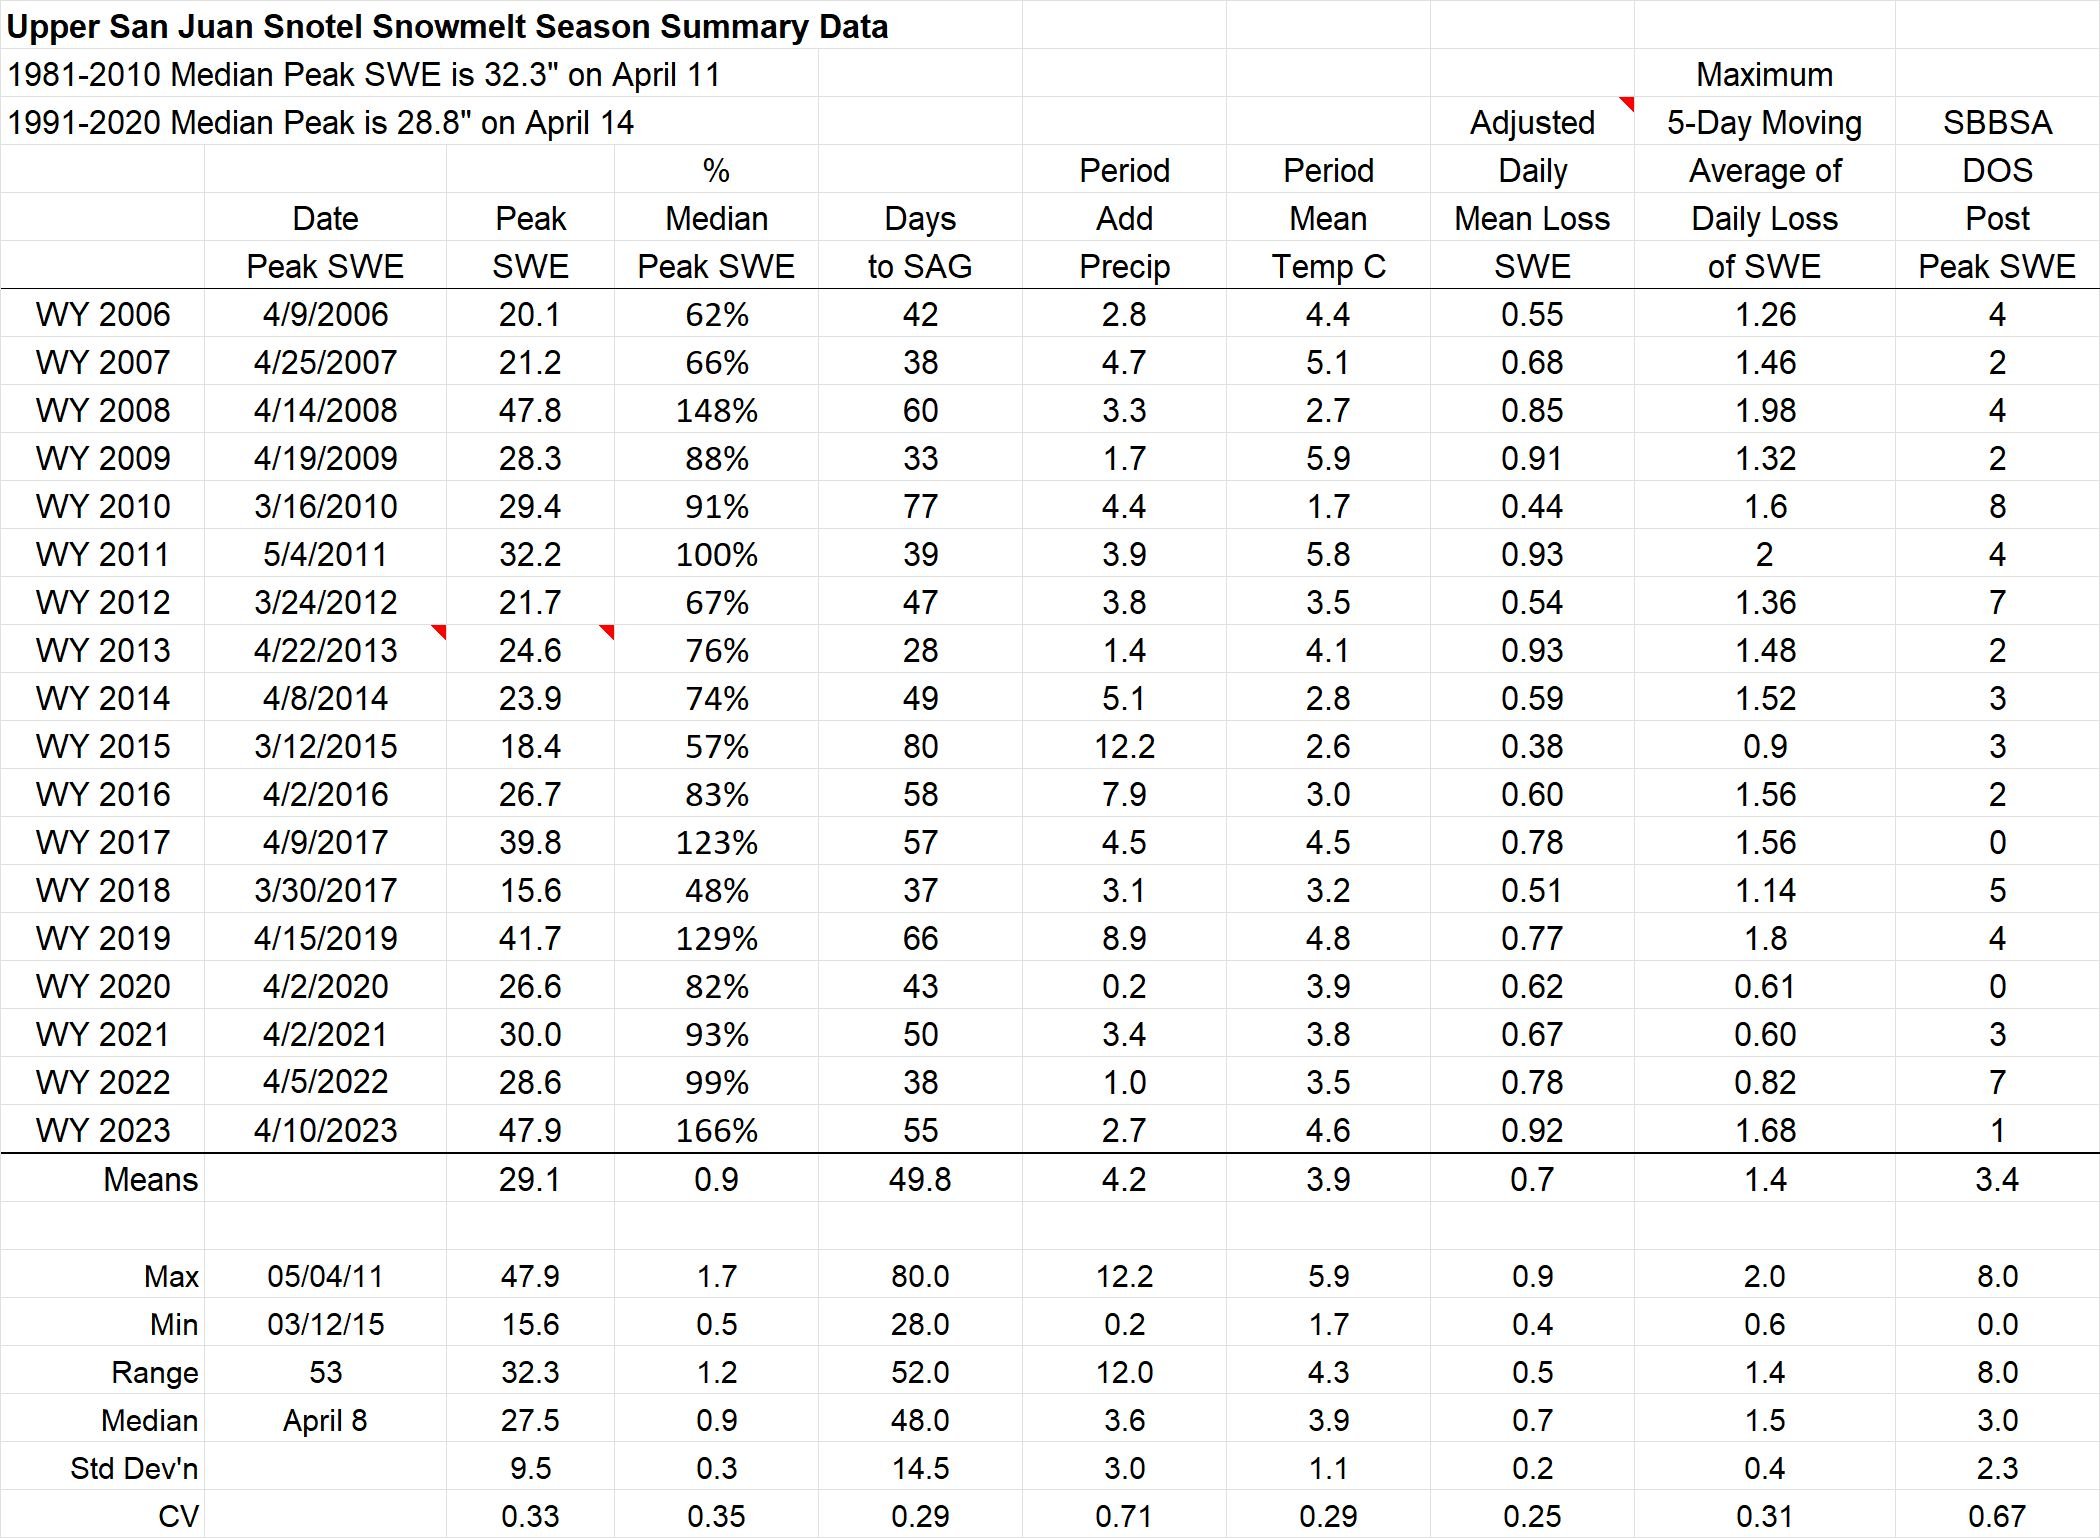
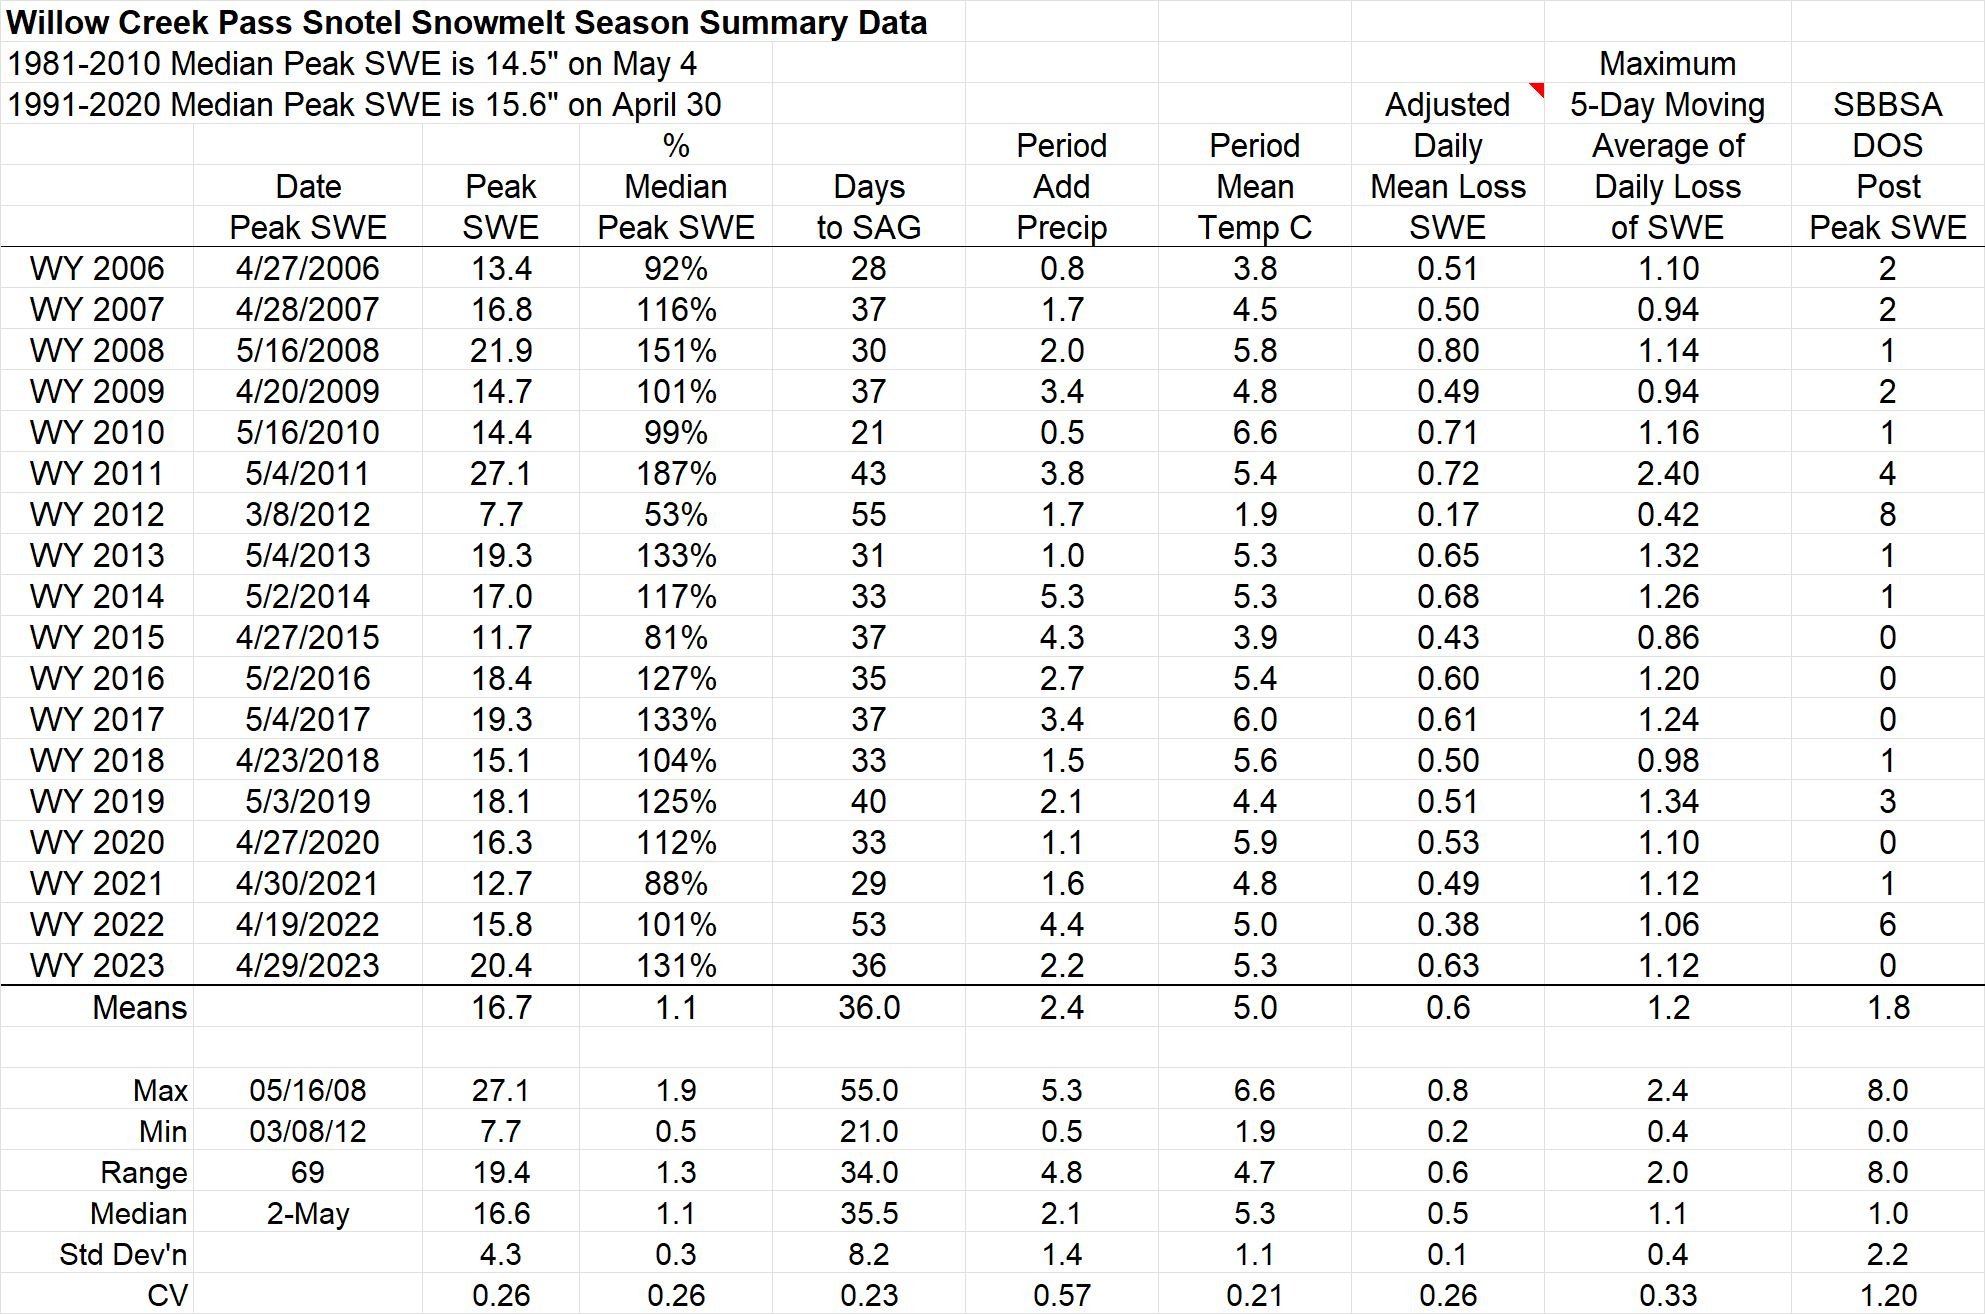
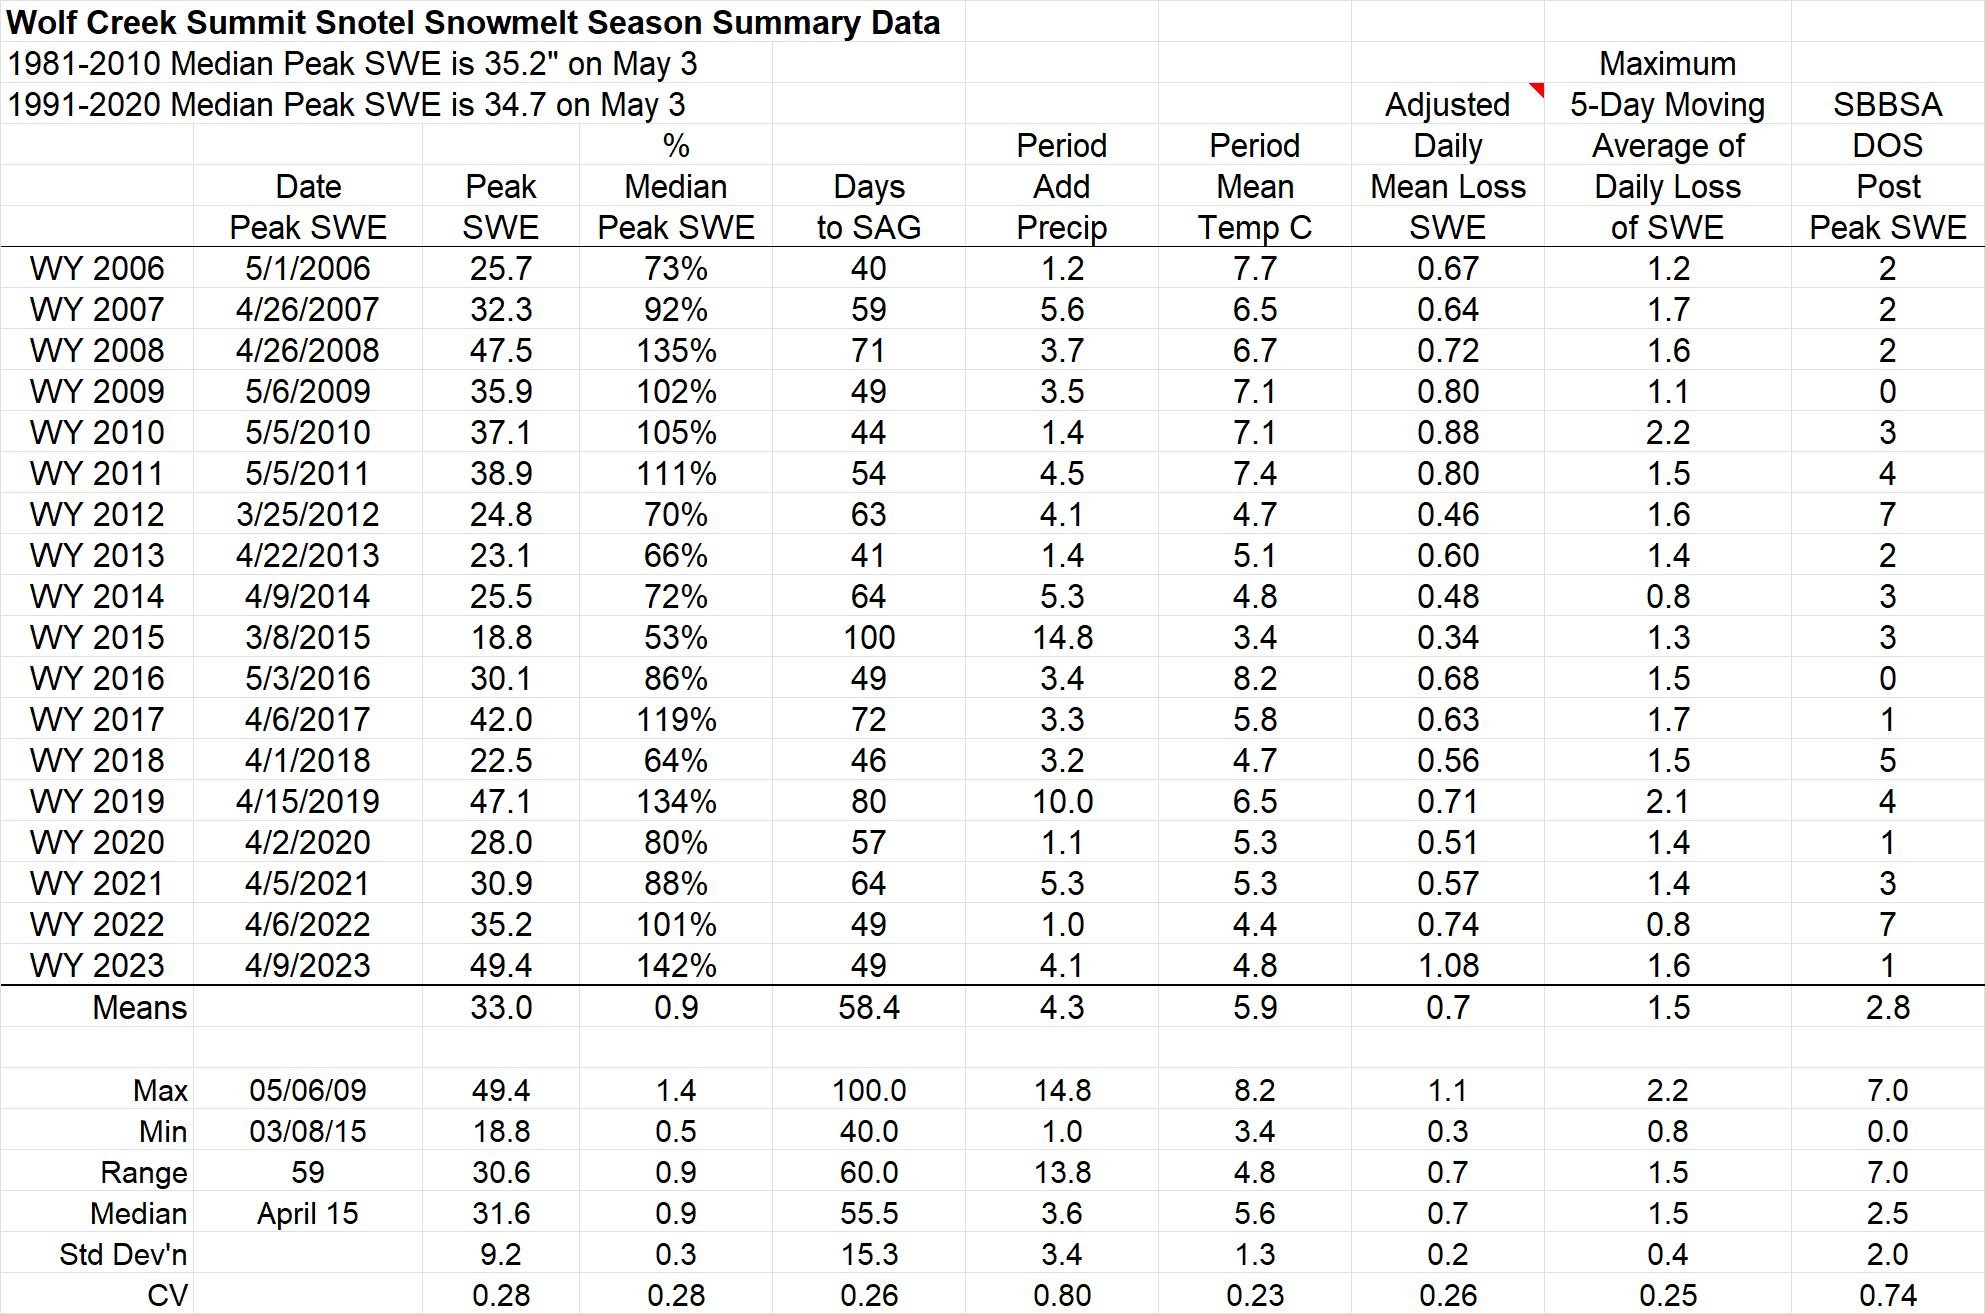
Above: Annual statistics for individual SNOTEL stations tracked by the CODOS Program.
Below: Summary statistics for individual SNOTEL stations.
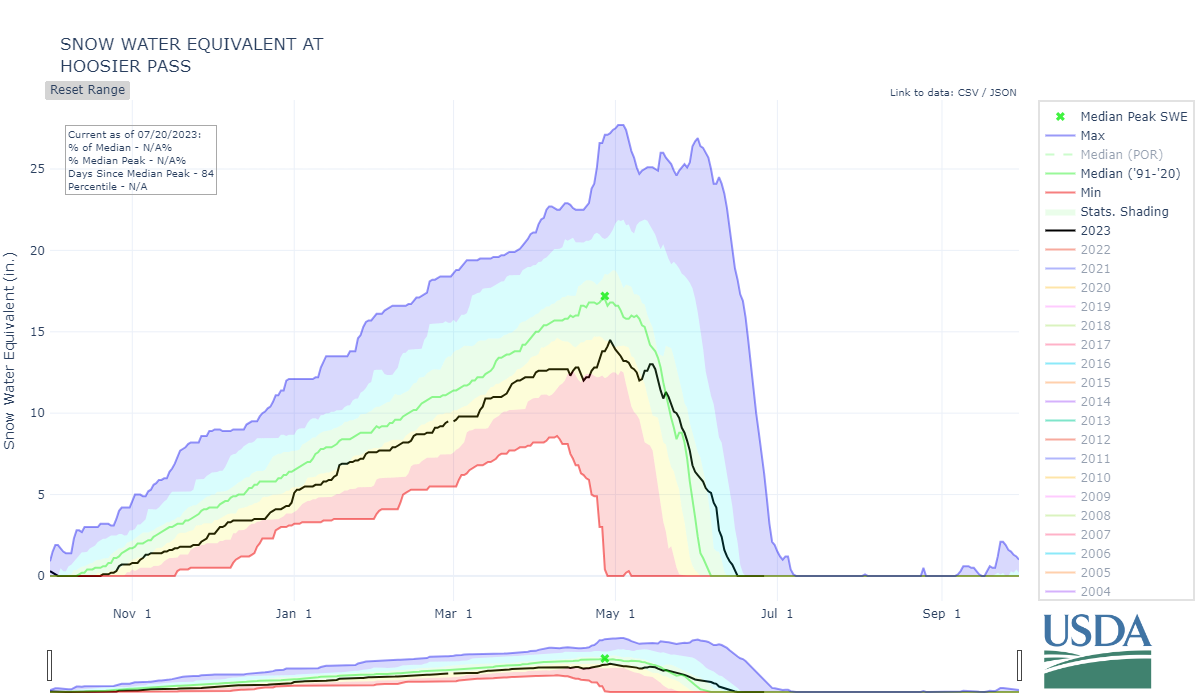
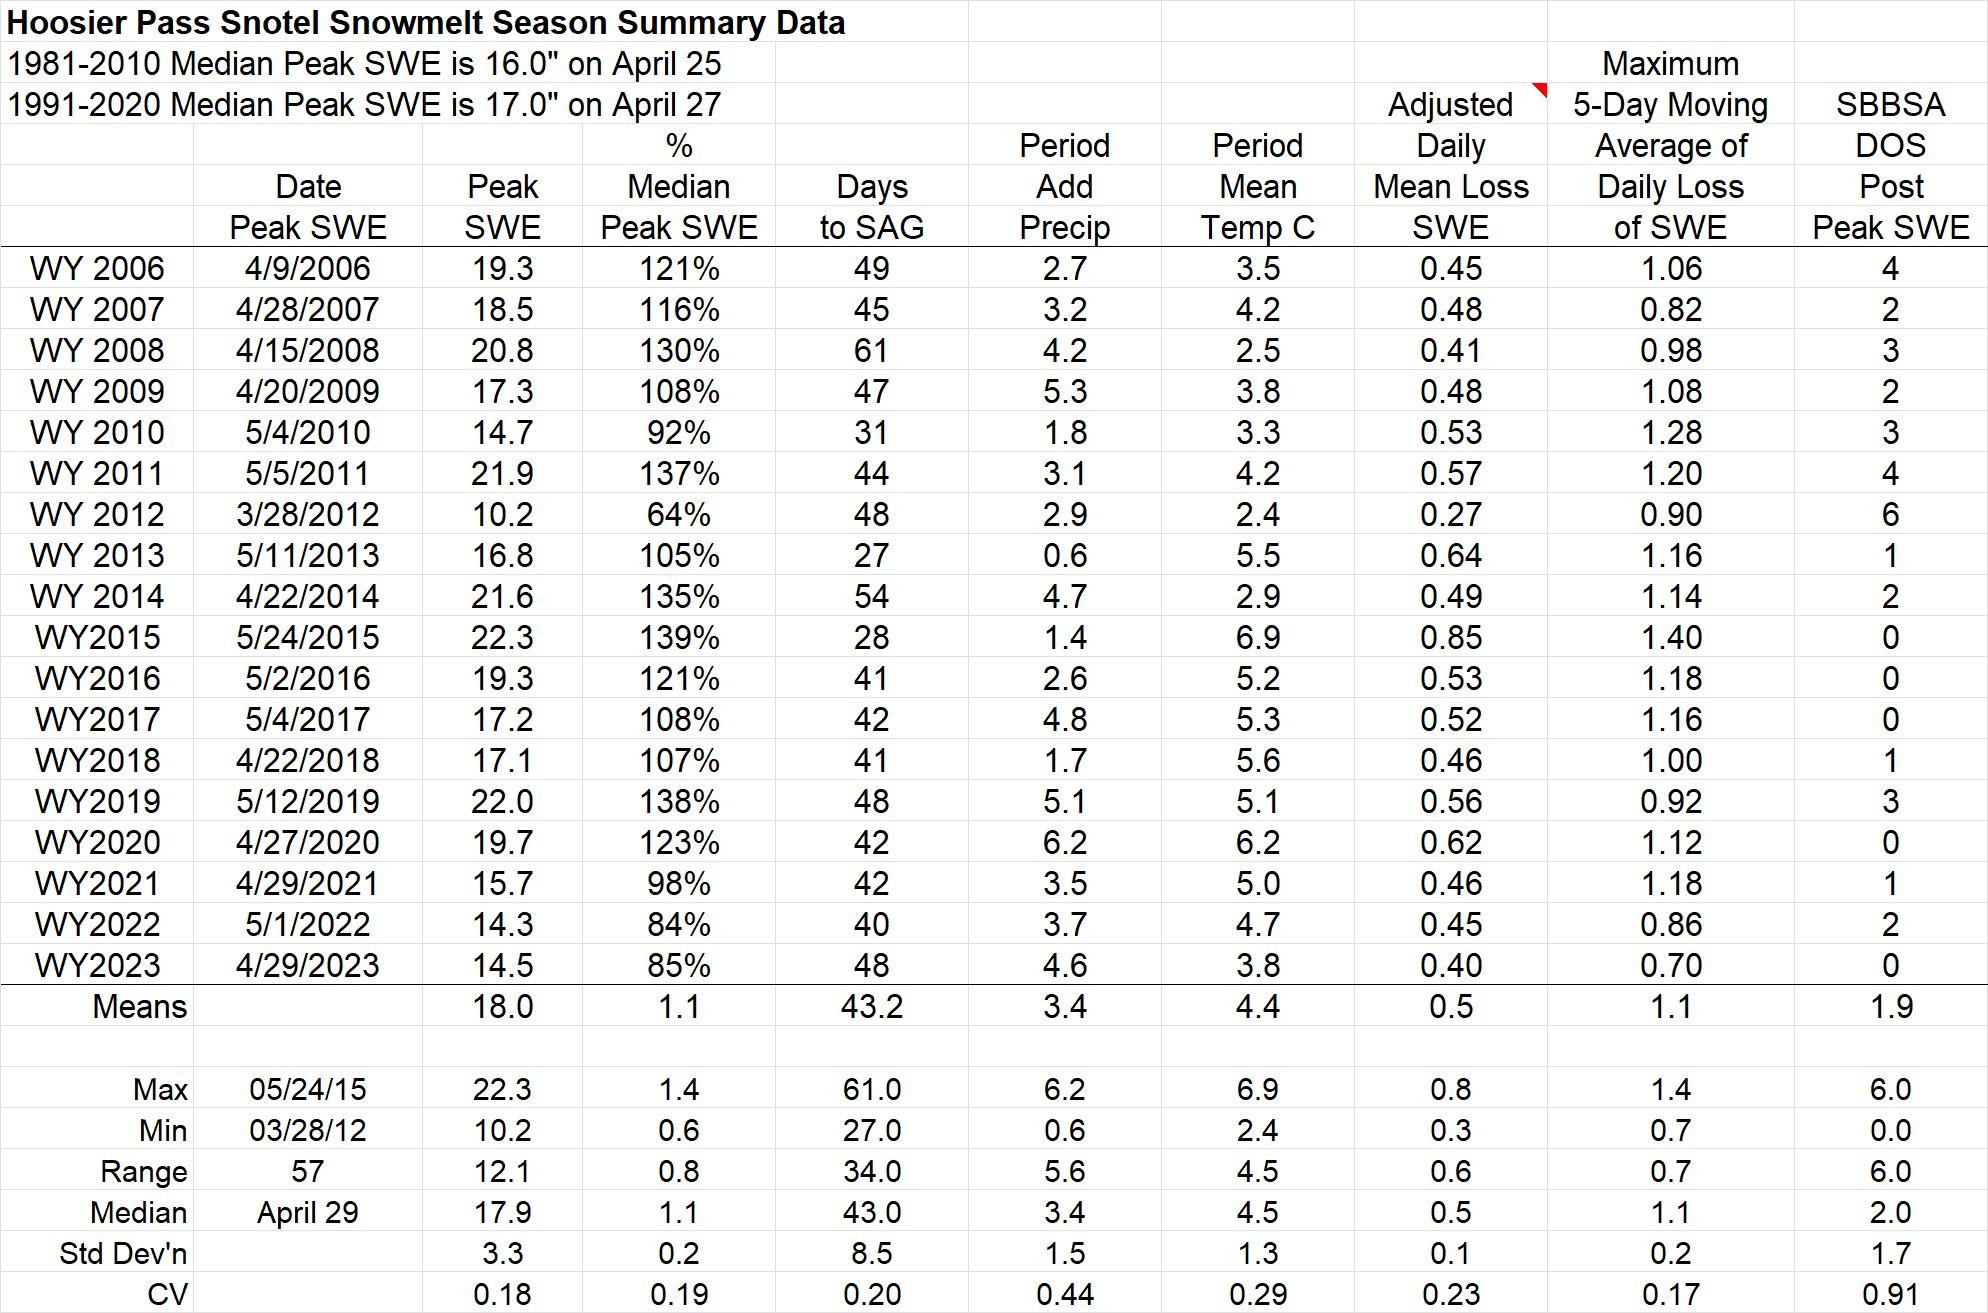
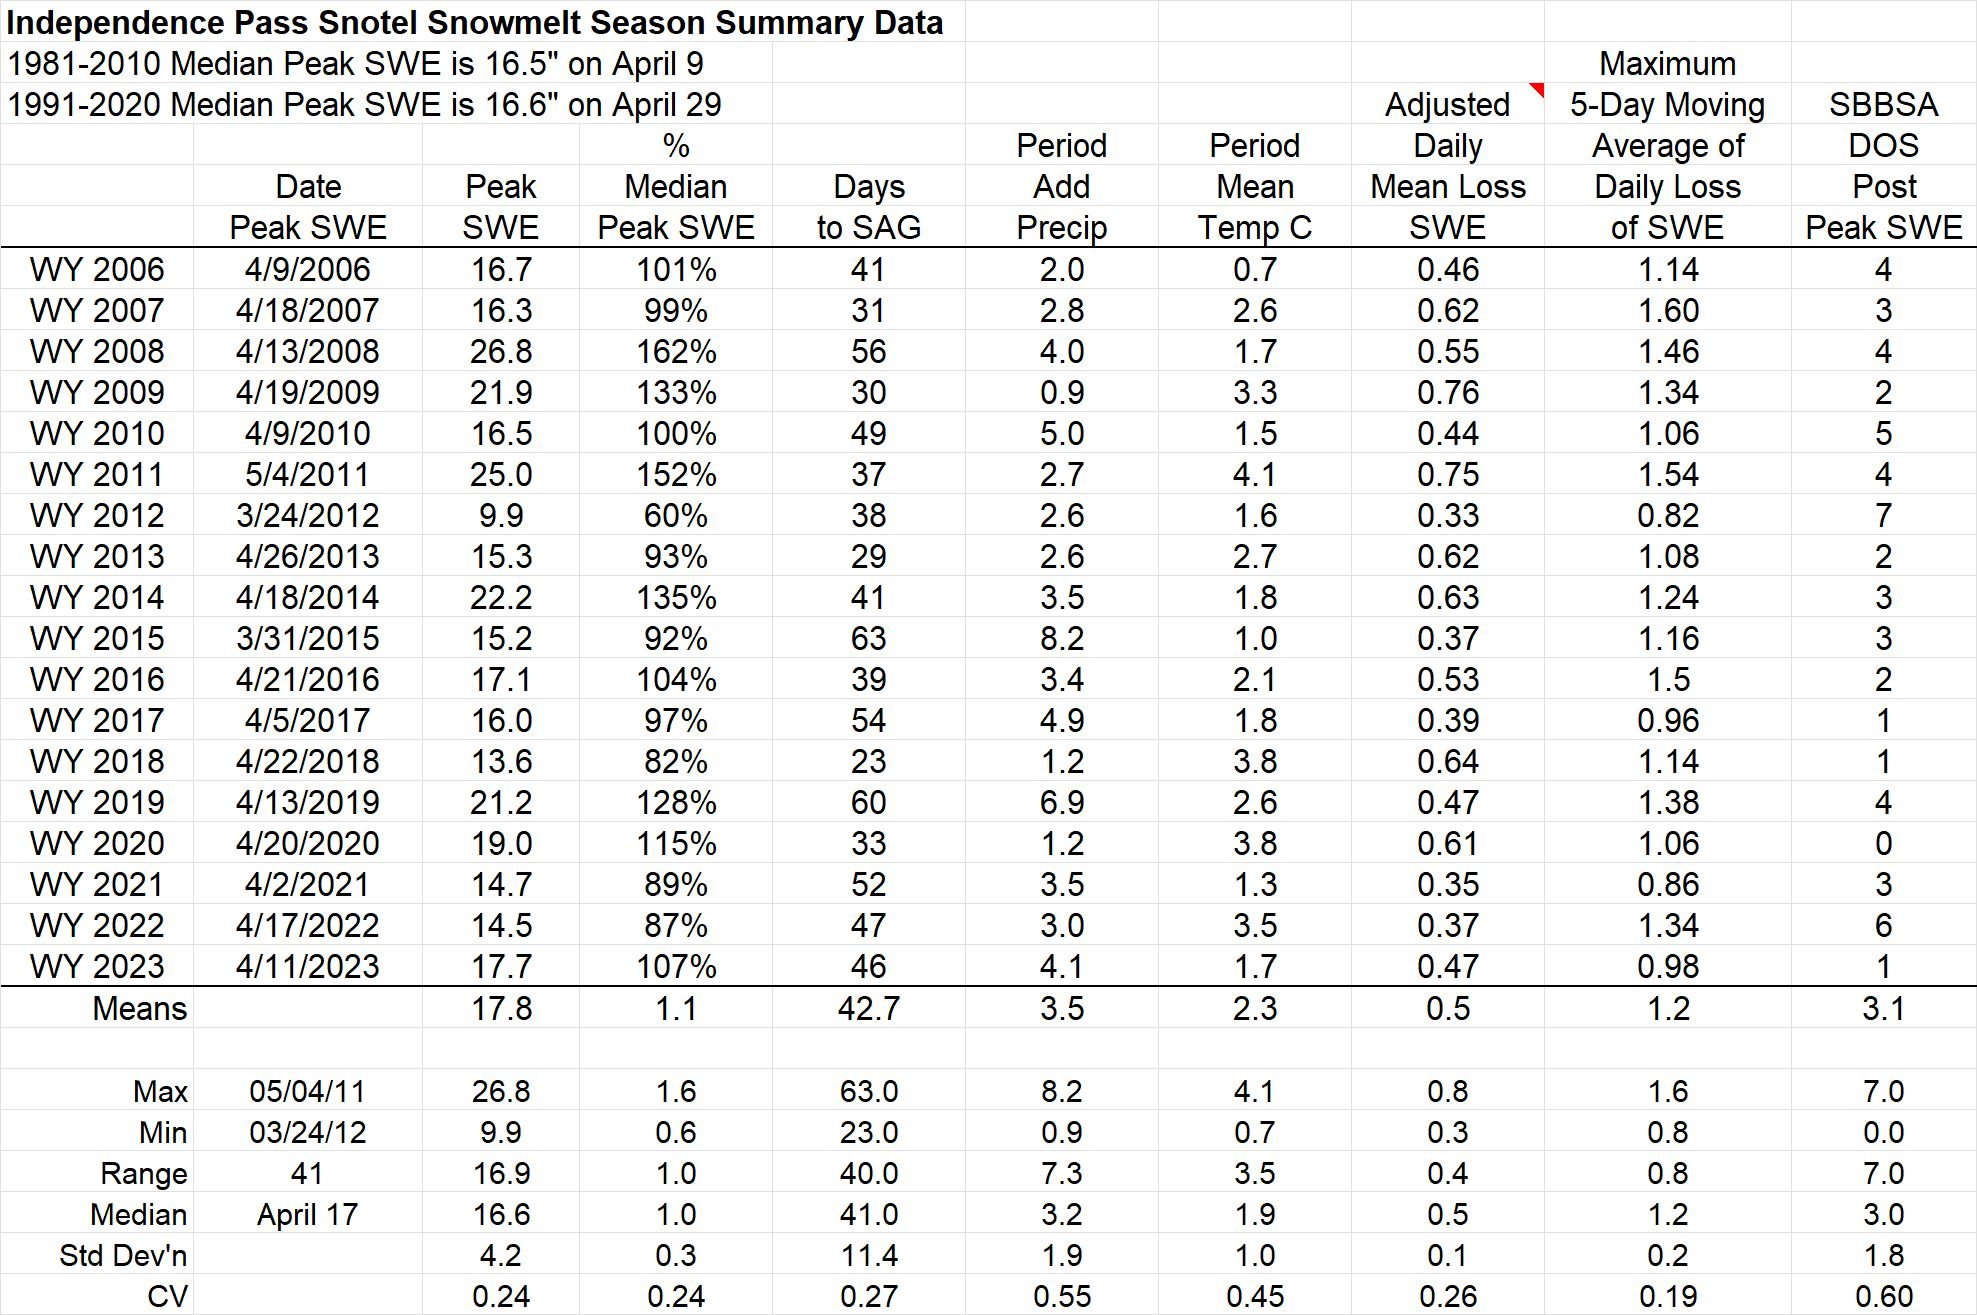
Below: Summary data for WY2023 at the 16 SNOTEL stations that CODOS monitors. The table shows peak SWE, and calculated from the day of peak SWE, melt rates, days to snow-all-gone, and mean temperature. Only Hoosier and Mesa Lakes sites were below 90% of their normal peak SWE. Most sites were well over 100% of normal.

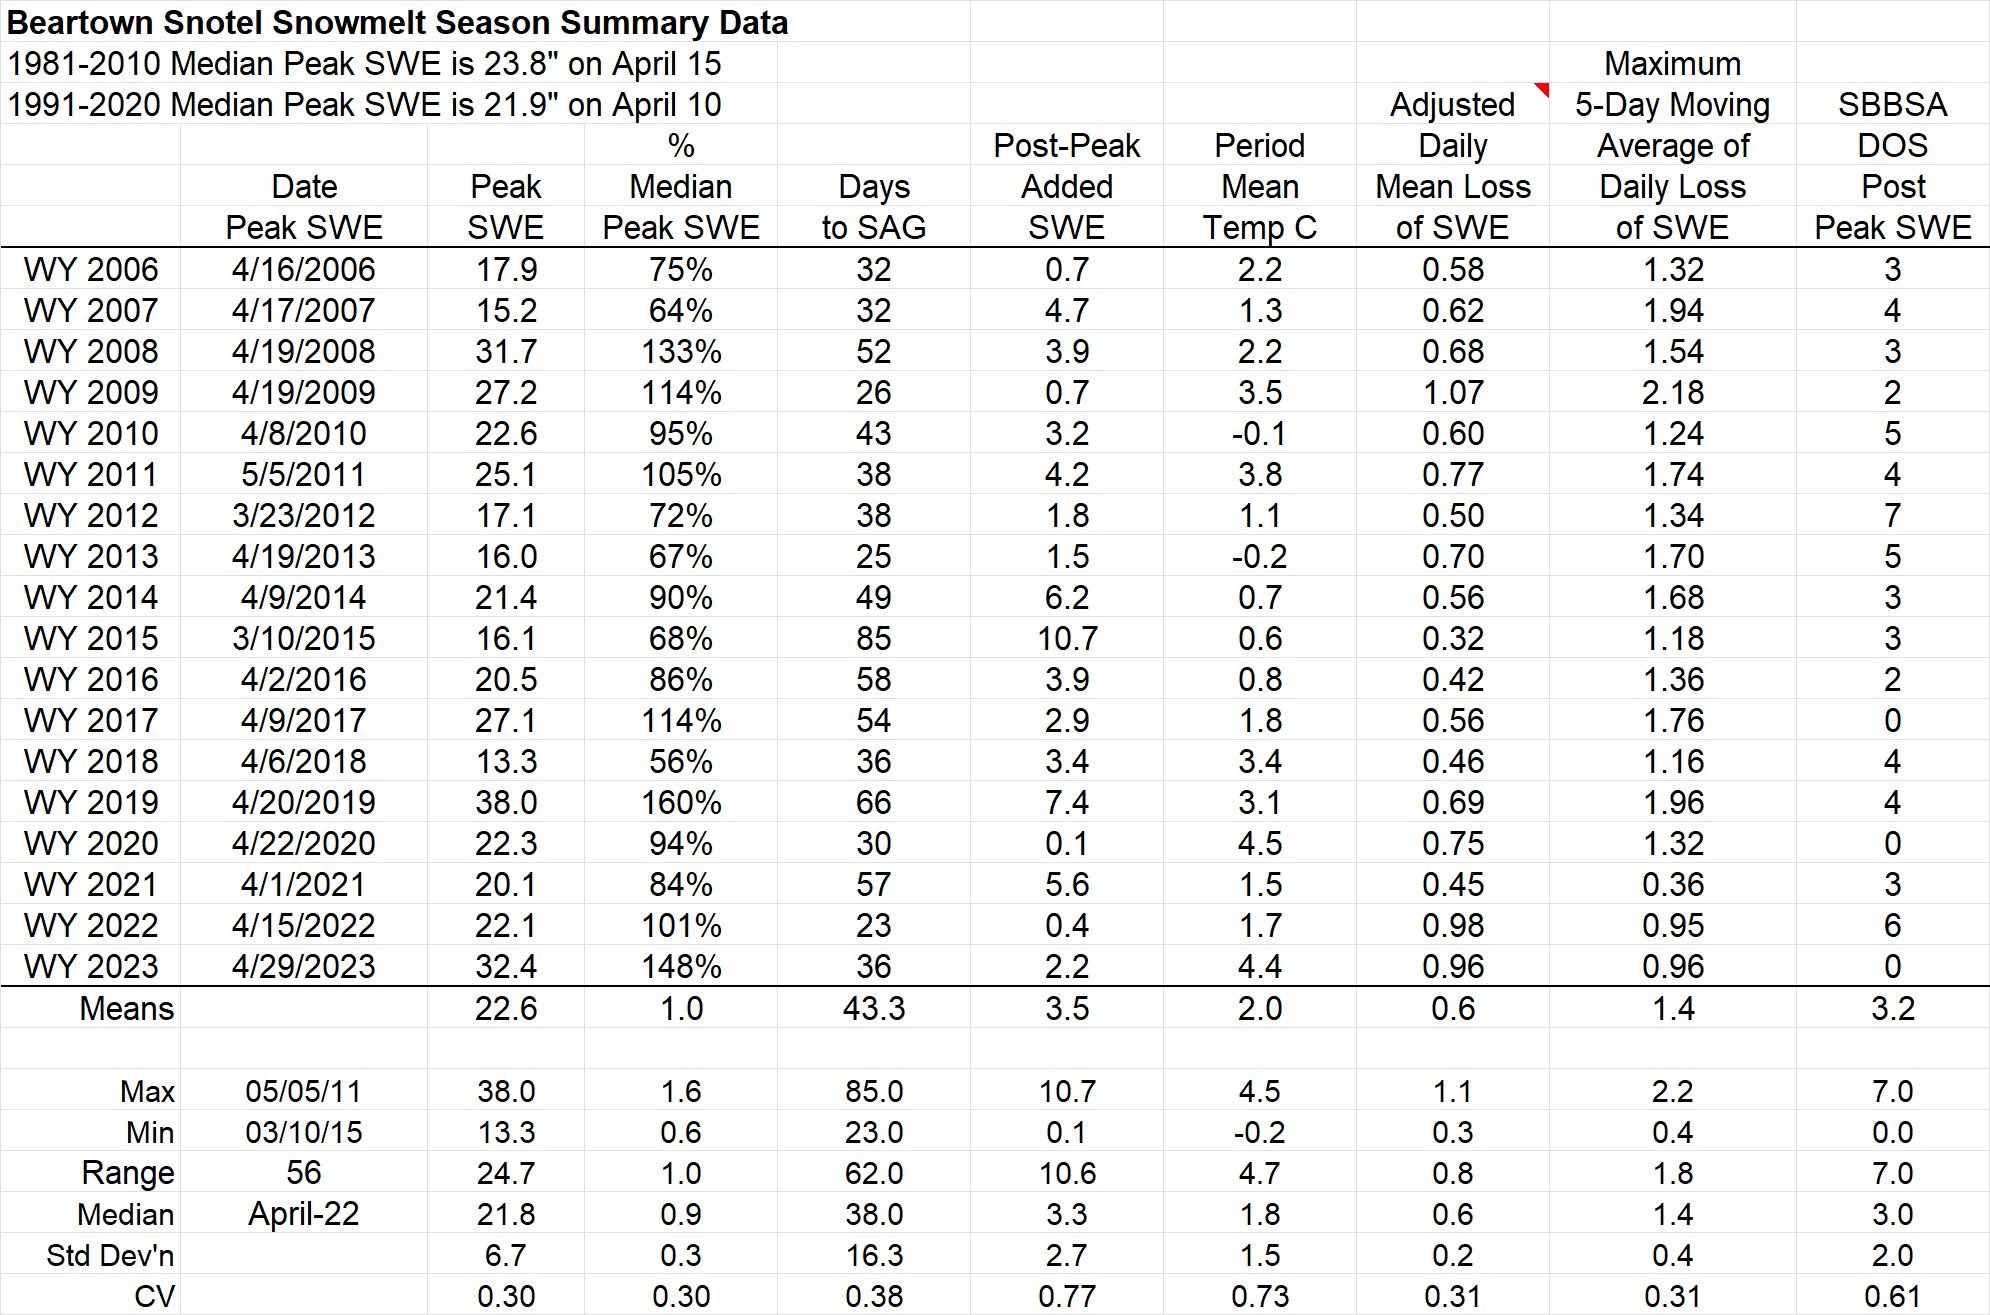
Below: A summary of WY 2006-2023 snowmelt rates and associated conditions at the 16 SNOTEL stations that CODOS routinely monitors. Days to SAG refers to the time between peak SWE and “snow all gone” at the SNOTEL sites. Adjusted Daily Mean Loss calculates the rate of snowmelt following peak SWE, including all precipitation received after peak SWE (assumed to be snow). Melt rate tables are presented for each of the 11 CODOS monitoring sites on their webpages.
Group mean peak SWE was just 1.5” shy of the maximum (WY2008) for this group going back to 2006. The adjusted daily loss of SWE was close to the max, which makes sense given the high SWE. Days to snow-all-gone was in the middle of road.

Above: Snow depth at Swamp Angel Study Plot.

Above: Snow depth at Senator Beck Study Plot.

Above: Snow water equivalent at Swamp Angel from snow profiles.

Above: Snow water equivalent at Senator Beck Study Plot from snow profiles.
DUST-ON-SNOW CONDITIONS
DUST ENHANCED RUNOFF CLASSIFICATION:
In Water Year 2015 CODOS introduced a Dust Enhanced Runoff Classification (DERC) approach to linking dust-on-snow, snowpack, and spring weather conditions to patterns in statewide hydrographs within a 3x3x3 Dust Enhanced Runoff Space. The below table presents the final DERC classification of WY2023 parameters at each of the 20 stream gauges monitored by CODOS. Water Years 2006-2023 classifications are contained in Excel workbook Runoff_Space_by_Region_and_WY.xlsx. Another workbook, Runoff_Space_by_Watershed.xlsx, contains individual DERC analyses for WY 2006-2023 for each of the 20 stream gauges.
A conceptual Dust Enhanced Snowmelt Runoff Space integrating the interactions of March 1 SWE, dust intensity, and spring precipitation.
Current and prior seasons snowpack conditions, dust severity, and spring precipitation are mapped for individual DERC space along with the hydrographs. These analyses are presented in PDF format and are available for the watersheds listed below. Referencing these DERC spaces in spring is helpful to get and idea how spring runoff will possibly unfold.
Below: Based on the discussions describing the DERC approach in characterizing the watersheds that CODOS monitors, WY2023 snowmelt season conditions are summarized in the tables below. Essentially, Colorado WY2023 snowmelt runoff behaviors were complex spatially, where many areas fell into general patterns of “Maximum” dust severity and the rest considered “Average”. Most areas fell in “High” March 1 SWE category , and mostly “Wet” or “Average” springtime conditions.

The Senator Beck Study Basin received 6 dust events this season, they occurred on November 3, February 22, March 5, March 30/31, April 4, and April 19. The first half of the season was rather tame as far as dust-on-snow is concerned. Up until April 1 we received 4 events but all these were rather mild events. On April 4 Colorado experienced a widespread and severe event that changed the dust-on-snow situation statewide, hence the nature of snowmelt, for the remained of the season. It made for complex conditions. Typically, the San Juans are the first, and hardest, hit by incoming dust events and dissipates as the dust travels further into Colorado. The April 4 event arrived on a trajectory as well as strong winds that carried the massive amount of dust further into Colorado. Regions like the Roaring Fork, Grand Mesa, Dolores, Rio Grande, and the Upper Gunnison - ended up with “severe” dust classification. At Red Mt Pass and other areas towards the north and northeast (Yampa/Upper Colorado) - although pretty bad - remained in the “Average” category.
Details of individual dust events at Senator Beck and observations across the state starting in March are available on the codos website. It is important to remember that weather plays an important role - and is the biggest wildcard in springtime - that determines the amount of dust radiative forcing on the snowpack. Wetter (more snow accumulation) conditions, in spring means the dust isn’t exposed on the surface as much, reducing albedo and increasing the absorption of solar radiation. In WY2023 timing of the major dust event on April 4 meant that dust was typically at or near the snow surface throughout he remainder of the season, thereby constantly exerting an influence on snowpack warming, melt rates, melt timing, and sublimation rates. Also, spring weather being as unpredictable as it is, can provide water in the form of rain that is immediately seen as spikes in streamflow. So few different processes can be taking place at once that forms the hydrograph, as was the case this season.
Above: Total dust-on-snow events by month. March begins the more intensive part of dust-on-snow season. In WY2023, we saw dust events occur November 3, February 22, March 5, March 31, April 4, and April 19.
Above: Total dust-on-snow events by year. Six dust events in 2022/2023 were “wet” events and none were “dry” events. Wet means the dust came in with precipitation. Dry means it arrived without precipitation.
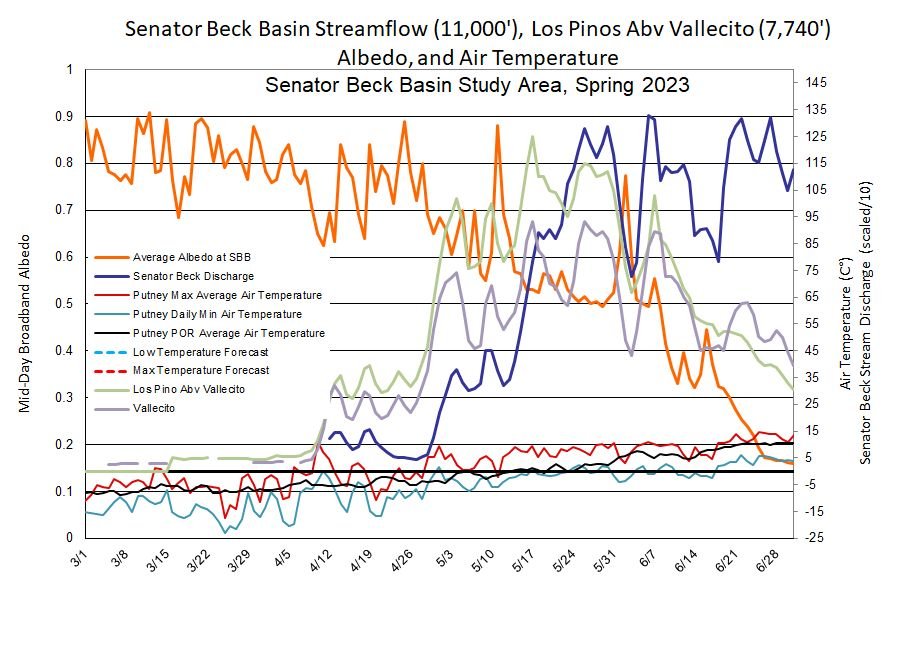
Below: Snow season albedo since 2006. Albedo can vary greatly depending on dust severity and precipitation events. WY2023 (red line) was “upper-end-of-average” for dust severity conditions at Senator Beck. Precipitation events were rather frequent in spring which helped keep fresh snow (as well as cloud cover) on the surface and minimizing dust radiative forcing. The storms the beginning of June are seen in the albedo spike before going to snow-all-gone a few days later. Also in bold is WY2009 - a notoriously bad dust year - for comparison.

RUNOFF BEHAVIOR
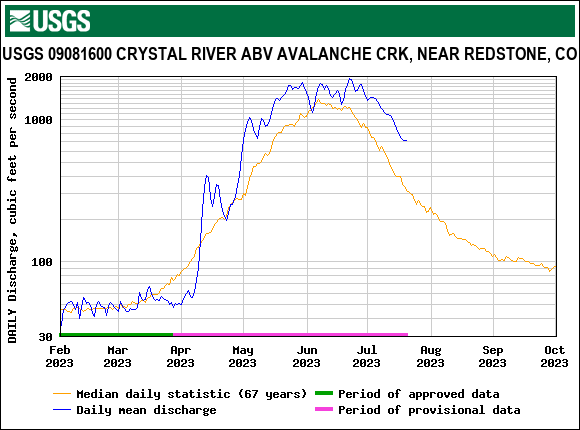
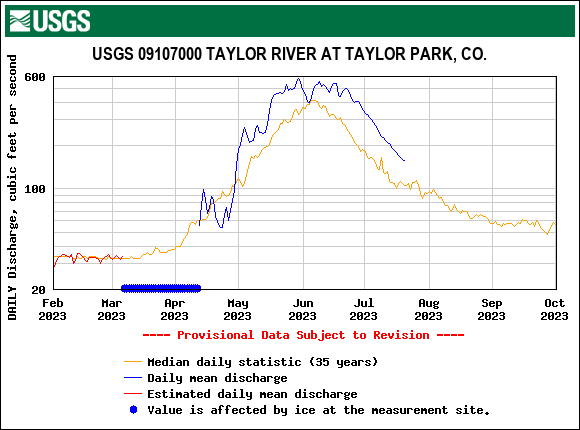
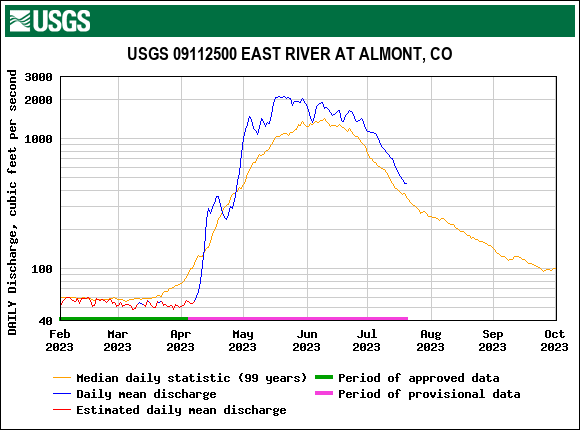
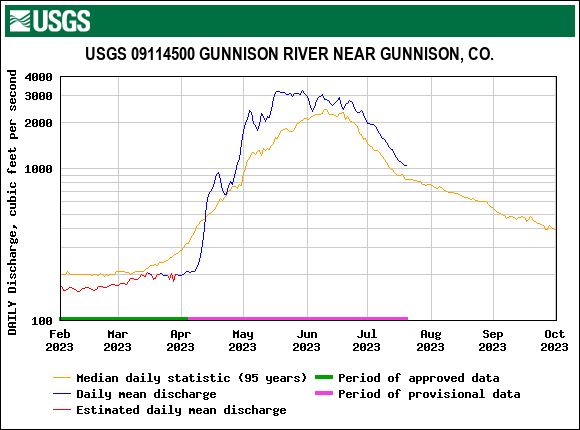
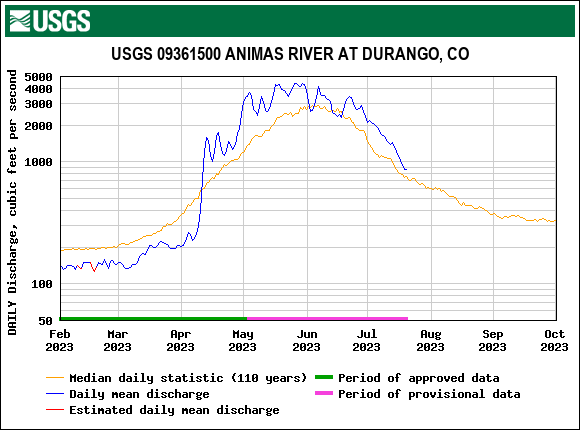
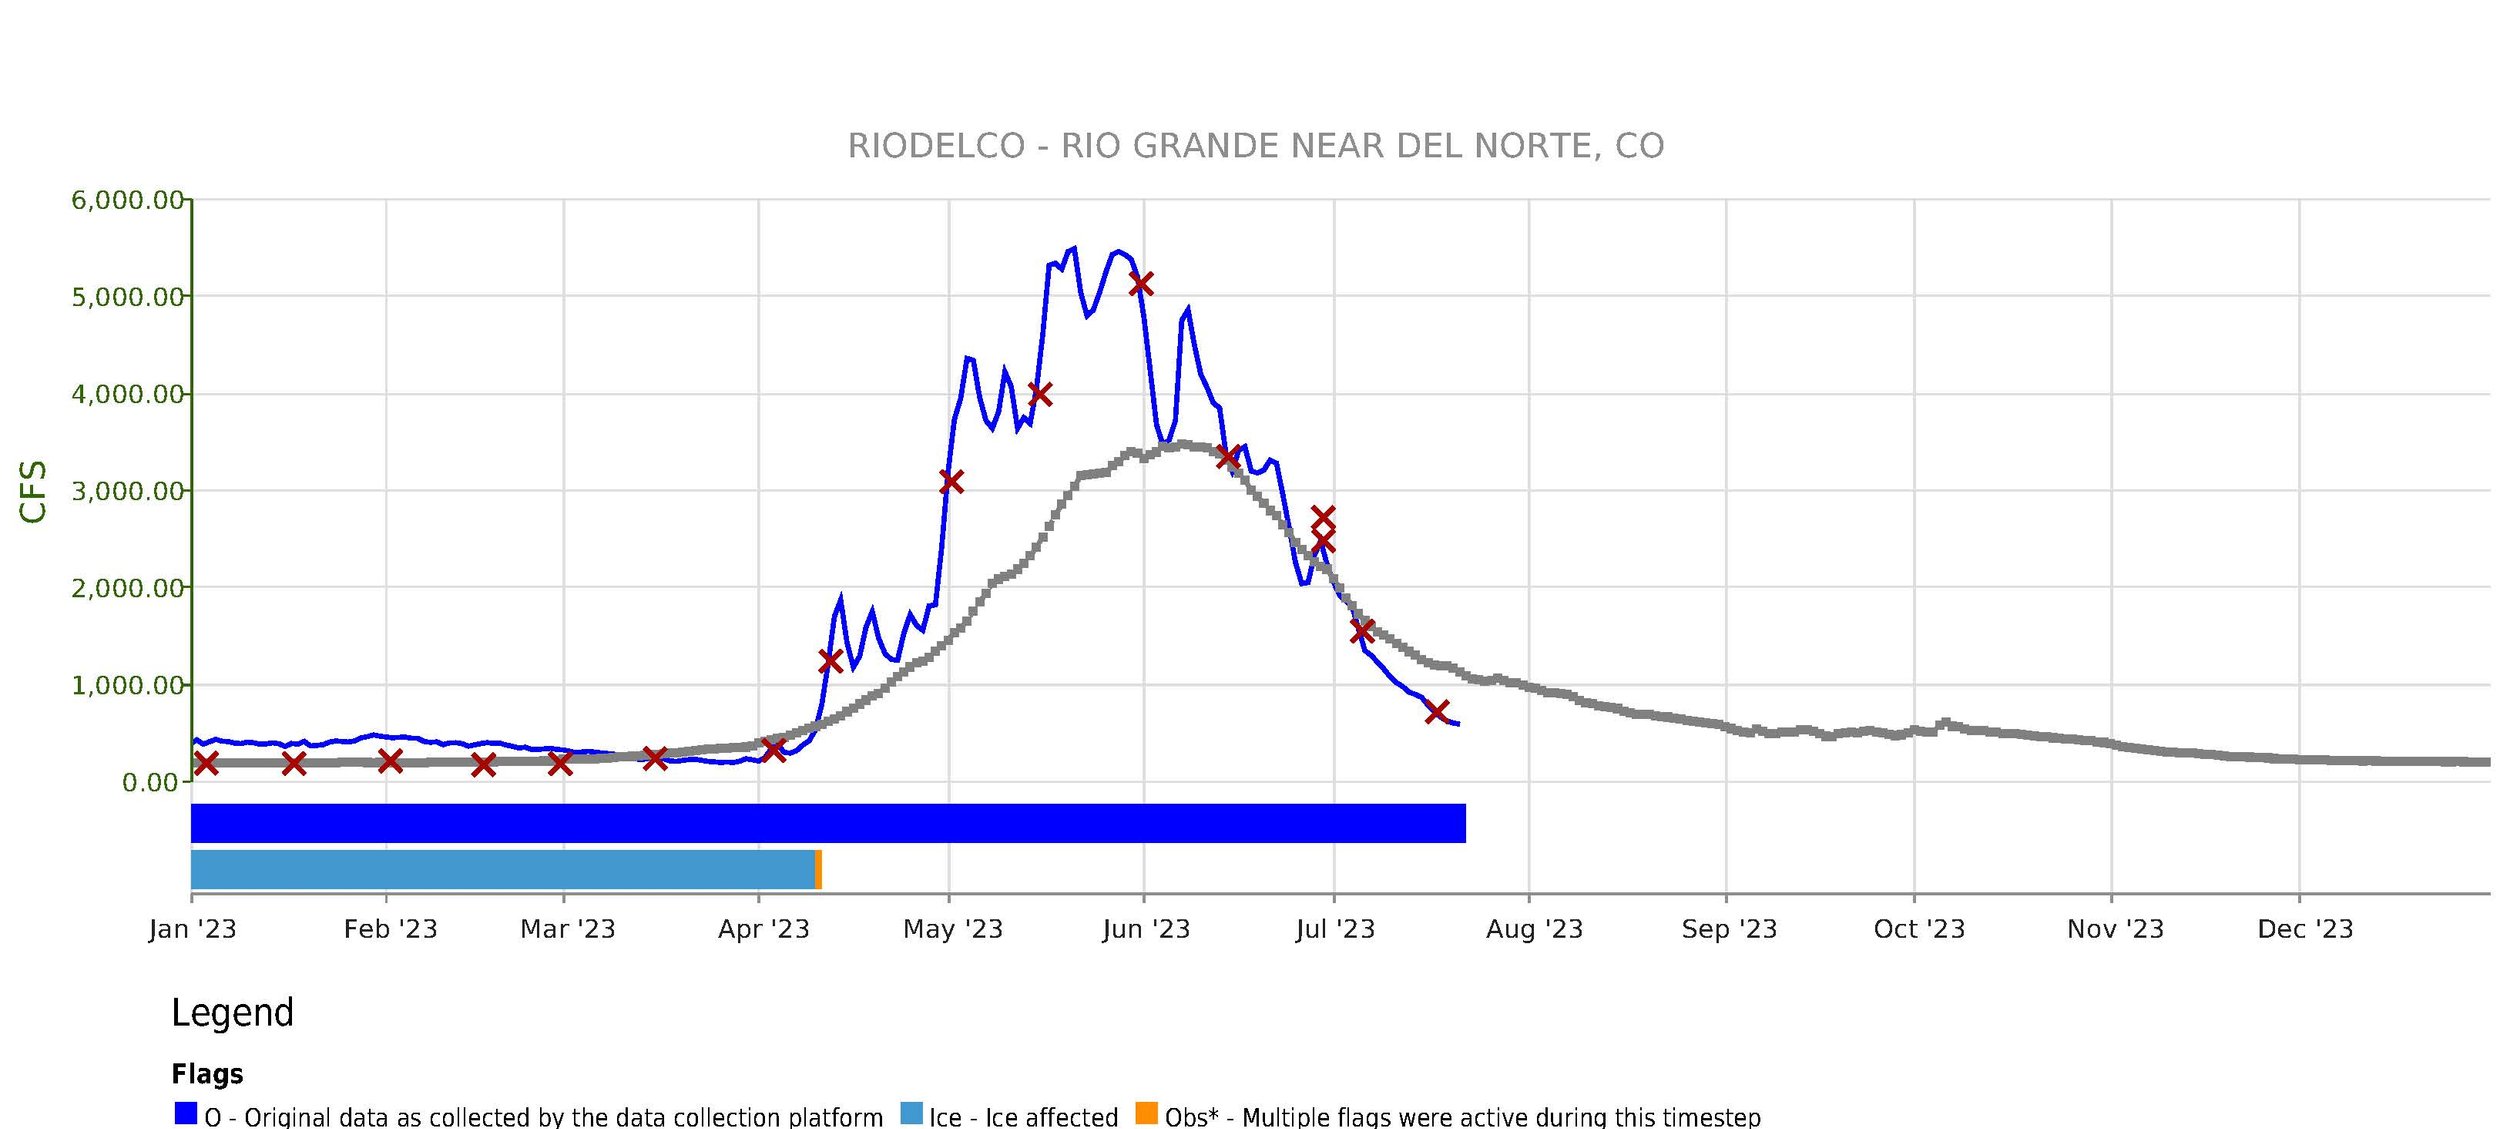
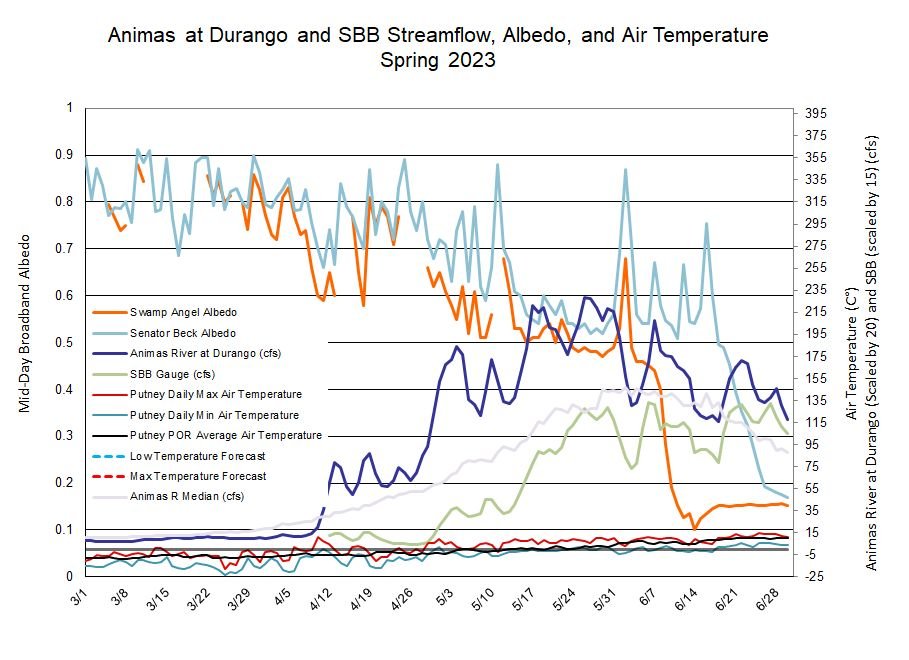
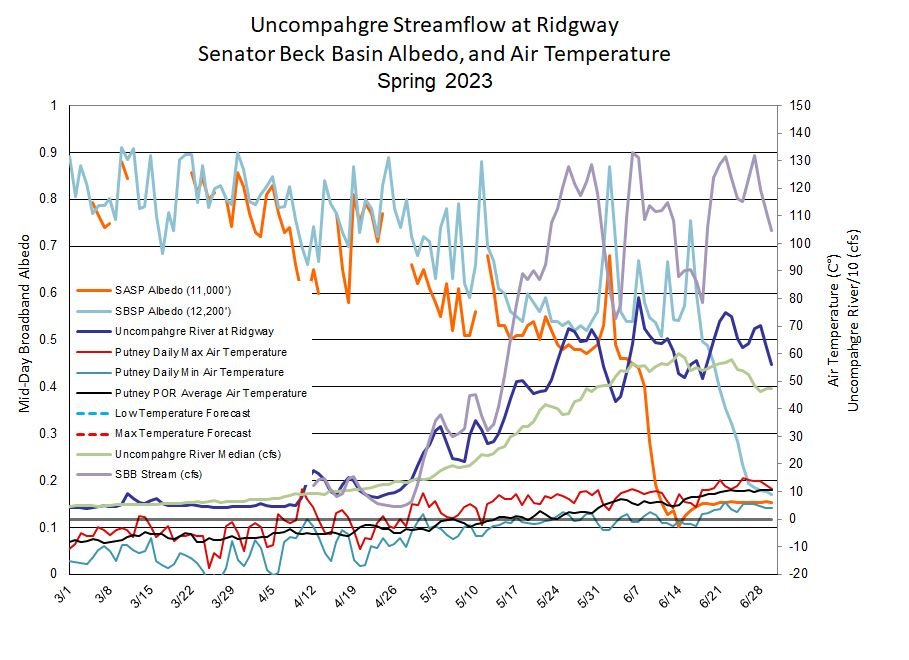
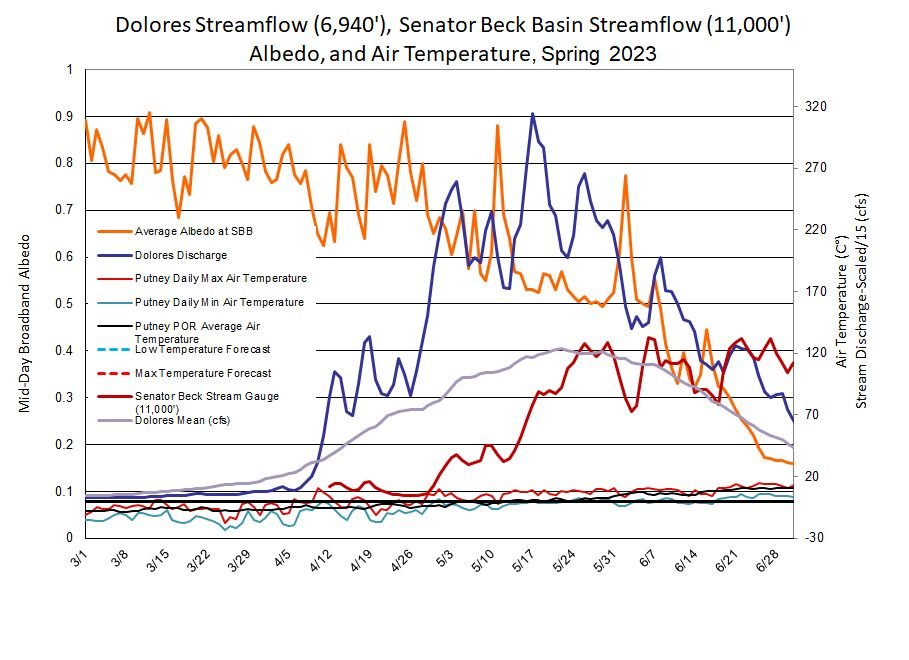
Snowpack and dust-on-snow conditions set the stage for streamflow come springtime, and weather conditions dictate how it unfolds. The periods of wet conditions in spring added complexities in nailing down expected streamflow behavior, and it created a multi-peak streamflow scenario throughout much of Colorado. The deep snowpack warmed over the month of April - albeit a stormy latter part of the month subdued snowmelt to a degree (2.5” precipitation with 10 days of recorded precipitation) - and started producing significant runoff towards the end of the month and going into May as warm conditions set in and dust was exposed. The warm/sunny conditions over this ~10 day timeframe fueled a spike in streamflow. A few days of blustery conditions slowed snowmelt but then streamflow quickly resumed its ramp up. Another stormy period occurred mid-May resulting in another dip in the hydrograph. Following this, streamflows surged once again. A brief, sharp, albedo reset occurred the first couple days of June. A streamflow peak occurred June 7 when snow mostly ablated at Swamp Angel (11,060’) which is a normal occurrence. The final peak occurred on June 22 when snow finally melted out at Senator Beck Study Plot (12,200’), which is also a common occurrence where we see streamflow peaks coincide with melt-out at certain elevation zones. Snow stuck around the high country, feeding streamflows, well into summer. We hiked to Senator Beck Study Plot the second week of July and there were many large snow fields to navigate. Streams in Colorado saw peaks approximately on May 18, May 26, May 30, June 7, and June 22. The day that was actually the biggest peak varied depending on the watershed. For example, in Southwest Colorado the Dolores peaked on May 17, Animas on May 26, Senator Beck on June 6, and Uncompahgre on June 7. In summary, the big snowpack with significant to severe dust on the surface fared well, the unsettled weather that included cloud cover, precipitation, and periods of cooler temperatures, melted off the snow in a steady manner with no “flashy” episodes but sustained high flows.
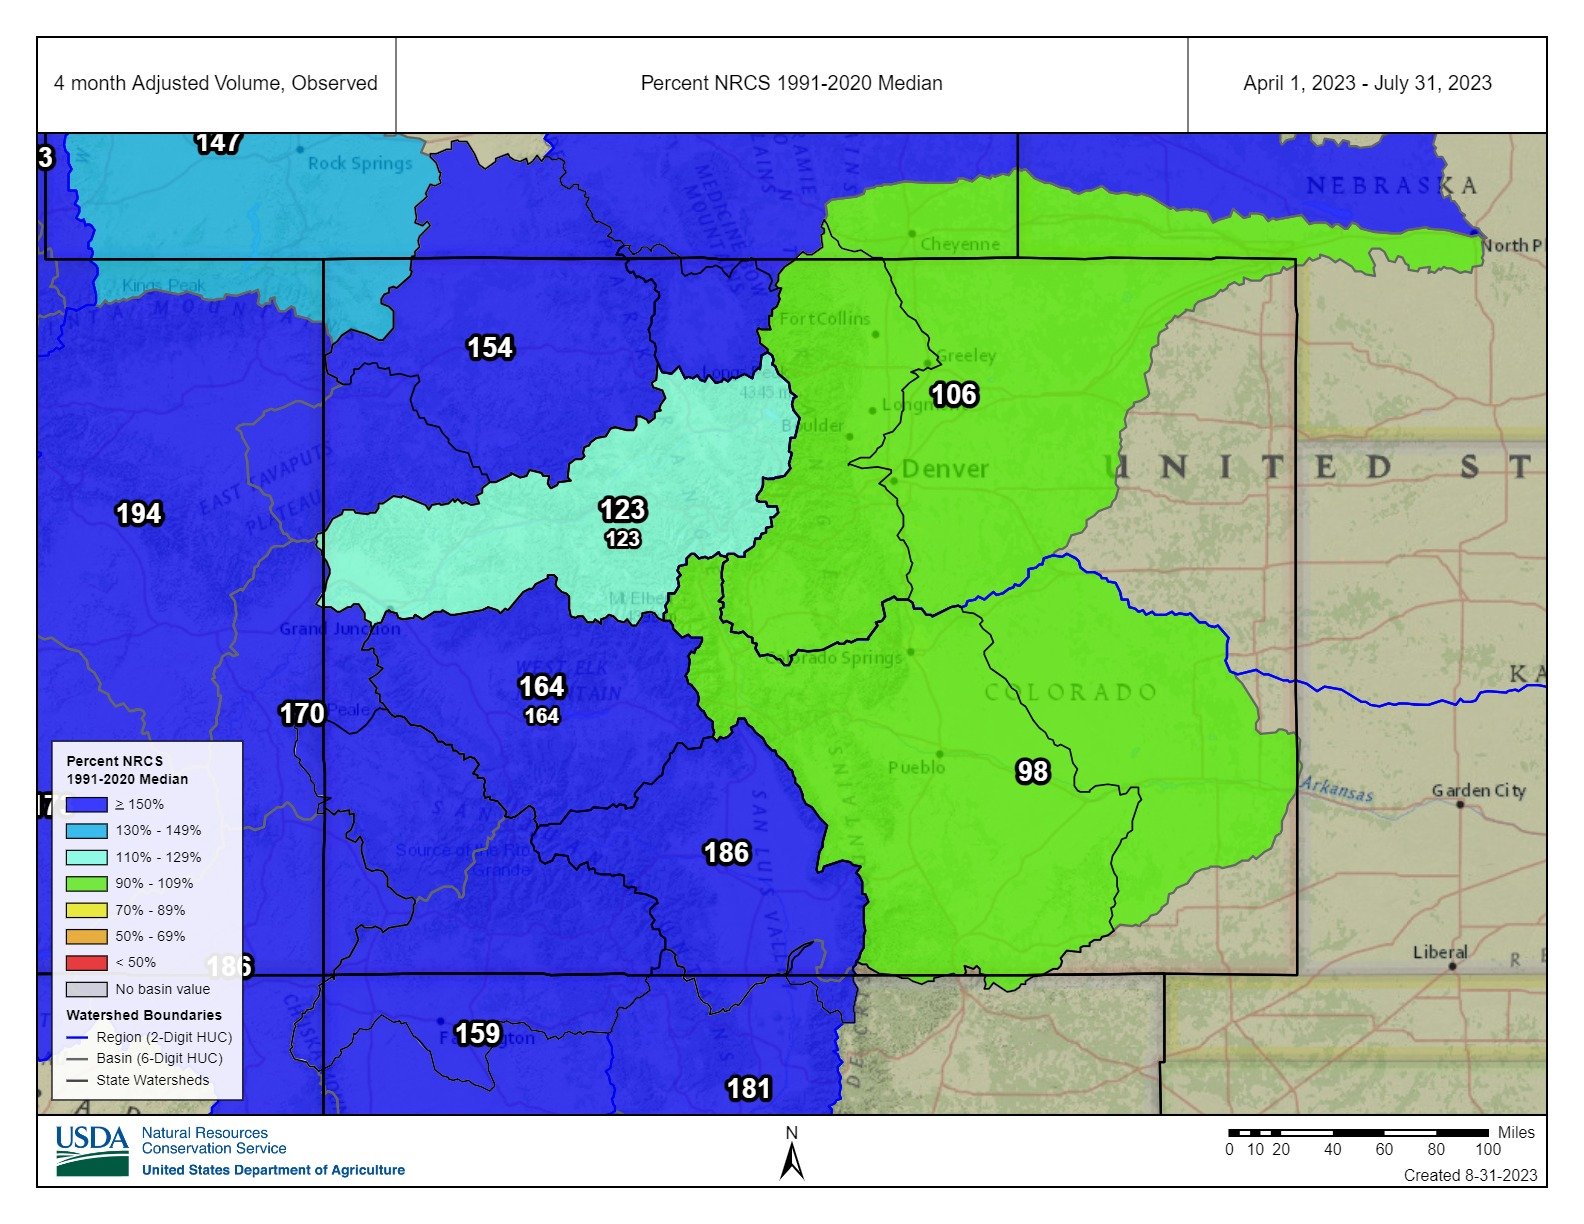
In terms of volume, where large snow accumulation had occurred (so much so as to override any potential losses such soil moisture, sublimation, etc.), higher streamflow volumes were expected. The final water supply amounts for April-July ended up being: Navajo-163%, Vallecito-142%, Animas-138%, McPhee-207%, Powell-166%, Gunnison Basin-115% to 140%, and North Fork Gunnison-180%. Detailed volume information is available on the CBRFC website.
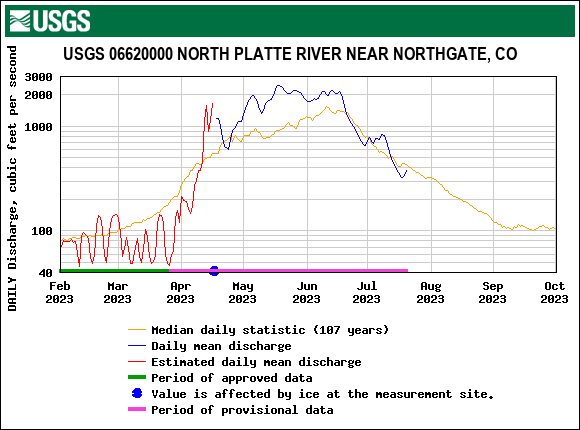
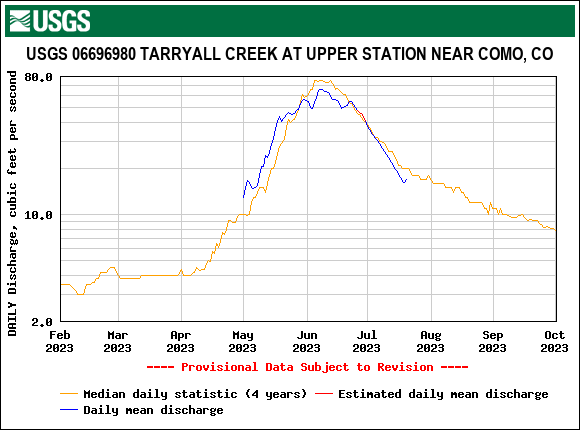
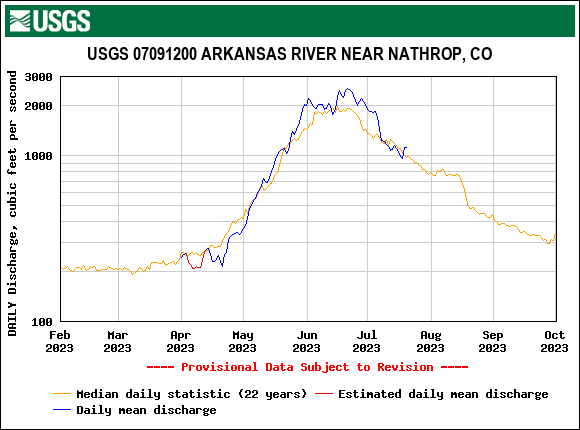
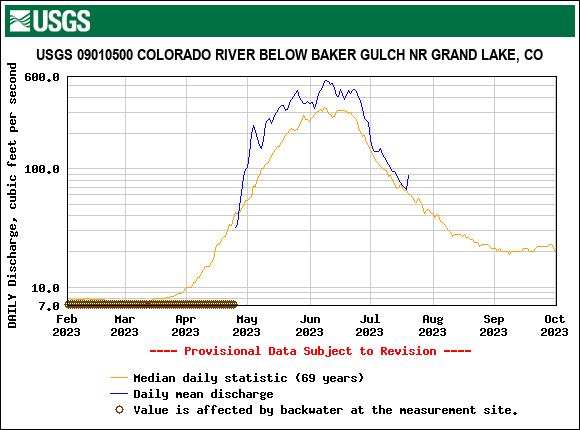
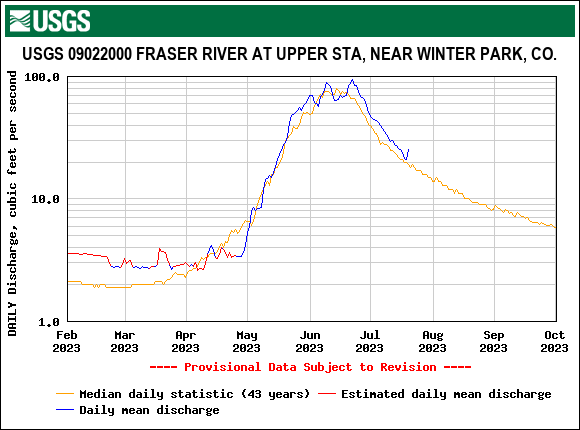
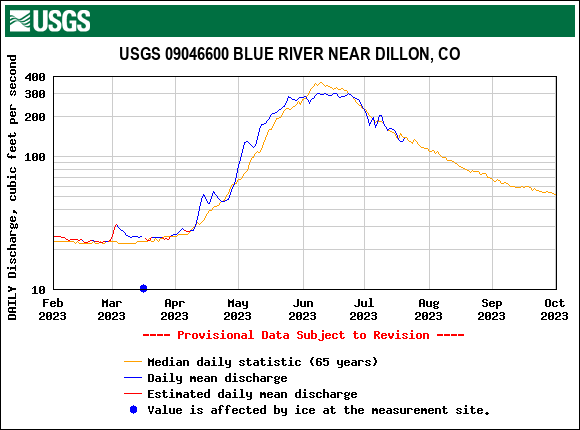
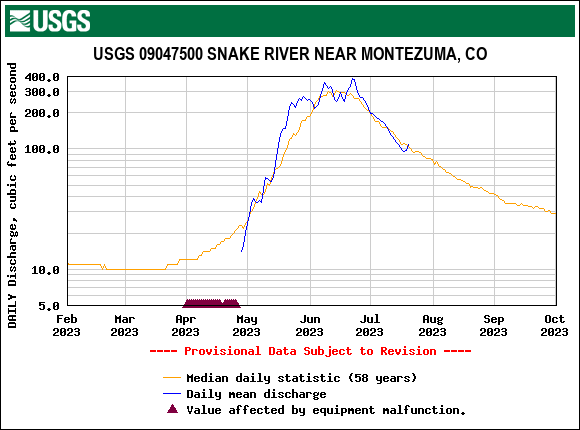
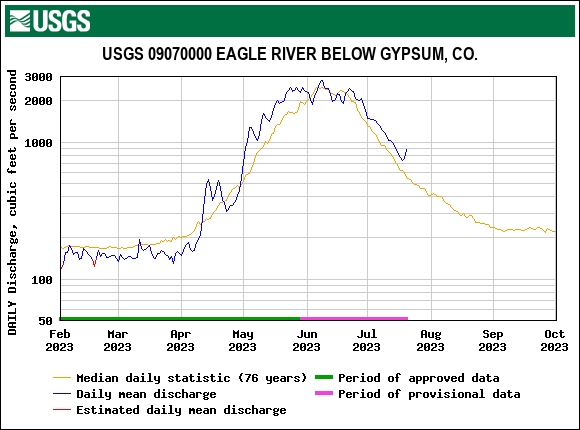
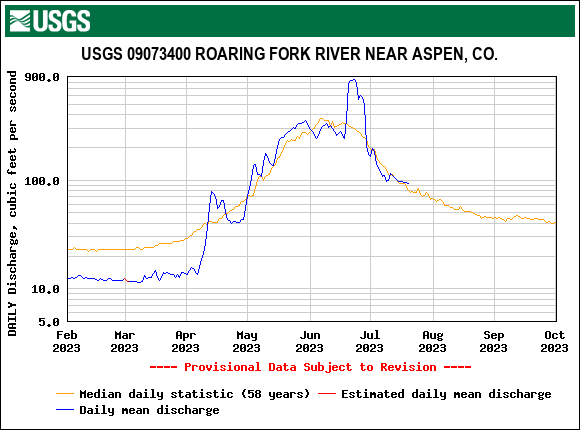
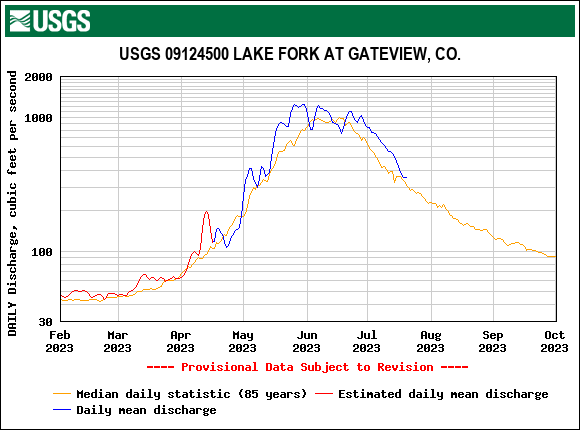
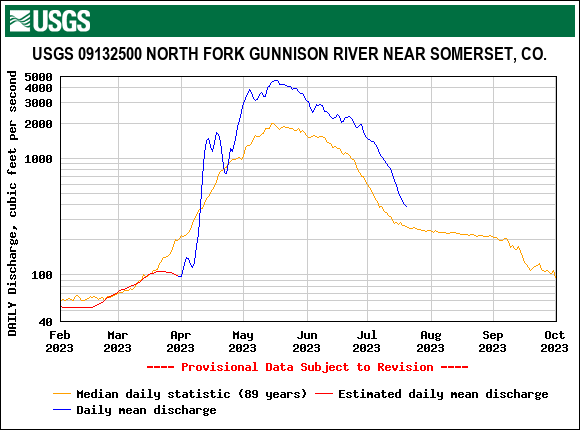
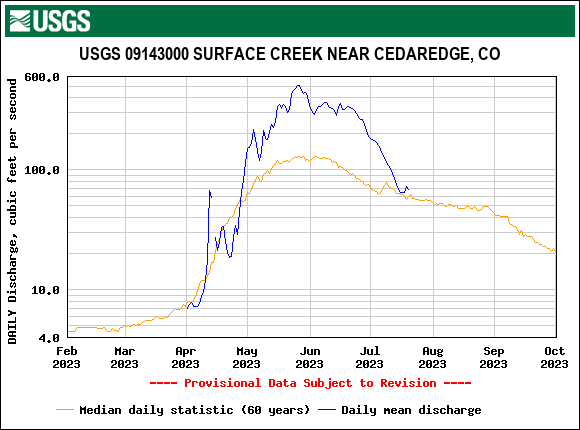
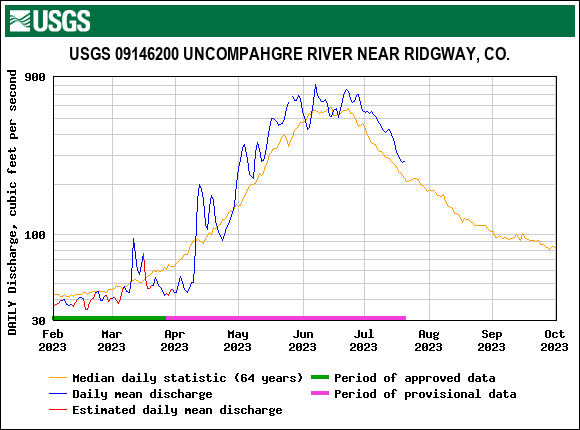
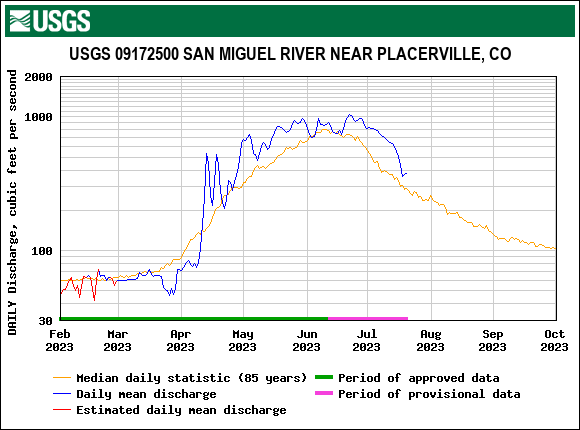
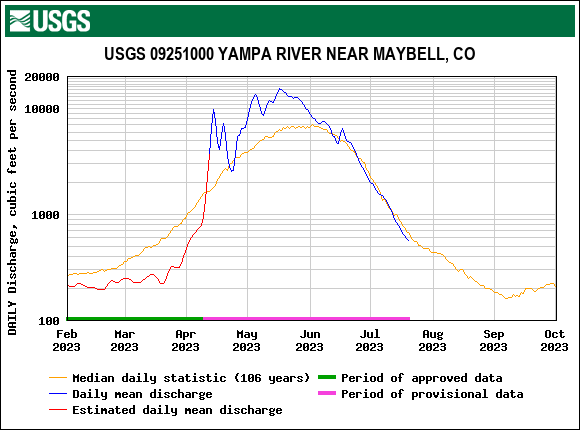
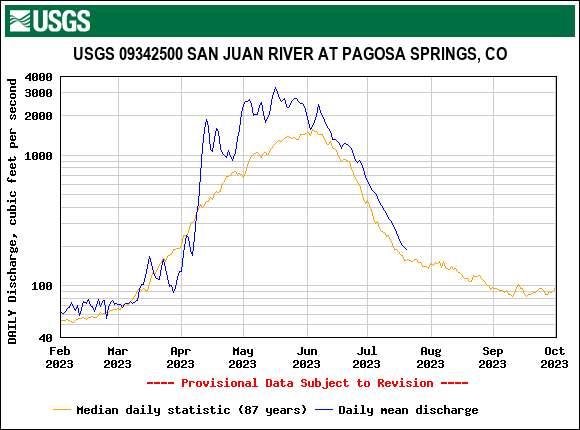
Above: It was a multi-peak season as recorded by many stream gauges. A large snowpack kicked into the melt phase rapidly due to a dry and sunny April fueled by lots of dust on the snow surface. Added to this, wet (snow and rain) conditions brought more water to the mountains, at the same time dampened snowmelt rates due to hampered incoming solar radiation, all made for complexities that made it more difficult to forecast timing of streamflows.
Peak discharge at Senator Beck stream gauge was June 6, reflecting the ~11,000’ elevation zone melt out, and June 22 for the high elevation, above 12,200’ melt.

Above: Correlation of snow-all-gone at SASP and peak Q at the adjacent Senator Beck streamgauge. All the severe dust years in red show SAG and peak discharge before June 1. Low dust years are shown in blue and average in green. The two years in green at lower left make sense as this was 2012 and 2018, two notorious low snow years (and dust severity was “upper-end-of average” for 2018).
Below: There is less correlation of the second streamflow peak Q with SAG at Senator Beck Study Plot (12,200’) compared to SASP but still very informative.


Above: Stormy periods in spring made for extended high flows rather than just one major peak. Peaks occurred approximately May 18, May 26, May 30, June 7, and June 22. The plentiful snow and numerous albedo resets in June kept snow in the higher elevations further into summer.

Looking Ahead
The climate and science news headlines these days are not too positive. When looking ahead, I’ll just focus on the next few months.
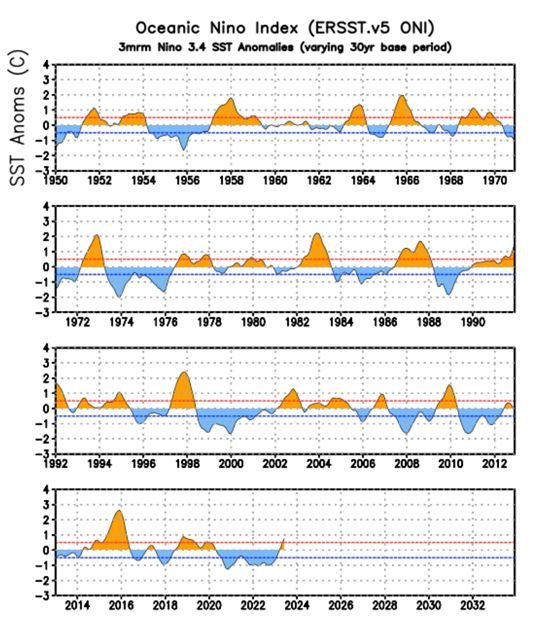
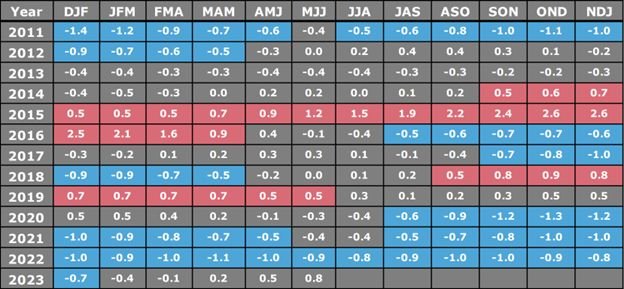
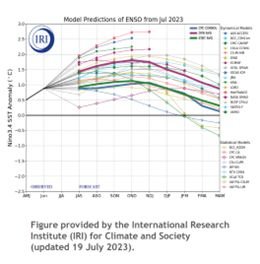
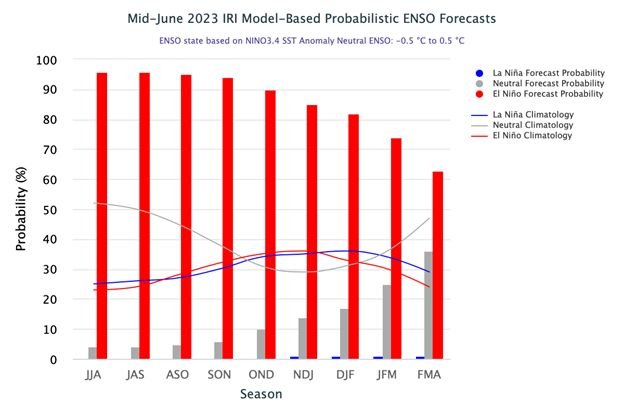
All the indications of an El Niño season are strengthening – our current status is an El Niño advisory. Equatorial sea surfaces temperatures are above average, topping out at +3.0 C off the coast of Peru, and easterly wind anomalies have persisted over the eastern Pacific since mid-July (Climate Prediction Center). The Climate Prediction Center (CPC) is forecasting a greater than 90% chance that El Niño will continue through the winter. The current Oceanic Nino Index (ONI), which is the principal measure for ENSO, is currently +0.5 °C (and thinking we’ll reach +1-2 °C, a moderate-to-strong El Niño). To graduate from advisory to full El Niño, we’ll have to see these conditions persist for another couple months. To become a “historically strong” El Niño, like the winters of 1997-98 or 2015-16, the ONI must hit +2.0 °C or higher, of which we have about a 1 in 5 chance (Climate Prediction Center).
The North American Monsoon (NAM) is a few weeks late and off to an underwhelming start, but it seems that it may be here. The Front Range had an extremely wet June, so perhaps this delay is not unwelcome.
The NAM is defined by aloft, clockwise winds rotating around a high-pressure system that settles in over Mexico. The warm, rising air, and moisture from the Gulf of Mexico makes its way north ahead of the high-pressure system, typically throughout the month of June, and arrives usually in July for the clockwork Colorado afternoon downpour that some of us remember. This year, drier-than-average conditions across the Mexican highlands have delayed the northward travel of moisture, and conditions may be impacted by the heavy snows of this winter (saturated soils), and the formation of El Niño (Open Snow). This NAM season appears to be difficult to predict, but it’ll likely stay hot (NWS).