SUMMARY
Through a highly unusual combination of weather events including hurricanes on both ends of the winter, a “ridiculously resilient ridge” to the west yielding two mid-winter droughts and scant Winter Storms until a “Miracle May”, and atypical snowpack conditions including early onset of melt with almost no dust-on-snow in the snowpack, the Colorado Mountains eventually produced full reservoirs and streams, ‘on time’. This Colorado Dust-on-Snow program WY 2015 Season Summary will discuss the ‘weirding’ of Colorado’s winter at the Senator Beck Basin Study Area at Red Mountain Pass and at ten other sites located throughout the Colorado Mountains.
About this report:
This Season Summary will often reference or link to snowpack, streamflow, weather, and climate products generated by the NRCS Snotel program, USGS National Water Information System, and NOAA National Weather Service and Climate Prediction Center respectively, as presented and archived on CODOS monitoring site webpages. In addition, this Season Summary will frequently reference a variety of data collected by the Center for Snow and Avalanche Studies at our Senator Beck Basin Study Area at Red Mountain Pass (hereafter SBB) under our Mountain System Monitoring program, which includes the CODOS program. At SBB, snowpack, weather, soils, and radiation conditions are monitored and measured at the well-sheltered subalpine Swamp Angel Study Plot (SASP, 11,060’) and at the more exposed, alpine Senator Beck Study Plot (SBSP, 12,180’). Nearby, wind speed, wind direction, air temperature, and humidity data are collected at the Putney Study Plot (PTSP, 12,323’), located to minimize the influence of local terrain on those measurements. Finally, SBB streamflow discharge is continuously measured at the SBB pour point at the Senator Beck Stream Gauge (SBSG, 11,030’), in a broad-crested, notched weir.
WEATHER CONDITIONS
Colorado’s mountains, including Senator Beck Basin (SBB) experienced unusual, erratic, and even unprecedented weather during the fall, winter, and spring of 2014/2015. While a detailed analysis of the climatic and other conditions driving these weather behaviors is beyond the scope of the CODOS program, it is clear that the ‘weirding’ of winter 2014/2015 in Colorado was closely linked to extreme and often persistent conditions farther west, in the Pacific, from Mexico all the way to Alaska. The final section of this Season Summary will scratch the surface of those complex developments and how this season’s climatology challenged snow science and monitoring.
Leading off this sequence of weather events, remnants of three separate eastern Pacific hurricanes drifted northeastward from the Mexican coast during September 2014 and delivered copious amounts of moisture into Colorado, the vast majority of which fell as rain. While these rains did not produce the disastrous conditions experienced on the Front Range and plains in October 2013, the combined rain totals from these three September 2014 rain events did substantially exceed the October 2013 rain event total here in SBB and likely in many other western Colorado locales. The WY 2014 chart below captures both the October 2013 rain event and the three rain events of September 2014 as measured at the Swamp Angel Study Plot (SASP) at the Senator Beck Basin Study Area at Red Mountain Pass (SBB).
WY 2014 (October 1, 2013 through September 30, 2014) Senator Beck Basin daily precipitation, measured at SASP, in mm of water equivalent, and daily snowpack depths measured at SASP and SBSP, in meters. The particularly heavy rain events of October 10, 2013 and of September 9, 21, and 28, 2014 are apparent.
As a result of these September 2014 rains, mountain soils and near-surface aquifers were well-wetted as winter 2014/2015 snowcover began to develop, just as occurred in fall 2013. Here at SBB, soil moisture data at SASP and SBSP documents those conditions while entering the winters of 2013/2014 and 2014/2015.
Following a comparatively dry October, where only higher elevations retained scant snowcover, snowpack formation began in earnest in November. Here at SBB a series of four winter storms had deposited substantial snow at all elevations by mid-December. (For SBB Winter Storm data and reports, see http://snowstudies.org/storms.html). Then, although Storm #5 delivered 2.3” of precipitation as snow at the sheltered SASP plot, bringing snow depth there to over 50”, unusually fierce and sustained winds during that three-day storm actually eroded 24” of the prior snowcover from the exposed SBSP site, relocating that snow as well as the new Storm #5 snow in the alpine terrain to leeward locations in SBB, leaving only 5” of snow on the ground at SBSP by Storm end. This extreme erosion of snowcover was unprecedented in the 12-year history at the alpine SBSP site and would have ramifications later in the season. Further, at only five Winter Storms to-date, albeit containing near-normal precipitation, by the end of December SBB was lagging well behind the 12-year average of 8.7 Winter Storms. Hope remained that mid-winter would make up for that deficit of ‘weather opportunities’.
WY 2015 in progress (data span October 1, 2014 through June 30, 2015) showing Senator Beck Basin daily precipitation, measured at SASP in mm of water equivalent, and daily snowpack depths, measured at SASP and SBSP in meters.
The end of Storm #5, on December 23, 2014 unfortunately marked the onset of six weeks of extremely dry, sunny, virtually storm-less weather, from early January through mid-February. Rather than incrementally increasing, snowpack depth was virtually constant at our (level) SBB study sites and throughout the Southern Mountains during that period. Elsewhere in Colorado snowpack development continued, albeit at a slower-than-normal rate (the exception being in the South Platte watershed, where snowpack formation was normal). During this dry period a high fraction of south-facing terrain in our San Juan Mountains locale lost much or all snowcover, all the way to ridgeline elevations, as well as low elevation snowcover during prolonged periods of maximum potential solar radiation and mild daytime temperatures.
Then, two significant SBB storms (#8 and #10) at the end of February and in early March resumed snowpack development at both SBB study sites. Storm #10 produced the season maximum snow depth at SASP, at a little over 2 meters. These two storms also produced sharp increases in snowpack throughout the Colorado Mountains, most dramatically in the Rio Grande watershed. Terrain that had lost all snowcover earlier was once again snow covered, but thinly, by these two storms.
Another extremely dry, virtually storm-less period followed. Only a single, minimal winter storm (#11) was logged at SBB between Storm #10 ending March 3 and Storm #12 on April 18. Once again, under prolonged periods of ‘severe clear’ skies, maximum potential solar energy inputs, combined with very warm air temperatures, dominated the snowpack energy budget at SBB elsewhere in the state. These abnormally sustained and high inputs of energy at the snowpack surface were largely responsible for the unusually early development of isothermal snowpack temperatures (at 0° C throughout) and early onset of snowmelt described in the March 23 CODOS Update. (Note that, as discussed below, dust-on-snow played no role in this early snowpack warming and snowmelt.)
With only Storms #12 and #13 tallied by the end of April, SBB had fallen even farther behind the 12-year average count of 22.3 Winter Storms for October-April. And, having measured only 609 mm of precipitation since October 1st , WY 2015 was also lagging about 6” behind the 12-year average of 766 mm by the end of April, almost as dry as WY 2013 (see SBB Precipitation graphs). Statewide, from a season-to-date high in early March, snowpack SWE was more-or-less stable during the dry period in early March, before snowcover warming had initiated snowmelt. SWE then declined sharply during the remainder of March and through much of April before again stabilizing or even rebounding slightly late in April, at alarmingly low levels.
Then, in an extreme departure from the two exceptionally dry periods earlier in the winter, the “Miracle May” of 2015 evolved as a truly rare event, producing historic precipitation as both rain and snow. Five additional Winter Storms were logged during May at SBB (the 12-year average is 2.3 Storms) bringing the total Storm count to 18 for WY 2015, still well short of the average of 24.5. With at least 1 mm of measured precipitation on 27 of the 31 days of May, a total of over 8” of precipitation measured at SASP was more than double the 12-year monthly average and a new May record, exceeding the 190 mm measured in May 2011. Nearby, the Red Mountain Pass Snotel also logged the most May precipitation in its period of record as well as the season’s Peak SWE value. At over 11,000’, nearly all of this May precipitation fell as snow at SBB (and at the Red Mountain Pass Snotel) rather than as rain. Elsewhere, most high elevation Snotel sites also received predominantly snow, but mixed precipitation or rain fell at the lowest elevation Snotels.
Under the Dust Enhanced Runoff Classification approach, CODOS has characterized spring precipitation in three classes – Dry Spring, Average Spring, or Wet Spring – for the purpose of classifying dust enhanced snowmelt behaviors as spring weather (i.e., snowfalls) interacts with dust intensity and March 1 snowpack conditions (see the Dust Enhanced Runoff Classification discussion on the CODOS Program homepage). Under the DERC approach, an “Average Spring” falls within the band around the mean of March/April/May total precipitation, +/- 15%, a wide range designed to accommodate the often spotty nature of convective spring precipitation. By the end of May the fifteen Snotel stations that CODOS routinely monitors had recovered from the exceptionally dry March and early April weather, and record-breaking May precipitation had tipped the scales from a “Dry Spring” to an “Average Spring” or “Wet Spring” at all sites (below).
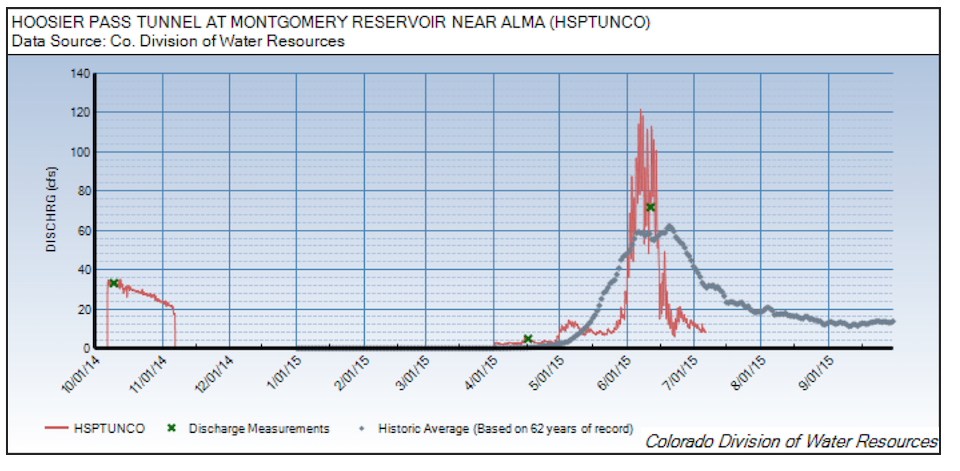
Combined March, April, and May precipitation as of June 1, 2015, for the fifteen Snotel stations adjacent to or near CODOS monitoring sites. In mid-May, only Hoosier Pass was reporting above-average precipitation.
Finally, the month of June produced additional unusual precipitation events, as rain at most elevations, from the remnants of two eastern Pacific hurricanes tracking northeastward into Colorado. Between June 1 and June 16 SBB logged 50 mm of precipitation, virtually all as rain at SASP, and as rain-on-snow and sleet at the higher SBSP site. That 50 mm was almost 170% of the 12-year average for the entire month of June at SBB, but far less than the 102 mm of June 2009. June 2015 thereafter ended dry, with no additional measured precipitation at SASP.
SNOWPACK CONDITIONS
As frequently presented in CODOS Updates, basin-scale plots of aggregated Snotel data provide a useful overview of SWE conditions throughout the Colorado Mountains. All basin-scale plots are now reporting “snow all gone” (SAG) and document the complete WY 2015 snowpack formation and ablation cycle.
Late-winter and spring snowfalls are critical to Colorado water supplies. Most watersheds experience their highest measured (Peak) SWE values at Snotel sites sometime in April but snowfalls after those respective Peak SWE dates have always contributed an important fraction of final snowmelt runoff yields. Further, spring snowfalls play a key role in determining the timing and duration of dust-induced reductions in snow albedo when desert dust layers emerge at or are deposited to the snowcover.
Basin-scale March 2 SWE conditions in Colorado’s major watersheds. The DERC definition of “Average March 1 SWE” is March 1 median SWE +/- 10%.
Despite the disruption to snowpack development during early- and mid-winter described above, by the beginning of March a few watersheds were reporting near-median SWE thanks to three significant, late February and early March storms corresponding to Storms #8, #9, and #10 at SBB (table above). Normal snowpack formation was considered likely during the remainder of the winter in those watersheds.
Other watersheds were well short of early March median SWE, with poor odds of achieving normal Peak SWE. Still others were so far short of median early March SWE that only an extremely wet spring would result in normal Peak SWE, and then likely at a later-than-normal date (see March 1 Update and the Non-Exceedance Projection plots by NRCS). Following March 1, all these watersheds would require sustained stormy weather to reach or maintain mean or median SWE levels and eventually a normal Peak SWE.
In fact, as discussed above, a wet March weather did not materialize, early April was also dry, and it only resumed snowing in mid-April. Watersheds that had reported normal or better early March SWE quickly began to lose ground, and a likelihood of achieving normal Peak SWE in April. The outlook for those other watersheds that had reported sub-par March 1 SWE conditions was becoming quite dire.
Meanwhile, within the snowcover, this dry period had another important impact. As March and early April unfolded, instead of receiving additional snow and SWE, and the so-called “cold content” contained in additional snowfalls (plus the cold air associated with those storms), snowpacks statewide were relentlessly bombarded with near-maximum-potential inputs of solar energy and prolonged periods of warm and dry air interacting with the snowpack surface. Consequently, the absence of winter storms, and their additions of “cold content” to the snowcover, failed to offset and moderate the unusually sustained, solar-driven warming of the shallow snowcover in late winter and early spring, as days lengthened. Further, with less-than-normal snowpack SWE and correspondingly less mass of ice at sub-freezing temperatures, less actual energy was required to warm and “ripen” the sub-par snowcover to 0° C throughout, or “isothermal”.
These unusually sustained and high inputs of energy at the snowpack surface hastened early development of isothermal snowpack temperatures on progressively higher and cooler (N’ly) terrain, as described in the March 23 CODOS Update and seen in the snowcover profiles performed at CODOS sites on March 17-20, 2015. Once isothermal, additional energy inputs to the snowcover by solar and thermal radiation, warm air (turbulent mixing), and precipitation (rain) could be consumed in melting the ice matrix, rather than warming the ice matrix to 0° C, and early snowmelt discharge from the snowpack began in earnest, as was seen in March hydrographs throughout the Colorado Mountains. Considerable fractions of low elevation terrain, as well as higher, south-facing terrain, lost its snowcover entirely.
Henceforth, spring 2015 presented unusual interactions, for Colorado’s “continental” snow climate, between the warm snowpack and snowpack SWE and depth. Isothermal snowcover conditions were generally sustained and expanding the spatial extent of snowmelt to higher, cooler terrain throughout the duration of snowcover, if at sometimes low rates of melt. At the same time, new snowfalls in late April and throughout May were adding mass (mostly as snow) to the warm snowcover, even re-covering previously snow-free terrain. Often, the exceptionally high precipitation rates, as snow, during May were offsetting the loss of snowcover to slower rates of melt. Snotel SWE data presented a picture of fluctuating net mass balance, as SWE, albeit at much-below-median SWE levels. Snowcover depths also showed fluctuating gain/loss in snowpack thickness (and therefor bulk density) on Snotel pillows as new snow accumulated, settled, re-accumulated, re-settled, and etc. At times, ‘warm’ rain-on-snow was eroding the lowest elevation snowcover (at Snotel sites such as McClure Pass) or, where falling at or near 0° C, saturating the snowpack at higher elevations and causing an increase in reported SWE.
Here in SBB, settlement of the comparatively warm new snow at SASP (11,060’) during late April and May was rapid and snow depth fluctuated through a series of peaks and valleys, with little net change during the month since snowmelt was also underway and eroding the snowpack continuously, albeit at a slow rate. Meanwhile, SWE content increased and SASP snowpack bulk densities became quite high, even at this well-sheltered site where wind effects are minimized. At the higher elevation SBSP plot (12,180’), snowcover depth (and SWE) increased steadily during the late spring from 0.6 meters on April 15 to a season maximum of 1.5 meters on May 23. Bulk densities were also high at this site, although wind effects play a complicating role in producing those densities. Rain-on-snow episodes at SBB were rare and had negligible impact, until early June.
As a pleasing upshot of the “Miracle May”, Coloradans re-experienced dazzlingly white, snow-plastered mountains in spring again, with no dirty snow to be seen (until June). And, late April and May powder was a novel thrill for late-season snow riders, particularly in Summit County.
June 7, 2015 at the Senator Beck Study Plot (12,180’). The very high snow albedo seen in this photograph was the norm through most of spring 2015, only deteriorating in subsequent weeks as buried dust layer D3 merged with D2 and D1 emerged, and then with comparatively minor impact. Photo by Jason Welz for CSAS.
Soon, snowmelt was in high gear (see June 4 CODOS Update) and snowcover was quickly retreating to higher elevations, above the Snotel network, even without dust-enhanced radiative forcing (see dust section below). Decreasing precipitation and steadily increasing day length and solar intensity, along with warmer weather, rain-on-snow in June, and emergence of the minimal dust contained in the snowcover – i.e., the complete spectrum of snowpack ablation factors – were finally winning the day. As seen in the basin scale SWE plots shown earlier, June snowpack ablation was rapid, at rates similar to the 1981-2010 median rates of SWE decline, or slightly steeper, and the Snotel network reported “snow all gone” on dates that were close to normal, despite the remarkably convoluted trajectory to SAG.
A summary of WY 2006-2015 snowmelt rates and associated conditions at the 15 Snotel stations that CODOS routinely monitors, statewide. Days to SAG refers to the time between Peak SWE and “snow all gone” at the Snotel sites. Adjusted Daily Mean Loss calculates the rate of snowmelt following Peak SWE, including all precipitation received after Peak SWE (assumed to be snow). Melt rate tables are presented for each of the 11 CODOS monitoring sites on their webpages.
WY2015 snowmelt rates at the 15 Snotel stations that CODOS monitors are summarized in the table above. Many stations experienced Peak SWE in early March but retained snow until late May, with May precipitation delivering large amounts of SWE following the earlier absolute peak in SWE at those sites. Other sites recorded Peak SWE in May, and much shorter intervals between Peak SWE and “snow all gone” (SAG). This range of conditions complicates interpretation of WY 2015 melt rates and comparison to prior years. Overall, however, WY 2015 snowmelt rates were largely determined by ‘normal’ energy inputs (see CODOS WY 2014 Summary), under ‘normal’ snow albedo conditions. Episodes of radiative forcing produced by reduced snow albedo by dust-on-snow, and enhanced absorption of solar energy, were short-lived, late in the snowmelt cycle, and comparatively minor, relative to prior years.
DUST-ON-SNOW CONDITIONS
Among the other anomalies observed during winter 2014/2015, Colorado experienced the lowest number of dust-on-snow events observed by CODOS since 2004/2005 (see also Dust Log). Further, those three events contained the lowest WY total mass of dust deposited in several years, perhaps during our entire period of record. Based on analyses performed by our USGS collaborators in Denver of samples of WY 2015 events D1, D2, and D3, the total mass of mineral dust deposited this season at the Swamp Angel Study Plot in SBB was just over 2 grams per square meter (2.048 g/m2), a small fraction of the dust depositions observed in prior seasons (see Mass Loading Data).
This decline in the number and intensity of dust-on-snow events, particularly during the primary March/April/May ‘dust season’, seems attributable to at least two factors. First, as reflected in the low count of SBB Winter Storms discussed above, the winter of 2014/2015 produced comparatively fewer synoptic scale weather events over the desert Southwest and Colorado Plateau. Consequently, there were simply fewer opportunities for S, SW, or W’ly pre-frontal wind fields capable of mobilizing, elevating, and transporting dust into Colorado to develop. Overall, winter 2014/2015 was the least windy season in the period of record at the CSAS’s Putney Study Plot (see Total Miles of Wind at PTSP graph). On average, April has been the windiest month at PTSP and produced the most dust-on-snow events. However, April 2015 was the least windy April in the period of record (but did still produce all three dust-on-snow events of the season).
Secondly, some of the few weather events that did traverse the Colorado Plateau with sufficiently potent southwesterly winds to mobilize loose soils and deliver dust-on-snow to Colorado, such as Storm #10, apparently also delivered (or were closely preceded by) sufficient moisture to wet or cover (with snow) those Colorado Plateau soils and prevent their mobilization. Without first-hand knowledge of those conditions, and almost no ground-based monitoring of dust emissions and soil conditions available to CODOS, this assumption is based on regional airport precipitation measurements, NOAA/NWS National Snow Analysis data, and occasional first-hand observations relayed to us.
In a departure from the impacts observed for the past several seasons, dust-on-snow played no role in the early snowpack warming and snowmelt observed during March 2015, since the first (but extremely minor) dust-on-snow event (D1) of the season was on April 1st and may have been limited, spatially, to the southern mountains in any case. Subsequent dust-on-snow events D2 (also very minor) and D3 (the most substantial event of the season) were deposited, merged, and exposed only briefly in mid-April, marginally reducing snow albedo and absorbing solar radiation. Overall, this season’s dust-on-snow was classified as “Min Dust” intensity, under the DERC approach, and established a new ‘end member’ in the range of dust intensity observed by CODOS, at the low end of that range.
A view of the upper, alpine portion of the Senator Beck Basin Study Area on June 29, 2015. The Senator Beck Study Plot (SBSP) instrument tower is seen in the center of the image, at 12,180’. Peak 13,510’ is the high point in the distance. This image depicts the comparatively Min(imal) Dust intensity observed during WY 2015, and the comparatively minor reduction in snow albedo produced by 2 grams of fully exposed and merged D3/D2/D1 dust. Also evident in this image is the concentration of the remaining snowcover on the leeward portions of major terrain features in the Basin (and typical of all nearby terrain). Although such redistribution of snowcover by wind (and of dust, as seen in the uneven concentrations of dust here) to leeward slopes is routine in alpine terrain, very high and sustained winds during Storm #5 produced unusually intense erosion in exposed areas and heavy re-deposition of the snowcover onto lee slopes nearby.
After the storms of mid- and late-April, this merged D3/D2/D1 was buried under enough new snow to shield it from solar radiation for the remainder of April and most or all of May. Thus, dust was generally a non-factor in snowpack ablation until late May or early June. In the end, during the final, sustained exposure of this merged dust in June, reductions in snow albedo by this small quantity of dust were comparatively minor, relative to reductions observed in prior years, but still sufficient to absorb a meaningful increment of additional solar radiation and increase the energy available for snowmelt (see June 22 CODOS Update).
RUNOFF BEHAVIOR
As discussed earlier, heavy September rains and the consequent saturation of soils and near-surface aquifers seemed likely, at the time, to ensure a more efficient spring snowmelt runoff, yielding a higher proportion of the available SWE as measured snowmelt runoff at headwater gauges and reservoirs, usually a desirable effect. Eventually, record May precipitation, and the fraction of that precipitation received as rain below snowline, reinforced the effects of those fall rains, elevating the anticipated ‘efficiency’ of May snowmelt (and rain) runoff to a flooding threat, with completely saturated soils and near-surface aquifers throughout Colorado’s mountain watersheds.
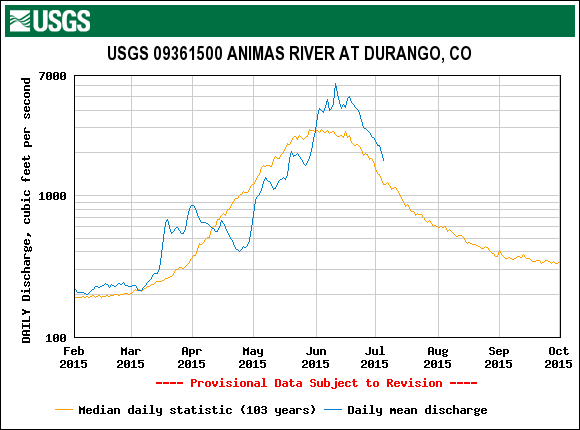
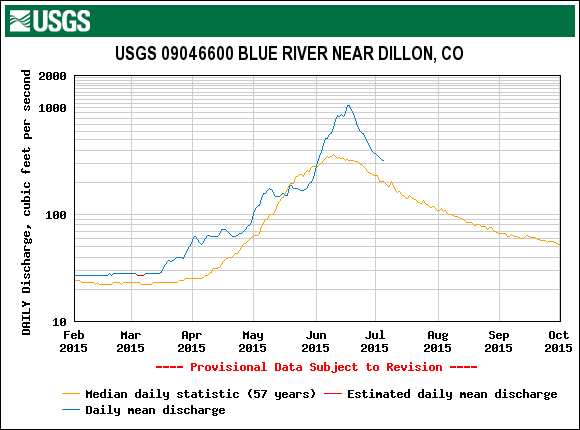
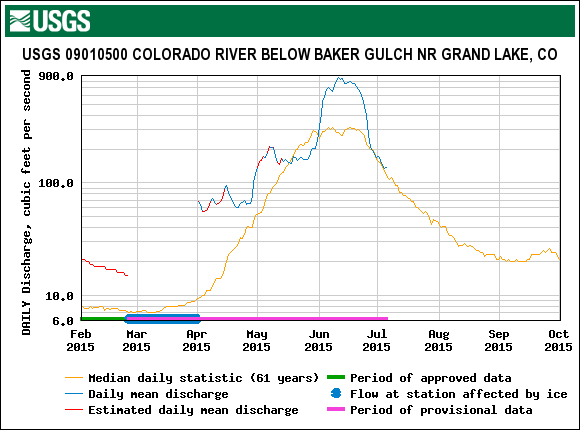
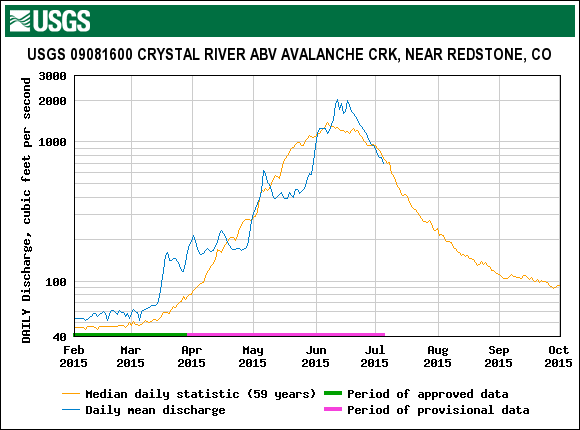
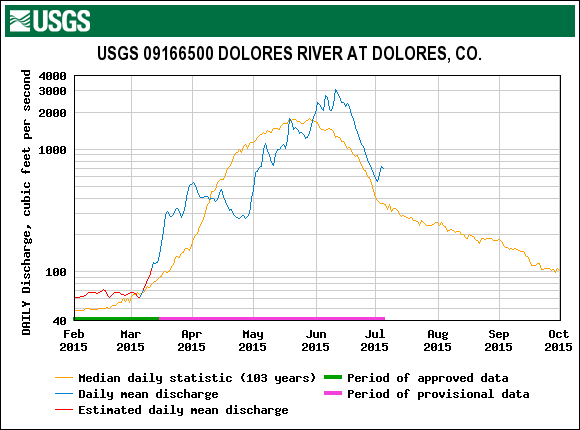
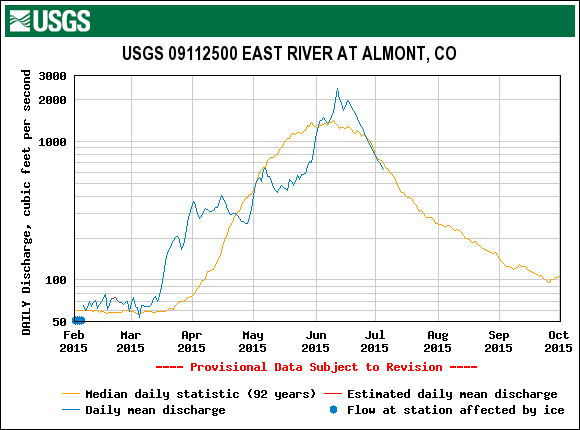
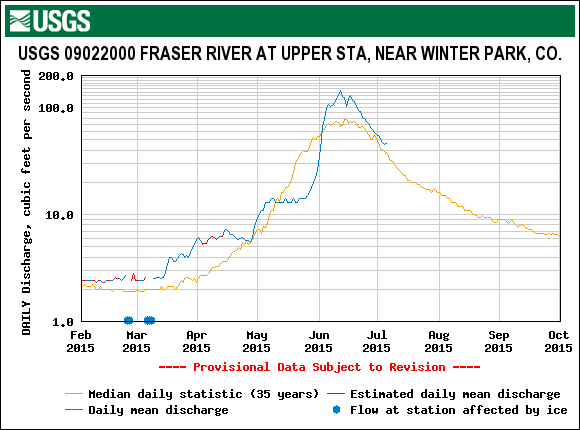
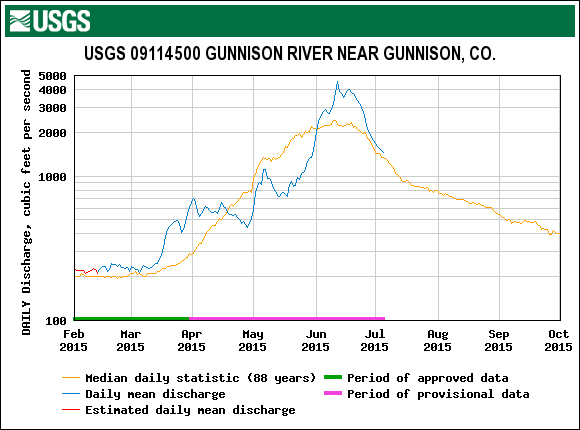
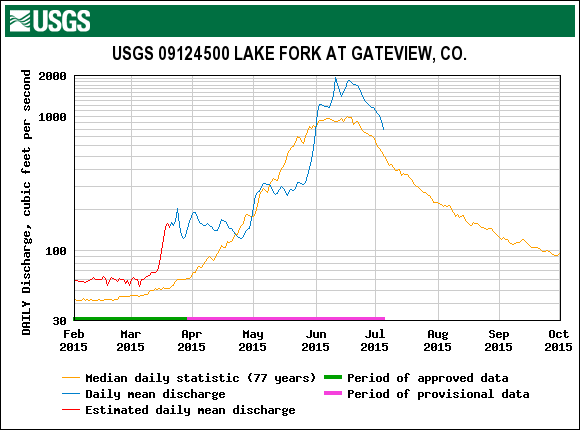
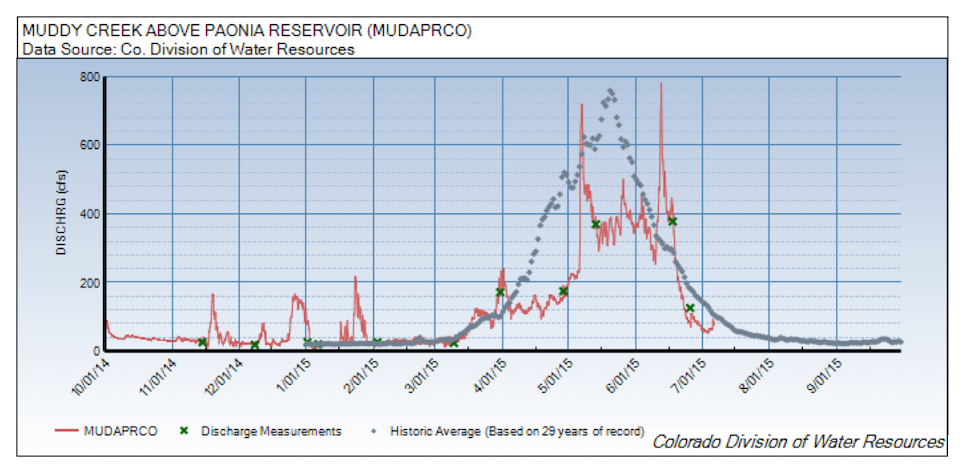
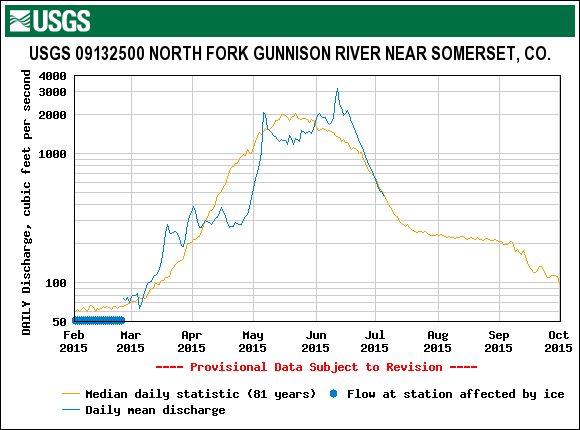
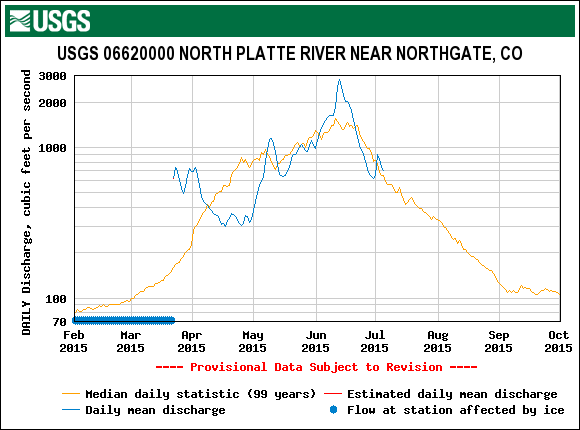
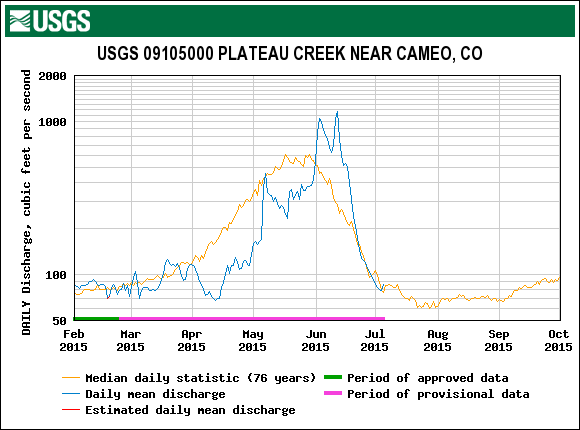
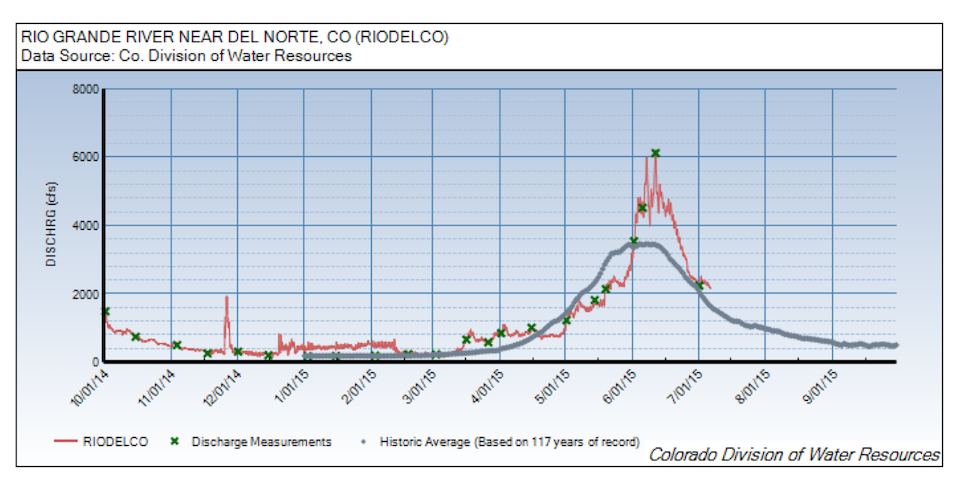
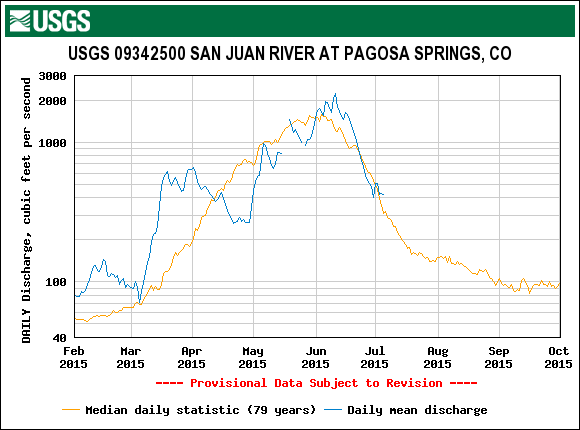
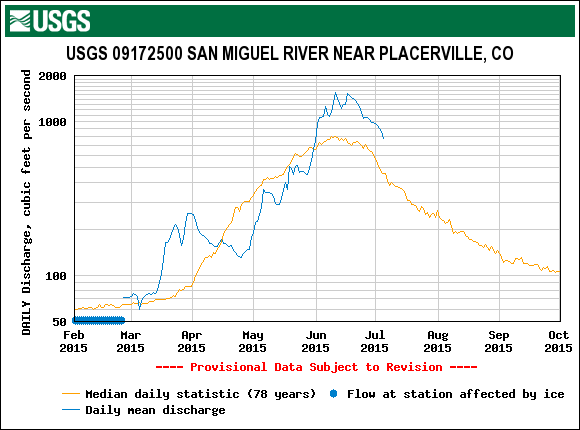
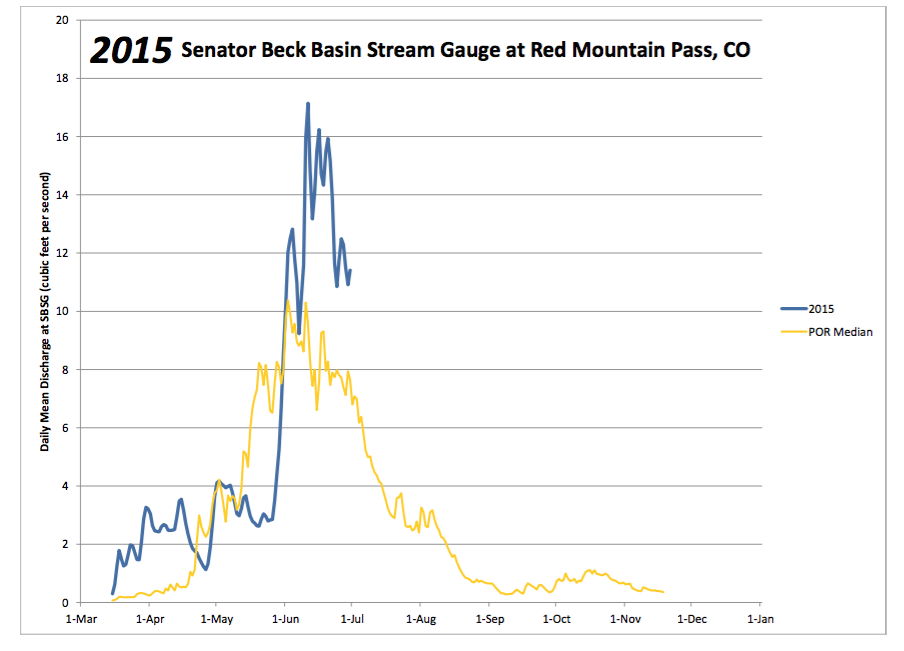
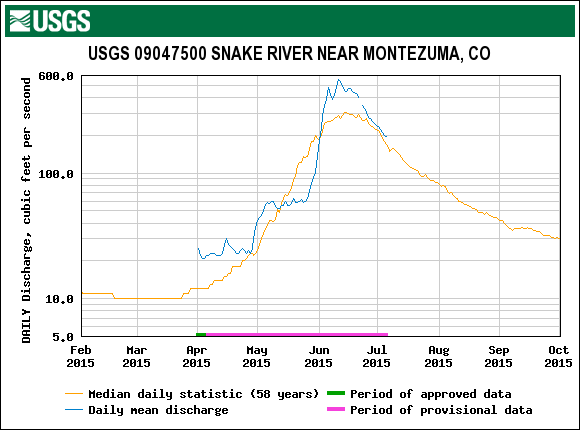
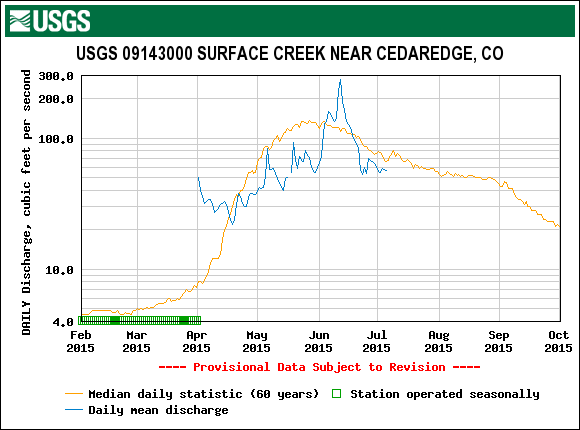

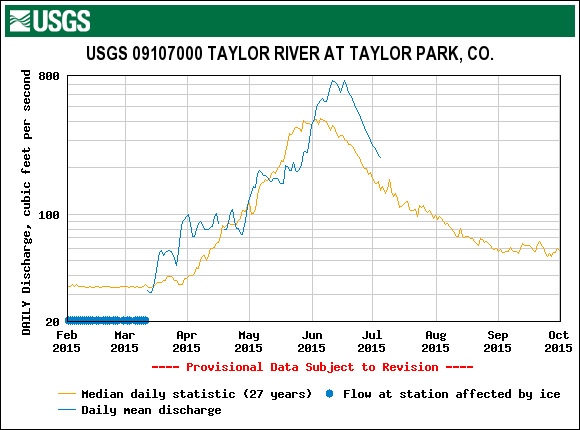
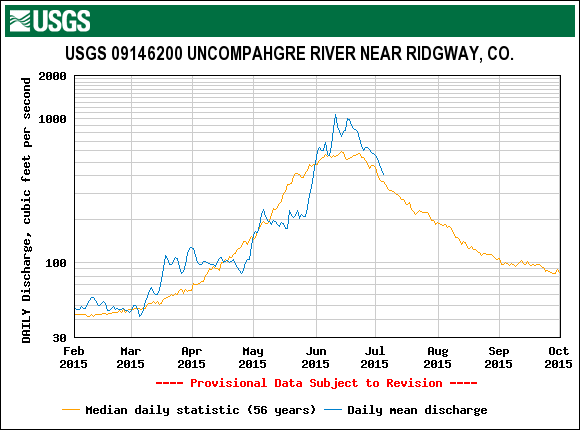
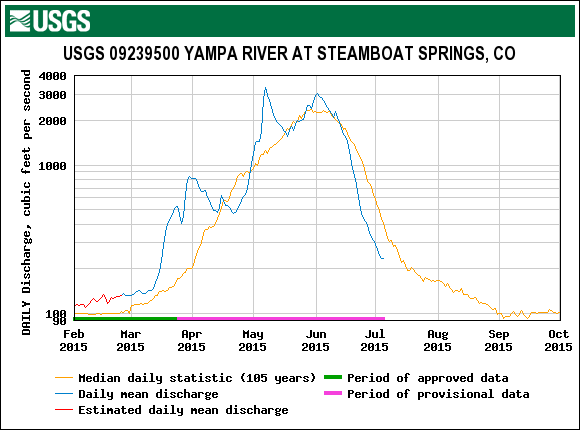
Early July 2015 discharge plots from 24 stream gauges monitored by CODOS, in alphabetic order (by river name), including the Senator Beck Stream Gauge at Senator Beck Basin.
With the early onset of isothermal snowcover and melt-sustaining energy budget conditions in March and early April described earlier, correspondingly early snowmelt discharge from the snowpack began in March, quickly surging throughout the Colorado Mountains to abnormally high discharge levels for March and early April (albeit at still low absolute levels of discharge, relative to subsequent peak flow levels). Many gauges recorded a March/April peak flow on April 1 before declining and plateauing for much of April and in many cases falling back below ascending median values. Flows at the USGS Upper Colorado River below Baker Gulch gauge were a notable exception, remaining above median levels throughout April.
A second statewide surge followed in late April, perhaps aided to a limited degree with the brief emergence of the merged dust layers D3/D2/D1 (or just D3, where the other events were not present). Two winter storms near the end of April are not believed to have produced a significant rain contribution to this surge. This surge briefly restored median flow levels in some but not all watersheds before stormy weather in May, causing major reductions in solar energy flux to the snowcover, produced another plateau in discharge levels, again falling below median values for most or part of May. Here, the USGS North Fork Gunnison River near Somerset gauge is notable, recording a very sharp surge in late April and early May to a level matching median peak discharge some two weeks early before declining for the remainder of May.
Despite the reduction in snowmelt energy budget caused by the reduced solar energy inputs during stormy weather in early May, most stream gauges that CODOS monitors were recording steadily increasing discharge in late May. Rain on saturated ground below snowline, and rain-on-snow eroding the lowest elevation snowcover, may have enabled those increasing flows, more than offsetting the reductions in snowmelt runoff at higher elevations.
By the end of May, stormy weather abated, and May snows had melted enough to allow the minimal dust in the snowpack to finally emerge over increasingly large areas of the snowcover and contribute an additional increment of absorbed solar energy. A final runoff surge to the season’s peak discharge followed in early June, at most gauges. Warm rain-on-snow, as tropical air from the remnants of East Pacific hurricanes invaded Colorado in early June, also enhanced snowmelt rates, even at the highest elevations. Most gauges recorded very high peak flows well above median peak levels, some by a factor of 2-3x median, and minor flooding did occur in some watersheds. Here, the USGS Tarryall Creek at Upper Station near Como gauge was an exception, recording 5x the normal peak discharge.
In general, these peak flows were at or somewhat later than median timing for the peak. Exceptions include the USGS Dolores River at Dolores and Taylor River at Taylor Park gauges, which both peaked about two weeks after the median date, and the North Fork of the Gunnison Near Somerset which recorded a peak flow almost a month after the median, aided by a very late, rain-enhanced peak flow on Muddy Creek (and perhaps releases from Paonia Reservoir). Interestingly, the USGS Yampa River at Steamboat Springs gauge recorded its absolute peak in early May, a few weeks ahead of its median peak date; a second, barely lower peak flow came very near the typical peak date.
In the end, Colorado’s WY 2015 mountain-derived water supplies benefited greatly from those May rains and snows, however difficult this ‘eleventh hour’ spring runoff behavior may have been to predict and manage.
DUST ENHANCED RUNOFF CLASSIFICATION
Earlier this winter CODOS introduced a Dust Enhanced Runoff Classification (DERC) approach to linking dust-on-snow, snowpack, and spring weather conditions to patterns in statewide hydrographs from the 2006-2014 period within a 3x3x3 Dust Enhanced Runoff Space (see also the January 22 CODOS Update).
A conceptual Dust Enhanced Snowmelt Runoff Space integrating the interactions of March 1 SWE, dust intensity, and spring precipitation.
Although WY 2015 hydrographs are currently still high on their descending limbs, the following table presents the final DERC classification of WY 2015 parameters at each of the 19 stream gauges routinely monitored by CODOS. Water Years 2006-2014 classifications are contained in Excel workbook Runoff_Space_by_Region_and_WY.xlsx along with three regional analyses. Another workbook, Runoff_Space_by_Watershed.xlsx, contains individual DERC analyses for WY 2006-2015 for each of the 19 stream gauges. CODOS will await the completion of snowmelt runoff to prepare a new set of updated DERC datasets associating WY 2015 hydrographs from those 19 stream gauges with these WY 2015 DERC classifications.
WY 2015 DERC matrix classification of factors influencing snowmelt runoff behavior at 19 stream gauges located in watersheds monitored by CODOS.
March 1 SWE conditions at Snotel sites monitored by CODOS were reviewed and compared to DERC analyses of Water Years 2006-2014 in order to identify a subset of cases with similar early March 2015 SWE conditions. Hydrographs for those cases at each of the 19 gauges monitored by CODOS were identified as potential predictors of general patterns in WY 2015 hydrographs. That subset of cases would be further refined as dust-on-snow and spring precipitation conditions unfolded at each CODOS site, and hydrographs for Water Years 2012 and 2007 emerged as ‘best match’ prior cases within the 2006-2014 period of rigorous dust-on-snow monitoring, recognizing that this short period of observations had yet to capture many permutations of the three key DERC parameters.
In the end, this DERC approach was thwarted by the “Miracle May” and the heavy rain and snow that it delivered. WY 2015 broke entirely new ground into unoccupied cells within the DERC’s 3x3x3 framework in many watersheds, and only nominally shared a cell with WY 2007 behaviors in other watersheds. In the end, WY 2015 revealed the inability of the DERC approach to capture the impact of heavy spring rains on snowmelt runoff streamflows, and to discriminate the fraction of measured streamflows produced by rains below snowline from the fraction of streamflows derived from snowmelt, per se. Nonetheless, the DERC database does now include WY 2015 as a case study in the impact of heavy late season precipitation, as both snow and rain, interacting with minimal dust-on-snow and mostly average or poor March 1 snowpack conditions.
WY 2015 – ADDITIONAL THOUGHTS
Two stories dominated the national weather and climate news during the winter of 2014/2015 – drought in California and snow in Boston. Images of California Governor Jerry Brown participating in a ‘snow survey’ in a grassy meadow stood in sharp contrast to mountains of stored snow in Boston. These disasters conveyed a sense that ‘extreme weather’ was dominating the country last winter. Now and then, discussions of the details of this weather in the press and on TV mentioned arcane features such as “the Blob”, “R3”, the Arctic Oscillation, El Nino, and the Pacific Decadal Oscillation.
Explanations in the media by climatologists connecting those emerging climate-driving features with the local weather, in California, or New England, or Colorado, were ad-hoc and often speculative, given the pace of change in Pacific Ocean conditions last winter. Attempting to make those connections here would be an overreach but some notable features and events of last winter in Colorado seem worth noting and will, hopefully, be fully explored and explained by the Colorado climate science community.
Eastern Pacific Hurricanes: Colorado experienced very heavy precipitation, largely as rain, at both ends of the winter of 2014/2015 as the remnants of strong hurricanes off the Mexican coast migrated northward into the state. Such events are not especially uncommon in the fall but are uncommon in June.
Lack of Storms: as discussed above, CSAS logged only 18 Winter Storms at SBB last winter (7 of which came after mid-April), the lowest count in our period of record and well short of our 12-year average of 24.5 Storms. Further, winter 2014/2015 was the least windy winter in our period of record at SBB, as well as the least ‘dusty’. Winter Storms constitute (generally synoptic scale) ‘weather opportunities’ for some quantity of snow precipitation (the threshold for our Winter Storm is a minimum of 12 mm of water equivalent). A near absence of Winter Storms (or even lesser amounts of precipitation) during the two particularly dry periods described earlier, in January/February, and March/April, were not offset by extra-large Storms, and Colorado’s overall snowpack was in major deficit until rescued in May.
The persistence of a “ridiculously resilient ridge” (or “R3”, as coined by Dan Swain, PhD candidate at Stanford Univ.) of high pressure to our northwest, over the Gulf of Alaska, forced the storm track well to the north, ‘over’ (north of) the West Coast and interior West and then ‘down’ into the persistent trough over the Midwest and East. Development of a very large, very warm “Blob” of warm water immediately off the California Coast resulted from the long-term absence of storm winds that would mix and moderate those warm waters with colder water. At one time, the Pacific Decadal Oscillation index, a measure of North Pacific conditions similar to the ENSO Index, rose to unprecedented high values, fueling speculation about the ascent of a large reservoir of deep warm water deep to the surface, triggering an immense discharge of previously stored heat to the atmosphere. ENSO also experienced very high values as spring unfolded. In short, conditions in the Pacific Ocean seemed particularly volatile over the past year and the upshot was that Colorado was ‘cut off’ from the flow of progressive weather systems that could deliver a more normal quota of Winter Storms. The long-term persistence of the blocking ridge has been linked, by some, to the increased amplitude and decreased rate of the Arctic Oscillation, as temperature gradients between the rapidly warming Arctic and mid-latitudes decrease.
May 2015: as described by forecasters at the NOAA Climate Prediction Center, a number of multi-model ensembles enabled them to forecast a wet May for Colorado, with a shift to the east of the blocking ridge to our west, re-positioning the ridge over Hudson Bay. This shift is thought to be strongly correlated with the simultaneous ‘relaxation’ of the Pacific Decadal Oscillation index in spring and ramping up of El Nino.
In their totality, conditions over the northern and equatorial Pacific Ocean, North America, and Colorado during the winter of 2014/2015 may further validate the assessment among climate scientists that global (or, some would say, ocean) warming is leading to the intensification of the hydrologic cycle. While the quality of popular science characterizations of this emerging understanding ranges greatly, a particularly highly recommended Australian production takes a global look at the past decade and the experience of this intensification of weather and hydrometeorology in particular. (See video below or view on youtube by clicking here.)
WY 2015 Snow science challenges: Colorado has long been characterized as having a “continental” snow climate where high elevations, (relatively) shallow snowpacks, and highly dynamic but often net-negative radiative energy fluxes tend to result in a cold snowcover, with snow temperatures well below 0° C until late in the snow season. In contrast, a “maritime” or coastal snow climate is characterized by lower-elevation, deeper, warmer snowpacks that exist much closer to 0° C for much or most of the winter. Rain and mixed precipitation is routine at the lower elevations of maritime snowcover and can occur at higher elevations at any time during the winter. Colorado experienced both snow climates this season, with challenging impacts for snow-derived water supply forecasters and managers.
Among those, unusually prolonged periods of very high solar radiation inputs, and high temperatures, during the two extended dry periods of winter 2014/2015 had the effect of entirely ablating significant amounts of snowcover on solar aspects and producing unusually warm and isothermal snowcover on other terrain earlier than normal. Spatial variations in mid-winter snowcover extent and depth and snowcover properties such as temperature and density were arguably extreme. Then, May’s record precipitation, as rain and snow, sustained what were essentially maritime conditions over high elevation terrain. Relying on past winter analogs to capture these effects, like our DERC approach, would find few, if any matches.
Remote sensing of snowcover conditions, from space or with aircraft, was challenged by the very stormy May weather. Ground-based observations and careful interpretation of Snotel data did capture some of these impacts on snowcover, particularly in May, but the absence of snow temperature monitoring infrastructure hampers understanding of the timing of isothermal conditions. Adding snow temperature measurement capacity to the Snotel network would be a low-cost investment in tracking this important parameter on a large spatial scale.
In summary, Colorado dabbled in maritime snowcover processes and conditions during the late winter and spring of WY 2015. Datasets from this anomalous season, such as SBB data and Snotel data, will provide snow and snow hydrology modelers with an important case study in a blended continental/maritime winter in a high elevation mountain system.
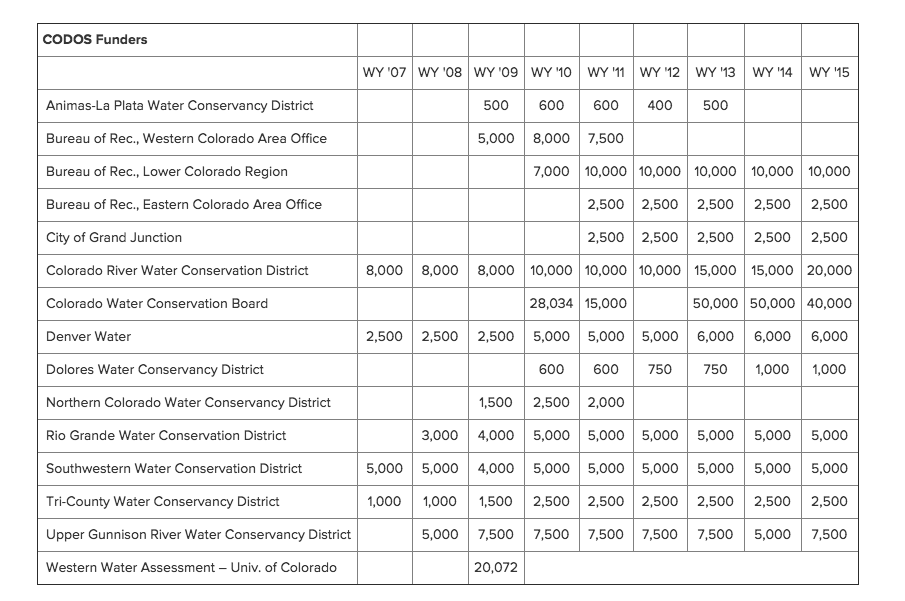
That concludes this WY 2015 Season Summary. The Center for Snow and Avalanche Studies salutes our many funders, large and small, for the Colorado Dust-on-Snow program and our associated Mountain System Monitoring program at Senator Beck Basin. Their essential support enables this field-based effort to support Colorado and Colorado River Basin water managers with timely, integrated monitoring and analyses as conditions unfold. WY 2015 was certainly a uniquely challenging and important case study in Colorado's ever-changing snow system.