
CODOS WY 2014 Summary
Regional variations in snowpack formation, dust-on-snow intensity, and spring weather were, once again, displayed throughout the Colorado mountains during the winter and spring of 2013/2014. Colorado’s northern and central mountains developed average or better snowpacks, while the southern mountains once again fell short of average in many watersheds. Dust-on-snow deposition and consequent reductions in snow albedo varied in intensity from southwest to northeast, as usual, but were at least ‘average’ and sufficient to strongly influence snowmelt behavior in all locales. And, spring weather also varied, with locales north of I-70 receiving above-average March/April/May precipitation while other locales saw average spring snowfall or less.
This season summary will explore those three elements – snowpack (SWE), dust-on-snow intensity, and spring weather – and their combined impacts on spring 2014 snowmelt runoff by presenting regional summary data and referencing site-specific data shown on our CODOS program and site-specific webpages. This analysis will focus on the radiative forcing of snowmelt caused by dust-on-snow. As we have learned over the past decade, dust-induced reductions in snow albedo, and corresponding increases in absorbed solar energy at the snowpack surface, place even more emphasis on the role of solar (short wave) radiation in the springtime snowmelt energy budget (Table 1).
Table 1: summary of Table 11-1, NRCS National Engineering Handbook, showing relative contributions of snowmelt energy from various sources. Dust-on-snow, when exposed at or near the snowcover surface, amplifies the importance and impact of solar radiation. See: ftp.wcc.nrcs.usda.gov/wntsc/H&H/NEHhydrology/ch11.pdf.
CODOS has developed a conceptual “Dust Enhanced Runoff Space” representing the interactions of snowpack (SWE), dust-on-snow intensity, and spring weather as a tool for characterizing individual seasons and understanding their differences (Fig 1).
Figure 1: a conceptual, 3x3x3 matrix containing 27 cells representing unique combinations of March 1 SWE conditions, seasonal dust deposition intensity, and March/April/May precipitation (as snow).
As previously discussed, the simple presence of dust in the Colorado snowpack does not always result in earlier-than-average snowmelt runoff. Spring weather still matters, and largely dictates the timing of dust-on-snow impacts on snowmelt. This Season Summary will discuss how, in many locales, spring 2014 was a case study in “delayed effects” from dust-in-snow and will place this season within the context of this “Dust Enhanced Runoff Space” model.
March 1, 2014 Snowpack Conditions
Figure 2: Basin-scale summary plots of Winter 2013/2014 SWE in Colorado watersheds, including a Statewide summary plot.
First and foremost, Colorado’s spring runoff is a product of the snowcover water equivalent (SWE) available to melt. Although the shape of a runoff hydrograph can vary widely, the final ‘volume’, or yield of a snowmelt runoff cycle is primarily a function of the accumulation of snow water equivalence in a given watershed. The NRCS Snotel network remains the best source of snowcover SWE data. This season NRCS made available the basin-scale summary plots of snowpack conditions shown above (Fig 2), including a State summary (from: ftp://ftp-fc.sc.egov.usda.gov/CO/Snow/snow/watershed/daily/). Similar site-specific Snotel plots (from: http://www.wcc.nrcs.usda.gov/ftpref/data/water/wcs/snow_proj) are shown on each of our eleven CODOS site webpages, linked from the menu at the top of this page.
Snowpack conditions on March 1 represent a benchmark, as the “dust-on-snow season” begins in earnest. Since winter 2004/2005, 76 of our 91 observed dust-on-snow events occurred after March 1 (Fig. 4, below), placing those dust layers within the upper snowpack. With the exceptions of the San Miguel, Dolores, Animas and San Juan River Basin and the Upper Rio Grande River Basin, snowcover on March 1 was above-average throughout the Colorado mountains, and substantially above-average in northern and Front Range watersheds. Overall, the statewide SWE summary plot (see Fig. 2) was above-average on March 1, 2014.
Within the scheme of the Dust Enhanced Snowmelt Space (Fig. 1), March 1 SWE conditions were “High” in the Yampa River/White River, Upper Colorado River, North Platte River, South Platte River watersheds, “Avg+” over the Gunnison River basin, and overall “Low” in the San Miguel, Dolores, Animas, and San Juan and Upper Rio Grande river basins. Subsequently, March, April, and May storms would variously augment, to one degree or another, those March 1 SWE conditions.
Spring 2014 Dust-on-Snow Conditions
The CODOS program at the Center for Snow and Avalanche Studies has rigorously monitored and documented dust-on-snow events at its Senator Beck Basin Study Area at Red Mountain Pass since winter 2004/2005 (WY 2005). A total of 91 events have been logged, ranging in mass from barely perceptible events of 0.15 gm/m2 to extremely heavy events of up to 47 gm/m2. Winter 2013/2014 (WY 2014) saw a total of 10 dust events, six of which were deposited ‘wet’, with associated snowfall, and the remainder ‘dry’, without accompanying precipitation (Fig. 3). Estimated total mass of dust in WY 2014 was less than in WY 2013, but still very substantial (see: http://www.codos.org/#mass-loading-data).
Given the trend of increasing dust deposition we’ve observed, and that was independently identified by Brahney et al. (2013), defining what constitutes “Average” dust intensity within the 3-tier scheme of the Dust Enhanced Snowmelt Space is difficult, as a moving target. WY 2013 established a new standard for what constitutes “Maximum” dust. Within the context of recent seasons, including WY 2013, WY 2014 dust intensity at Senator Beck Basin seems to fall within the “Average” category, although perhaps at the high end. Similar conditions were observed at our sites throughout the San Juan Mountains and in the remainder of the Gunnison Basin in May, before many of those sites lost snowcover in late May (see May 19, May 22, and May 26 CODOS Updates).
Later, CODOS field observations in June (see: June 10 CODOS Update) found “all layers merged” dust at the snowpack surface that was producing very large reductions in snow albedo at Grand Mesa, Independence Pass, on the Front Range, at Rabbit Ears Pass, and in the McClure Pass locale. In particular, dust event D8, on May 11, was ubiquitous and substantial at all those sites, as well as here in the San Juan Mountains. As at Senator Beck Basin, dust intensity was more-or-less “Average” at those locations, although perhaps at the high end of average in some locales.
Figure 3: the CODOS dust-on-snow event log, by winter season and by ‘wet’ or ‘dry’ type.
Figure 4: the CODOS period of record dust-on-snow event log, by month.
Spring 2014 Precipitation
Dust-on-snow impacts on the snowmelt runoff cycle are a function of dust intensity and the frequency and duration of dust exposure to direct solar radiation. March, April and May weather (“spring” or “MAM” weather) plays a critical role in determining dust-on-snow impacts on snowmelt timing and rates. A dry spring, with prolonged periods of clear, sunny weather will maximize opportunities for dust at the snowpack surface to absorb solar energy and accelerate snowmelt rates. A particularly stormy, wet spring not only reduces solar insolation, with cloud cover, it also results in frequent fresh snowfalls that restore a high albedo to the snowcover, minimizing the absorption of solar energy. Even when spring storms also deliver dust that dust is most commonly deposited early in the storm and contained within the bottom of a new snow layer. In an exception, event D8, on May 11, was deposited within the top of the new snow layer at Senator Beck Basin and perhaps elsewhere.
Spring storms that don’t contain new dust often bury older dust that was exposed at the old snowpack surface and reduce or halt the absorption of penetrating solar radiation in the underlying dust, depending on the thickness of that clean new snow layer. The effect of a wet spring, therefore, is to very frequently ‘reset’ snow albedo from low levels back to high levels, while adding additional snow and SWE to the snowpack. Additional clean snow on top of the uppermost dust layer will require longer to melt than the same amount of snow containing dust would require, thus extending the snowmelt cycle. An ‘average’ spring will also include several albedo ‘reset’ episodes, but less frequently and with less accompanying snow.
It is important to note that, although March, April, and May can contribute a significant fraction of a given season’s total SWE available for snowmelt runoff (e.g., 36% of average annual snow precipitation at Senator Beck Basin), the focus here is primarily on the frequency and duration of snow albedo ‘reset’ episodes (to high albedo), and secondarily on snowpack water content.
Table 2: March, April, and May (MAM) precipitation totals at 15 Snotel stations monitored by CODOS. Seasonal variance is shown as a percentage of the 1981-2010 mean MAM precipitation total for a given site.
Table 2 above characterizes 2006-2014 spring precipitation at the 15 Snotel sites that CODOS monitors, most of which are immediately adjacent to a CODOS snow profile site. MAM precipitation in 2014 varied widely, from -27% to +33% of mean, for a range of 59%. Within this WY 2006-2014 period, only 2012 and 2009 showed less range in MAM precipitation variability, at 26% (2012) and 36% (2009). Spring seasons 2008 and 2013 displayed ranges of 92% and 90%, respectively.
Perhaps most importantly, when averaging MAM precip across all fifteen Snotels, years with precip shortfalls outnumber years with precip surpluses, six to one, with two neutral years (2009 and 2014). Also, as exceptions to a more typical north/south surplus/deficit pattern, WY 2012 stands out as a particularly dry spring at all sites, and WY 2011 as particularly wet at almost all sites. Interestingly, WY 2014 exhibits a central mountain deficit (Fig. 5).
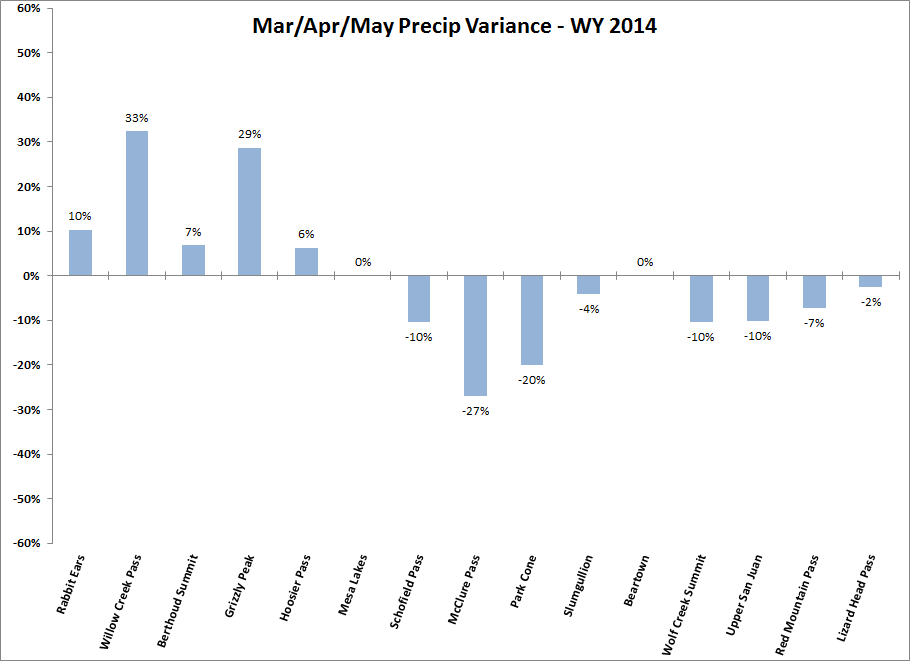
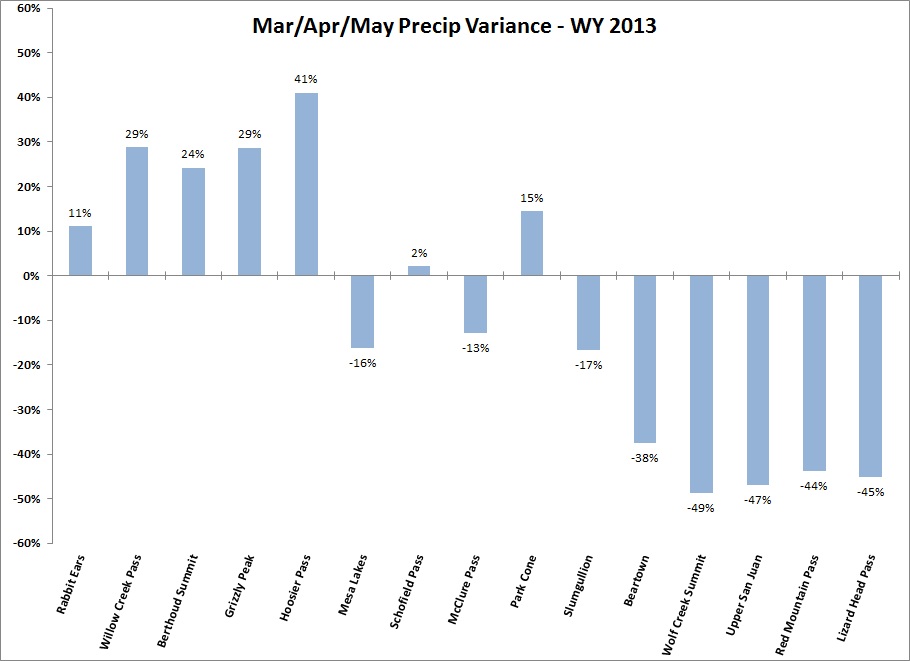
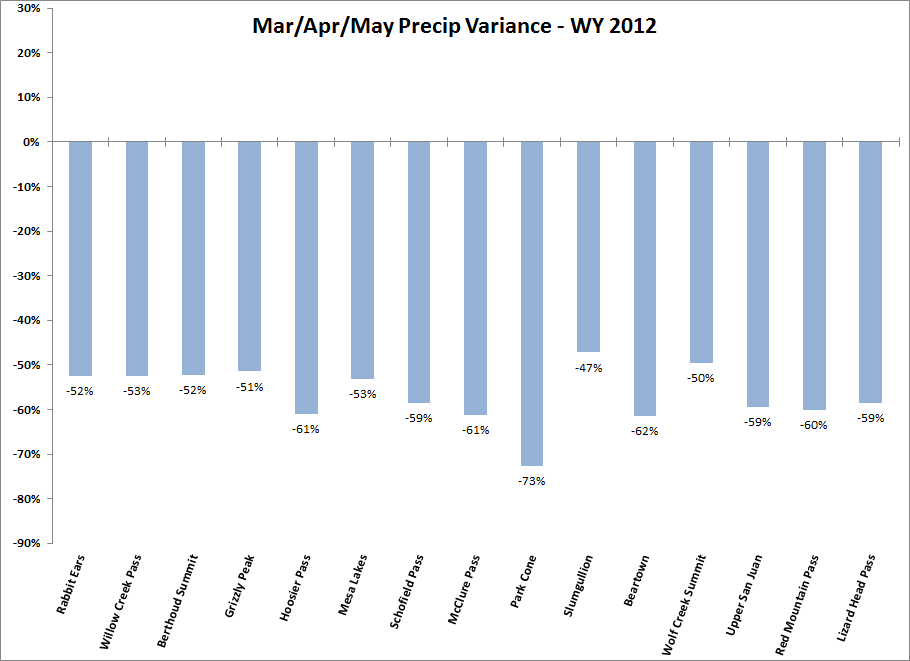
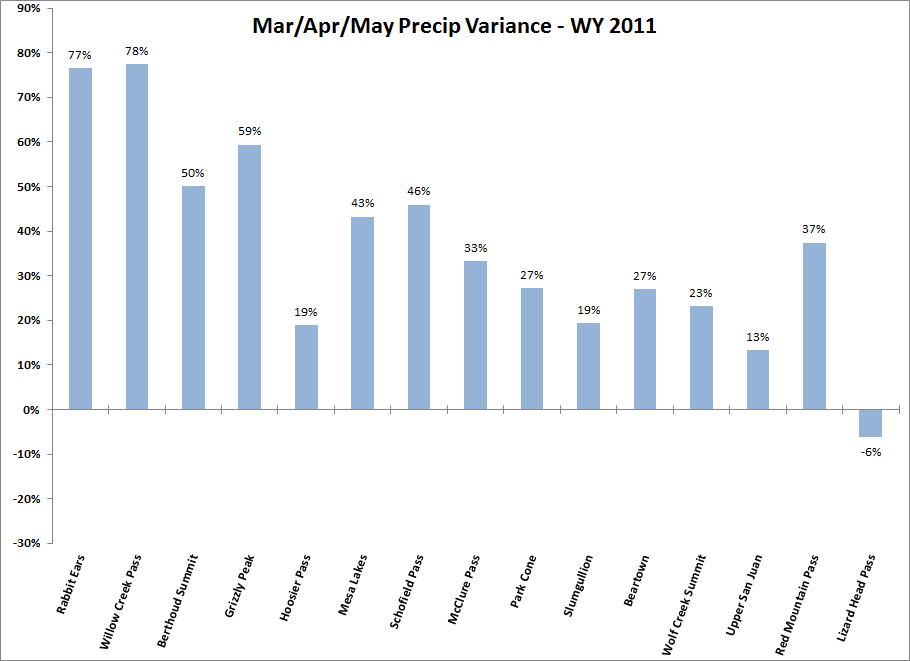
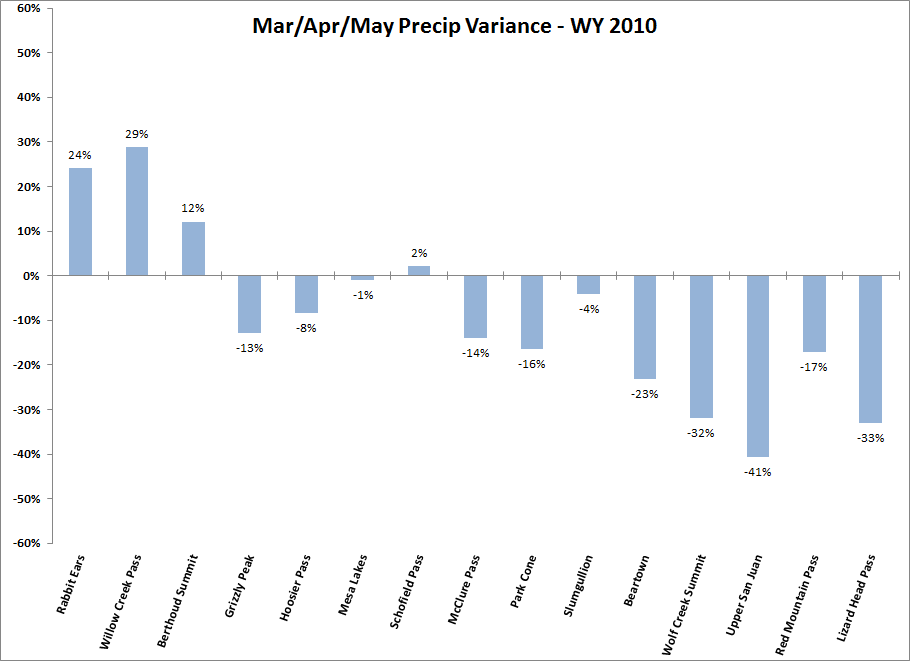
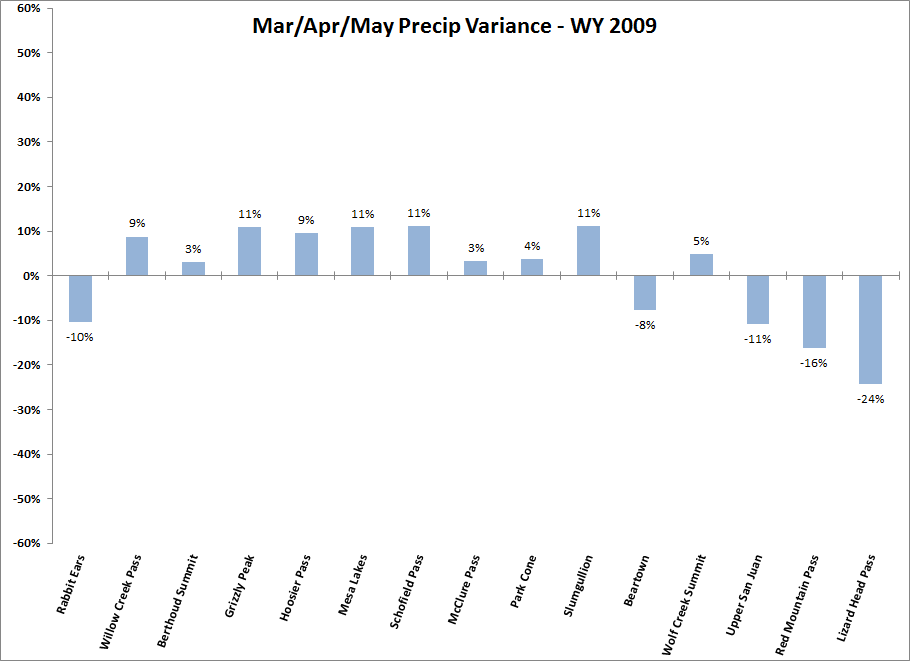
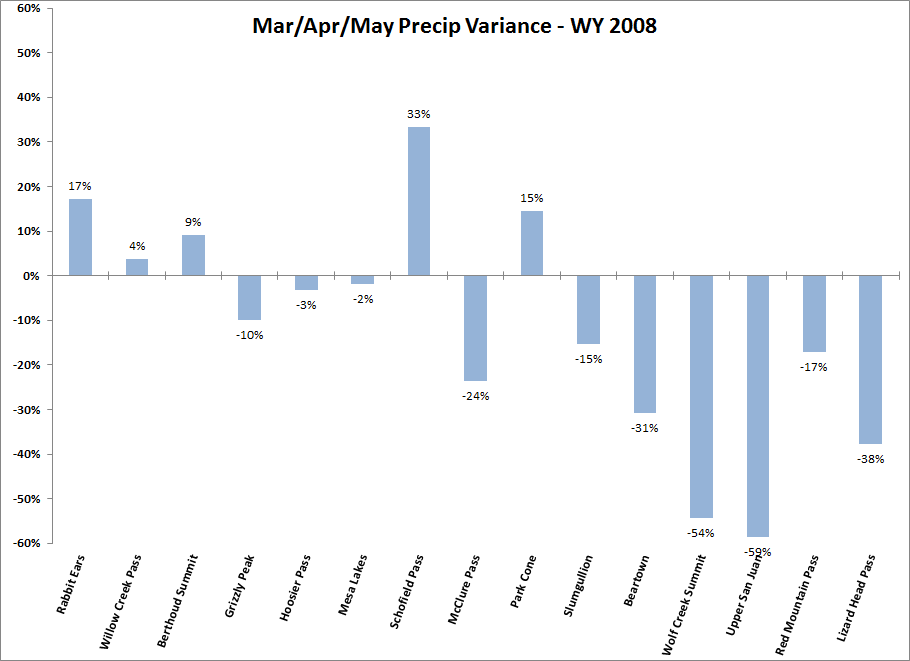
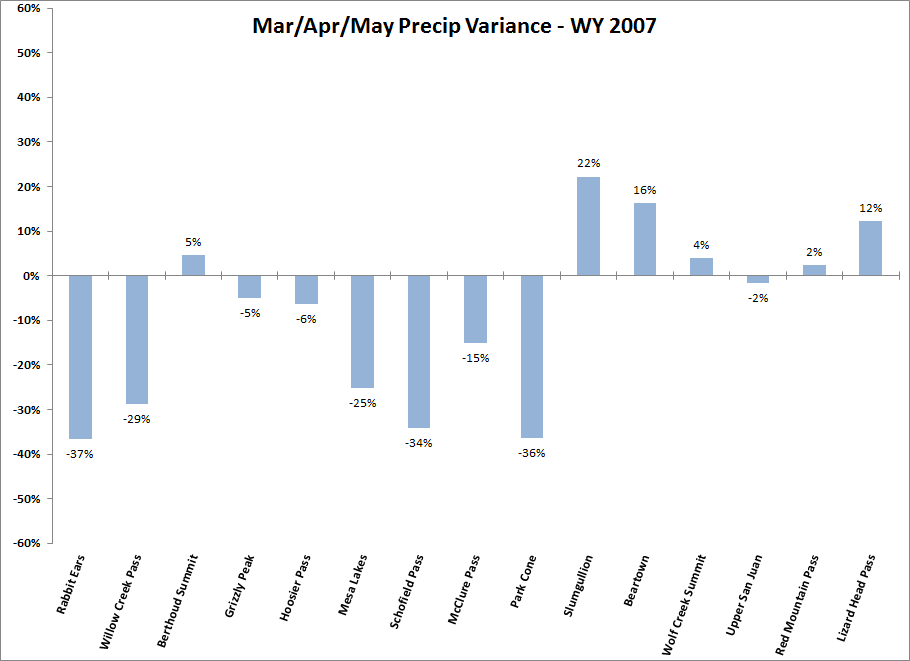
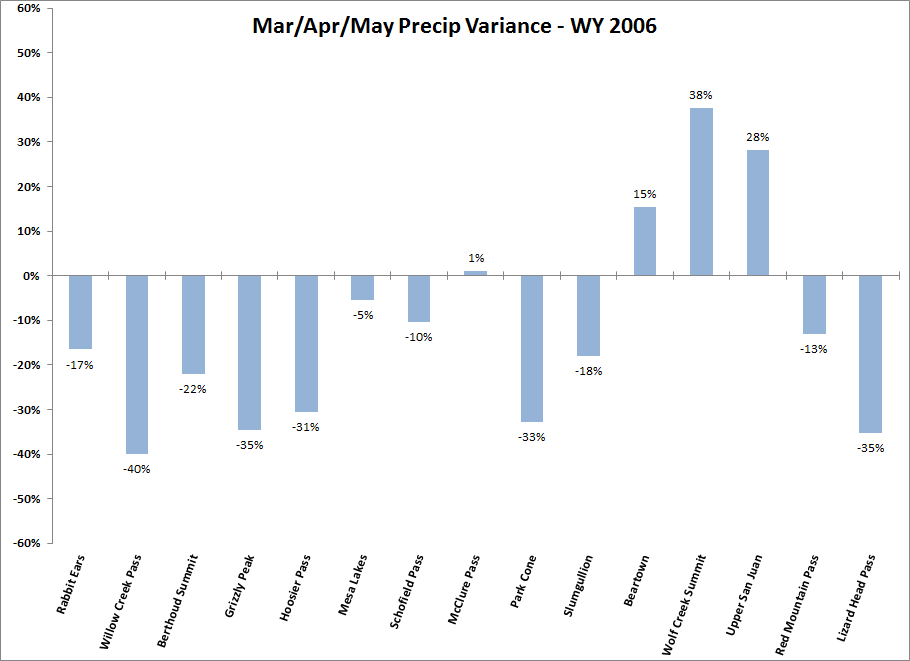
Figure 5: Spring 2014 variance from a given Snotel site’s 1981-2010 mean MAM precipitation, for the 15 Snotels monitored by CODOS. It should be noted that this is an extremely limited sampling of the Snotels within those watersheds and that these data should not be considered representative of all Snotels conditions within a watershed in a given Water Year (or of the sets of Snotels represented in the watershed-scale SWE plots above).
For the purpose of characterizing MAM precipitation at individual Snotels, CODOS will define “Avg” as the range from -10% to +10% variance from a single site’s mean, and ‘Dry’ and ‘Wet’ accordingly.
Figure 6: WY 2014 total March, April, and May precipitation in Colorado, as a percentage of station means, based on data from automated weather stations (not including Snotel). From the High Plains Regional Climate Center Web Page: http://www.hprcc.unl.edu.
Spring weather data are also available at a larger, state-wide scale. Although their data sources do not include Snotel data, the High Plains Regional Climate Center generates Climate Summary Maps of MAM precipitation for Colorado, showing percentage increments of the mean for the three month period (Fig. 6). NWS, Coop, and AWDN weather station data are used, and compared to individual station means. Given that network of weather stations, high elevation precipitation may be somewhat underrepresented, even though large-scale terrain influences on precipitation are often apparent in these maps. Some discrepancies exist between these maps and the Snotel data in Table 2, probably the result of local terrain effects on orographic precipitation. Nonetheless, these maps do provide additional information about watershed-scale precipitation patterns. In these maps, the most nearly average MAM precipitation in a locale would also fall within the 90-100% or 100-110% classifications.
Within the 3-tier characterization of MAM precipitation in the Dust Enhanced Snowmelt Space, Table 2 and Figure 5 show that 11 of these 15 Snotel sites experienced an “Avg Spring” in 2014, Willow Creek Pass and Grizzly Peak recorded a “Wet Spring”, and McClure Pass and Park Cone had a “Dry Spring”. At a larger, watershed scale, the combined information in Table 2 and Figure 7 is summarized in Table 3 below for watersheds monitored by CODOS:
Table 3: WY 2014 spring precipitation, by river basin, classified as dry, average, or wet within the Dust Enhanced Snowmelt Space scheme. Classification combines information in Table 2 and Figure 5 with mapping of MAM precipitation in Figure 6.
Runoff Behaviors
Based on the discussions above of March 1 SWE, dust intensity, and spring weather in the watersheds that CODOS monitors, WY 2014 snowmelt season conditions are summarized in Table 4 below.
Table 4: WY 2014 March 1 SWE, dust intensity, and spring weather conditions, by basin.
In broad terms, with local variations, Colorado WY 2014 snowmelt runoff behaviors fell into two general patterns within the “Average Dust” domain of the Dust Enhanced Runoff Space model (Fig 7). Northern, Front Range, and Upper Colorado River watersheds were remarkably similar, in their hydrograph pattern, strongly influenced by a wet spring that disrupted the impacts of dust and ‘reset’ snow albedo several times, prolonging the runoff cycle. Runoff in the Central Mountains and upper Gunnison Basin (including the North Fork of the Gunnison) was similar in the prolonged runoff pattern, although of slightly lower magnitude closer to median behaviors. Much poorer snowpack conditions and average spring weather in the Southern Mountains resulted in still more reduction in runoff amplitude, with below-average descending limb flows. These patterns are explored below.
Figure 7: WY 2014 conditions generally fell into one of two cells within the ‘Avg’ Dust domain, reflecting differences in March 1 SWE and spring weather conditions from north to south throughout the Colorado mountains.
Watersheds with High March 1 SWE
Yampa, Colorado River, North Platte and South Platte, Central Mountain, and northern Gunnison basin watersheds shared common “High” March 1 SWE, “Average” dust intensity, and “Wet” spring weather conditions (except in the Gunnison basin, which had a mix of Average and Dry spring weather). Spring 2014 hydrographs from those locales present very similar patterns which Figure 8 (below) represents in a composite plot against a generic ‘median’ hydrograph. (The usual selections of local and regional hydrographs are shown on CODOS site-specific webpages, found on the menu at the top of this page).
Figure 8: A unitless (log scaled) representation of spring 2014 hydrographs patterns in the Northern, Front Range, and Central Mountains showing the observed runoff behavior in red, and a generic ‘median’ hydrograph for those locales in blue. CODOS site-specific webpages include actual spring 2014 hydrographs for the associated watersheds.
In a notable display of synchrony throughout these watersheds, rapid dust-enhanced (D3/D4) surges in runoff in April and early May were equally quickly curtailed as spring storms delivered new snow and restored high albedo to the snowpack surface. After large winter storms in late April and early May, emergence of dust-on-snow event D8 and its merger with underlying dust layers initiated a final strong surge, briefly stalled by additional snow, to very high peak flows on/about June 1, under quite high, dust-enhanced snowmelt rates. Peak flow was followed by an initially rapid decline in flows, in early June, as high snowmelt rates continued to rapidly deplete snowcover.
Then, rates of decline on the descending limb slowed and actually began to parallel median flow rate declines, but at above-average levels, for the remainder of June and into July. That behavior was contrary to the prediction in our June 10, 2014 CODOS Update that descending limb flows would not be able to sustain median rates of decline, due to very high snowmelt rates, and would quickly fall to below-average levels. Although we don’t have sufficient information to determine why those June flows remained above or near median levels throughout June and into July, CODOS clearly underestimated the ability of heavy alpine snowpacks to sustain high flows throughout the descending limb. It’s also possible that solar inputs were not as intense and sustained as could be anticipated during a normally dry and sunny June.
Watersheds with Low March 1 SWE
Southern Mountain (San Juan Mountain) watersheds shared in common generally “Low” March 1 SWE, our current sense of “Average” dust intensity, and “Average (minus)” spring weather conditions. To the northwest, the Grand Mesa March 1 snowpack was better, at near-normal, but dust intensity and spring weather conditions were similar to those in the Southern Mountains. Despite the differences in March 1 SWE, spring 2014 hydrographs from both locales presented very similar patterns which Figure 9 (below) represents in a composite plot against a generic ‘median’ hydrograph.
Figure 9: A unitless (log scaled) representation of spring 2014 hydrographs patterns in the Southern Mountains and Grand Mesa showing the observed runoff behavior in red, and a generic ‘median’ hydrograph for those locales in blue. CODOS site-specific webpages include actual spring 2014 hydrographs for the associated watersheds.
Like those observed farther north, rapid and erratic dust-enhanced (D3/D4) surges in runoff emanating from the San Juan Mountains and Grand Mesa in April and early May were equally quickly curtailed as spring storms delivered new snow and restored high albedo to the snowpack surface. The San Miguel River on the northwest corner of the San Juan Mountains and Surface Creek on the south side of Grand Mesa both experienced particularly spectacular ‘first’ surges in April. However, unlike those in the north, April and early May surges often reverted to below average flow levels. Further, later surges often reached only median flow levels, as low elevation snowcover was depleted. Eventually, after large storms in late April and early May, emergence of dust-on-snow event D8 in mid-May and its merger with underlying dust layers initiated a final surge to above-average peak flows on/about June 1 (later on Plateau Creek near Cameo, perhaps due to upstream storage), under quite high, dust-enhanced snowmelt rates.
Then, unlike the pattern discussed earlier, flows in these southern watersheds began a steady and early decline, as expected, to below-average levels for the remainder of June and into July, as very high snowmelt rates continued to deplete the remaining high elevation snowcover. This pattern was perhaps most severe in the Rio Grande and San Juan watersheds, where July 1 flows were at or below 50% of normal. In an important exception to the pattern, flows in the north-facing Uncompahgre maintained near-average levels throughout mid- and late-June, benefitting from the more nearly-average Peak SWE at Red Mountain Pass.
Conclusions and Acknowledgements
Water Year 2014 delivered a welcome return of substantial snowpacks to most of the state, aside from the persistently drier Southern mountains. The now-routine “dust season” of March, April, and May delivered ten dust-on-snow events. Although WY 2014 total dust deposition was not as heavy as in WY 2013, with its “maximum” intensity, a far-reaching and substantial event on May 11 (event D8) would play a major role in producing high or very high peak flows. Given the interplay of March 1 SWE conditions, dust intensity, and spring weather, spring 2014 snowmelt runoff was a prolonged process with early, dust-enhanced surges disrupted by several major winter storms in April and May frequently restoring high snowcover albedo.
Dust layer D8 finally emerged extensively at the snowcover surface in late May, dramatically and rapidly lowering snowcover albedo. Sustained dry and sunny weather enabled maximum absorption of solar energy in the snowcover surface, enhancing a surge in snowmelt rates and, in statewide synchronization, producing peak runoff flows on/about June 1, on or about the normal timing of peak flows. Benefitting from heavy alpine snowcover, descending limb flows equaled or exceeded median levels throughout June in the majority of mountain watersheds, despite continued reduced albedo from dust. In summary, despite receiving what has evolved as “average”, but still significant, amounts of dust in the snowcover, and producing very high peak flows, the Colorado snowmelt cycle traced a near-normal path and, except in the southern basins, was not as acutely compressed, in overall duration, as in prior years with comparable dust conditions but drier spring weather.
This summary report presents a variety of watershed scale summary data and observations for snowpack, weather, and hydrology for the greater Colorado mountain system, noting that finer scale supporting data for our Senator Beck Basin Study Area at Red Mountain Pass and ten additional sites are posted at their respective site-specific webpages. Links for all those sites are shown at the top of the CODOS program home page at http://www.codos.org.
CODOS is a stakeholder-funded program of the Center for Snow and Avalanche Studies based in Silverton, Colorado, and performed on behalf of Colorado and Colorado River Basin water management agencies. We thank our many funders for their WY 2014 support including the Colorado Water Conservation Board; the Colorado River, Southwestern, and Rio Grande Water Conservation Districts; the Upper Gunnison River, Tri-County, and Dolores Water Conservancy Districts; the City of Grand Junction and Denver Water; and the Bureau of Reclamation’s Lower Colorado Region and Eastern Colorado Area Office. A complete funding history for CODOS is presented on our website, at: http://www.codos.org/#funding .