SUMMARY
Going into August 2021 monsoon conditions were better than the previous year and offered a small amount of relief from the sweltering summer. Most of the eastern half of Colorado was drought free and the southwestern portion of the state had improved considerably. Starting the new water year drought conditions degraded in Eastern Colorado but the Western Slope improved slightly. October was mostly normal for the western third of Colorado but hot/dry for the eastern half. There were 3 notable storms in October, the second storm on October 12 provided enough snow that didn’t melt to mark the beginning of winter in the San Juan Mountains. November was a dud, very warm and dry, and best forgotten. December was generous with over 150% normal precipitation in the western half of the state but the eastern half still remained dry/hot. The opposite occurred in January where the West Slope was dry while the eastern side caught up a bit from the dry December. February was a big relief in terms of the temperature being normal to well below normal and the Front Range region continued to see plentiful precipitation, the San Juan’s made out about average, while the remainder of the mountain regions struggled. Going into spring, the month of March was normal to slightly below normal for temperature and precipitation was a mix of wetter conditions to the east and north west, and generally the rest of the mountains were mostly below normal. By the end of March, even with the stair-step snow accumulation we experienced to this point, in terms of water year totals Colorado wasn’t looking that bad. But then April and May came along and these two months were very particular about where precipitation occurred around the state - but generally favoring Northern Colorado . The only area with near normal precipitation in April was the North Platte while the rest of the state was anywhere from less than 2% - 75% of normal. May in the San Juan’s did not see a single storm and only 0.7” of precipitation. One particular storm starting on the 18th that gave a big boost to most of Eastern CO including the South Platte and Arkansas Basins and pushed the rapidly ablating snowpack more towards a near normal time-frame for full melt out – going by SNOTEL data in these basins.
Besides precipitation there were a number of other factors at play, notably the massive amounts of dust deposition onto the snowpack throughout the winter season. Eleven dust events were documented throughout the snow season and many of these were very significant events. Dust-on-snow (DOS) events occurred on; December 26, February 21, March 4, March 31, April 11, April 20, April 22, May 1, May 2, May 7, and May 8. We declared a high (or “max”) dust severity in early spring, giving water mangers and forecasters ample time to account for this dominant forcing variable in their water supply and timing estimates. The Colorado Dust-on-Snow Program (codos.org) have not declared a severe DOS season since WY2013 and since that time climate extremes and uncertainty have intensified, ergo even though we had a very good idea how dust enhanced snowmelt would unfold we expected events in some areas to play out as we have never seen before - and that turned out to be the case.
The impetuous for so many, and so intense, dust events were the frequent and record high winds throughout the snow season. Over half of the documented dust events took place in April and May, which were the two windiest months in our period of record. Our observations at Red Mt Pass were not unique, the Colorado Climate Center did an analysis and found this to be the case throughout most of Colorado. Springtime air temperatures were warmer than normal but not overly so, but the persistent warm and dry air masses being pushed around by the very frequent high winds, the lack of spring precipitation in Central/Southern Colorado, and the severe exposed dust-on-snow intensifying absorption of solar radiation, didn’t give the snowpack a chance. All of these factors meant a rapid ablation of the snowpack, both in terms of melt and sublimation.
MONTHLY WEATHER CONDITIONS
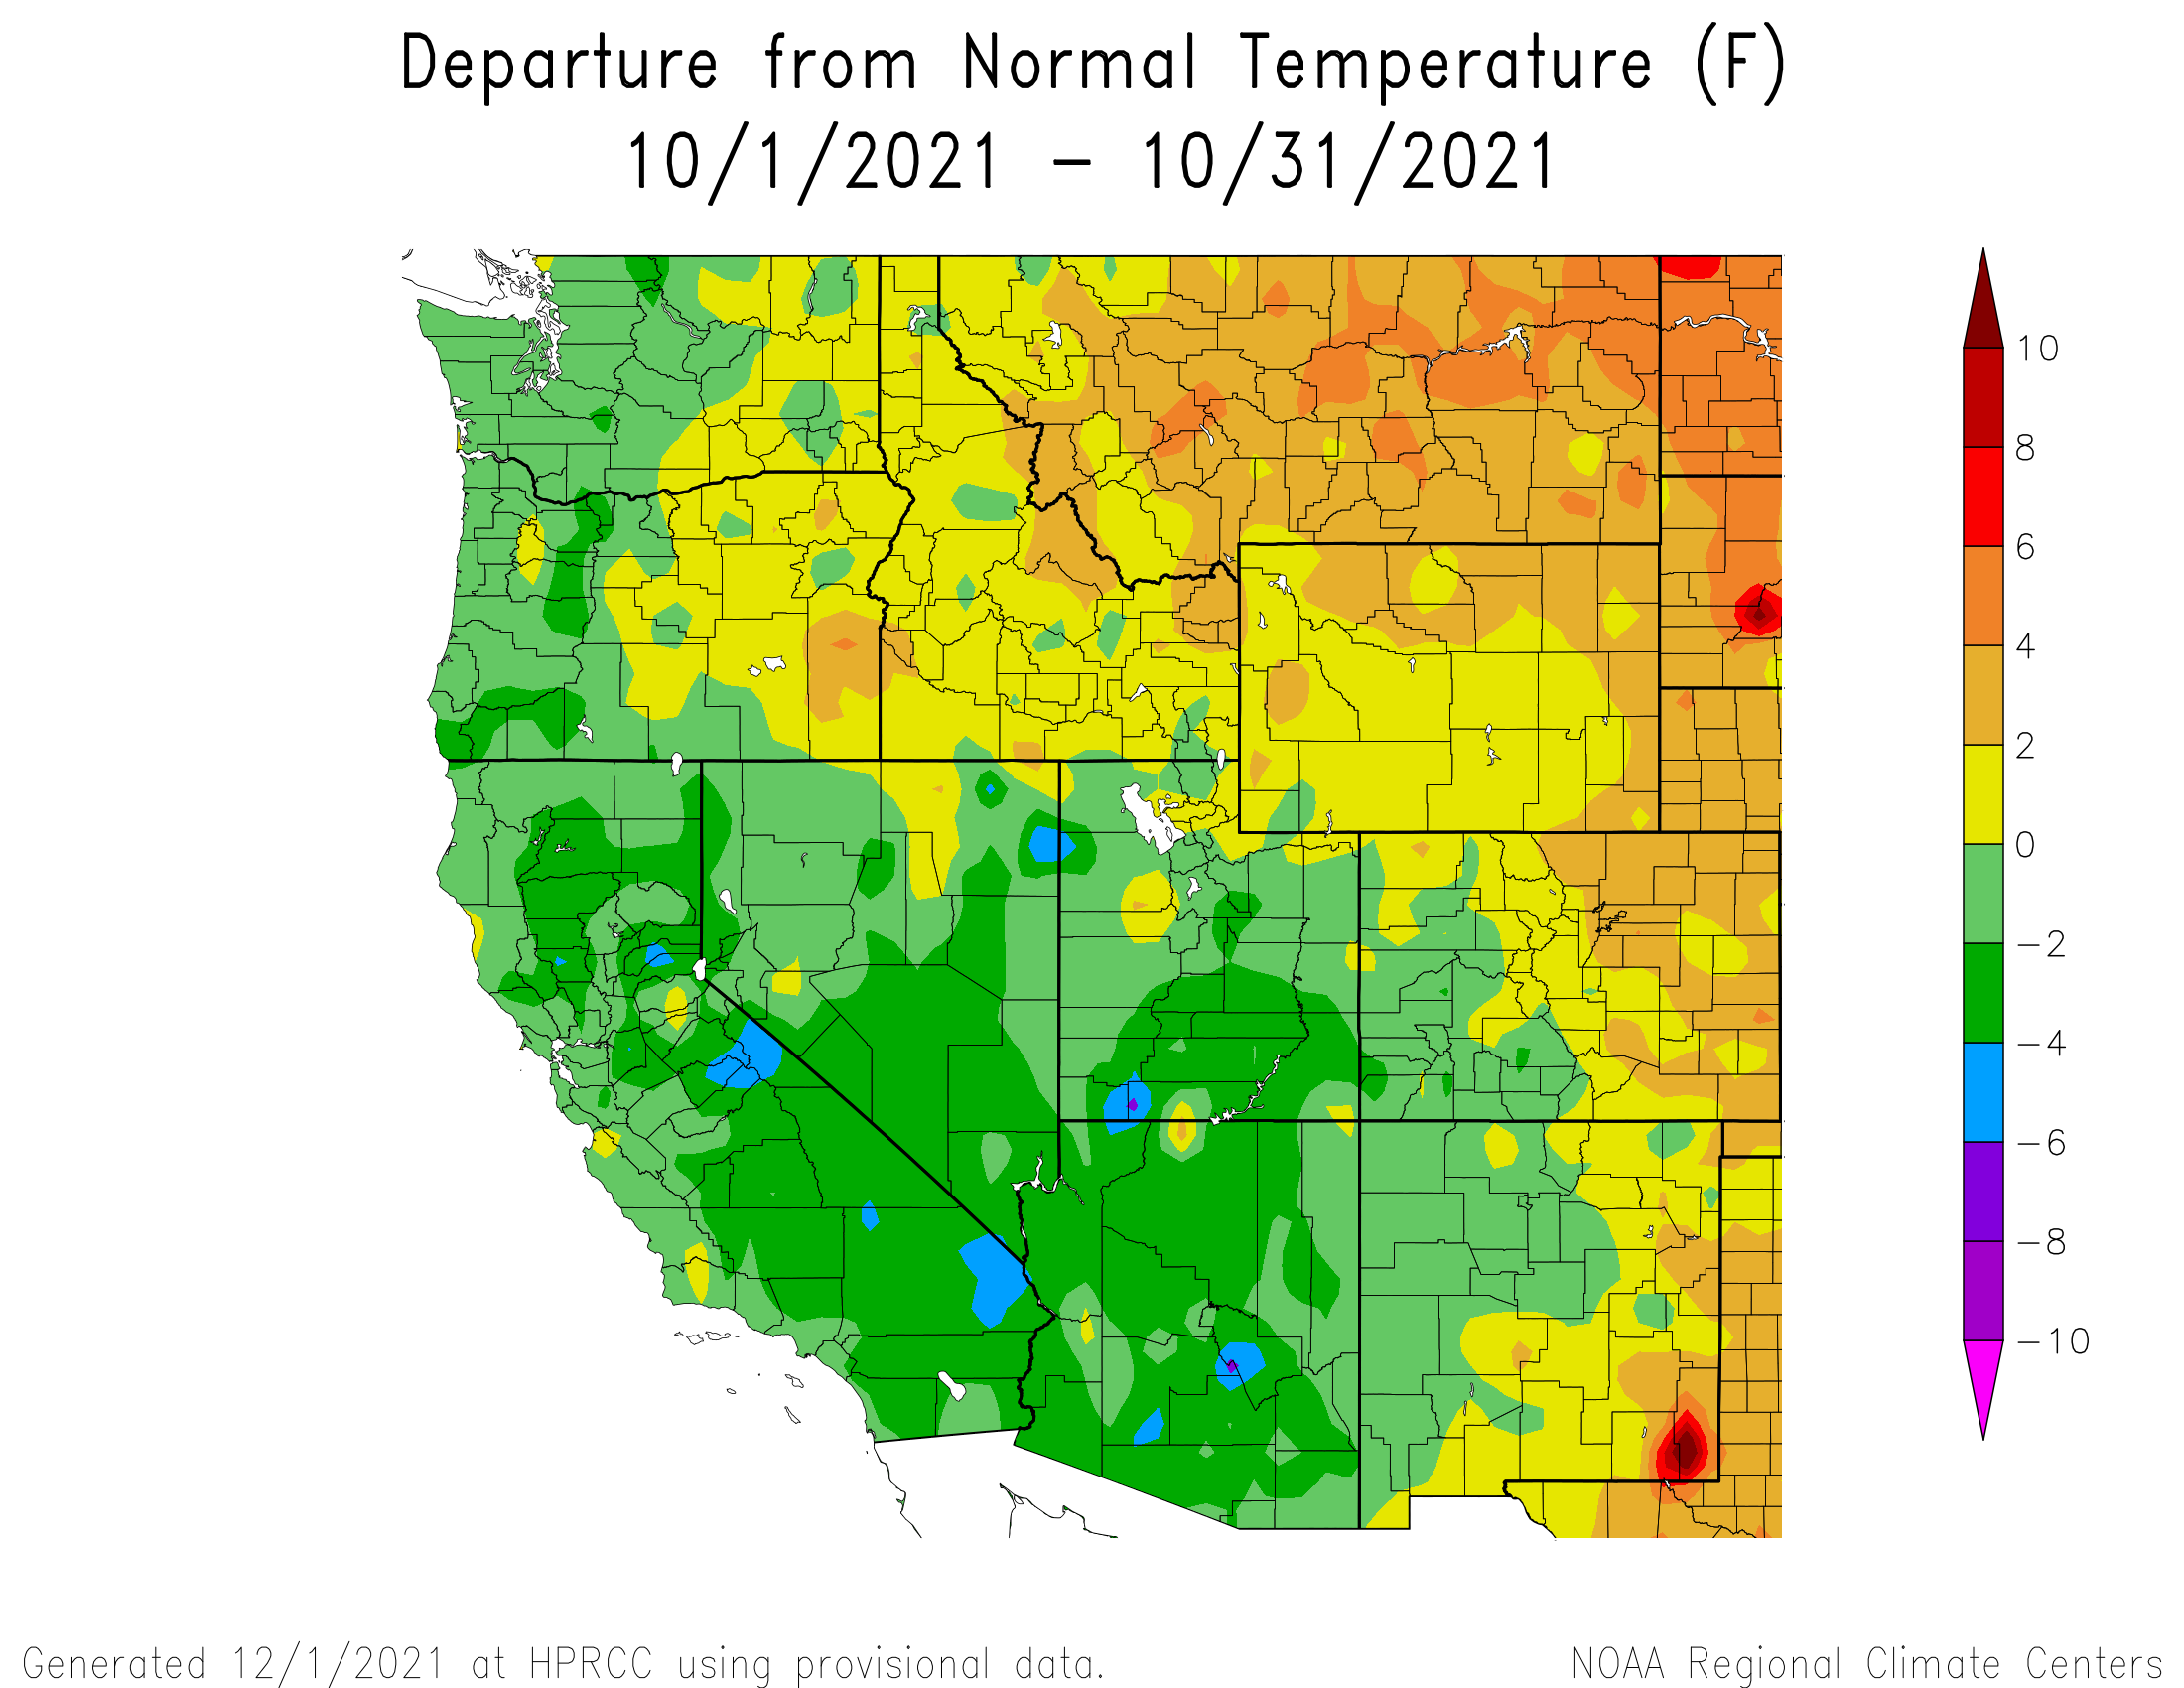
October Weather Summary
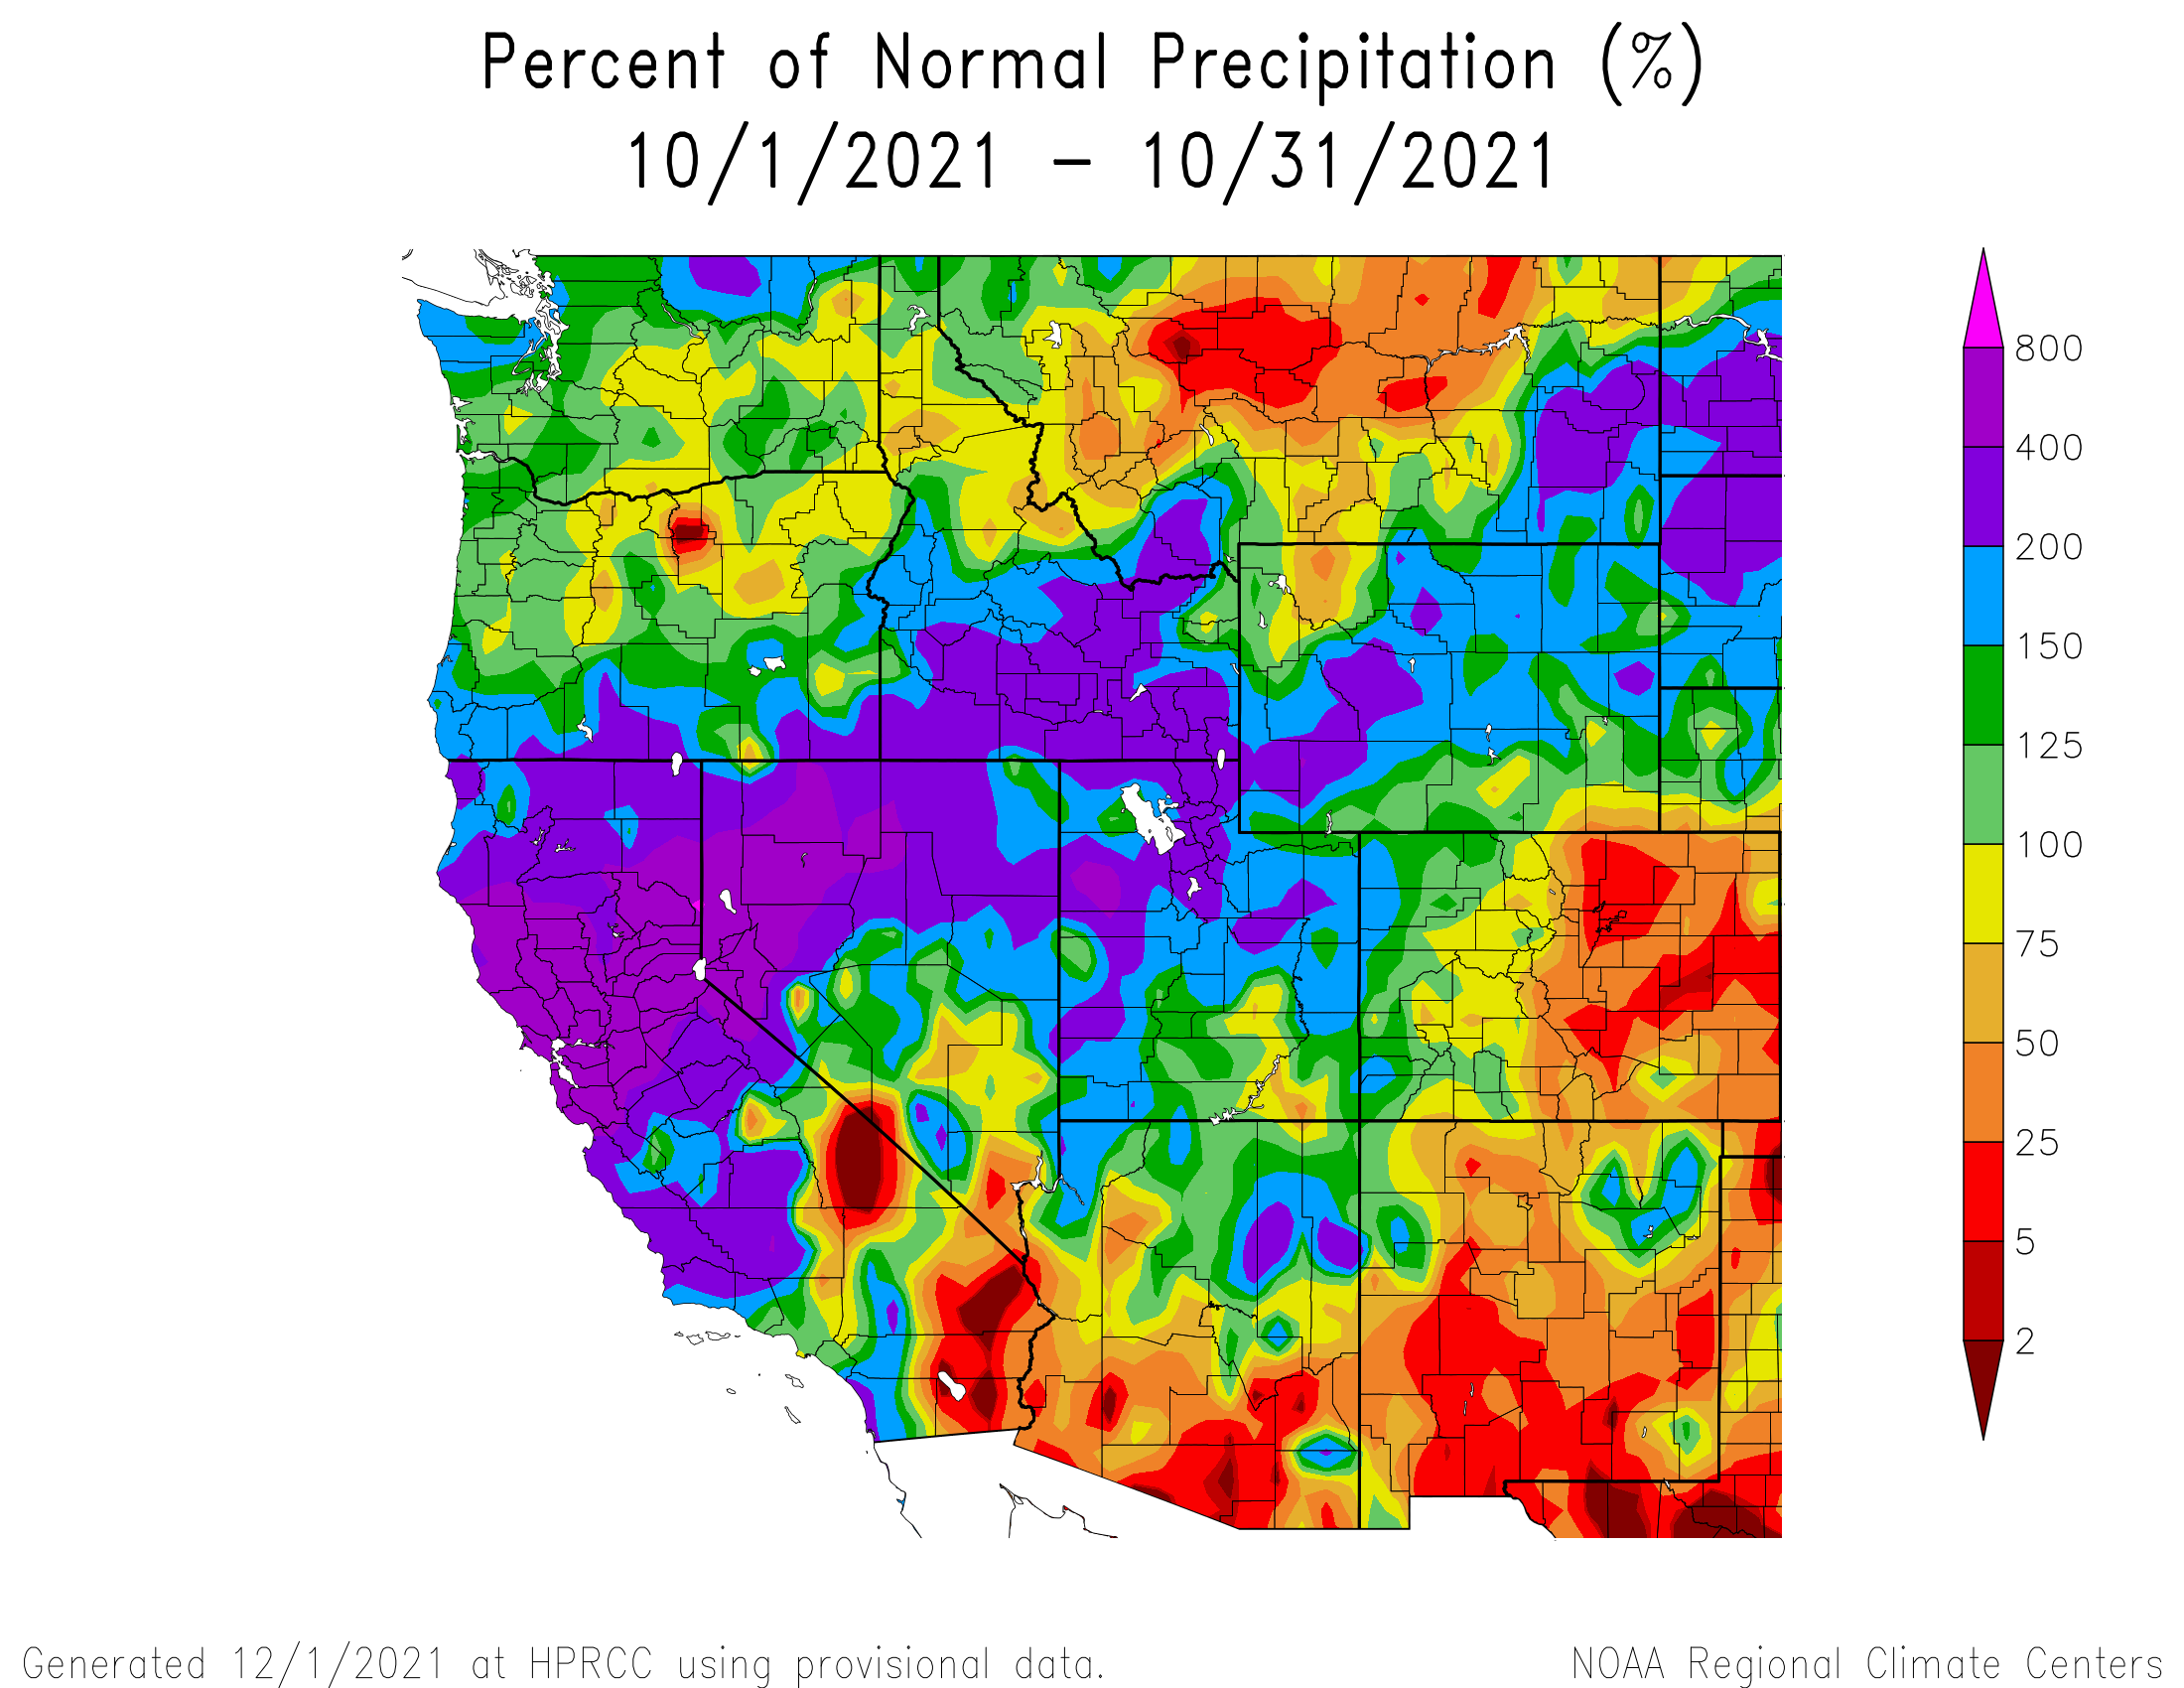
The month of October we experienced 13 days with recorded precipitation. The first few days of October, while the USGS snow station was being installed at Senator Beck Study Plot, a wet snow storm hit the high country, but this soon largely ablated. On October 12 the San Juan’s saw a big snow storm that made one think it was mid-winter. It made a mess for drivers on Red Mountain Pass and even a bigger problem for Wolf Creek Pass. It was this storm that initiated the snow cover that would mark the beginning of winter in the San Juan Mountains. Another nice storm delivered a bit over an inch of water on October 26. As a whole the western third of Colorado was near normal precipitation and slightly cooler for the month, but hot and very dry for the eastern half of the state.
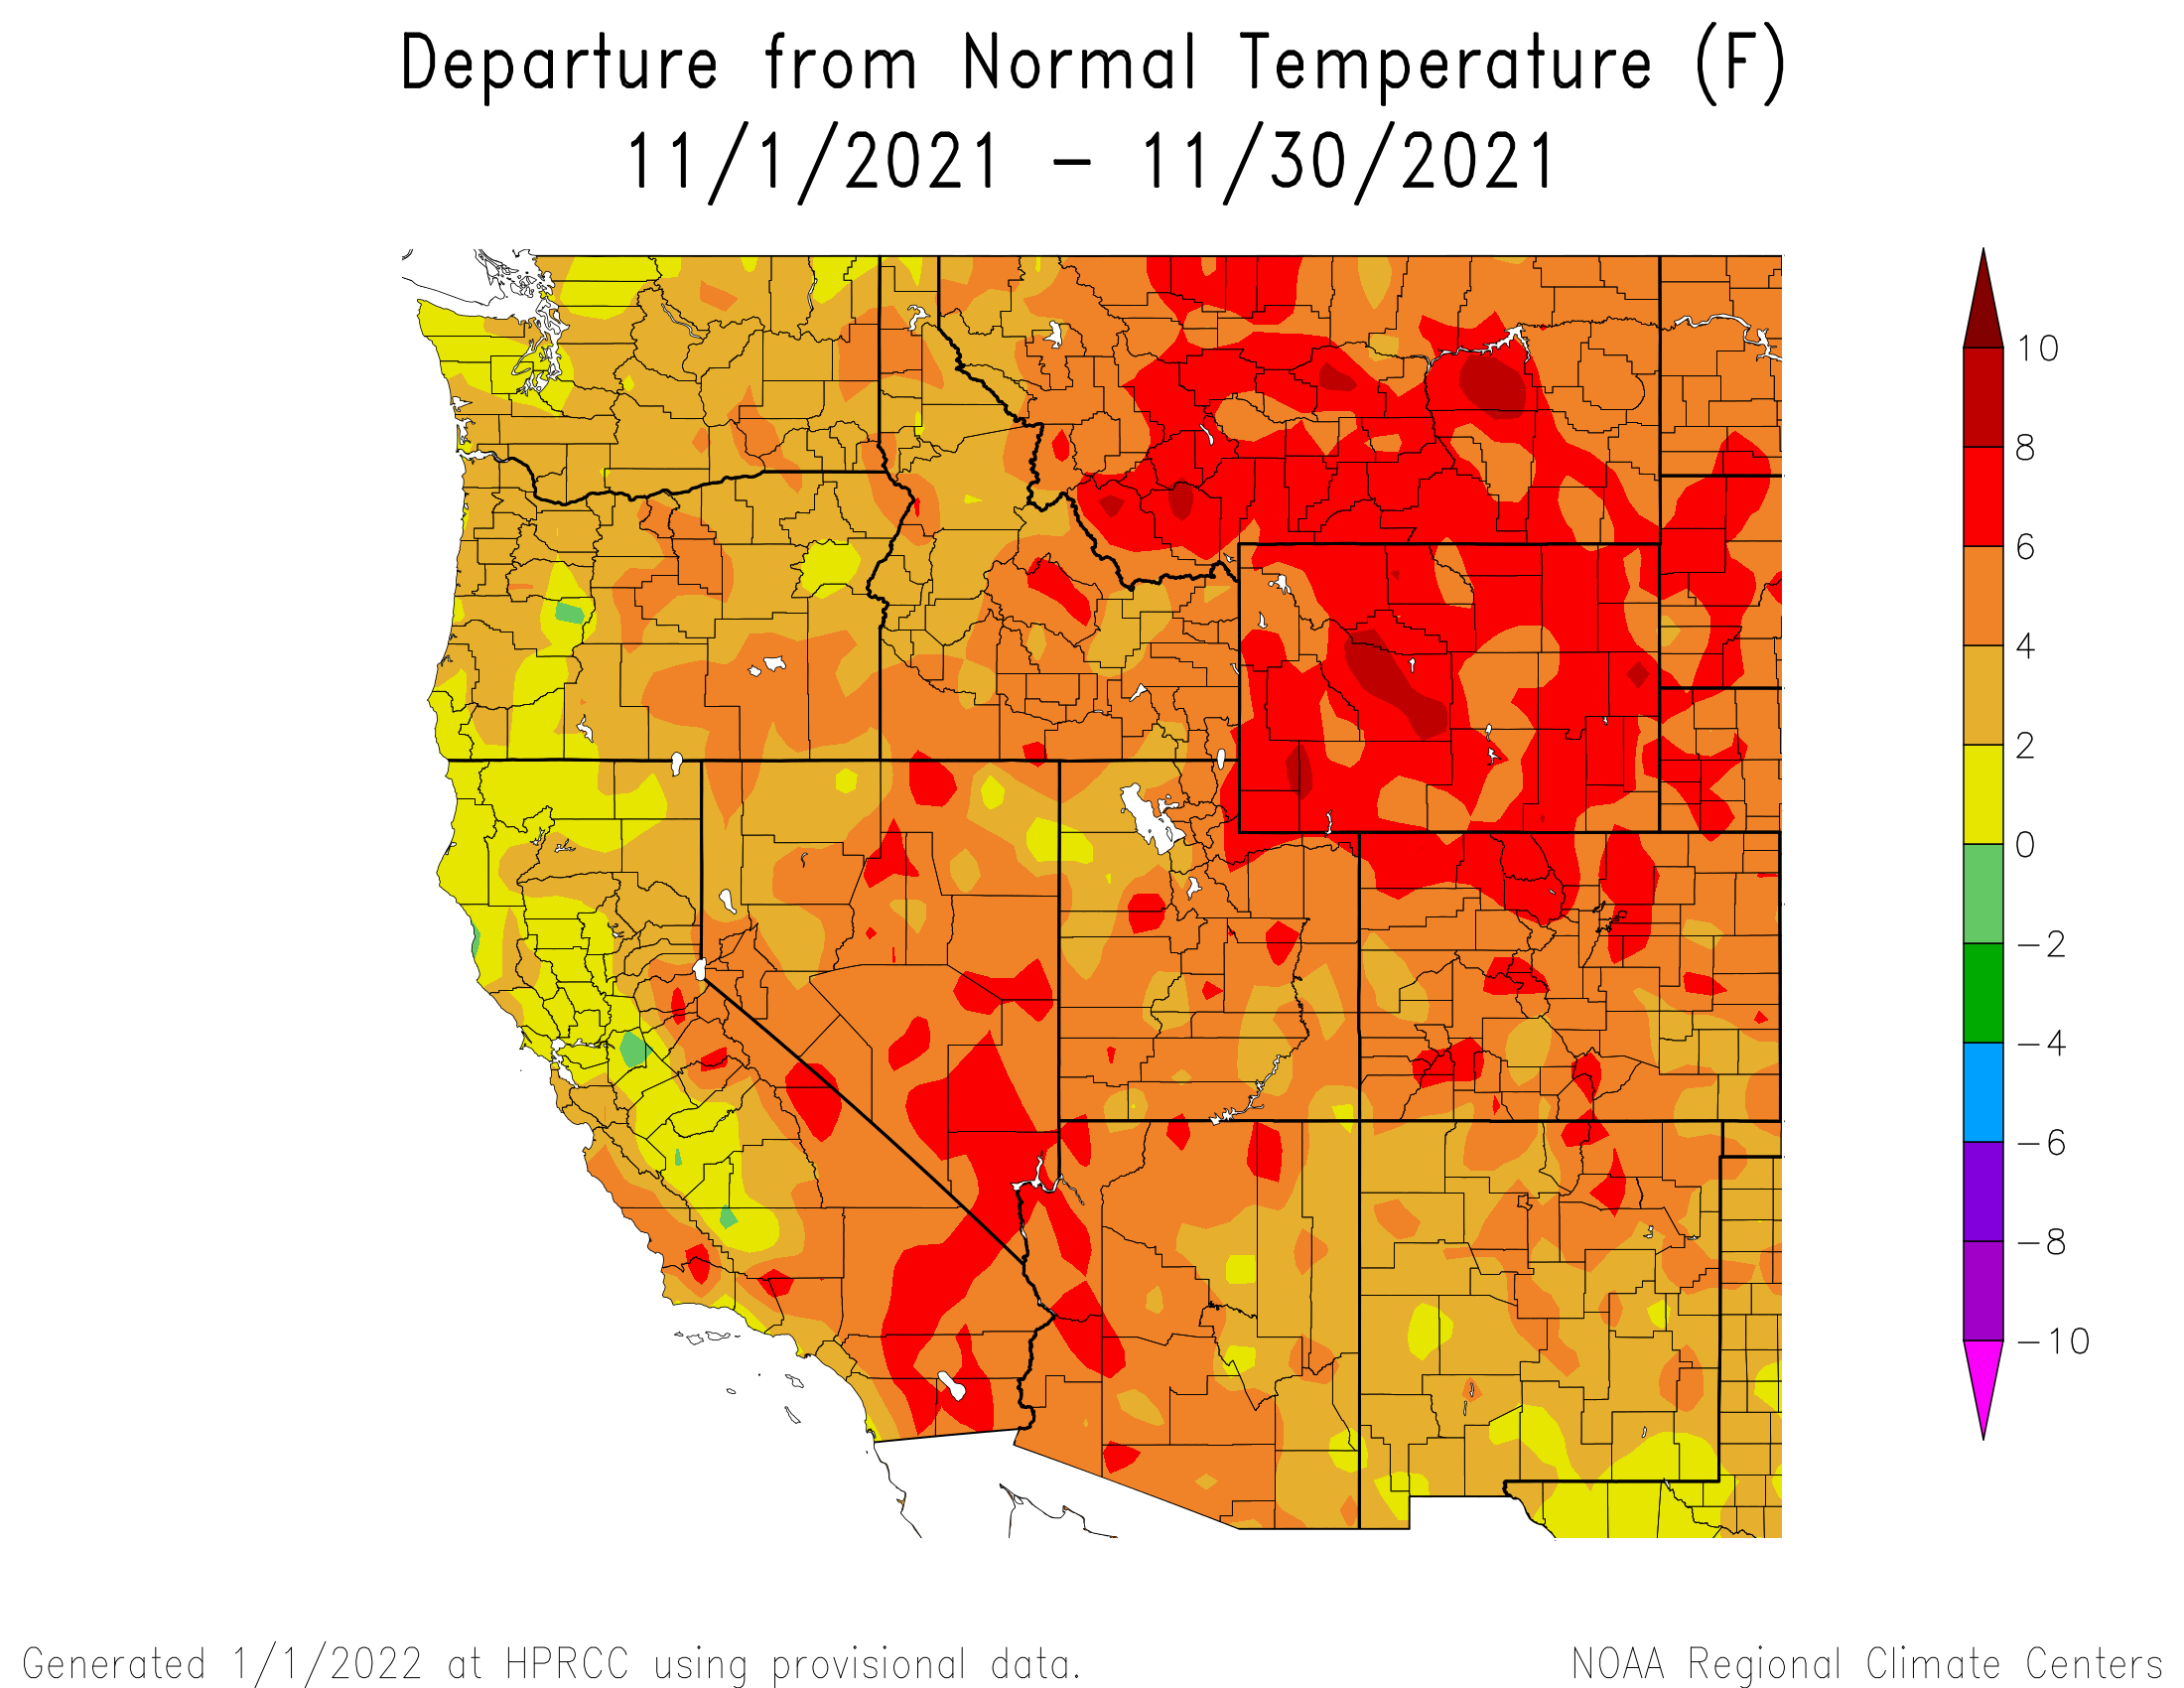
November Weather Summary
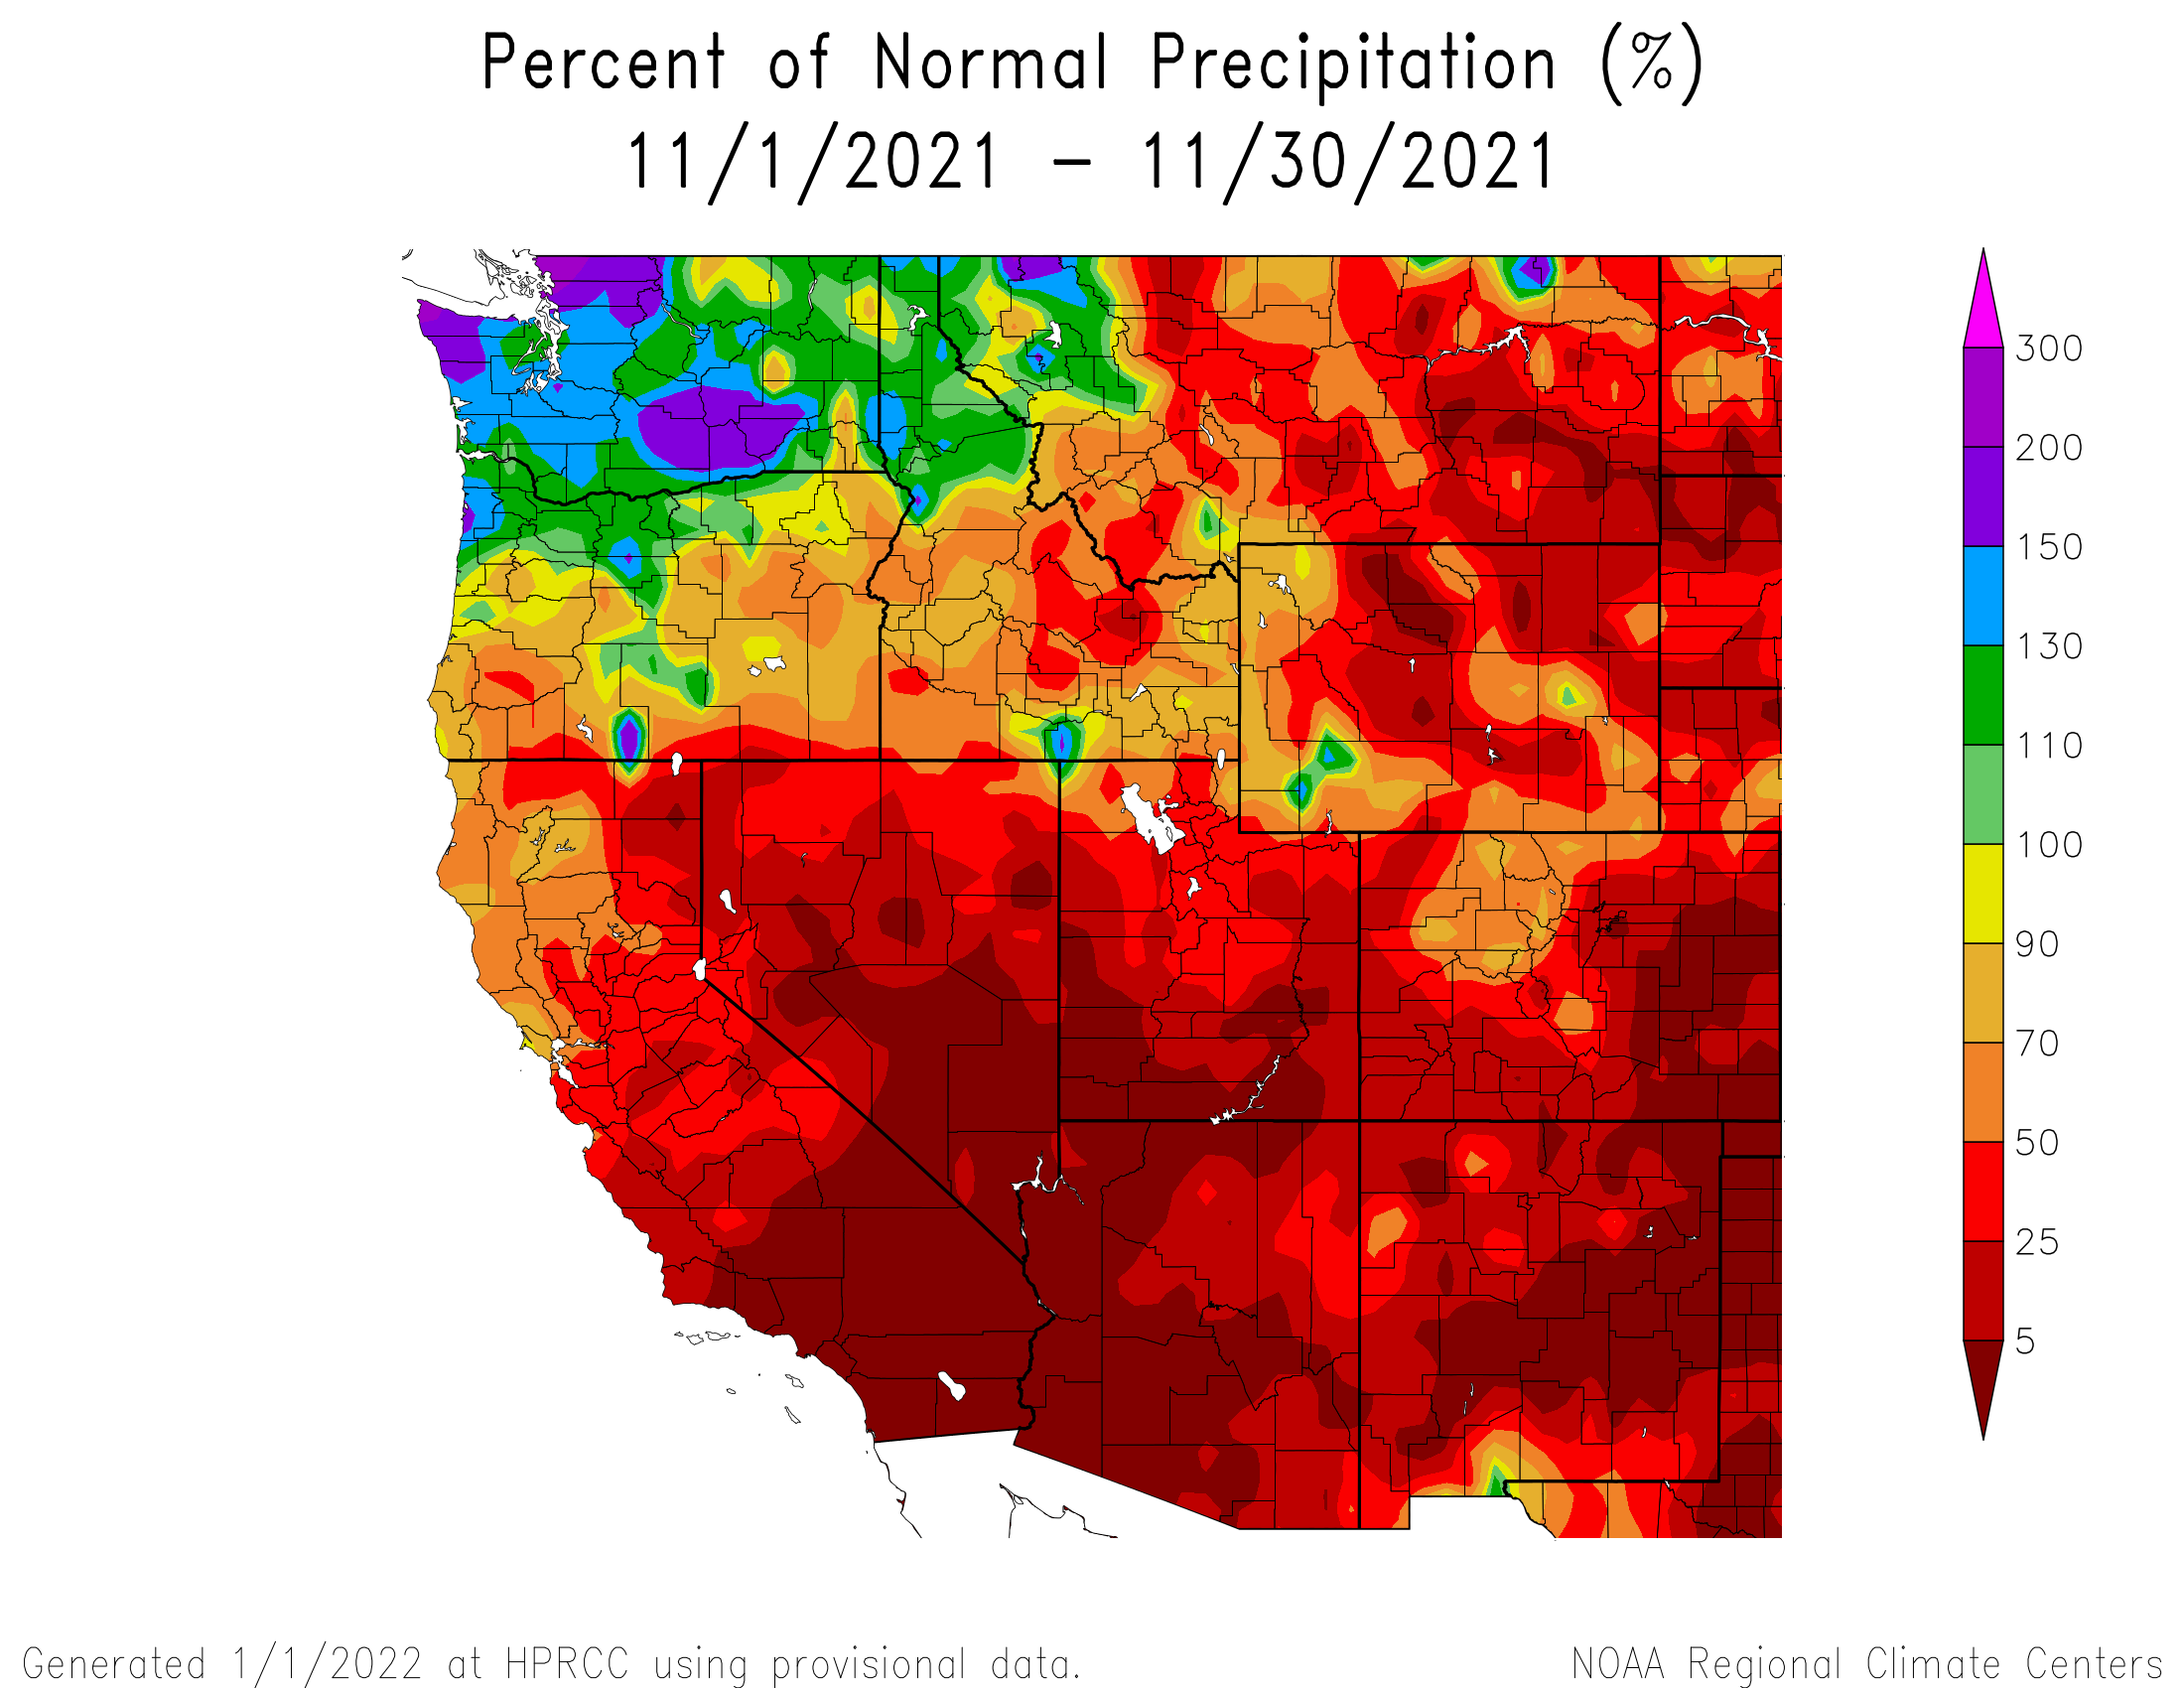
November was hot and very dry throughout the state. The one mentionable precipitation event was on November 10 that delivered 0.5” of water. Snow cover diminished throughout the long and hot month making it difficult to travel in the backcountry as there was not enough snow to ski but too much snow to prevent hiking.
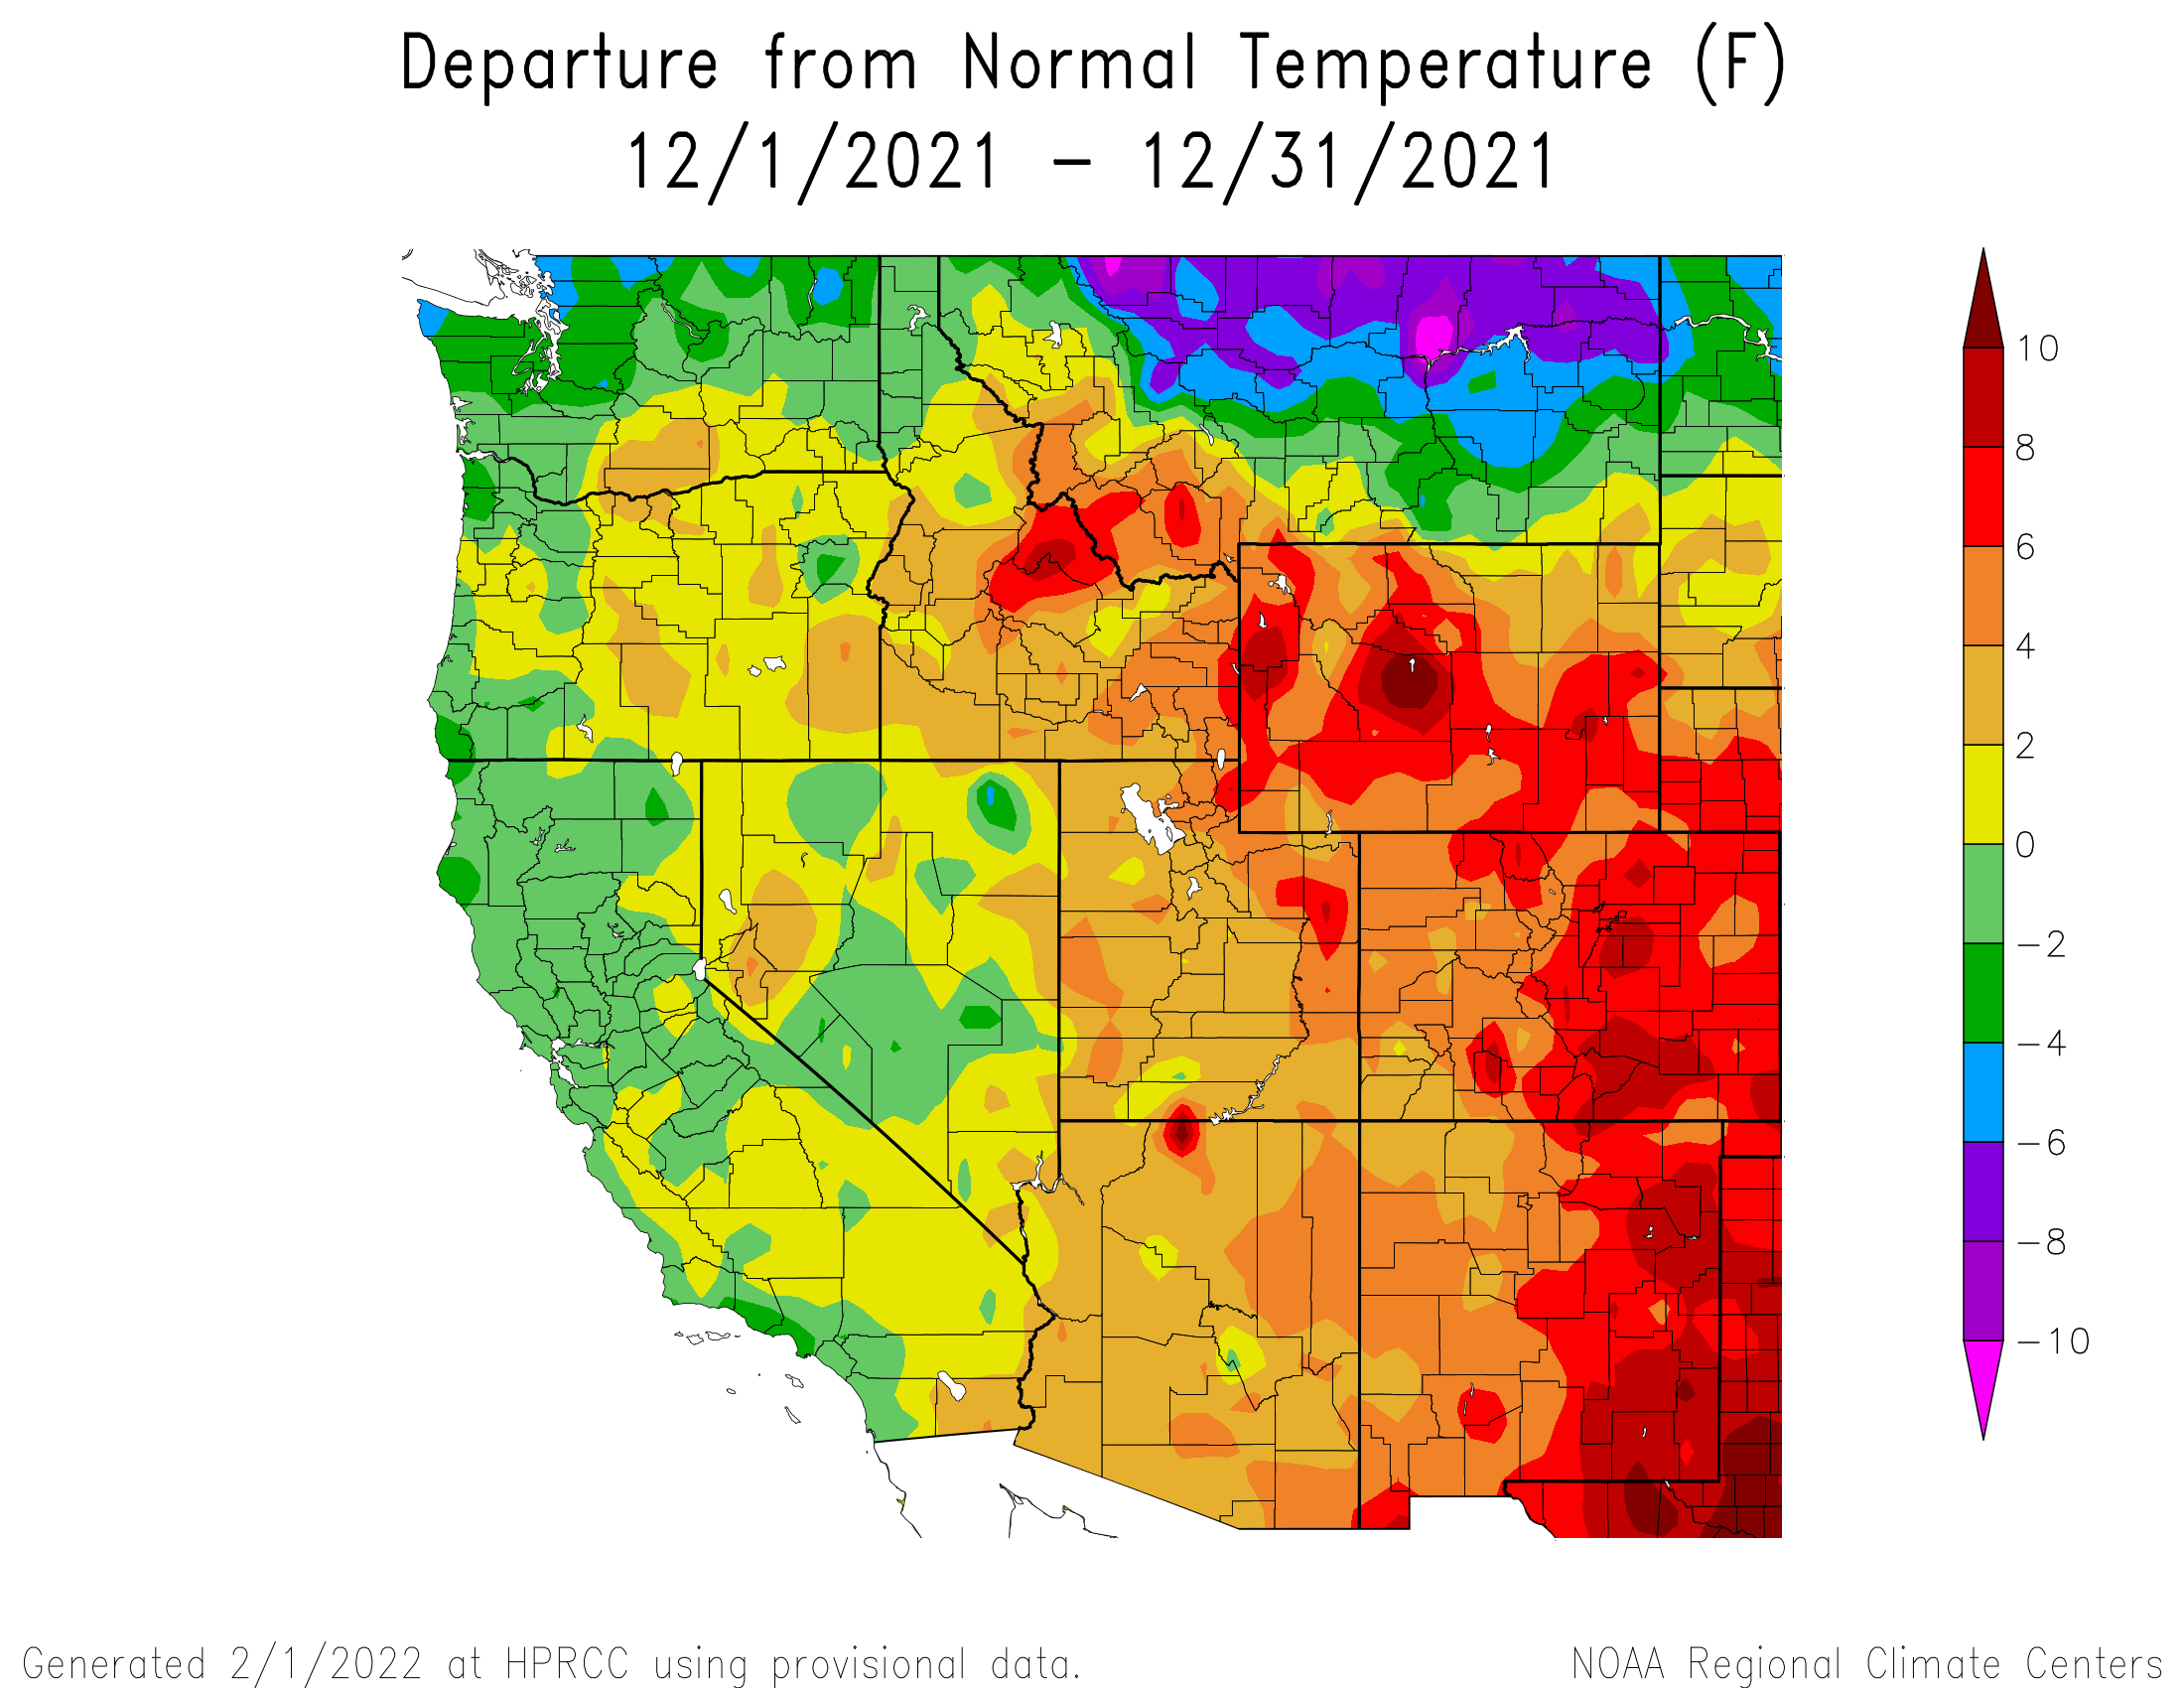
December Weather Summary
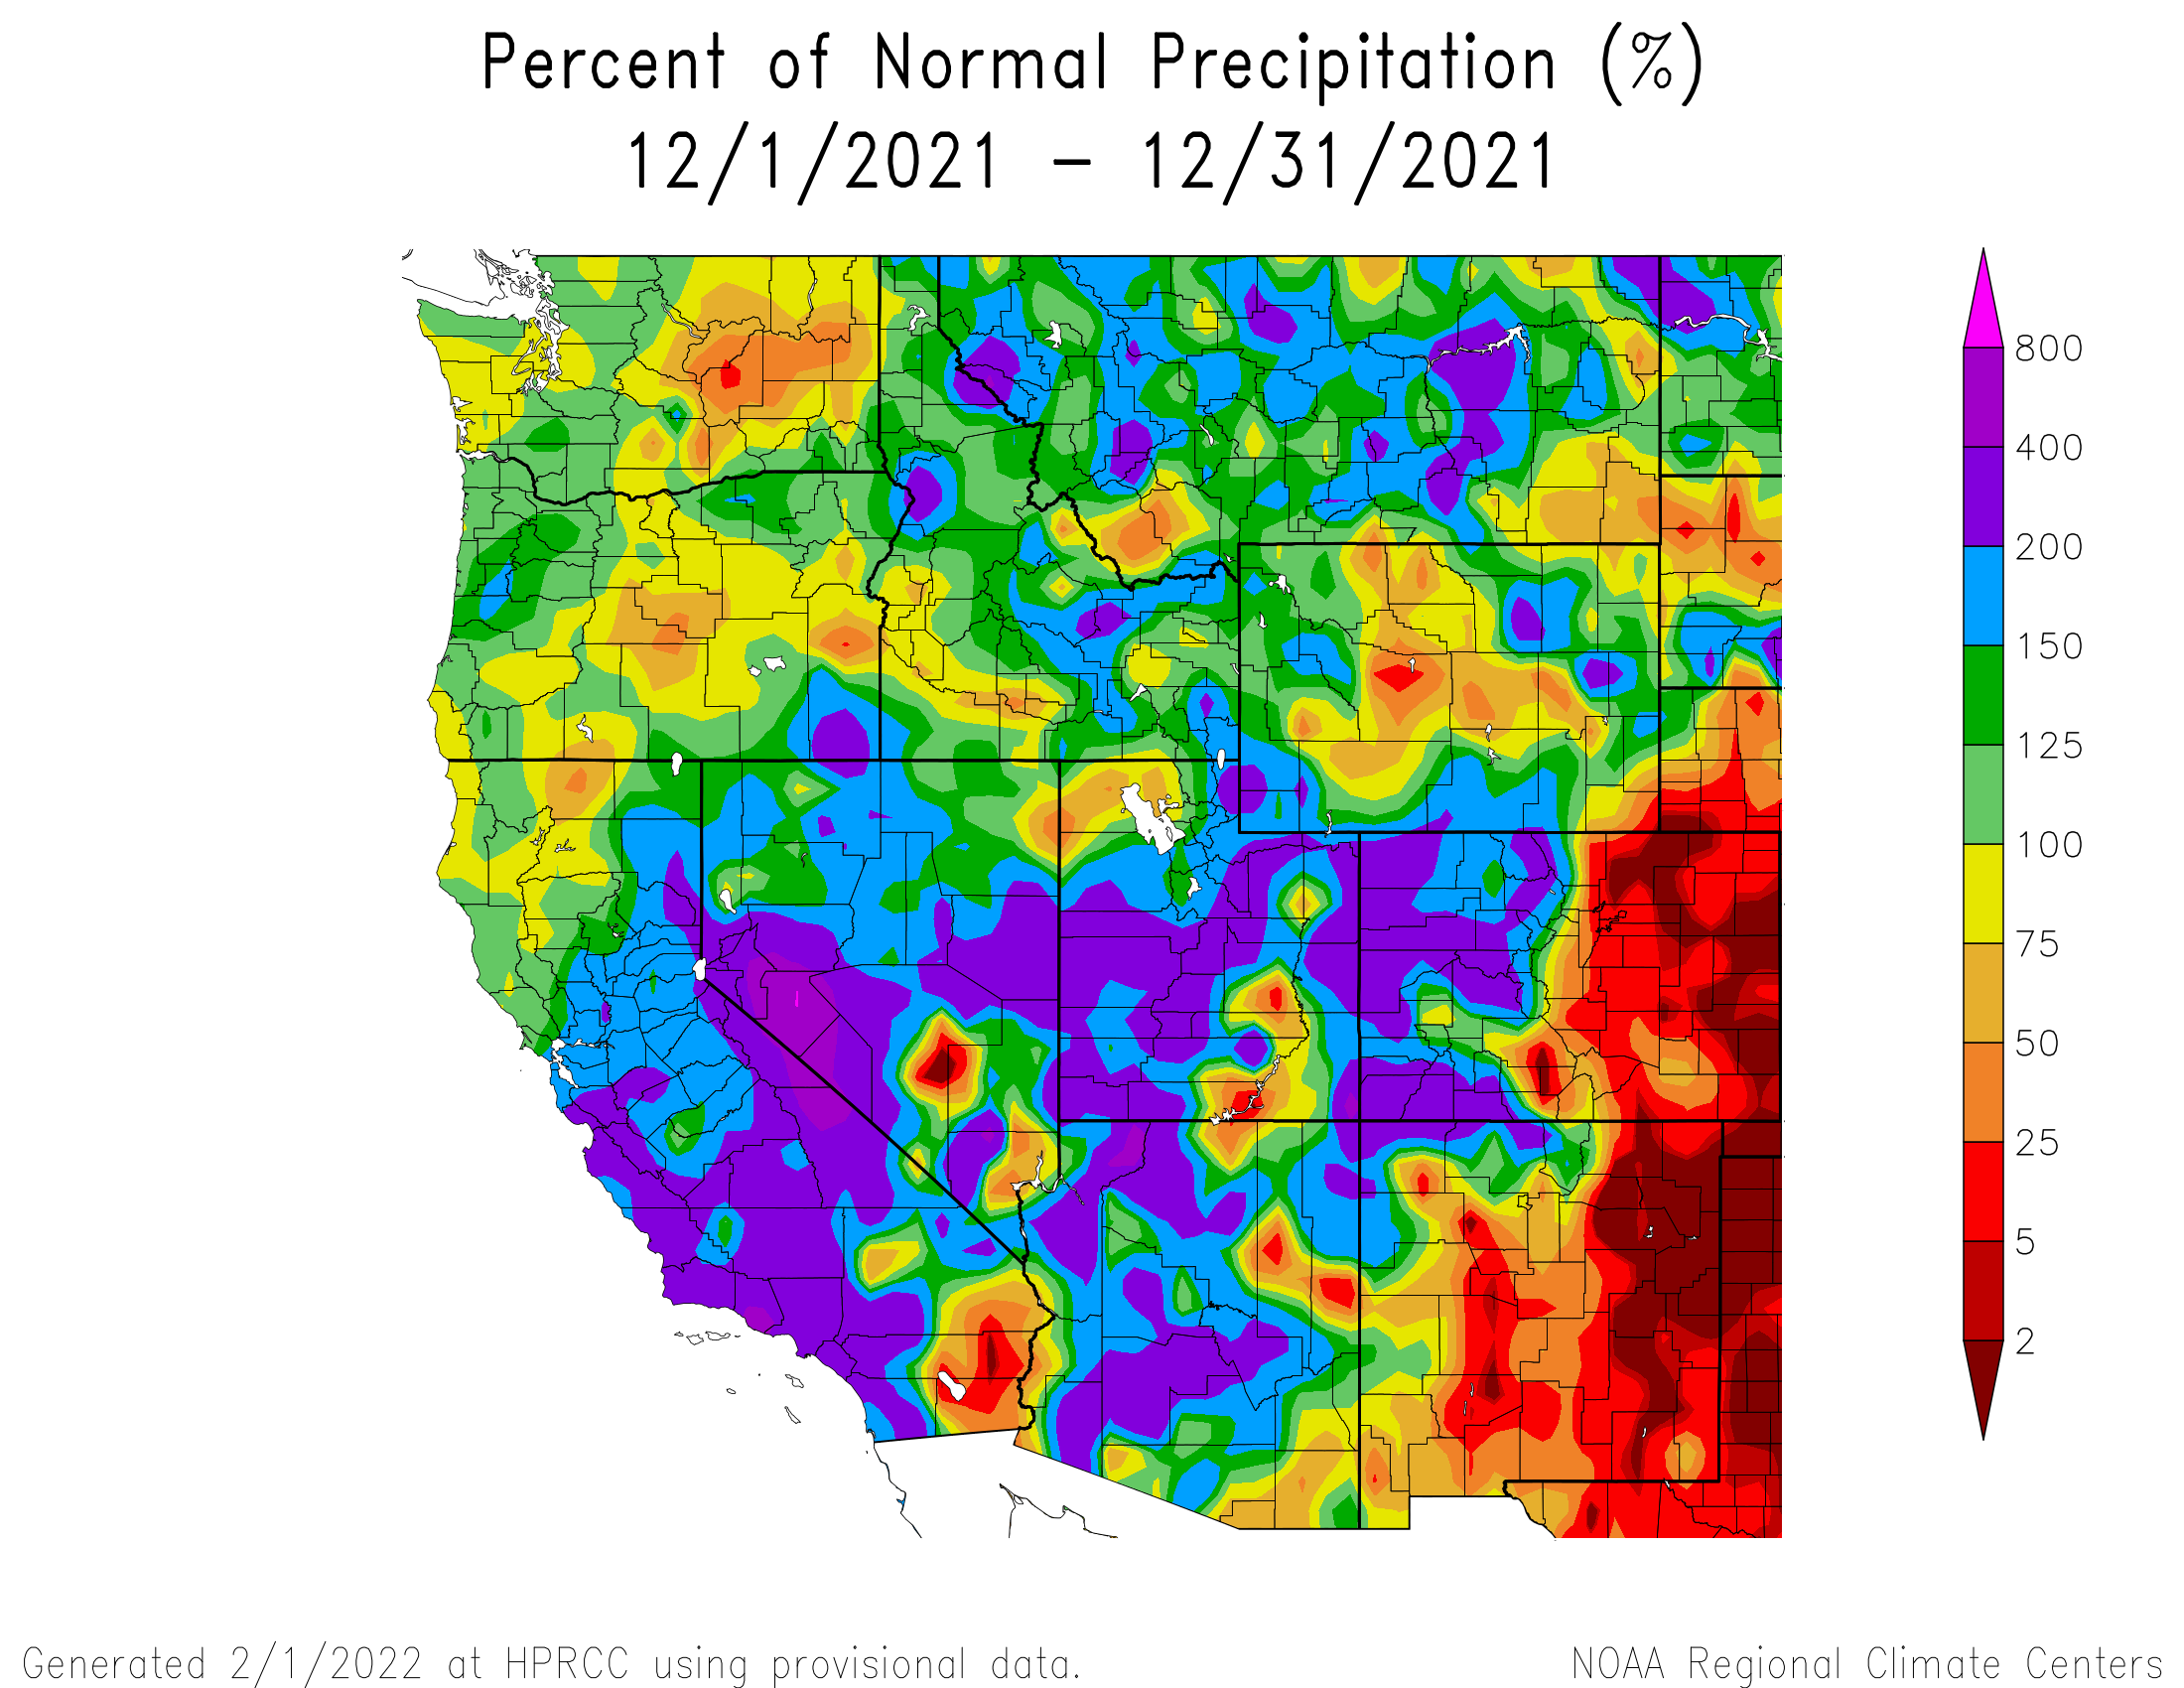
The Eastern half of Colorado was again very hot and very dry. Fortunately at least, Western Colorado was very wet, 200%-300% of normal for many locales. In December we issued 5 storm reports, defined as at least 0.5” of precipitation with no break in precipitation longer than 12 hours. The first two storms occurred Dec. 6-11 that delivered 2.7” of water as 1.6’ of snow. This really jump started the snowpack particularly at mid and lower elevations. The next storm, Dec 14-16, brought 70-107 mph winds at our Putney station and dust was kicked up in Southeast Colorado and swept into Kansas, Nebraska, Minnesota and Great Lakes. Storm #4 from Dec 23-26 brought dust to the San Juan Mountain snowpack, but we did not observe it farther north, such as Hoosier Pass and Berthoud Pass. Storm #5, Dec. 28-Jan. 1, ended the very productive cycle that initiated Dec. 6, and cumulatively, left the snowpack at upwards of 150% of median levels. Which was wonderful because for the next 7 weeks Colorado sat under a high pressure ridge and the snowpack flat lined.
January Weather Summary
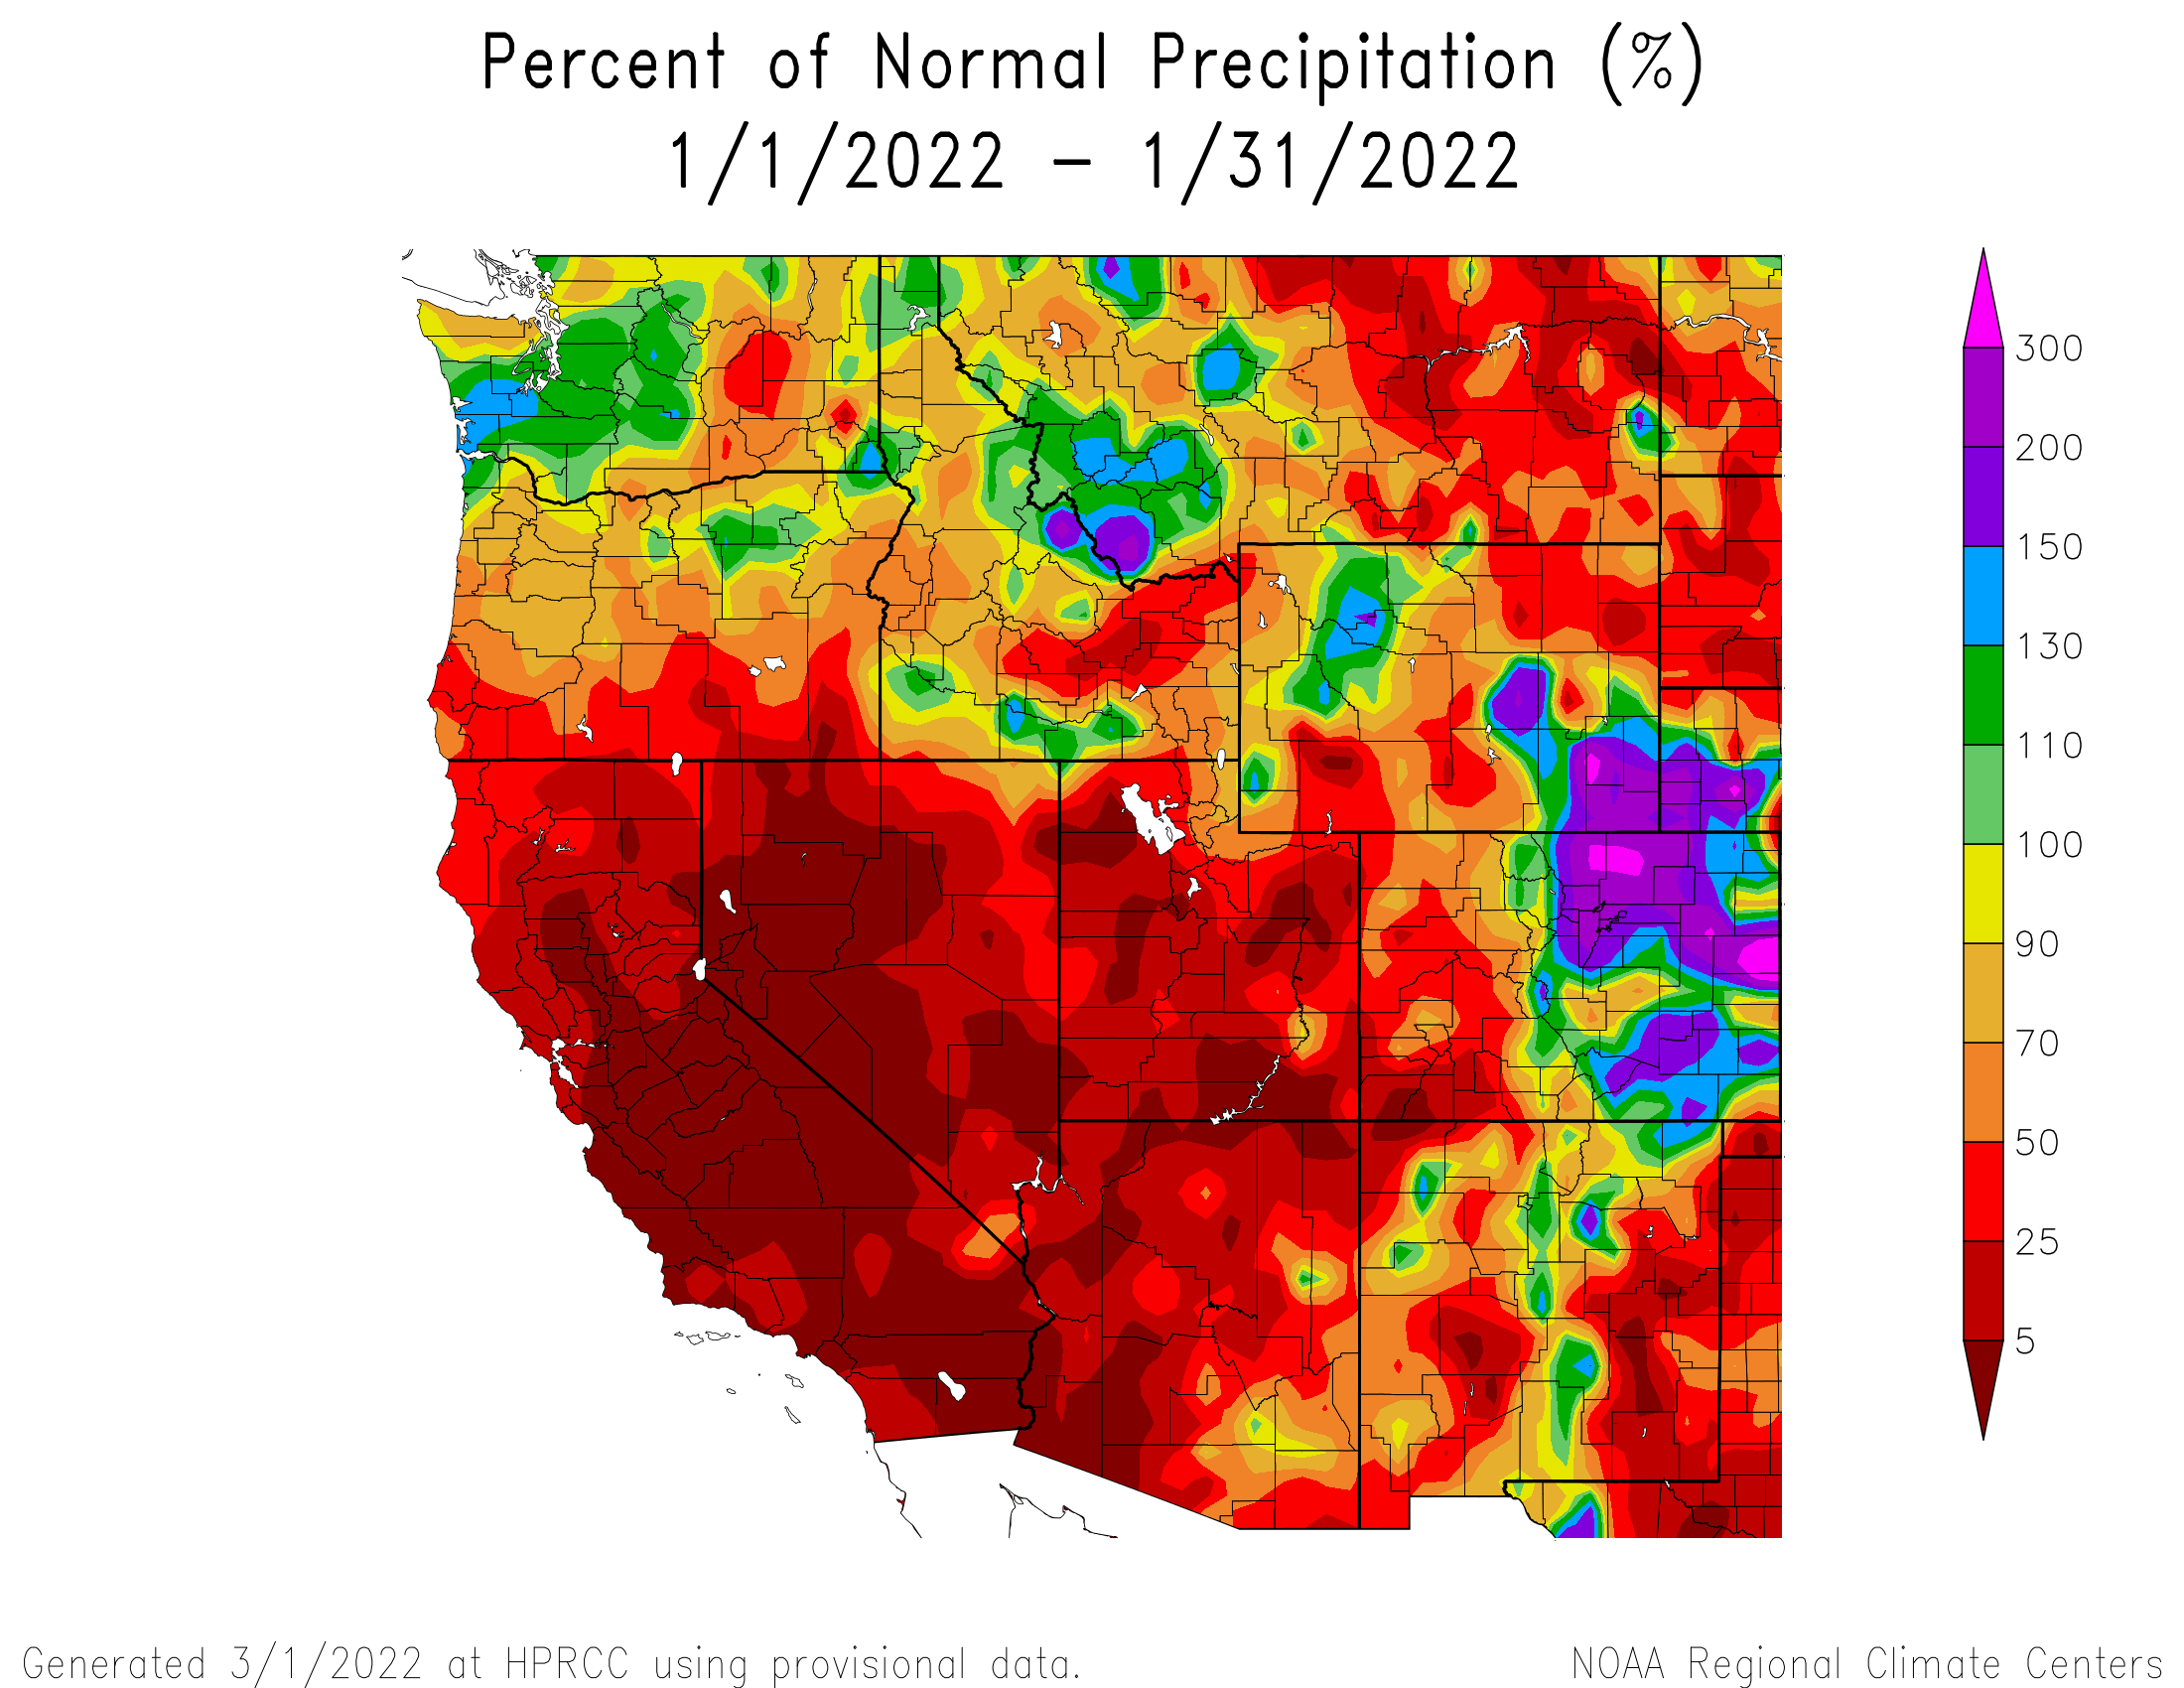
Western Colorado was very dry for January, about 10 days with precip but only a scant amount each occurrence. Swamp Angel recorded 2.7” precipitation for the month and no official storms. Fortunately temperatures were somewhat near normal, albeit a little warmer towards the southern mountains. Fortunately as well, the Front Range received a good bit of snow this month that has helped lessen drought conditions to the east.
February Weather Summary
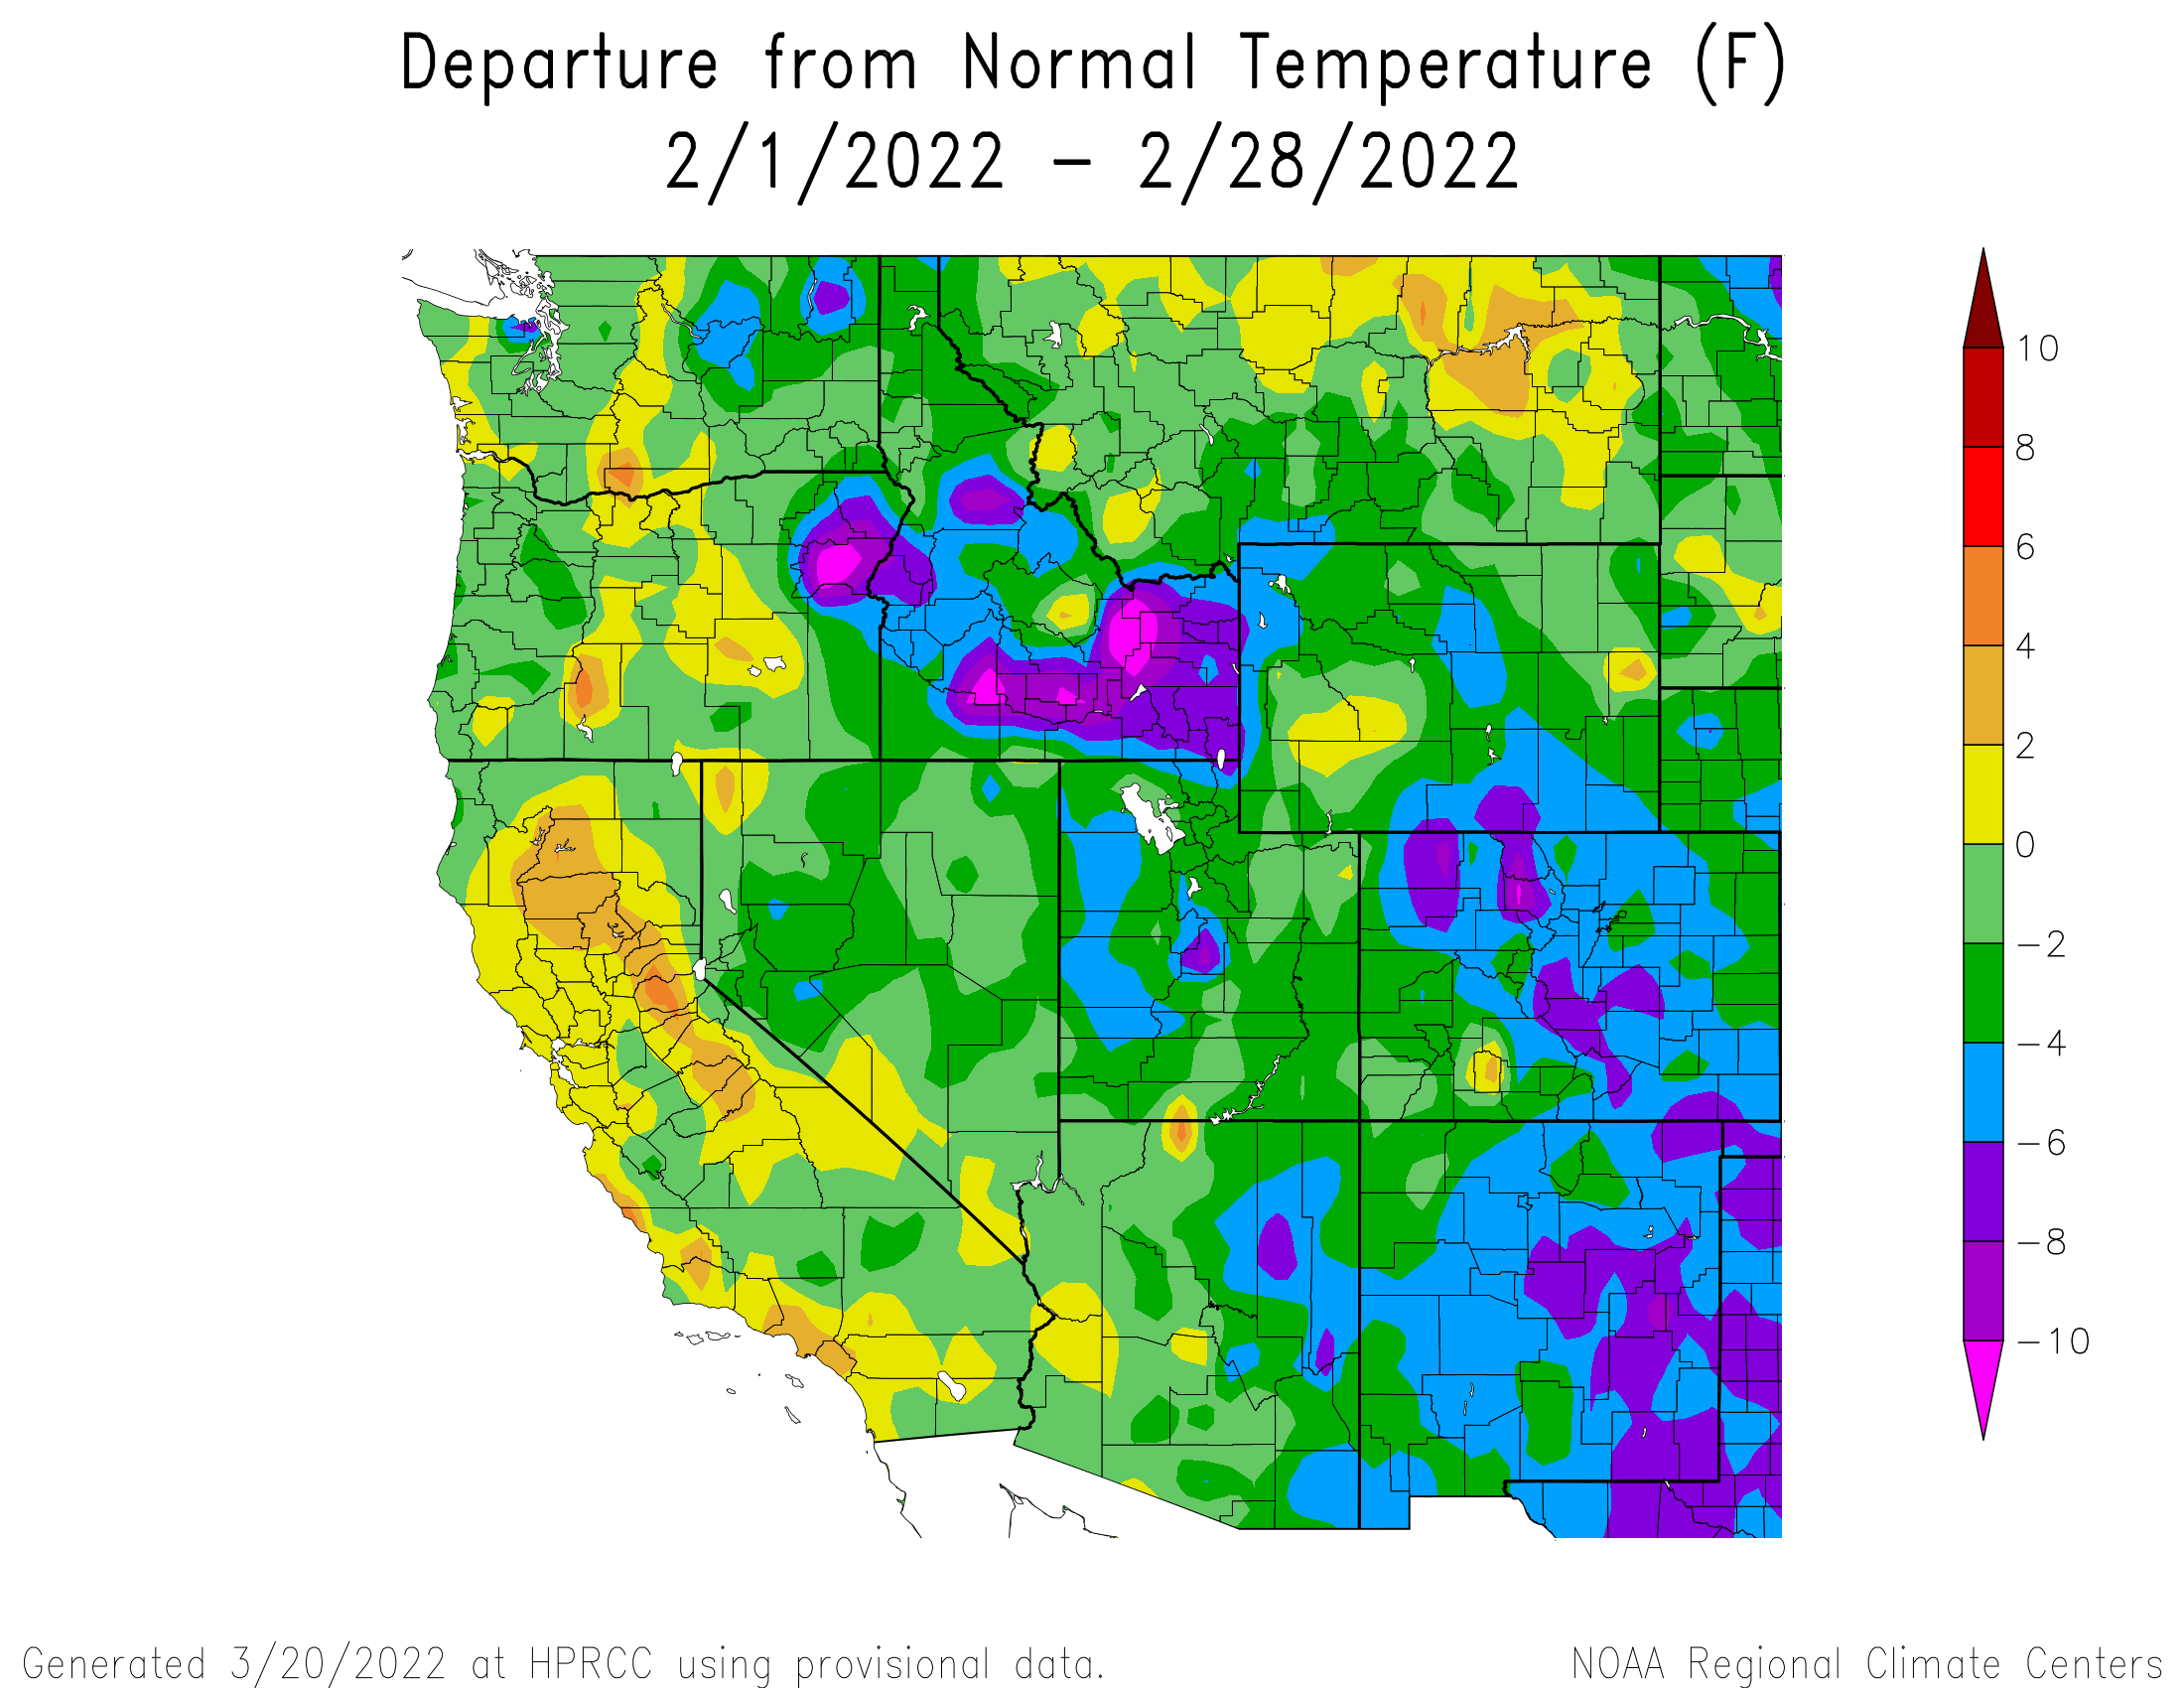
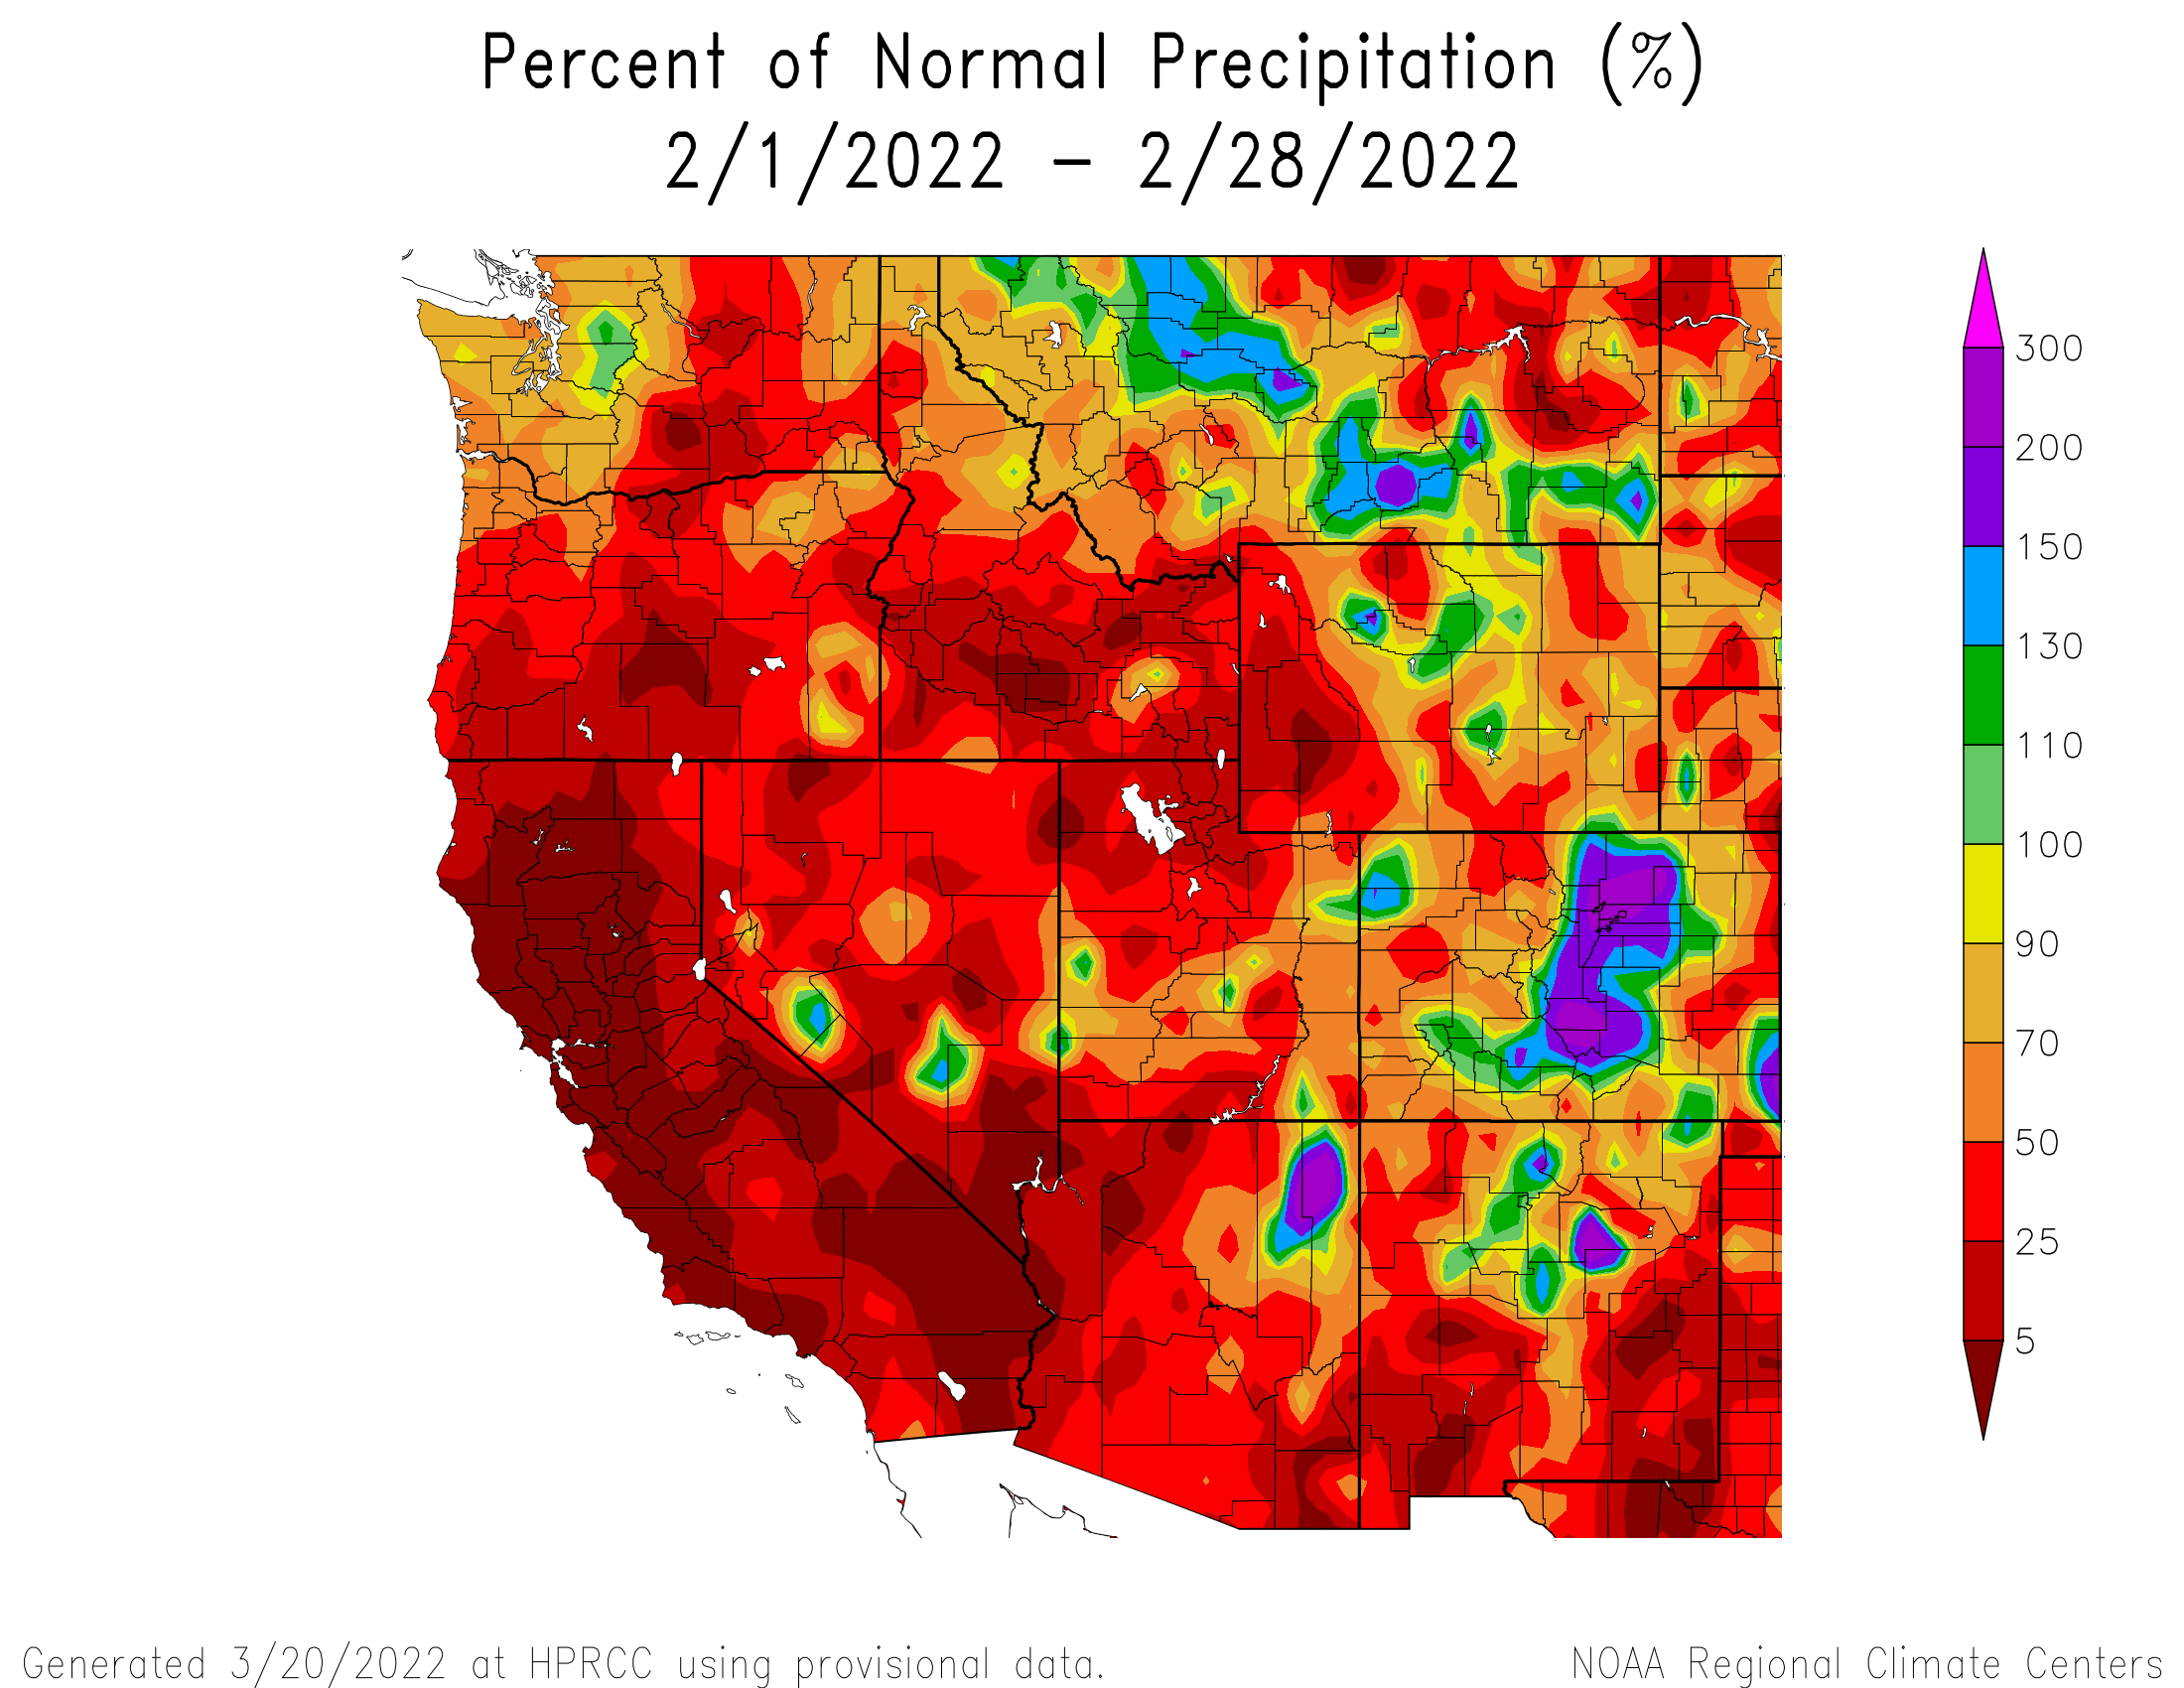
The first half of February was equally uneventful and warm. Mid-month we saw the persistent ridge break down and a system moved through Feb 16. It was 1 mm short of being considered a storm in our record books but a welcome 0.4” precip nonetheless. The real news worthy storm (storm #6) came in two waves from Feb 21-24 hitting northern to southern Colorado, with the San Juan’s lucking out as the largest benefactor as we observed 3” precipitation in the gauge (but measured 5” new SWE on the ground). Storm #6 really boosted the snowpack into gear, much like the string of storms in December. On this storm front came a wave of dust that hit the San Juan snowpack severely as well as deposited a layer of significant dust at least as far north as Eagle County.
March Weather Summary
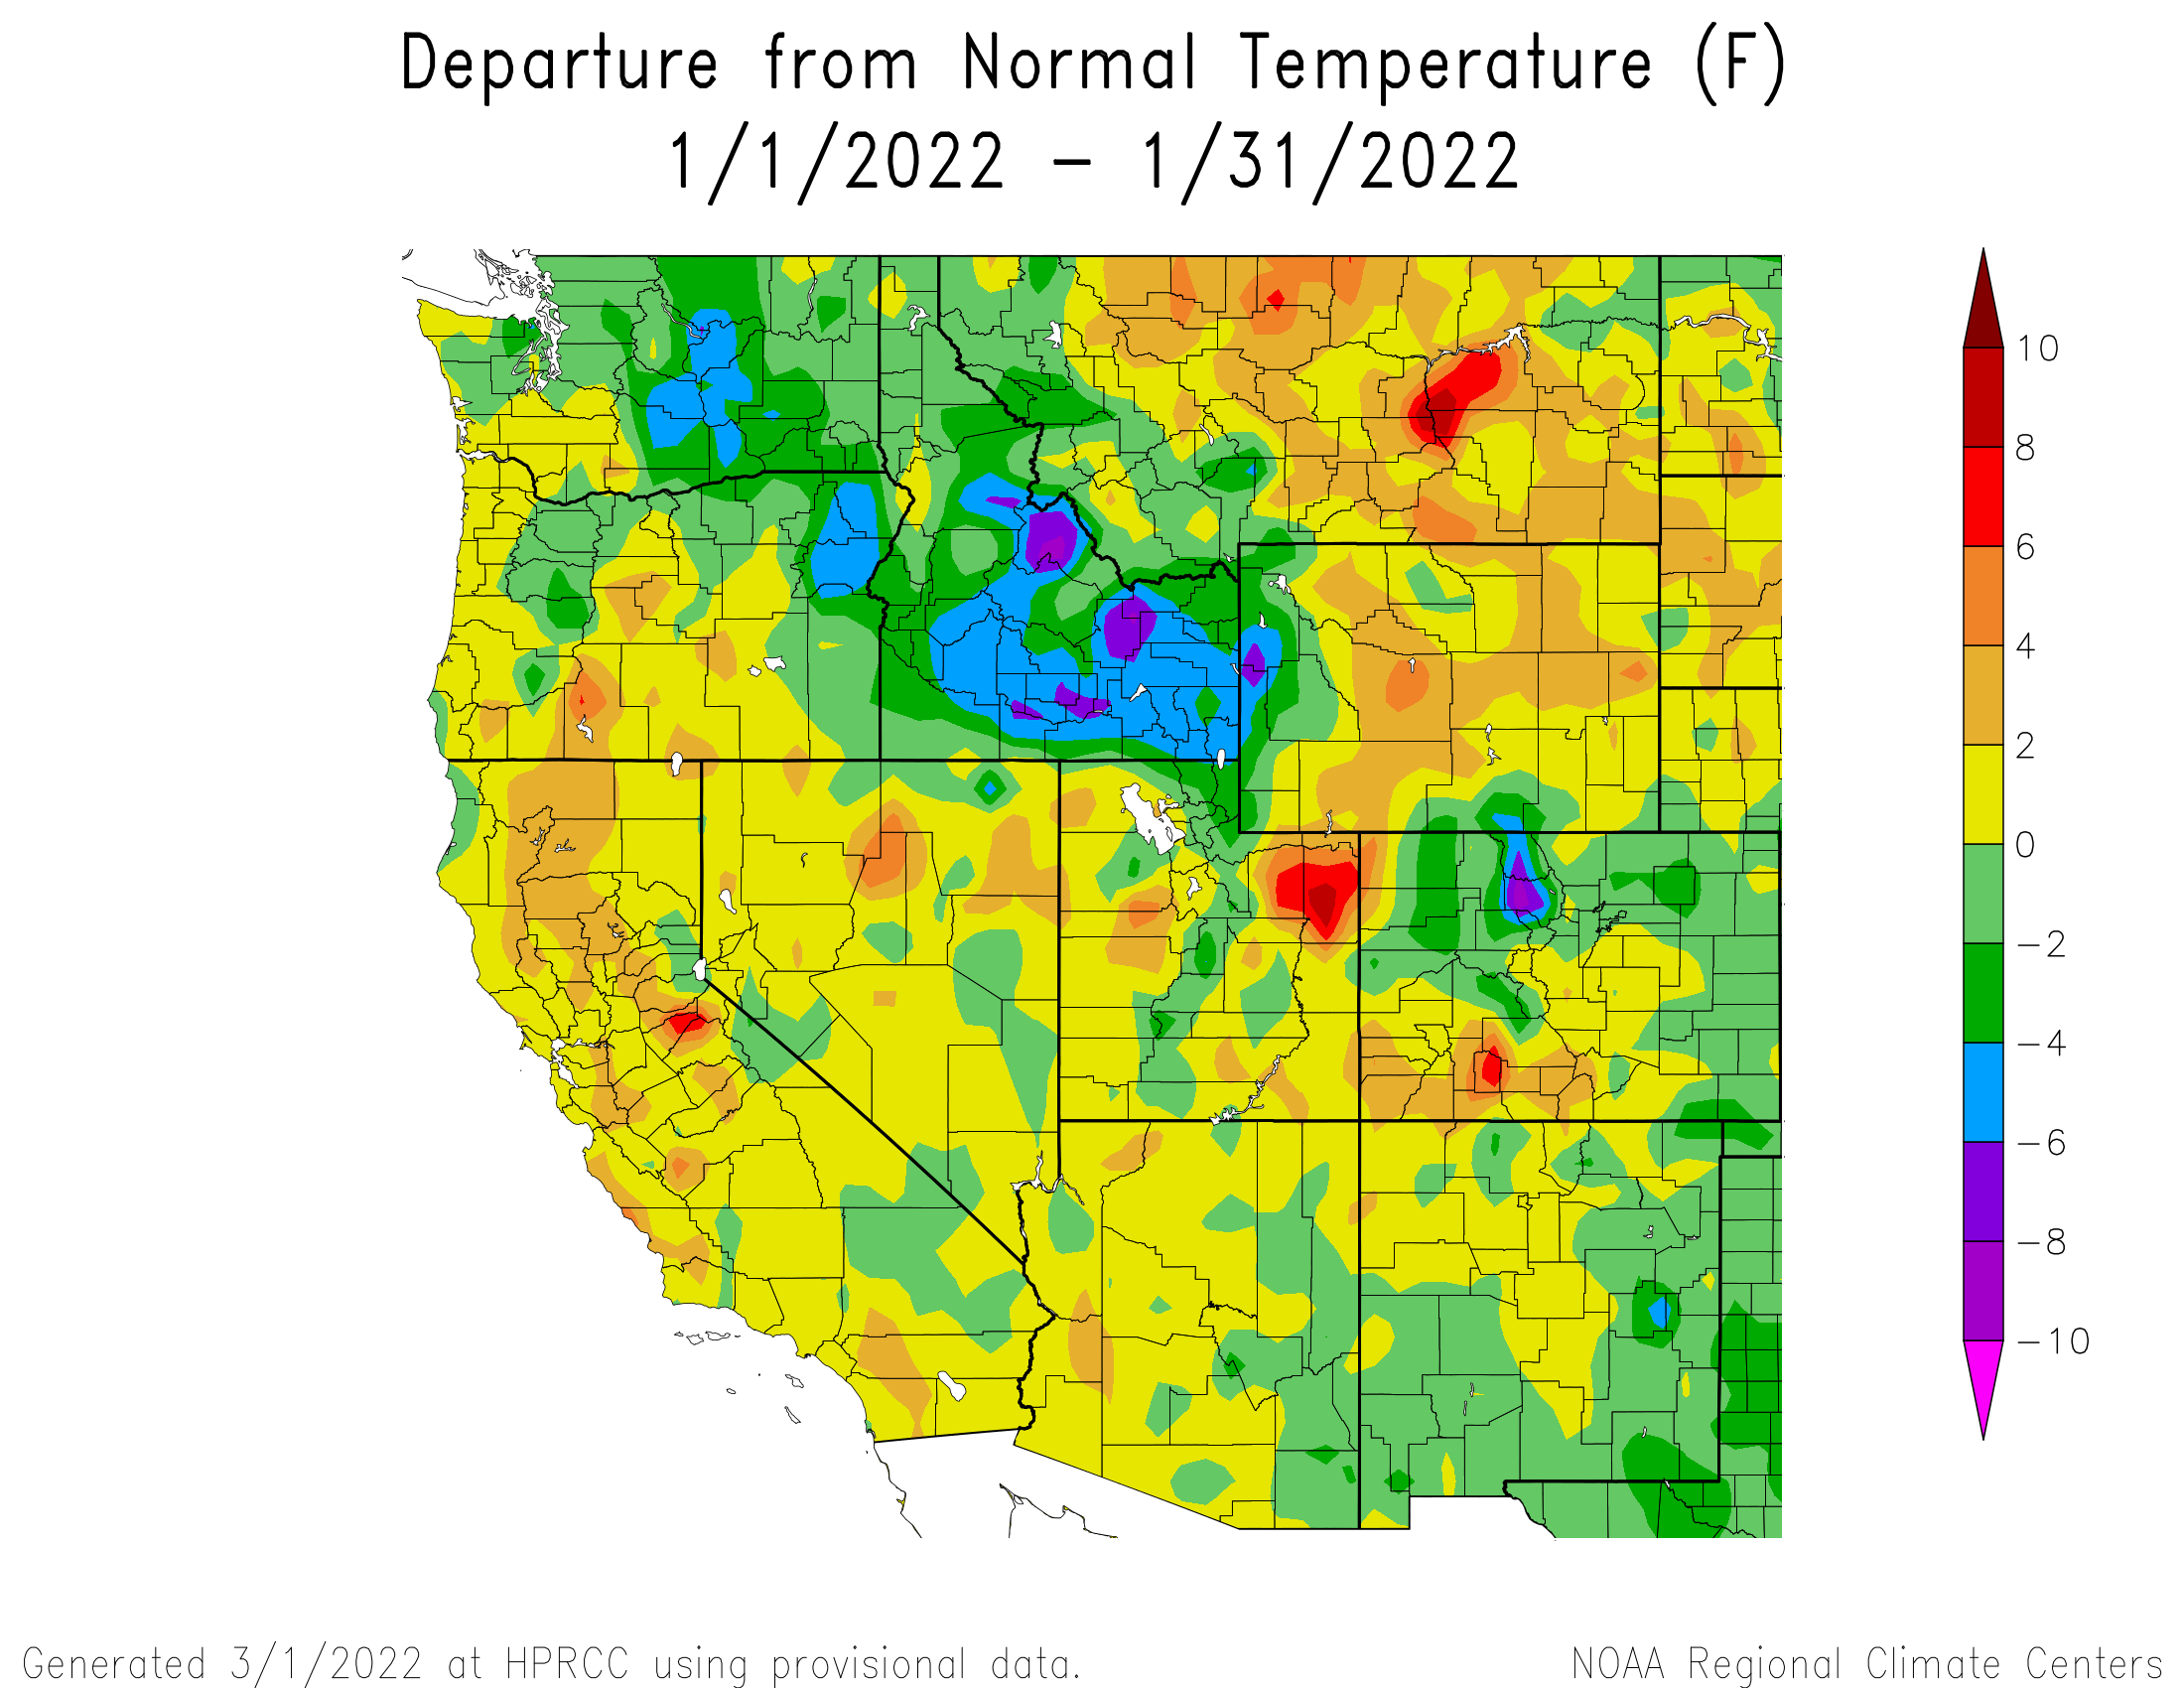
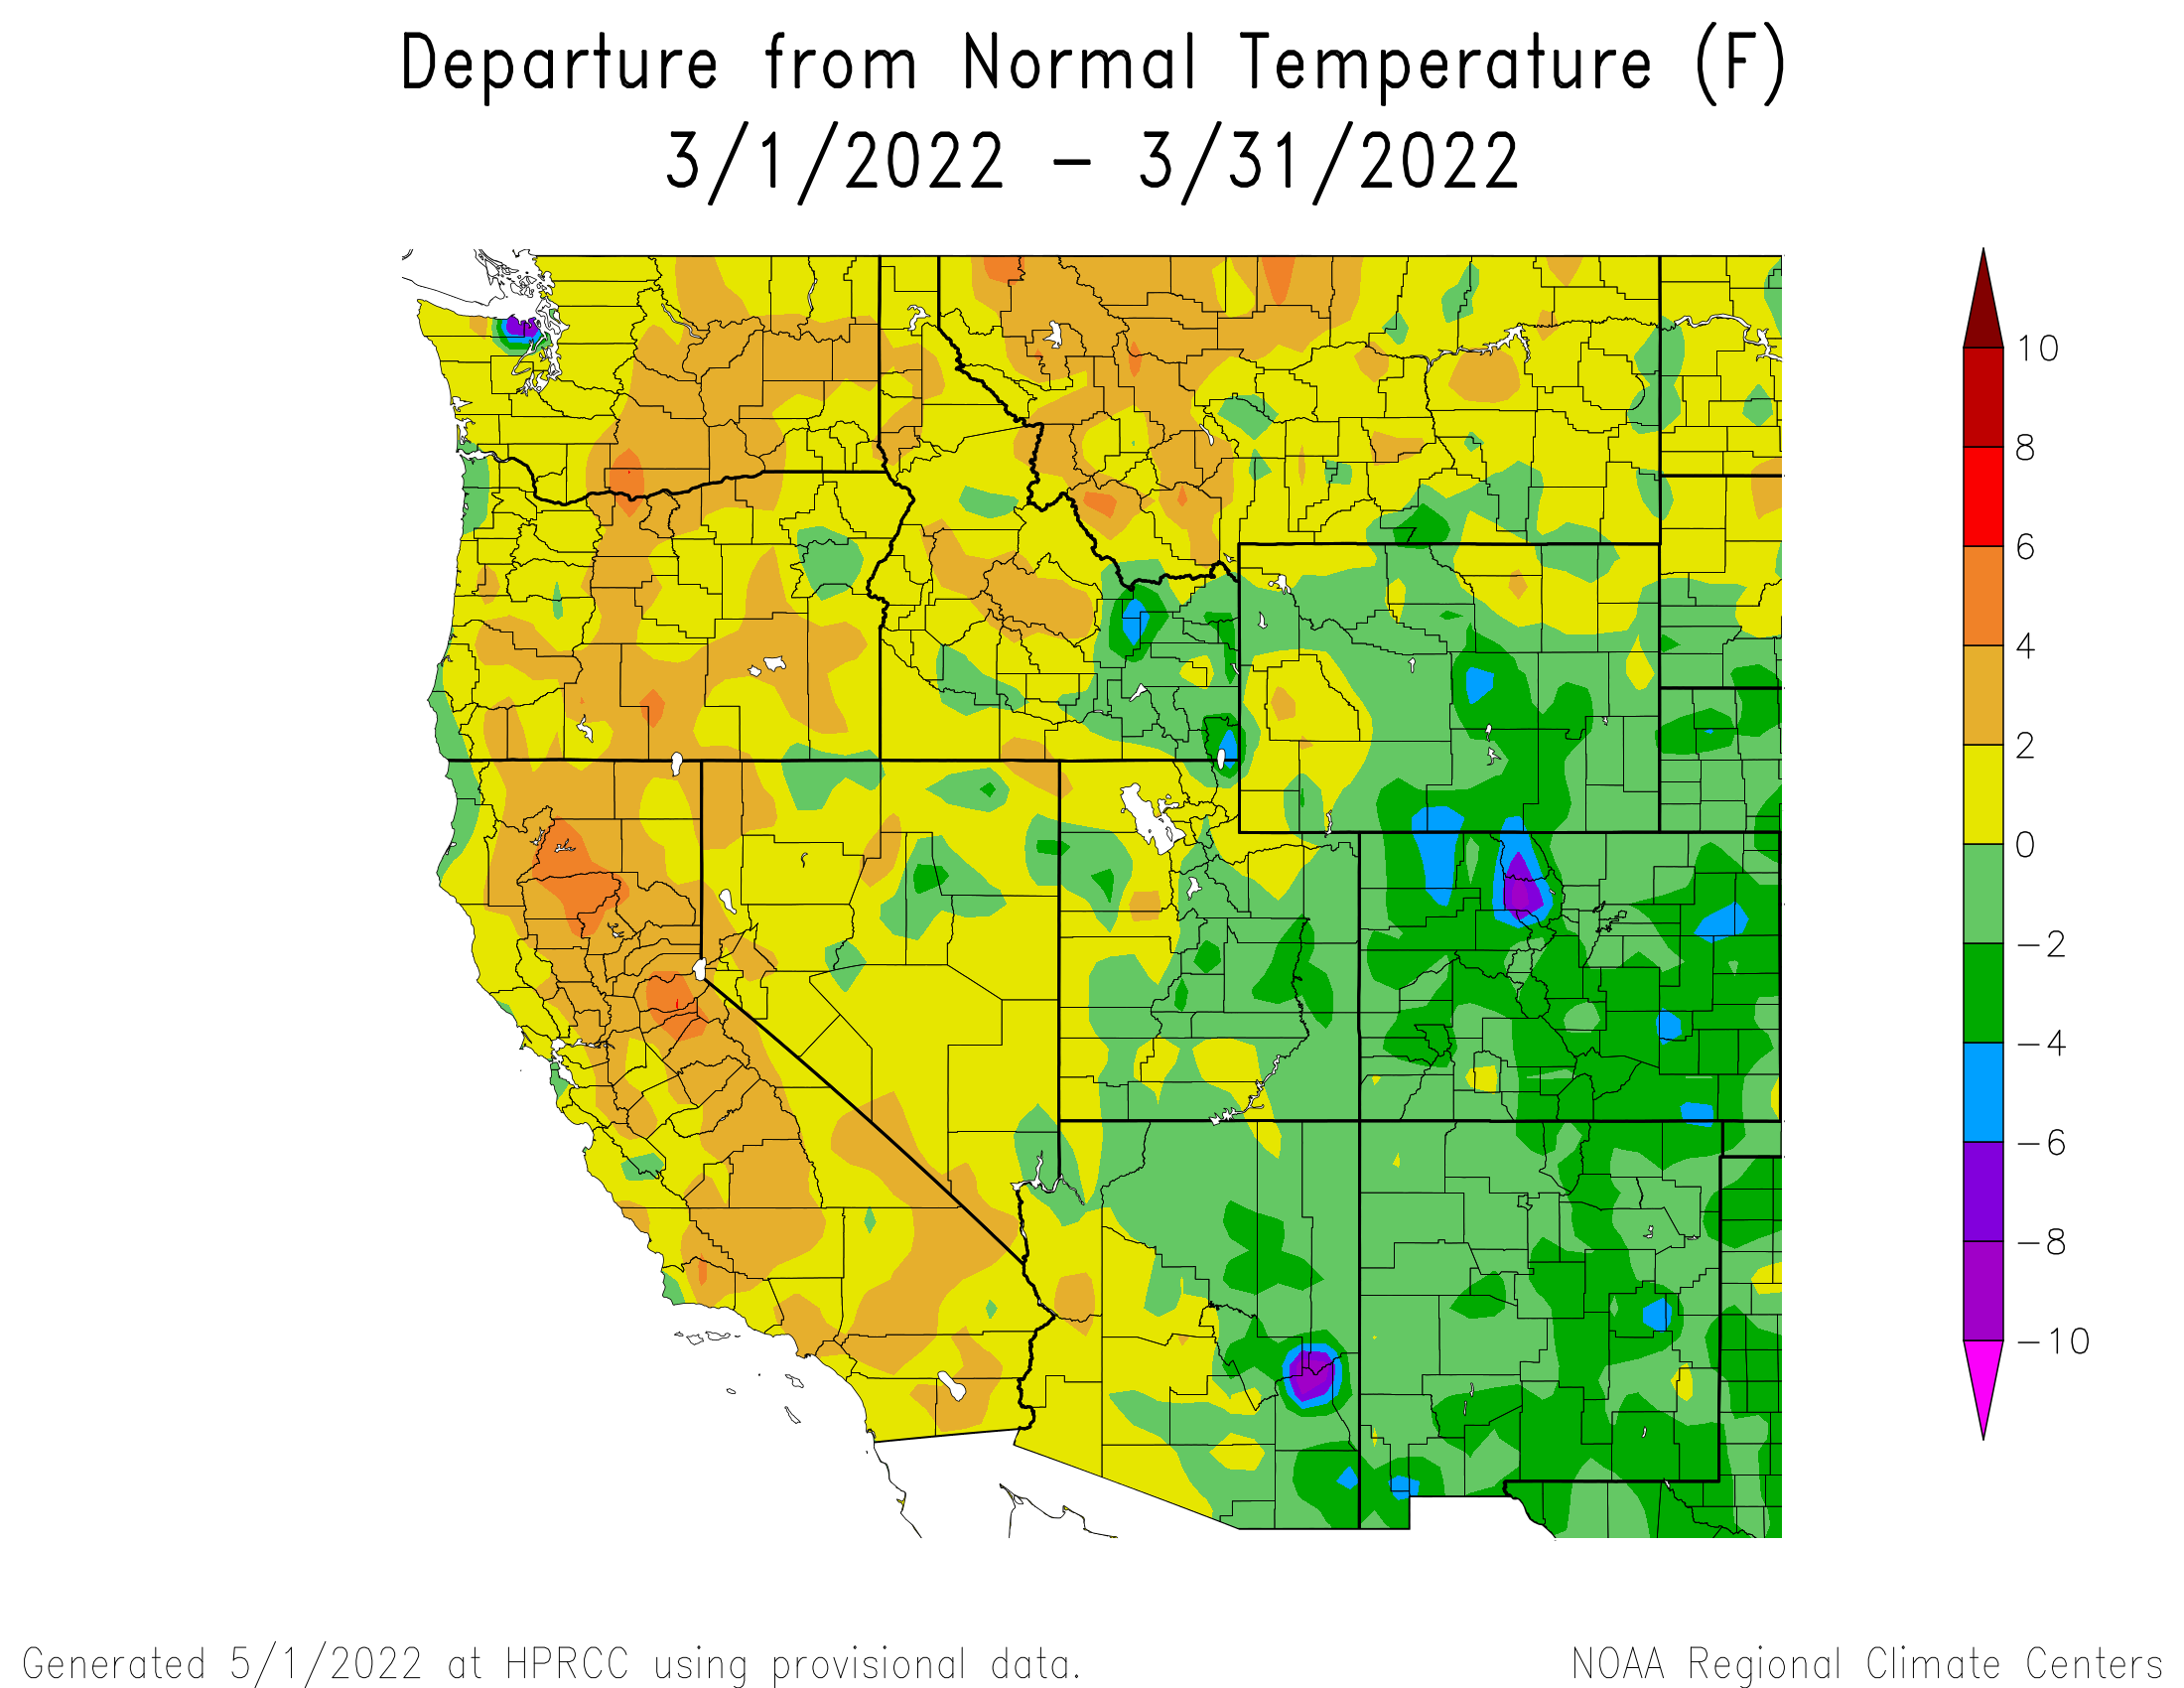
March delivered slightly below normal temperatures across most of Colorado. Precipitation was above normal in Colorado’s Front Range and the plains, while large areas of Western Colorado, Utah, and parts of Wyoming experienced well-below-normal precipitation totals. There were two significant dust events, the first event arriving March 4th from New Mexico, settling over the Southern Colorado snowpack and promptly buried under 8” of new snow accumulation, while leaving Northern Colorado snowpack largely unscathed. Swamp Angel observed 4 winter storms but recorded below average precipitation for the month of around 88% of average, 17 days of 3.9” total precipitation (average is near 4.4”), and snowdepth peaking at 6.3’. Average daily temperatures for the month was -5.7 C. Low albedo and high end-of-month temperatures brought an abrupt start of the melt season. Utah became the center of a record-setting heat wave, and WWA reports that on March 25, 92% SNOTEL sites in Utah observed a new daily high temperature record, and on March 27, 63% of SNOTEL sites in Colorado recorded new daily high temperature extremes. This end of month heat wave triggered a regional onset of snowmelt. To add fuel to the fire going into spring another dust event (D4) was on March 31.
April Weather Summary
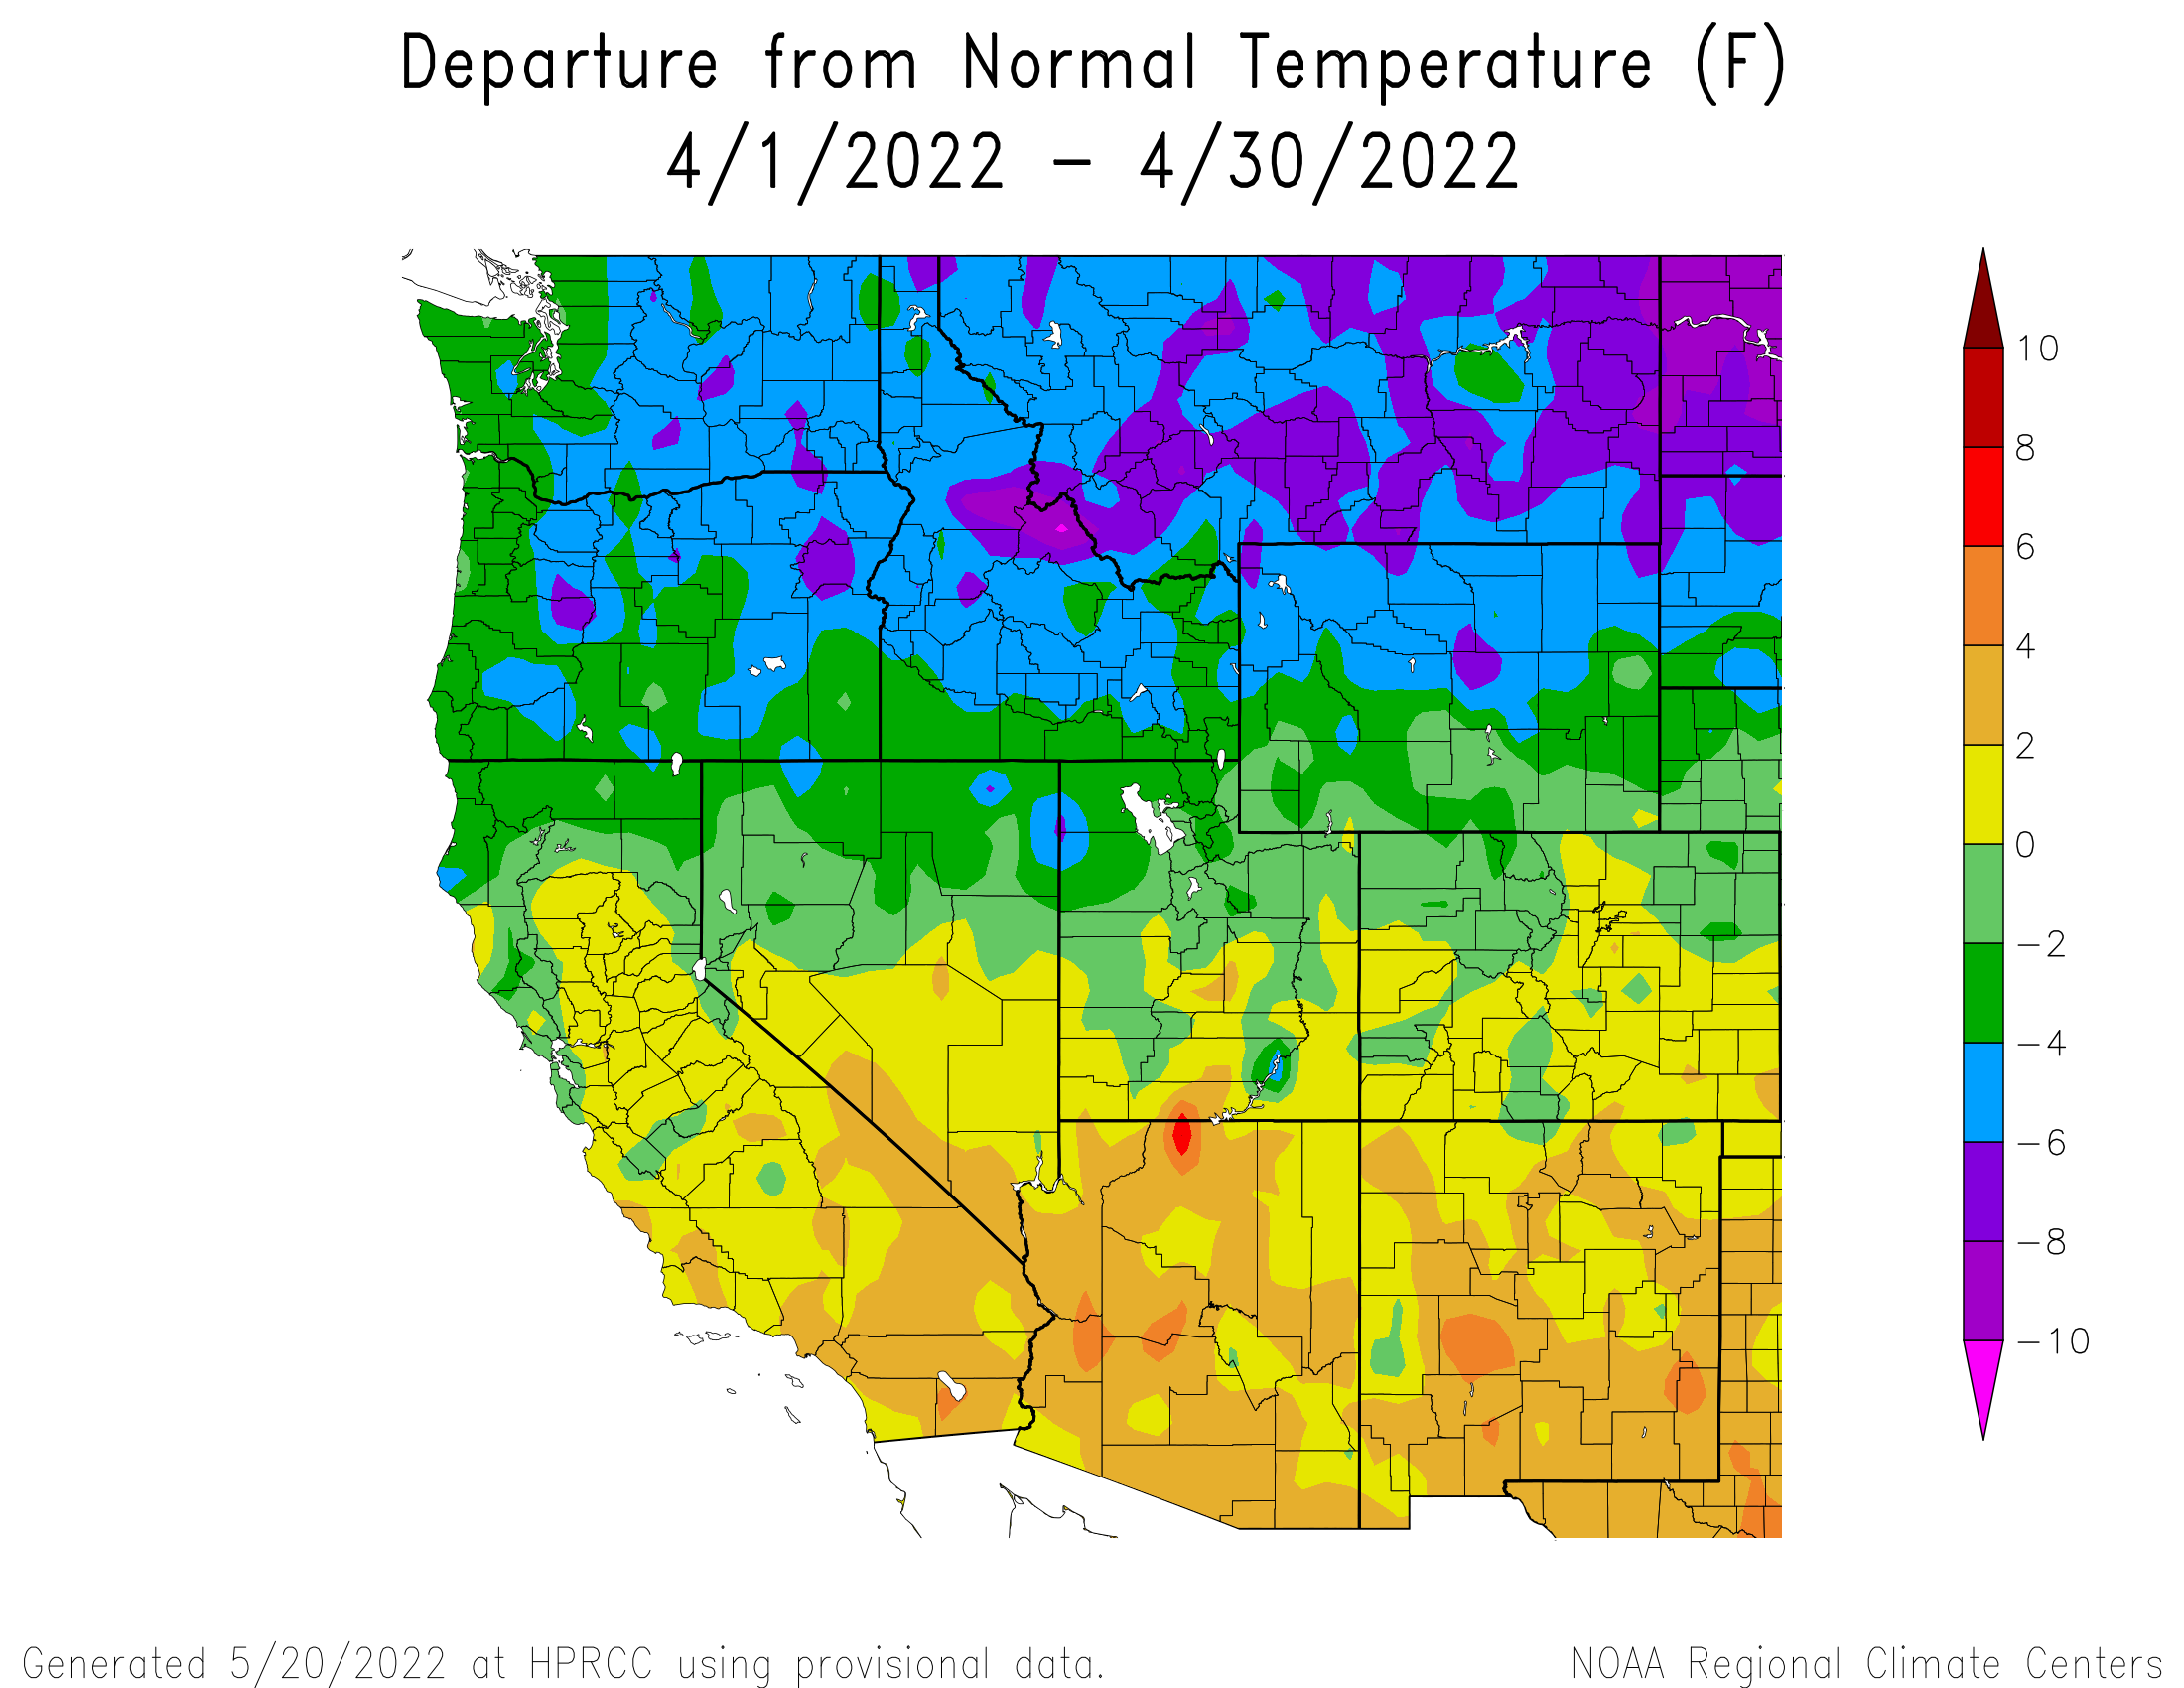
A very dry and dusty April. High winds at the Red Mountain Pass Putney station reached 100 mph, and SBSP saw peak gust of 84 mph on April 5. The high winds brought 3 big dust events which were slightly buffered with light snowfall, but sunny days and warmer temperatures quickly brought layers to the surface of the snowpack. The CODOS spring tour took place April 16-19 where many dust layers were observed at the surface/near-surface in most locations except Rabbit Ears pass. Early in the month Southern Colorado fell into the “max” category of dust severity for the first time since 2013. SASP saw 2 winter storms and around 50% of normal precipitation for April of 2.2” (average is closer to 4.5”). Eastern plains of Colorado saw less than 5% of normal precipitation, while large areas of Southern Colorado received less than 50% of normal precipitation. Most of Colorado and Utah were within 2 degrees of normal temperature. Northern Wyoming experienced very cold temperatures and way-above average (200% of normal) precipitation. Many Southern Colorado river basins like the Dolores and San Juan River basins experienced near-unprecedented rates of melt, losing 50% of their snowpack in the month of April, and these big dust events played a big part.
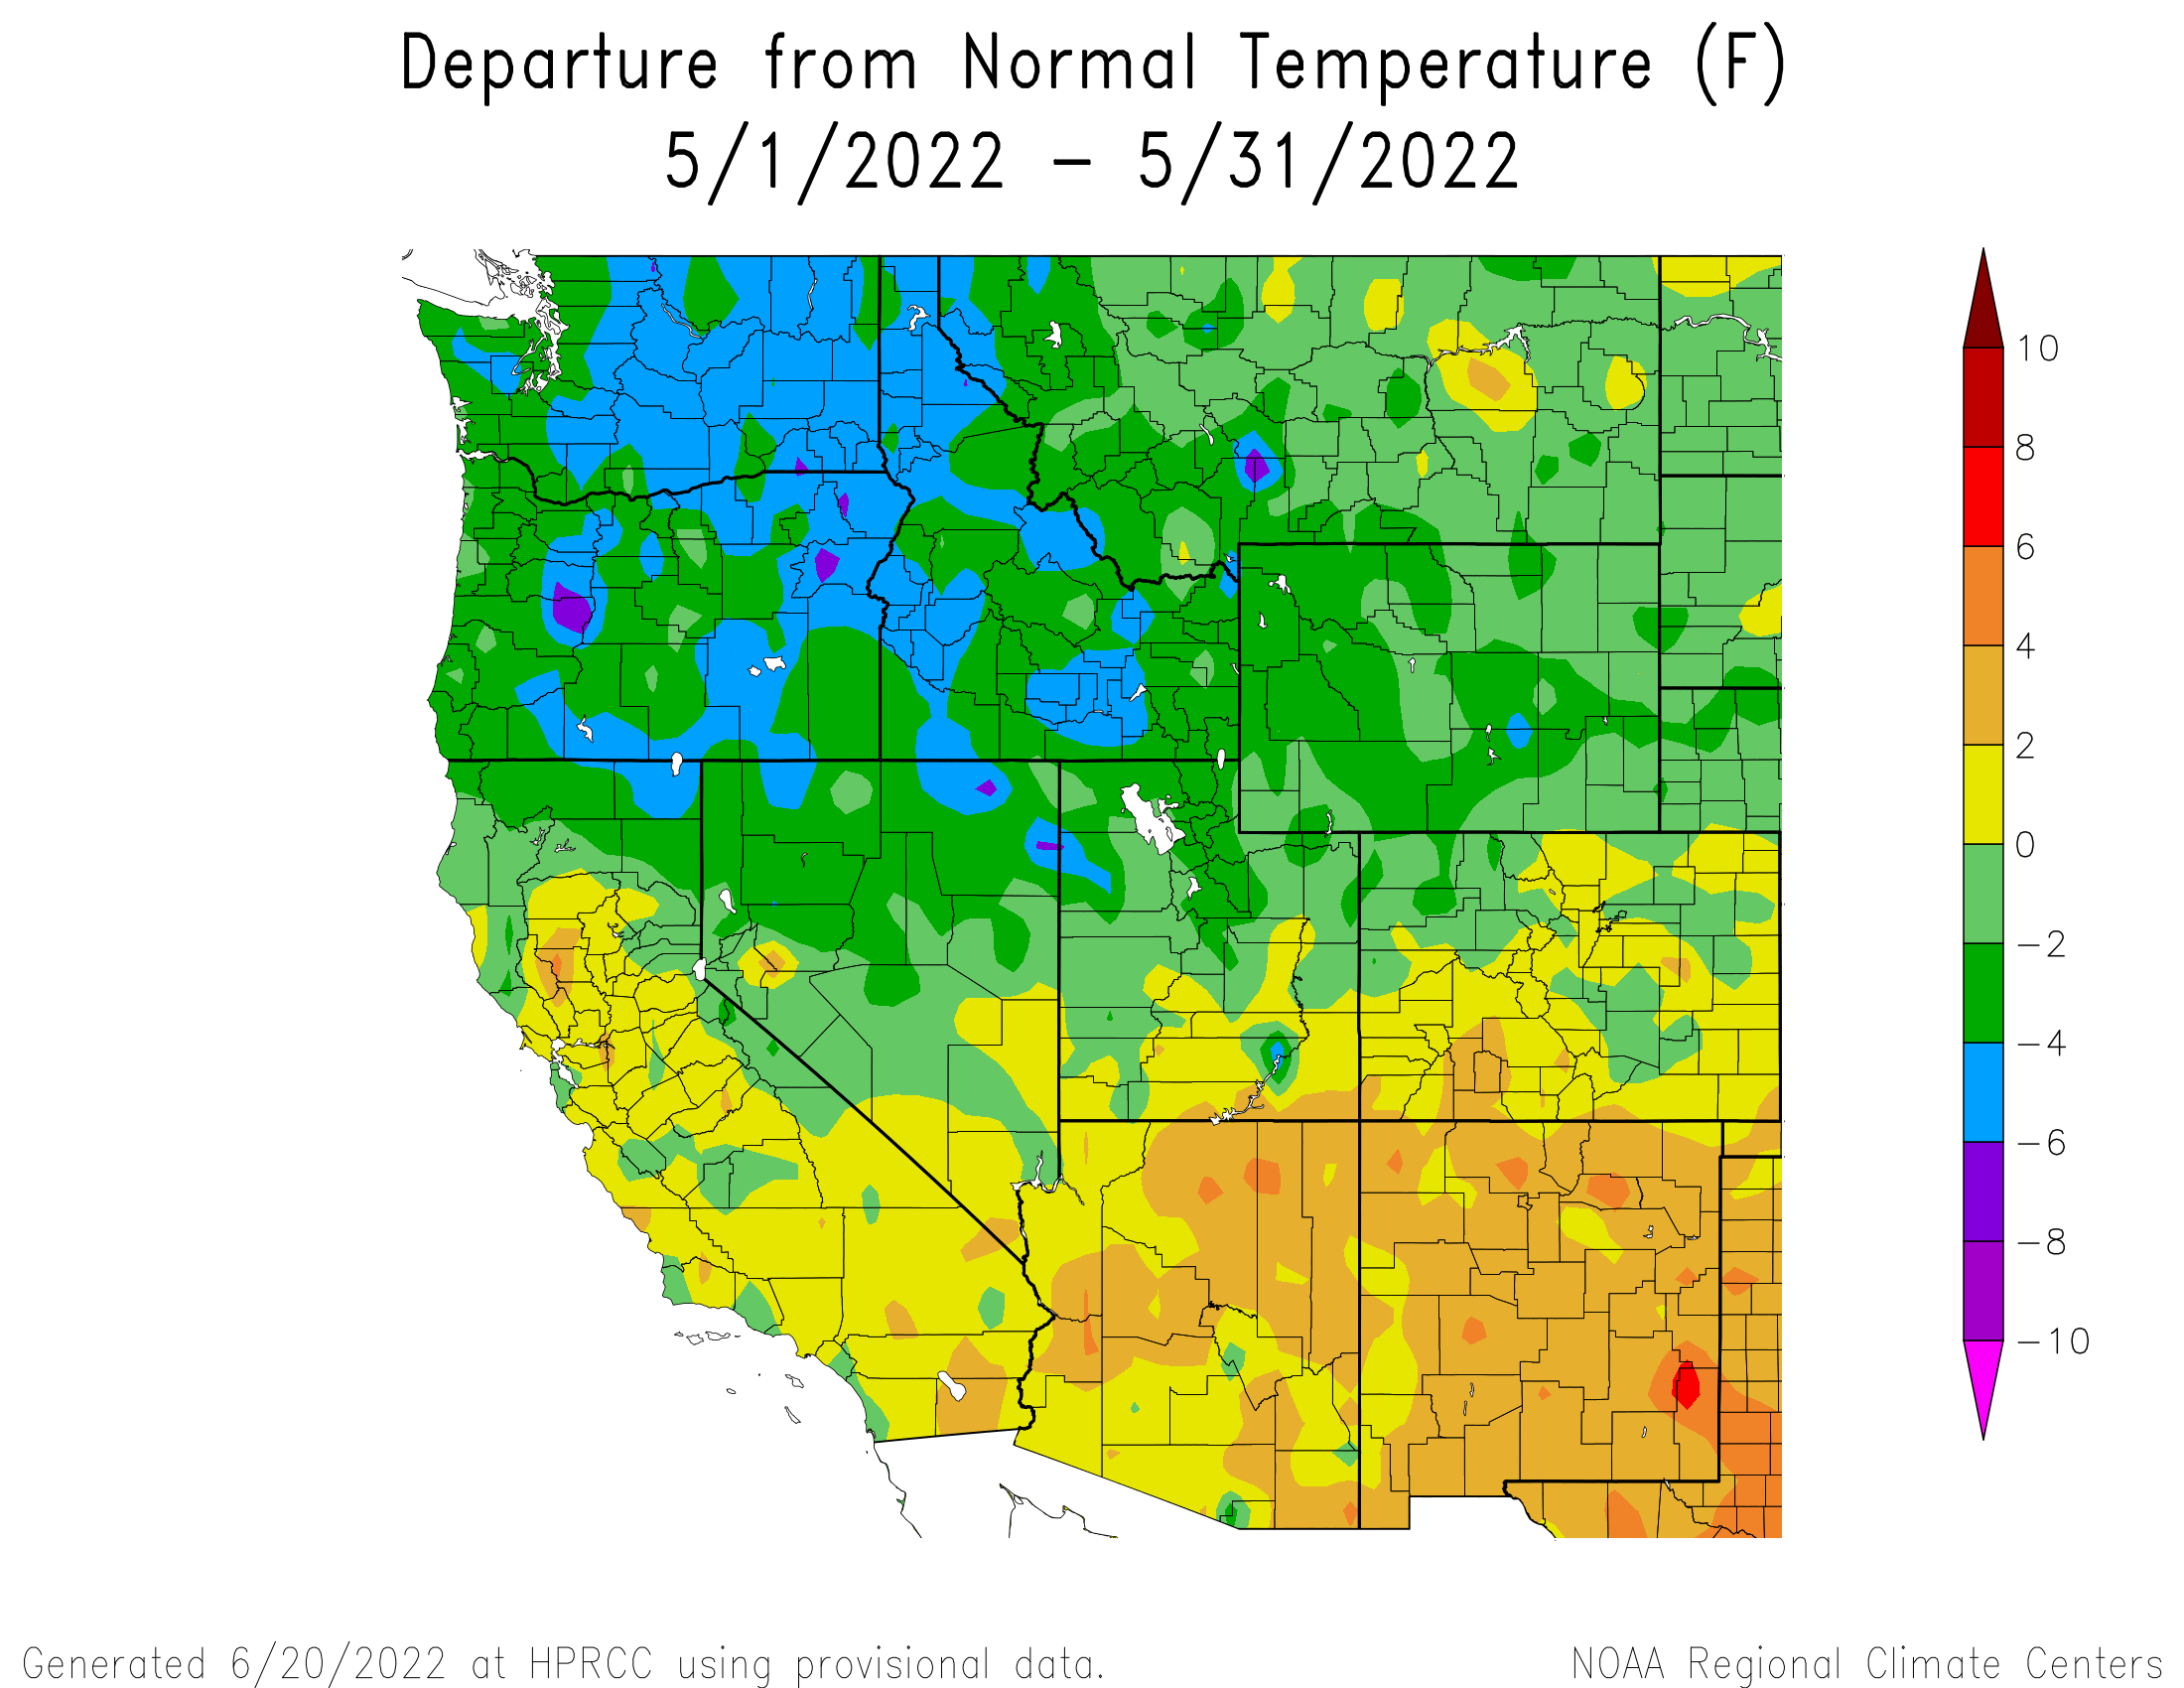
May Weather Summary
May precipitation at Swamp Angel Study Plot was a poor 23% of normal, without a single precipitation event meeting the requirements to classify as a winter storm. Red Mountain Pass SNOTEL was melted out on May 20th, with Swamp Angel snow-free on May 16, and Senator Beck Study Plot snow-free on May 18th. The Central Colorado mountains along the Continental Divide saw above average snowfall and below average temperatures, but most of the rest of the region saw below average precipitation, the driest being in the Southwestern US states. Northern Wyoming had above average June 1st SWE conditions, with WY SNOTEL site data ranging 126% - 705% of normal. The CODOS tour took place May 14-17, and found the Wolf Creek pit site completely bare of snow on May 17th as well as a few other sites. The northern-most Rabbit Ears Pass had notably the best snowpack conditions, still with 4.6’ of snow and a pretty severe layer of dust on the surface. At Swamp Angel May delivered 4.9” of precipitation with no precipitation event classifying as a winter storm; this is about 23% of the normal 3” precipitation. At least 4 dust events, D8-May 1, D9-May 2, D10-May 7, D11-May 8, struck in May.
June Weather Summary
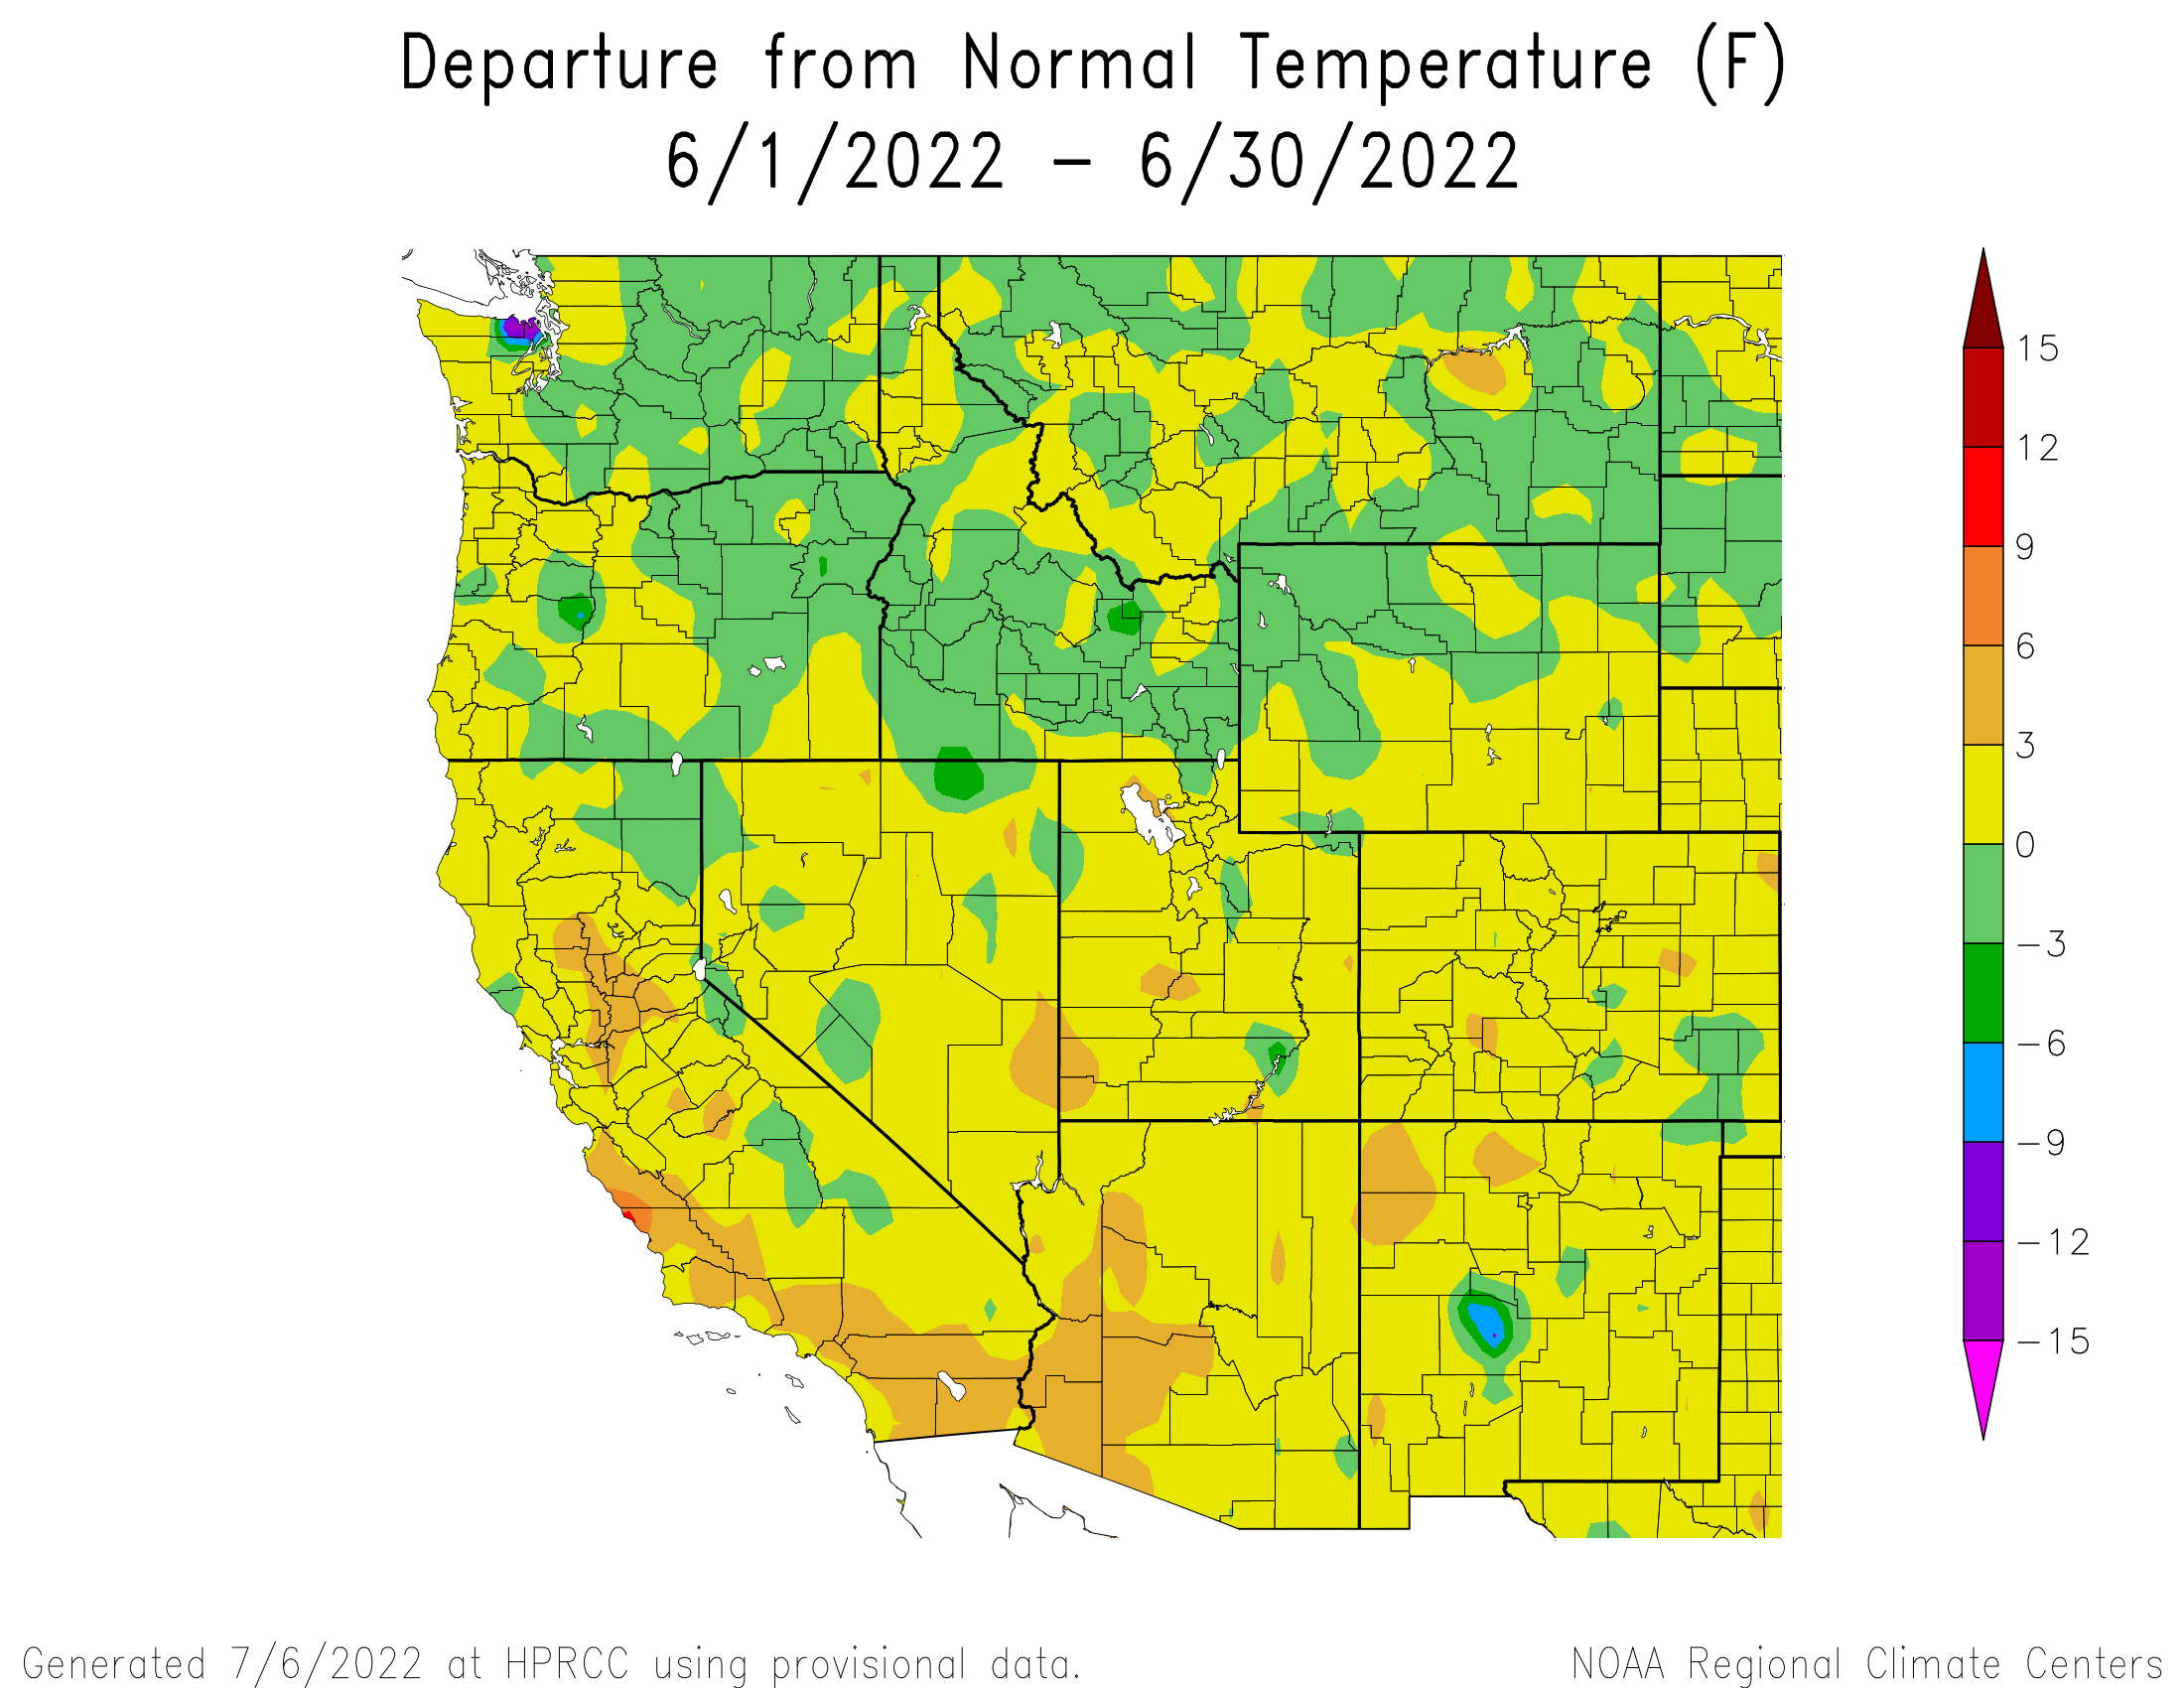
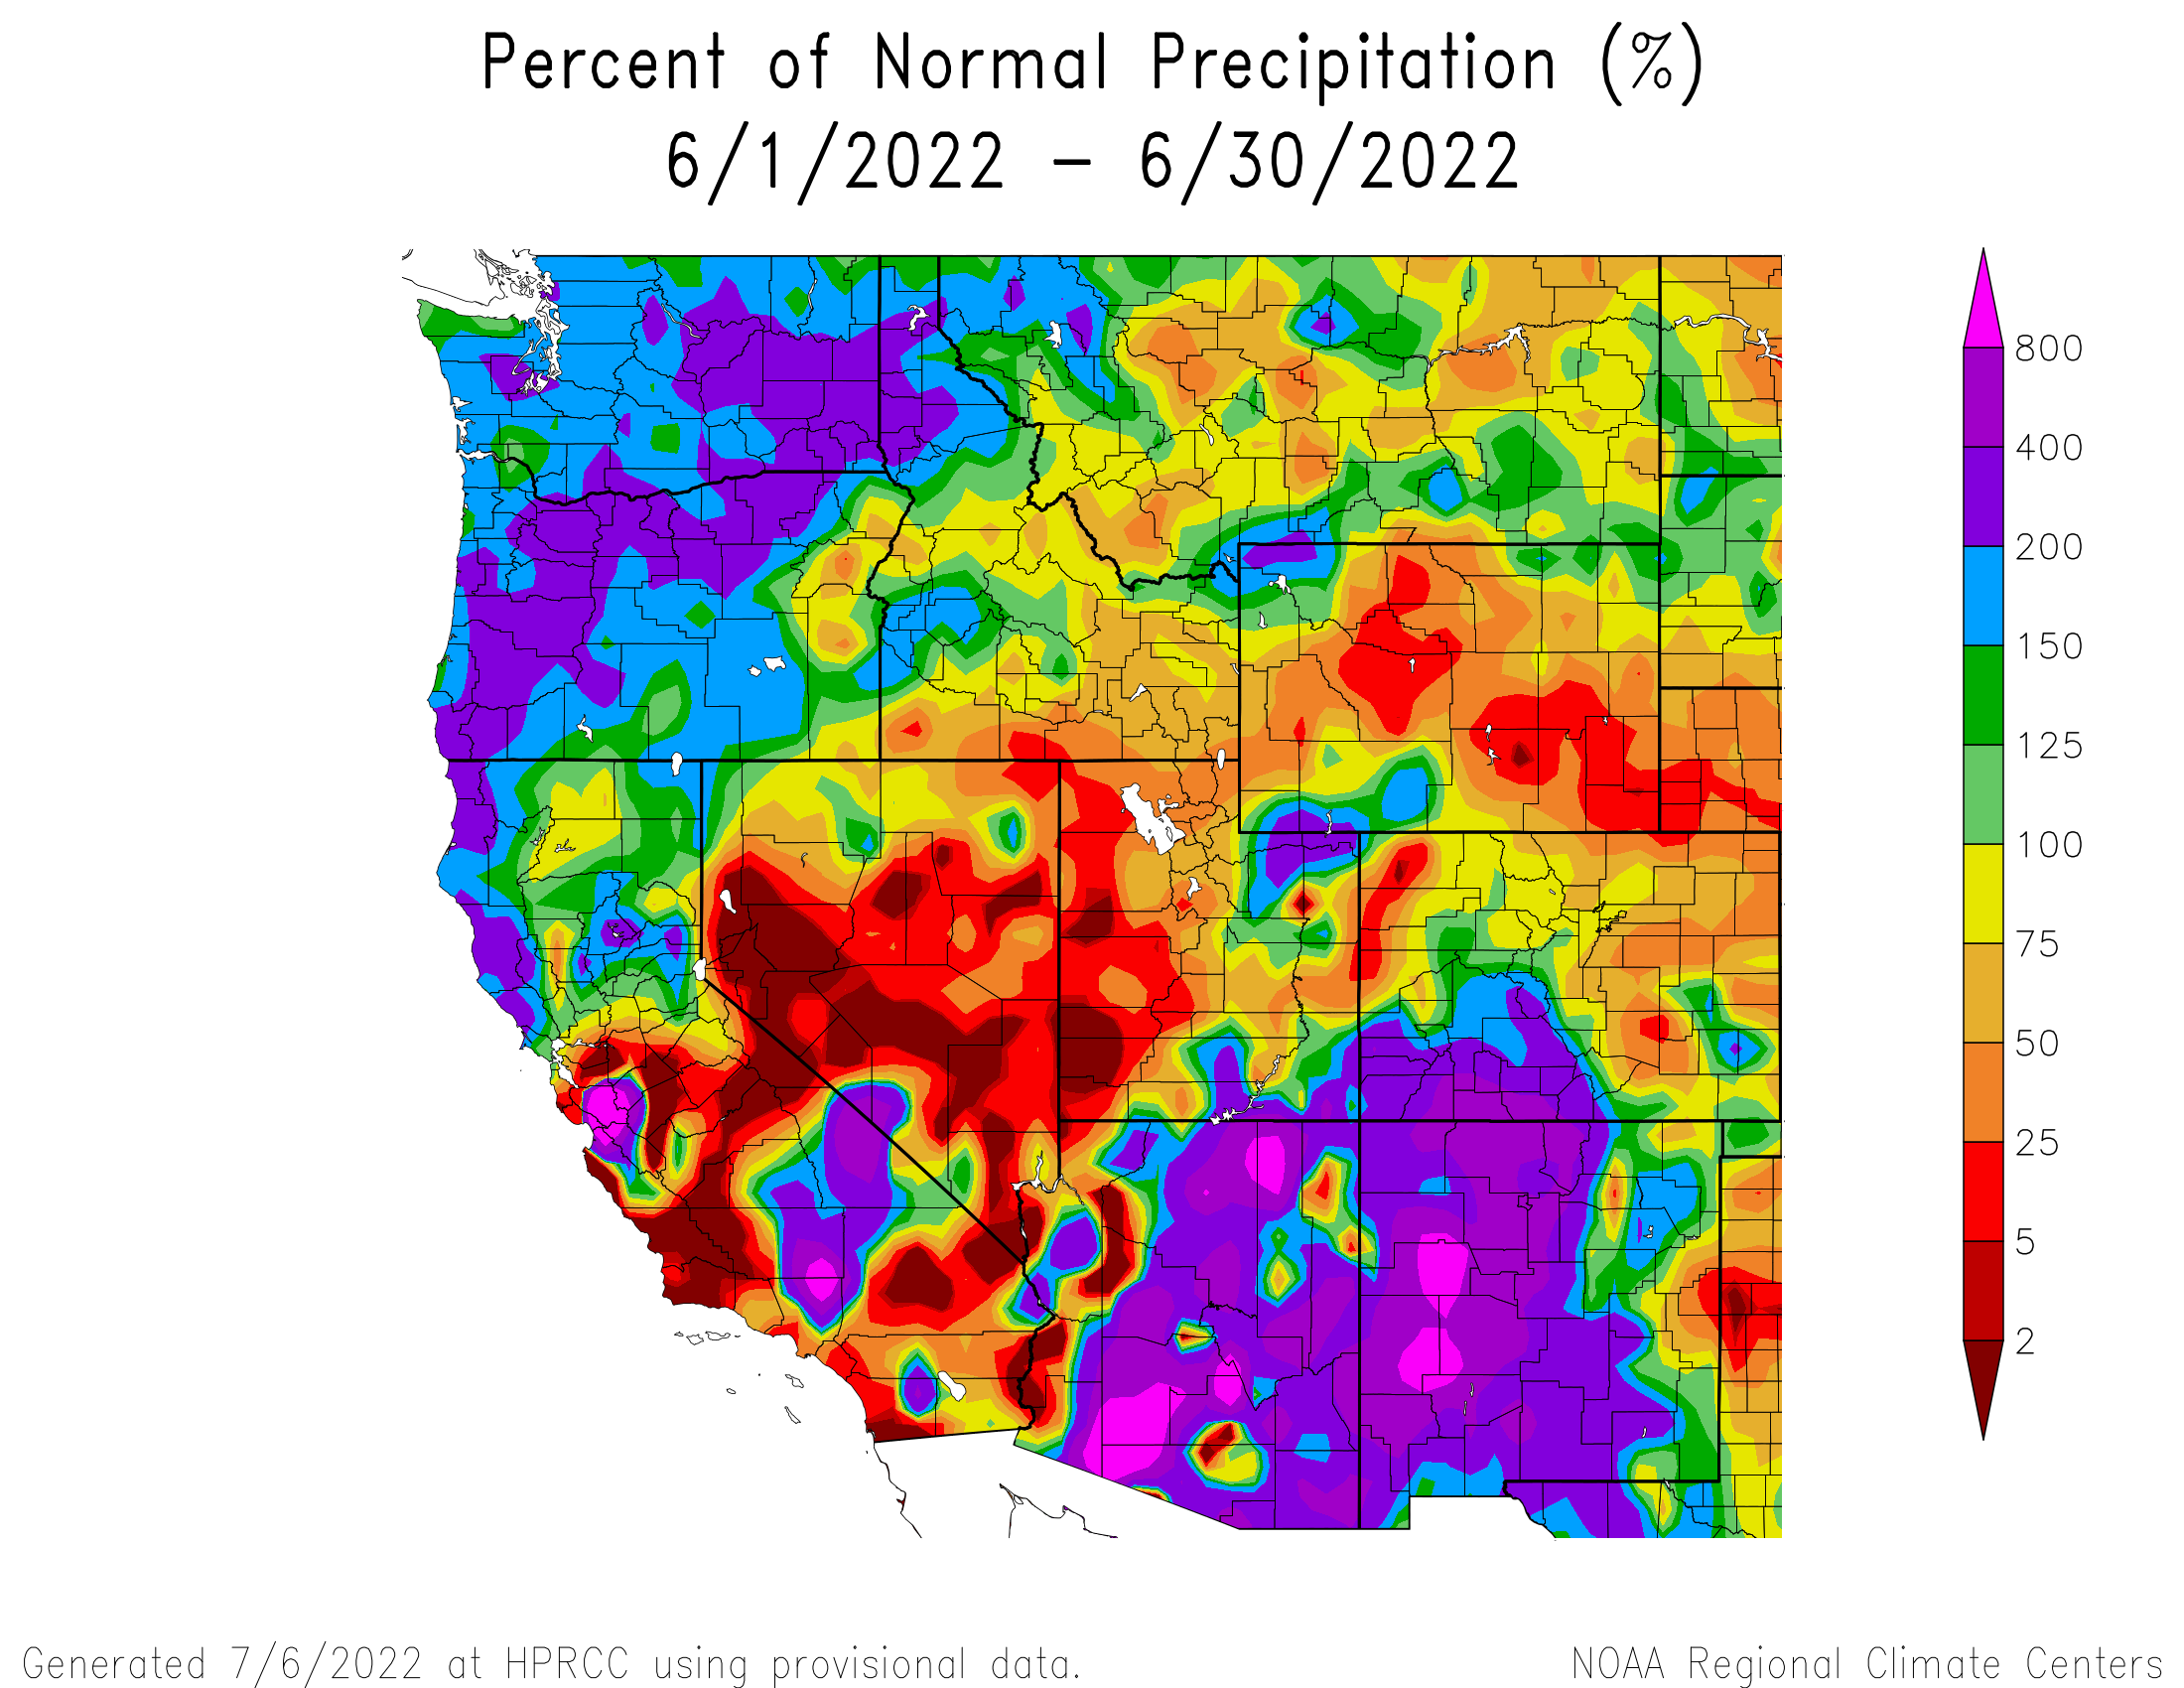
The early-onset of the North American Monsoons most strikingly impacted Southern Colorado, New Mexico, Arizona and the northwest corner of Wyoming, with areas receiving 200-800% of normal precipitation. On average, the Colorado snowpack melted out 10 days early. The area impacted by drought around the state decreased, though Utah remains in the most dire conditions, with 82% of the state in severe drought. Notably, rapid snowmelt and an atmospheric river event caused severe flooding in the northwest corner of Wyoming, causing widespread damage to infrastructure in early June.
The early monsoons affect June precipitation at the Swamp Angel plot, which ended up 260% above normal, totaling 3”.
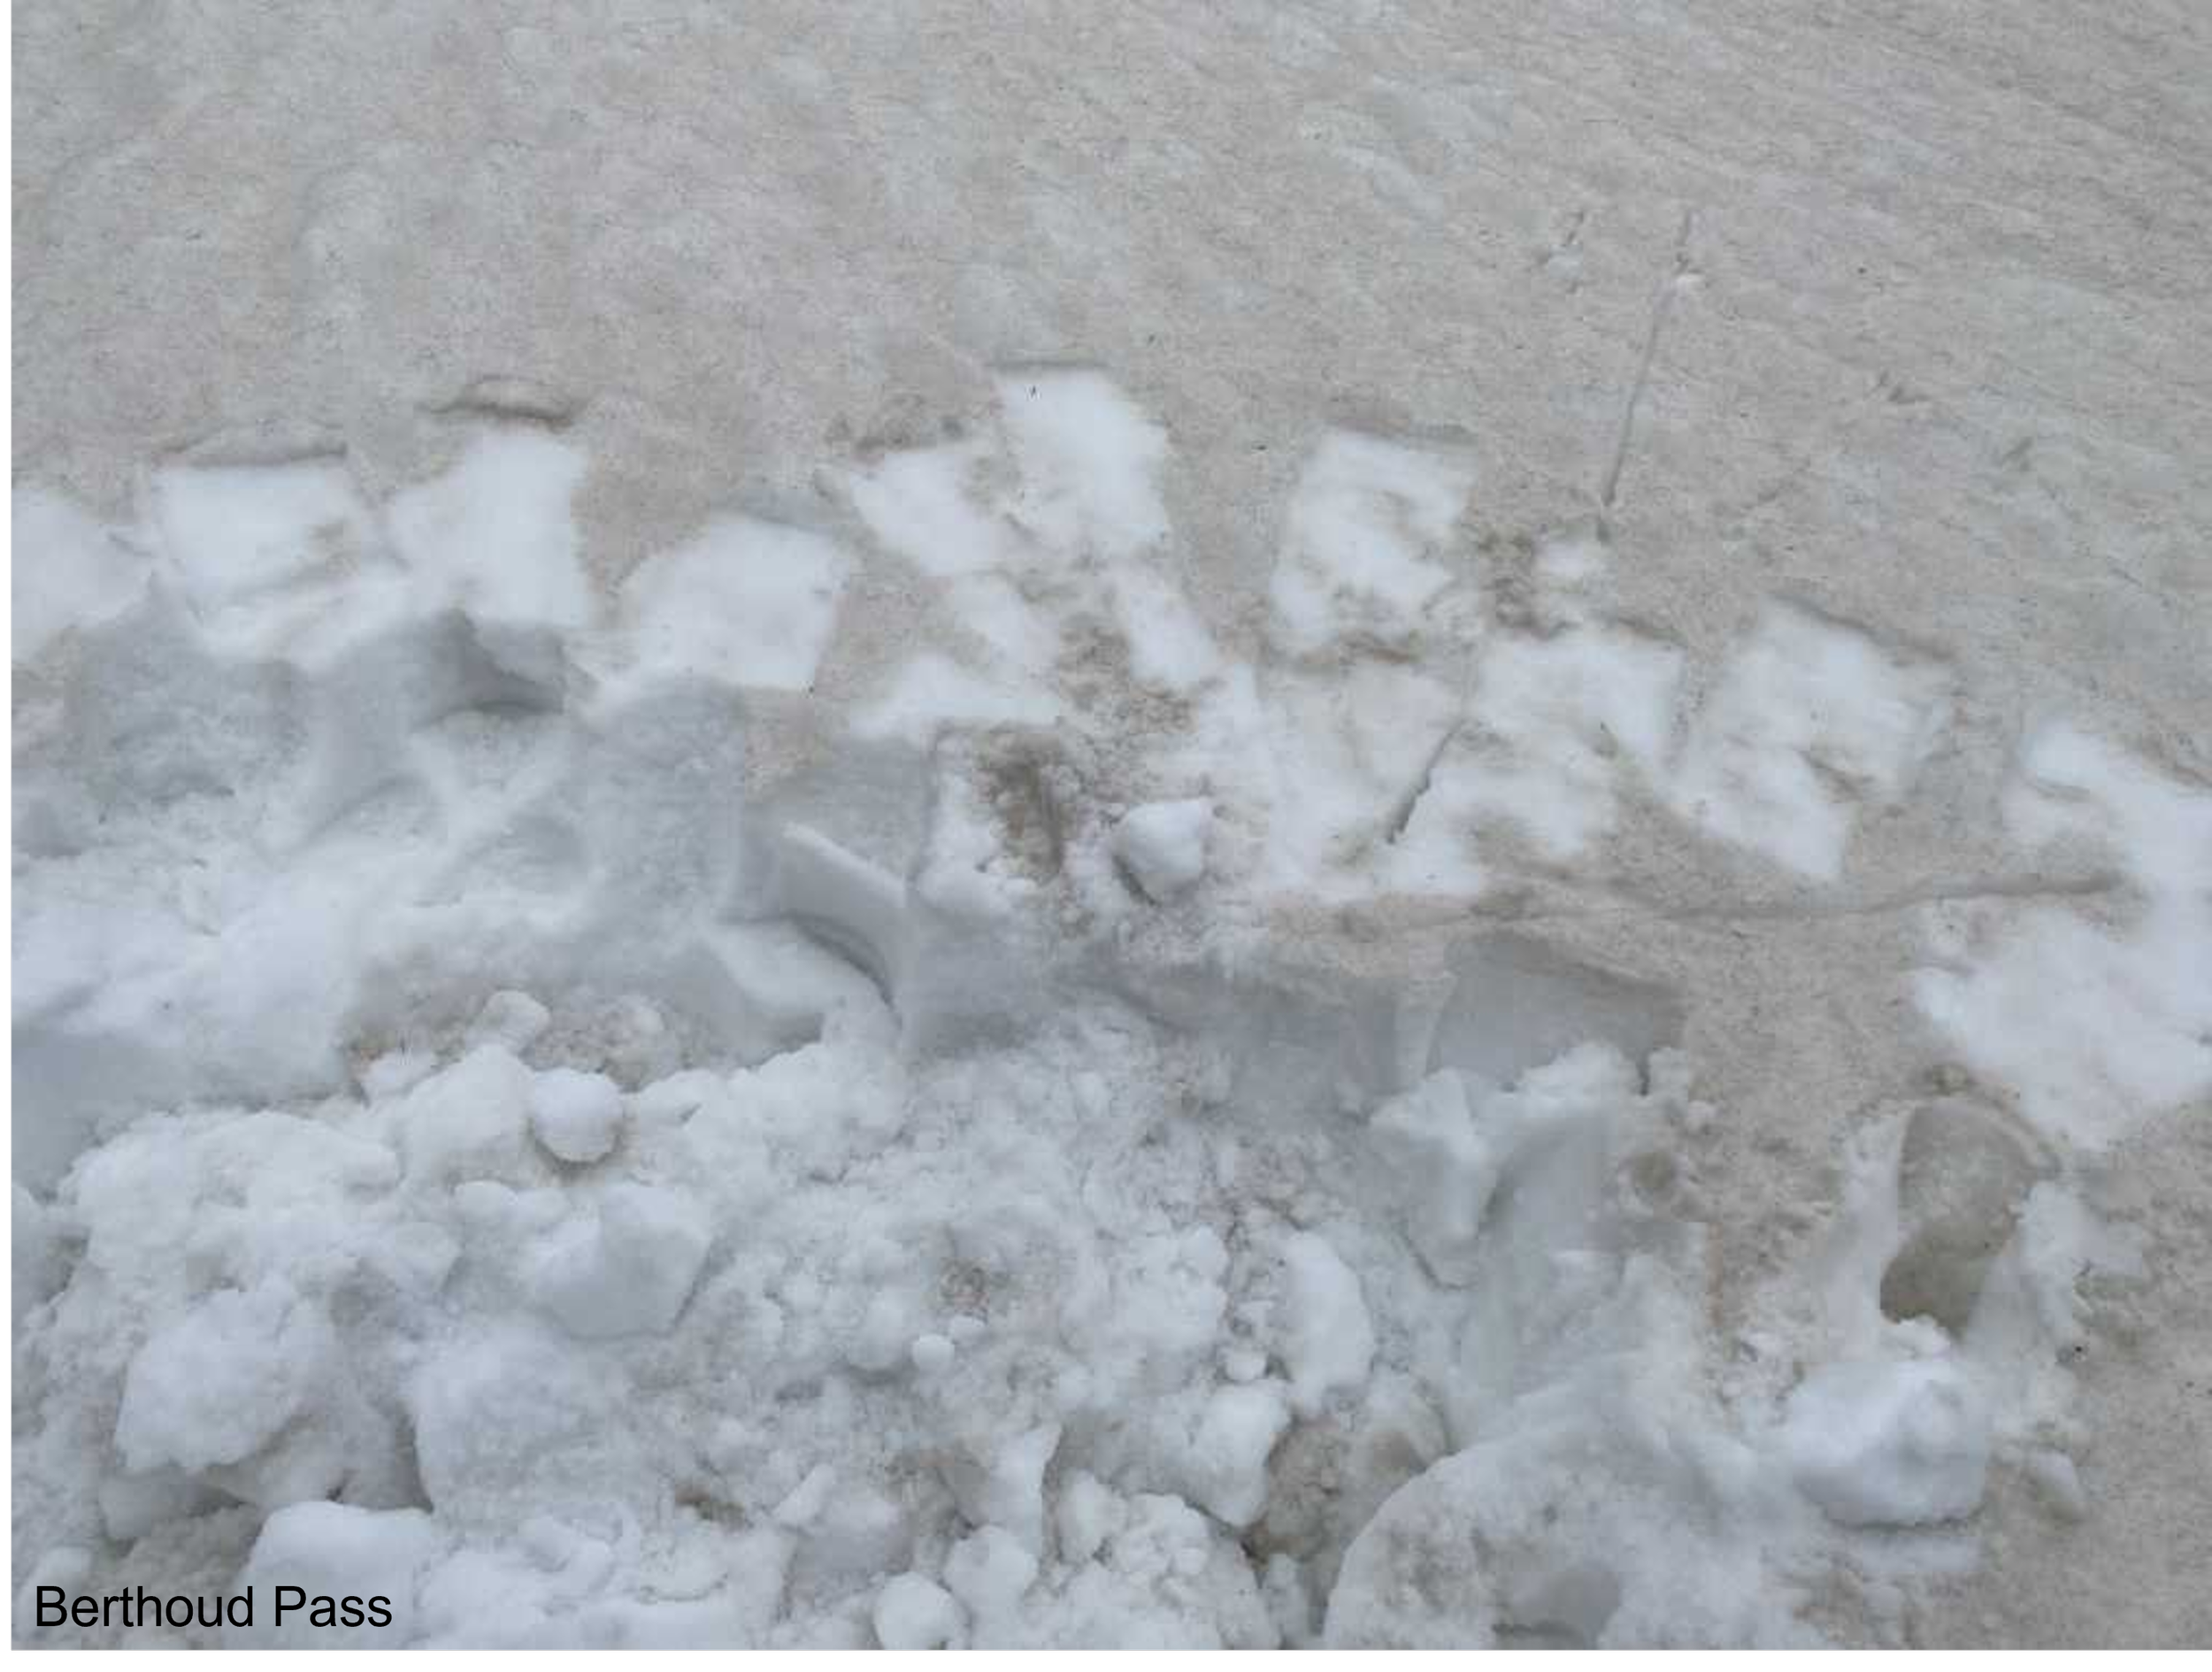
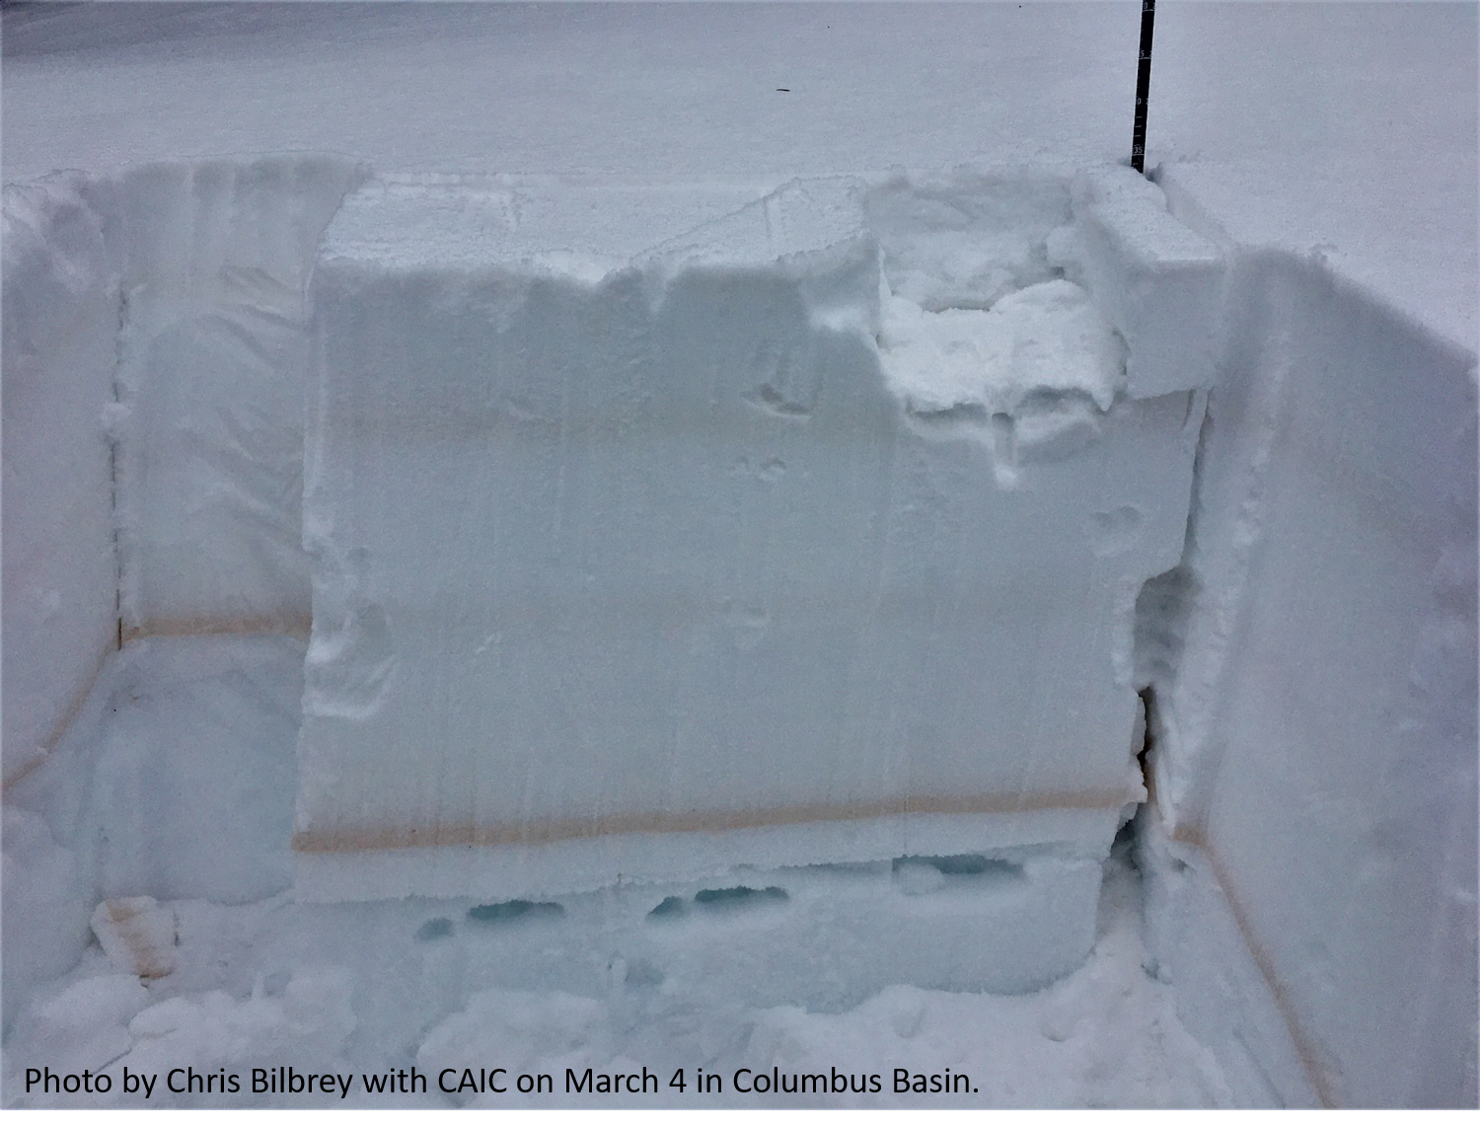
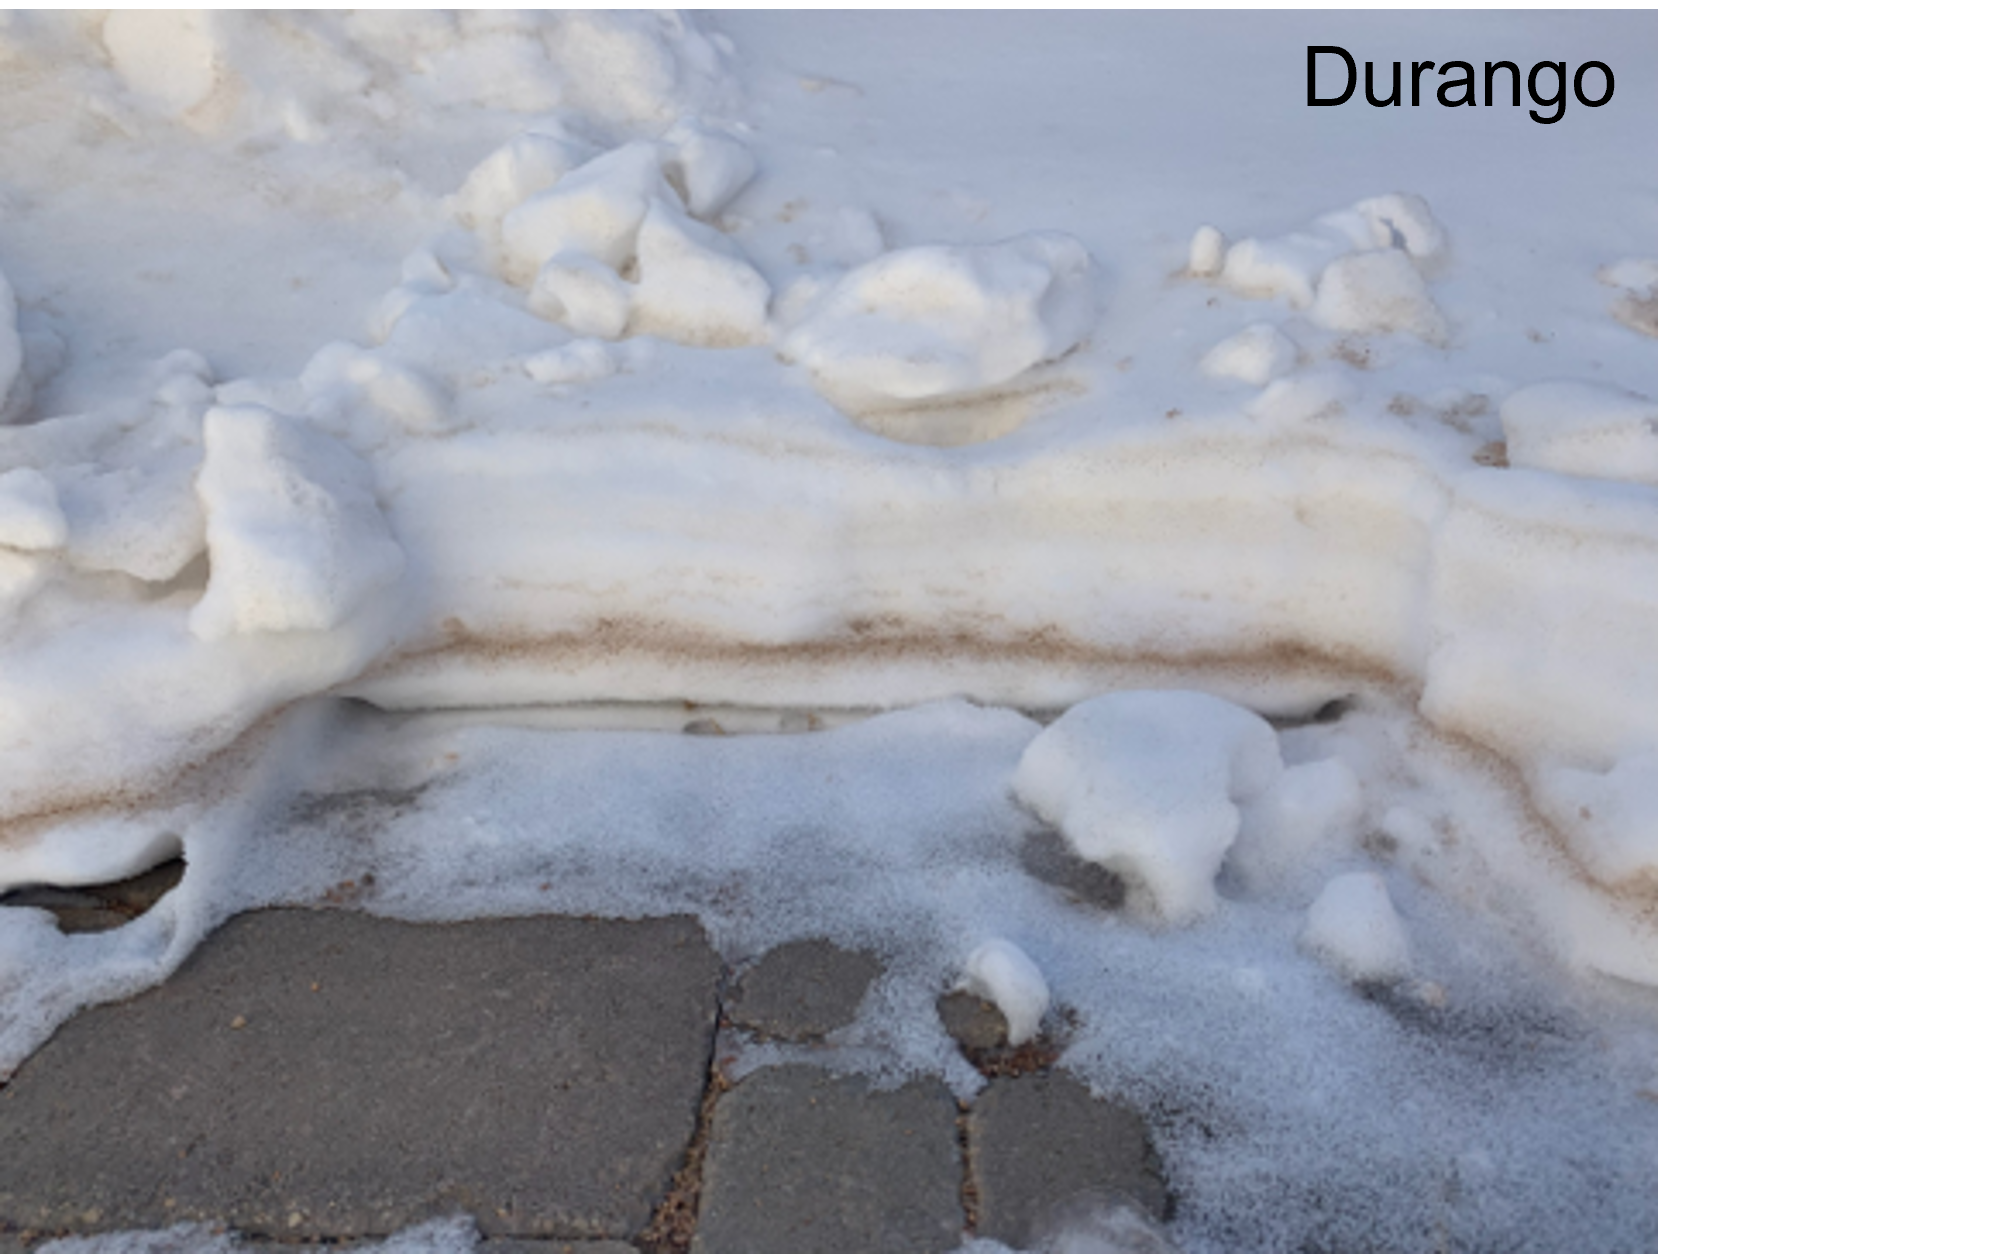
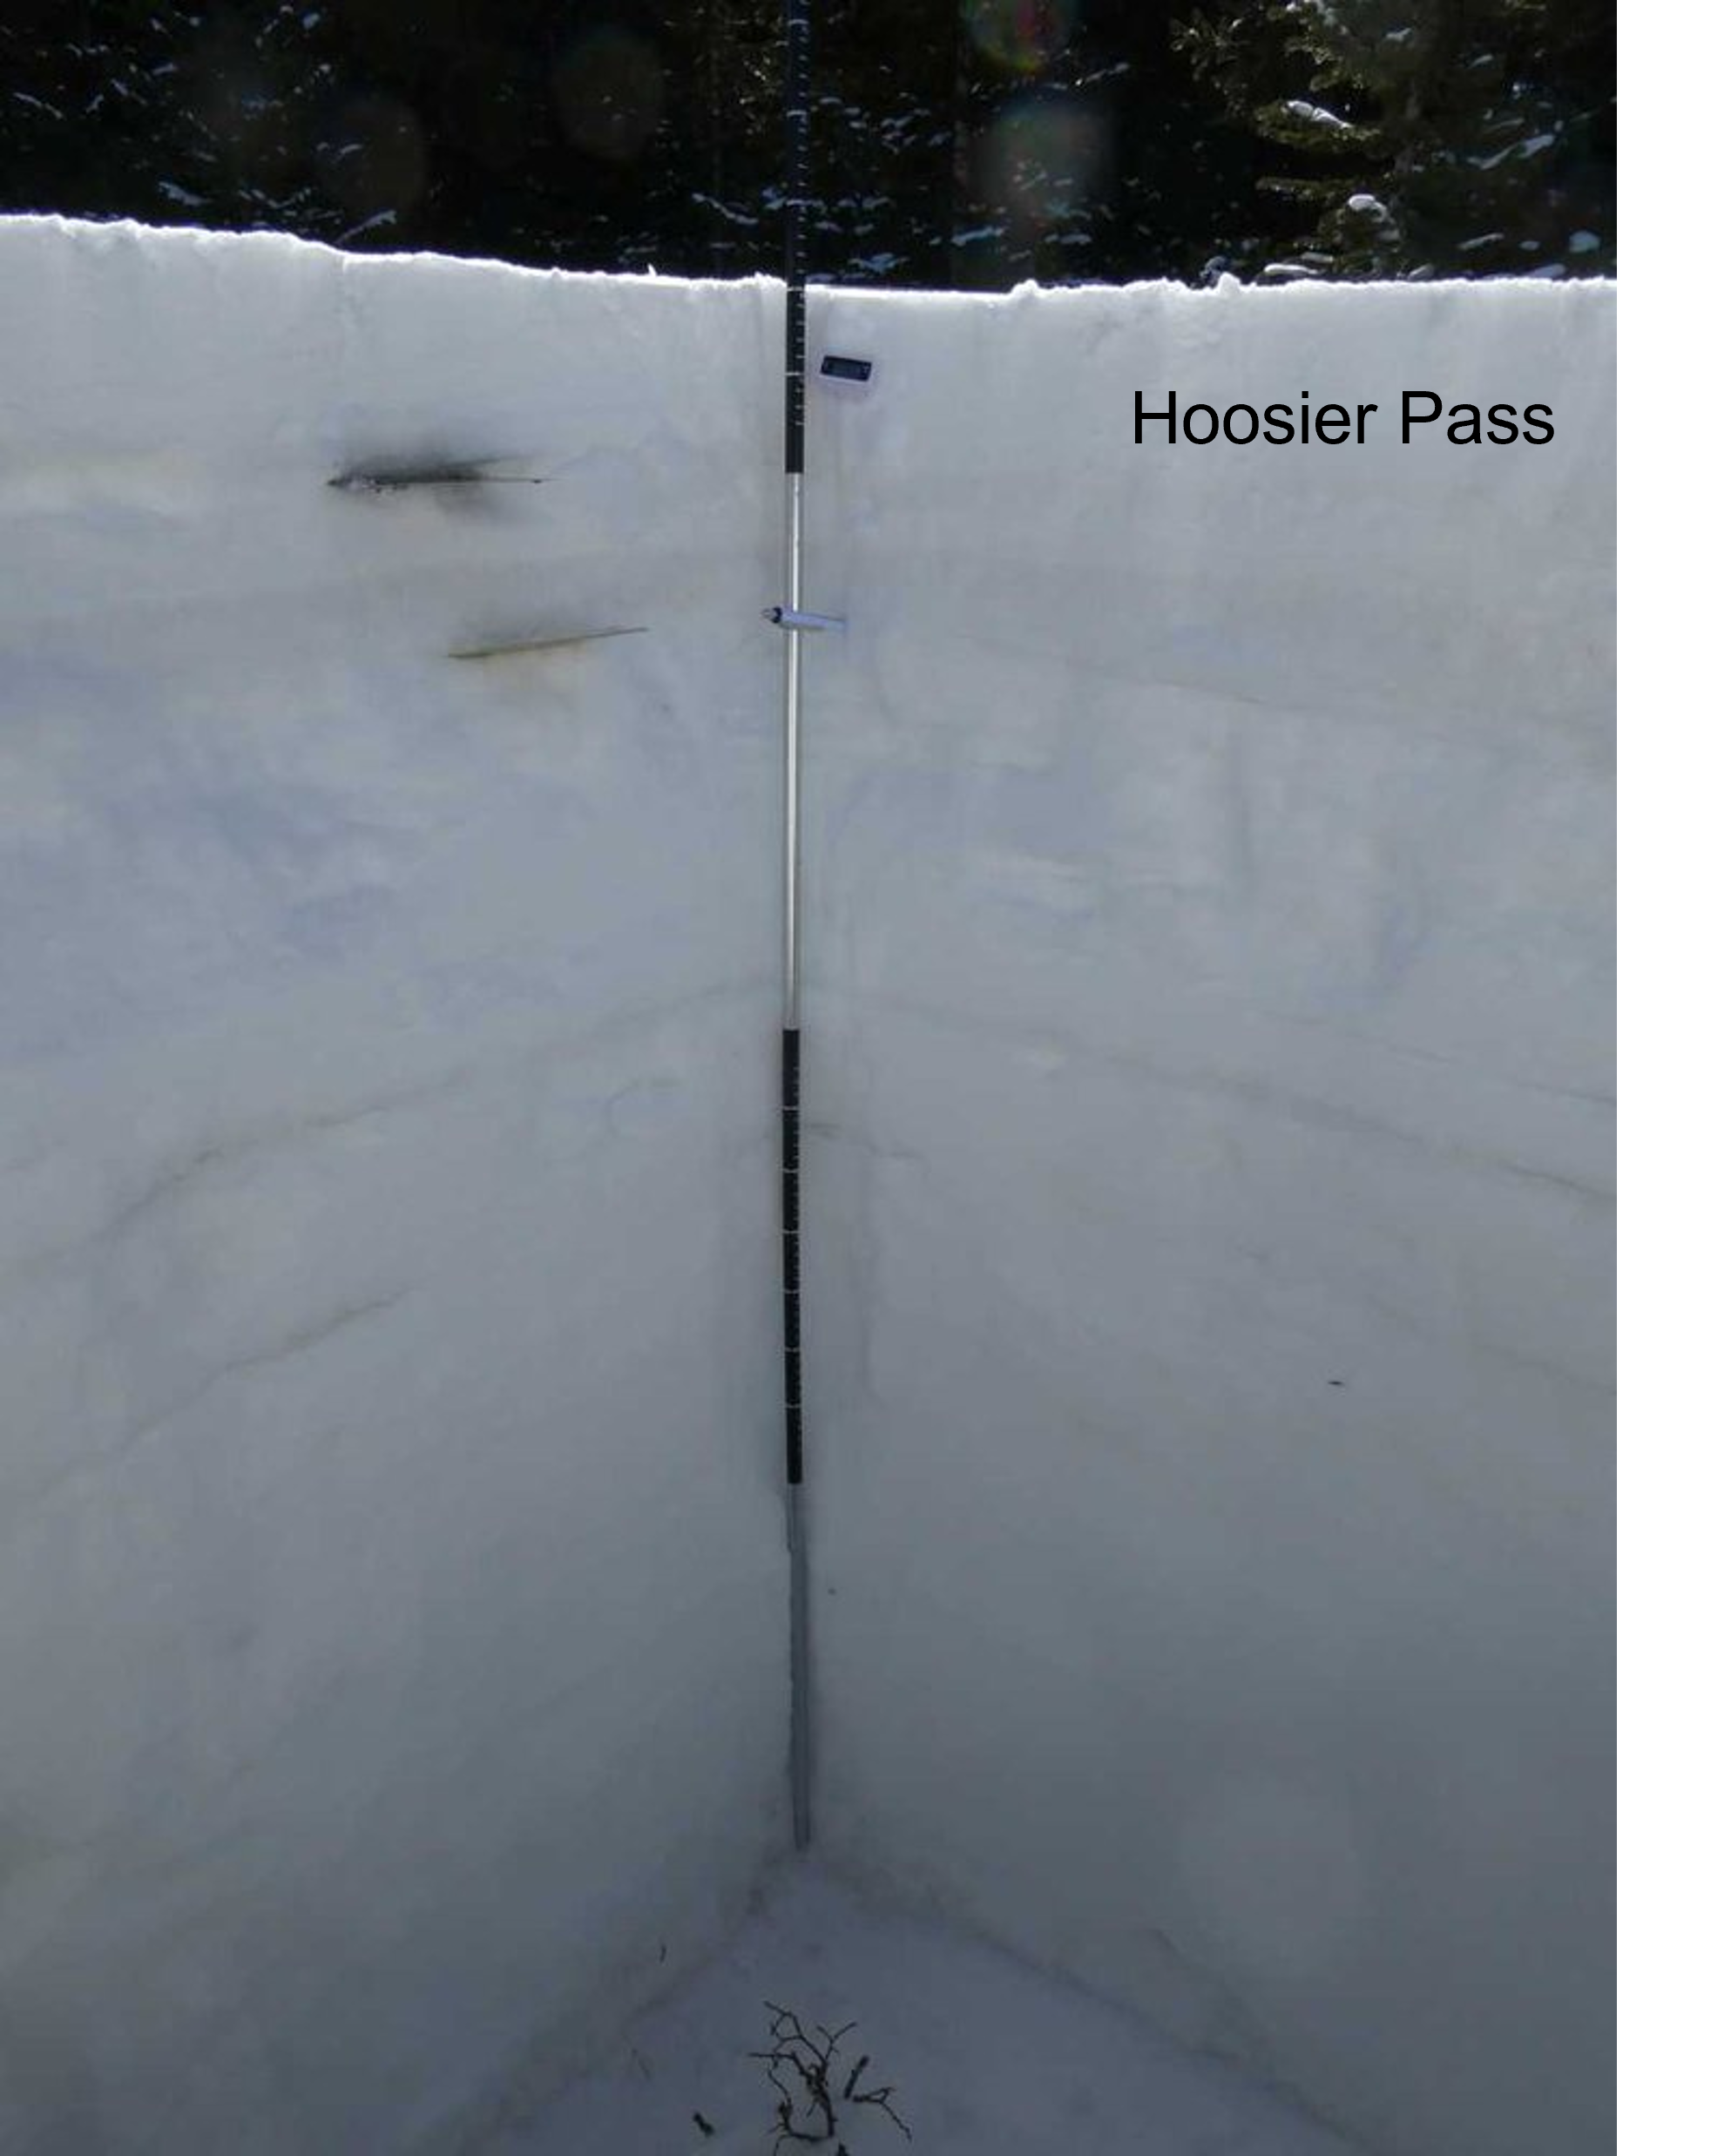
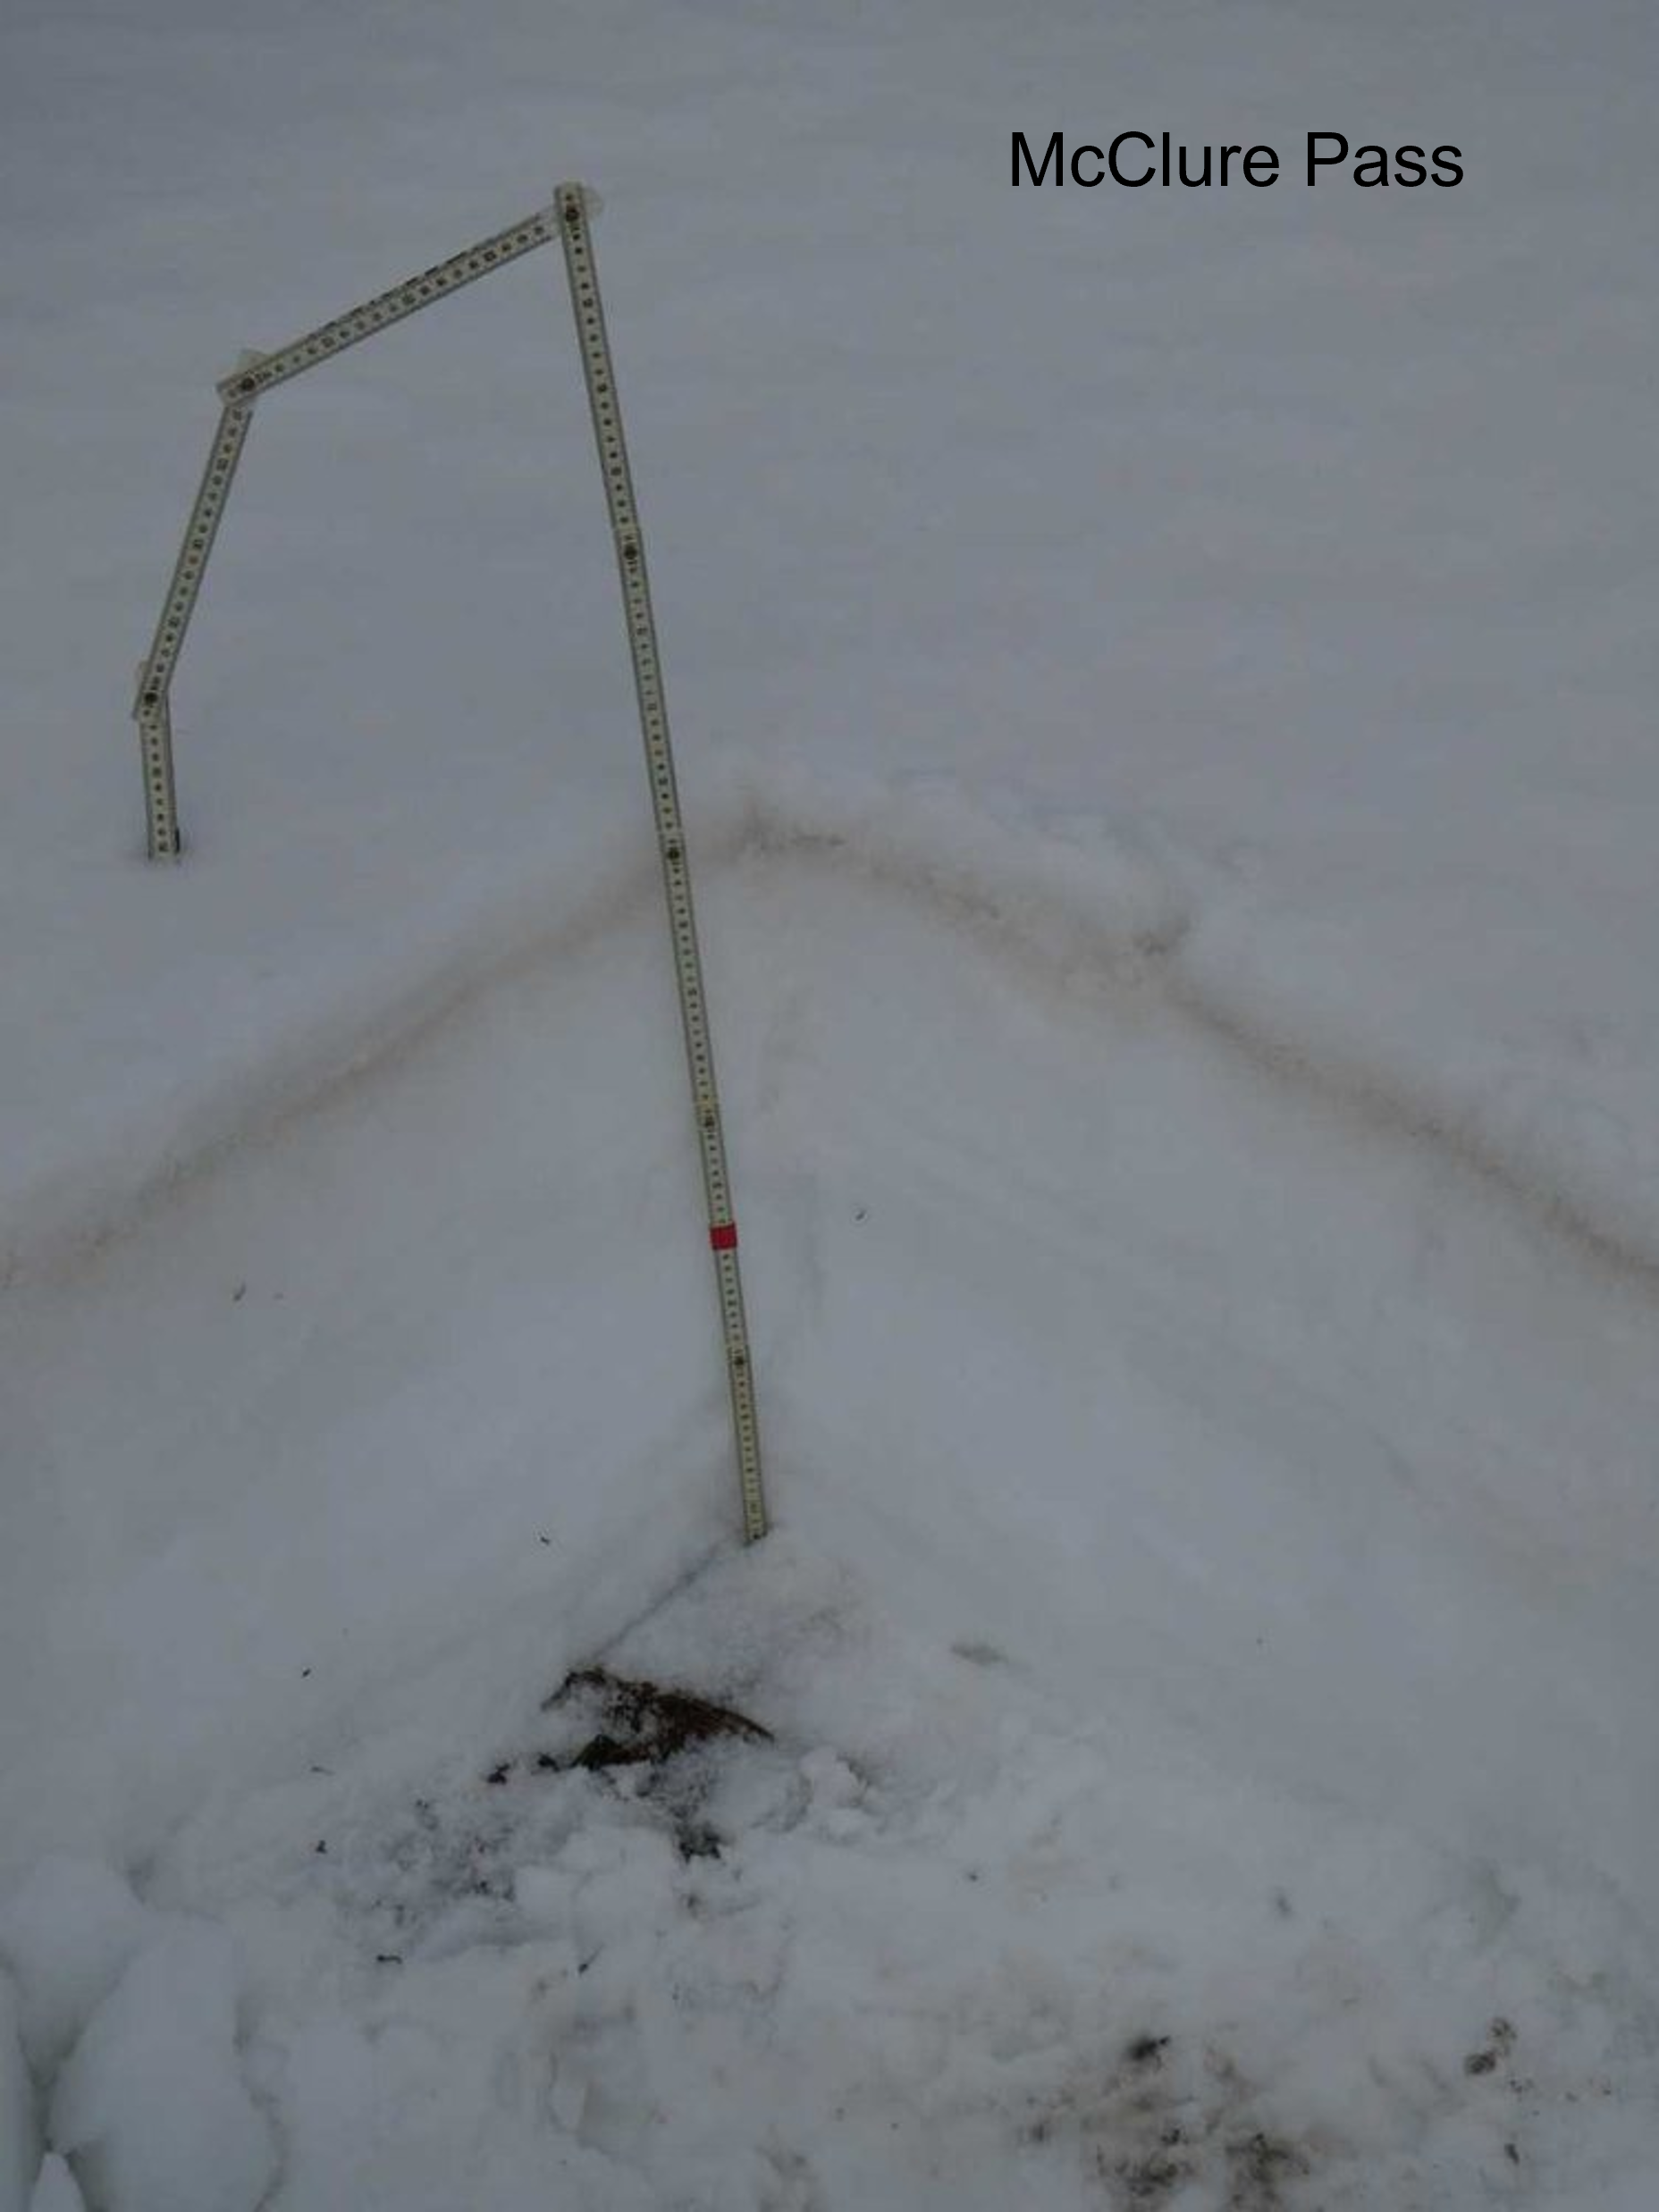
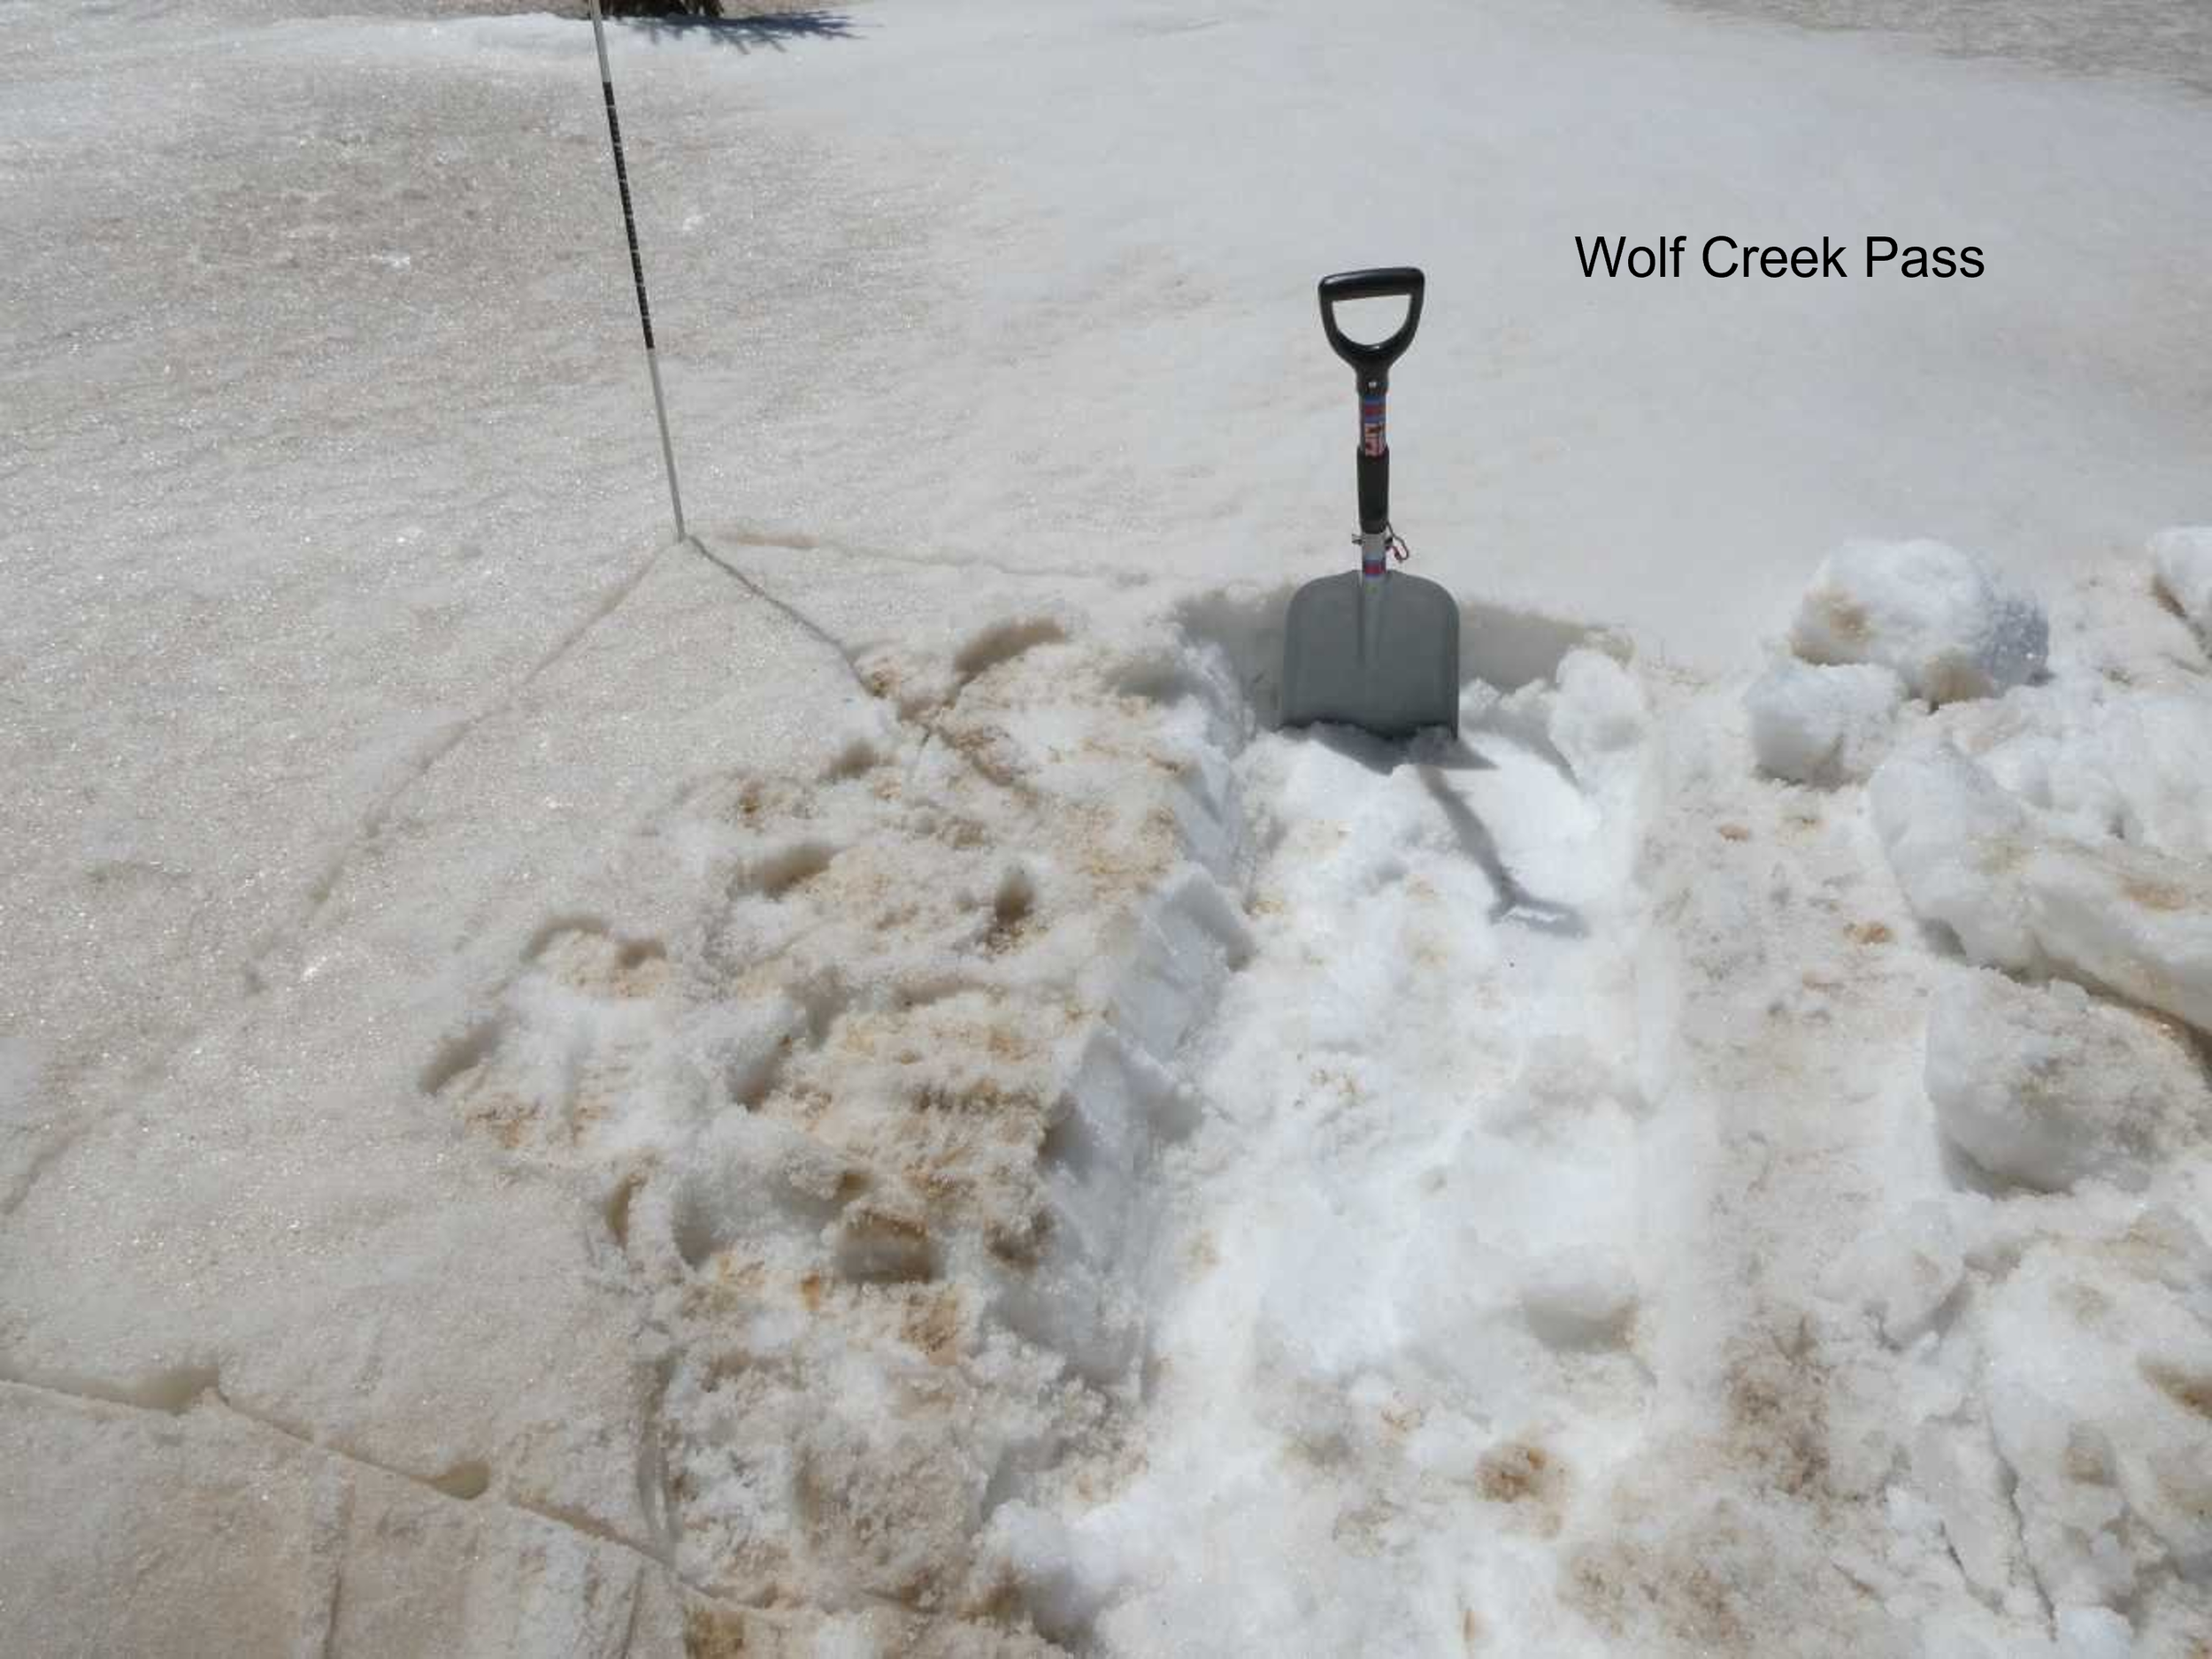
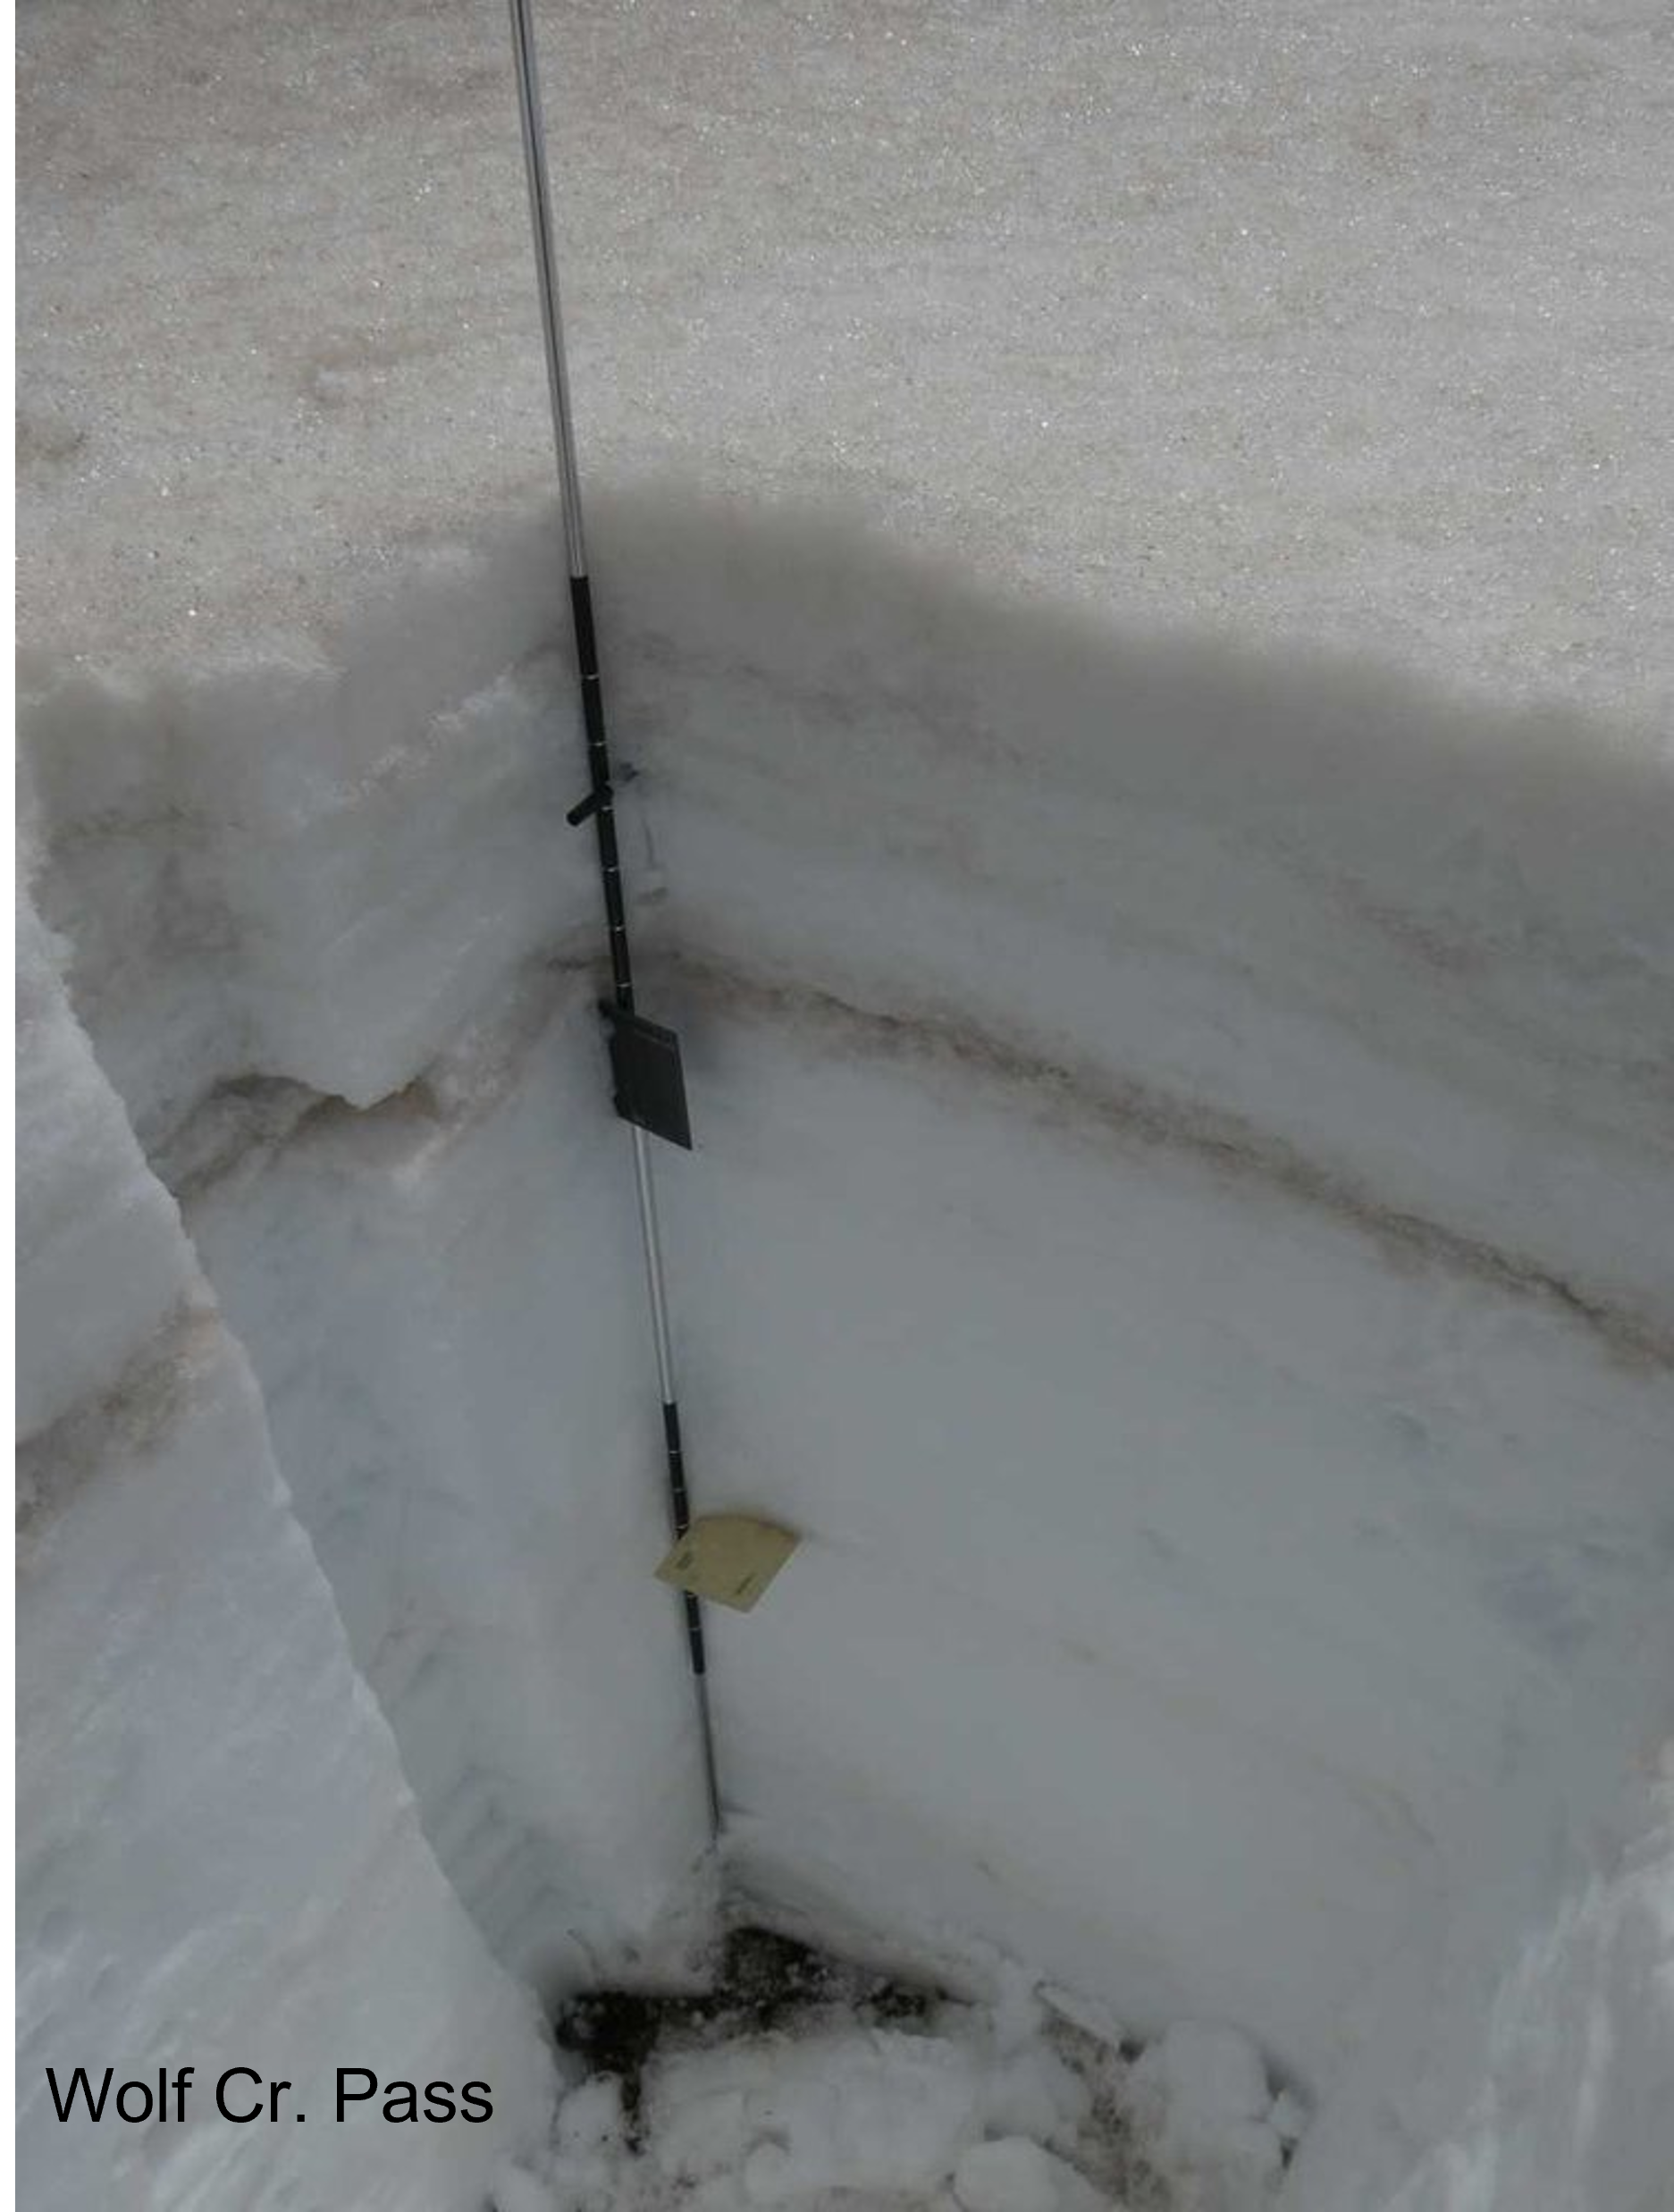
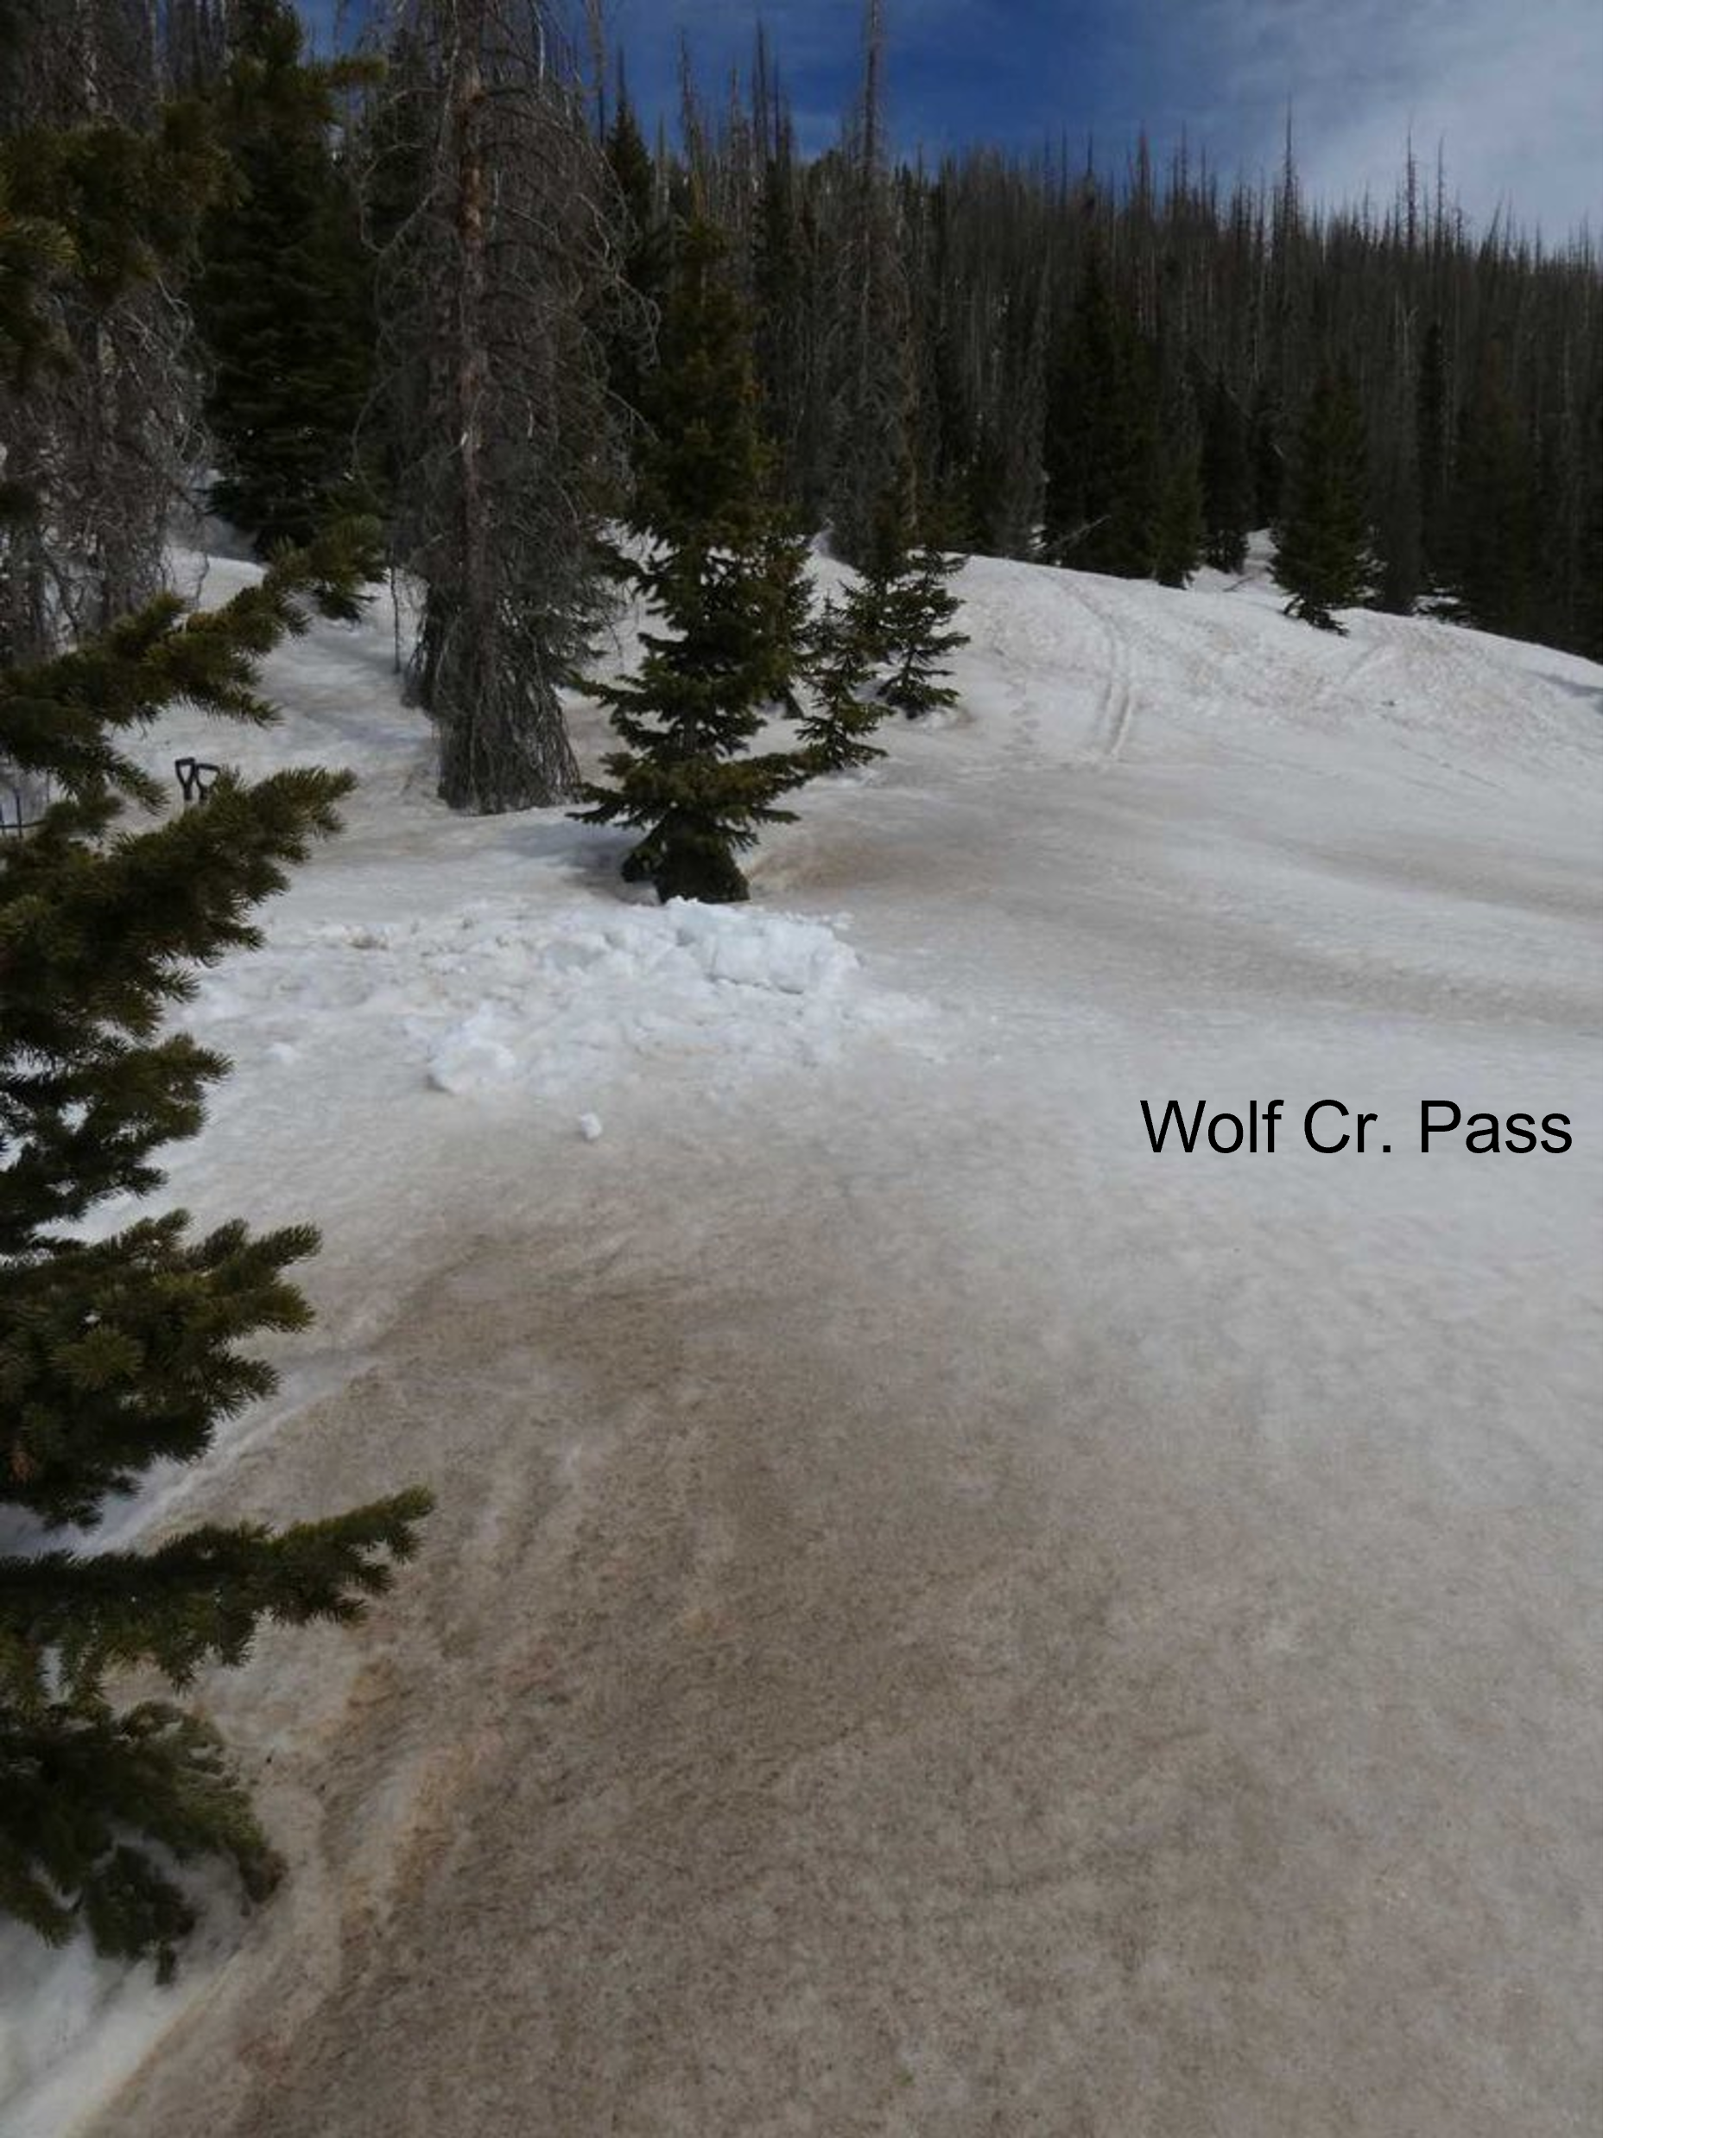
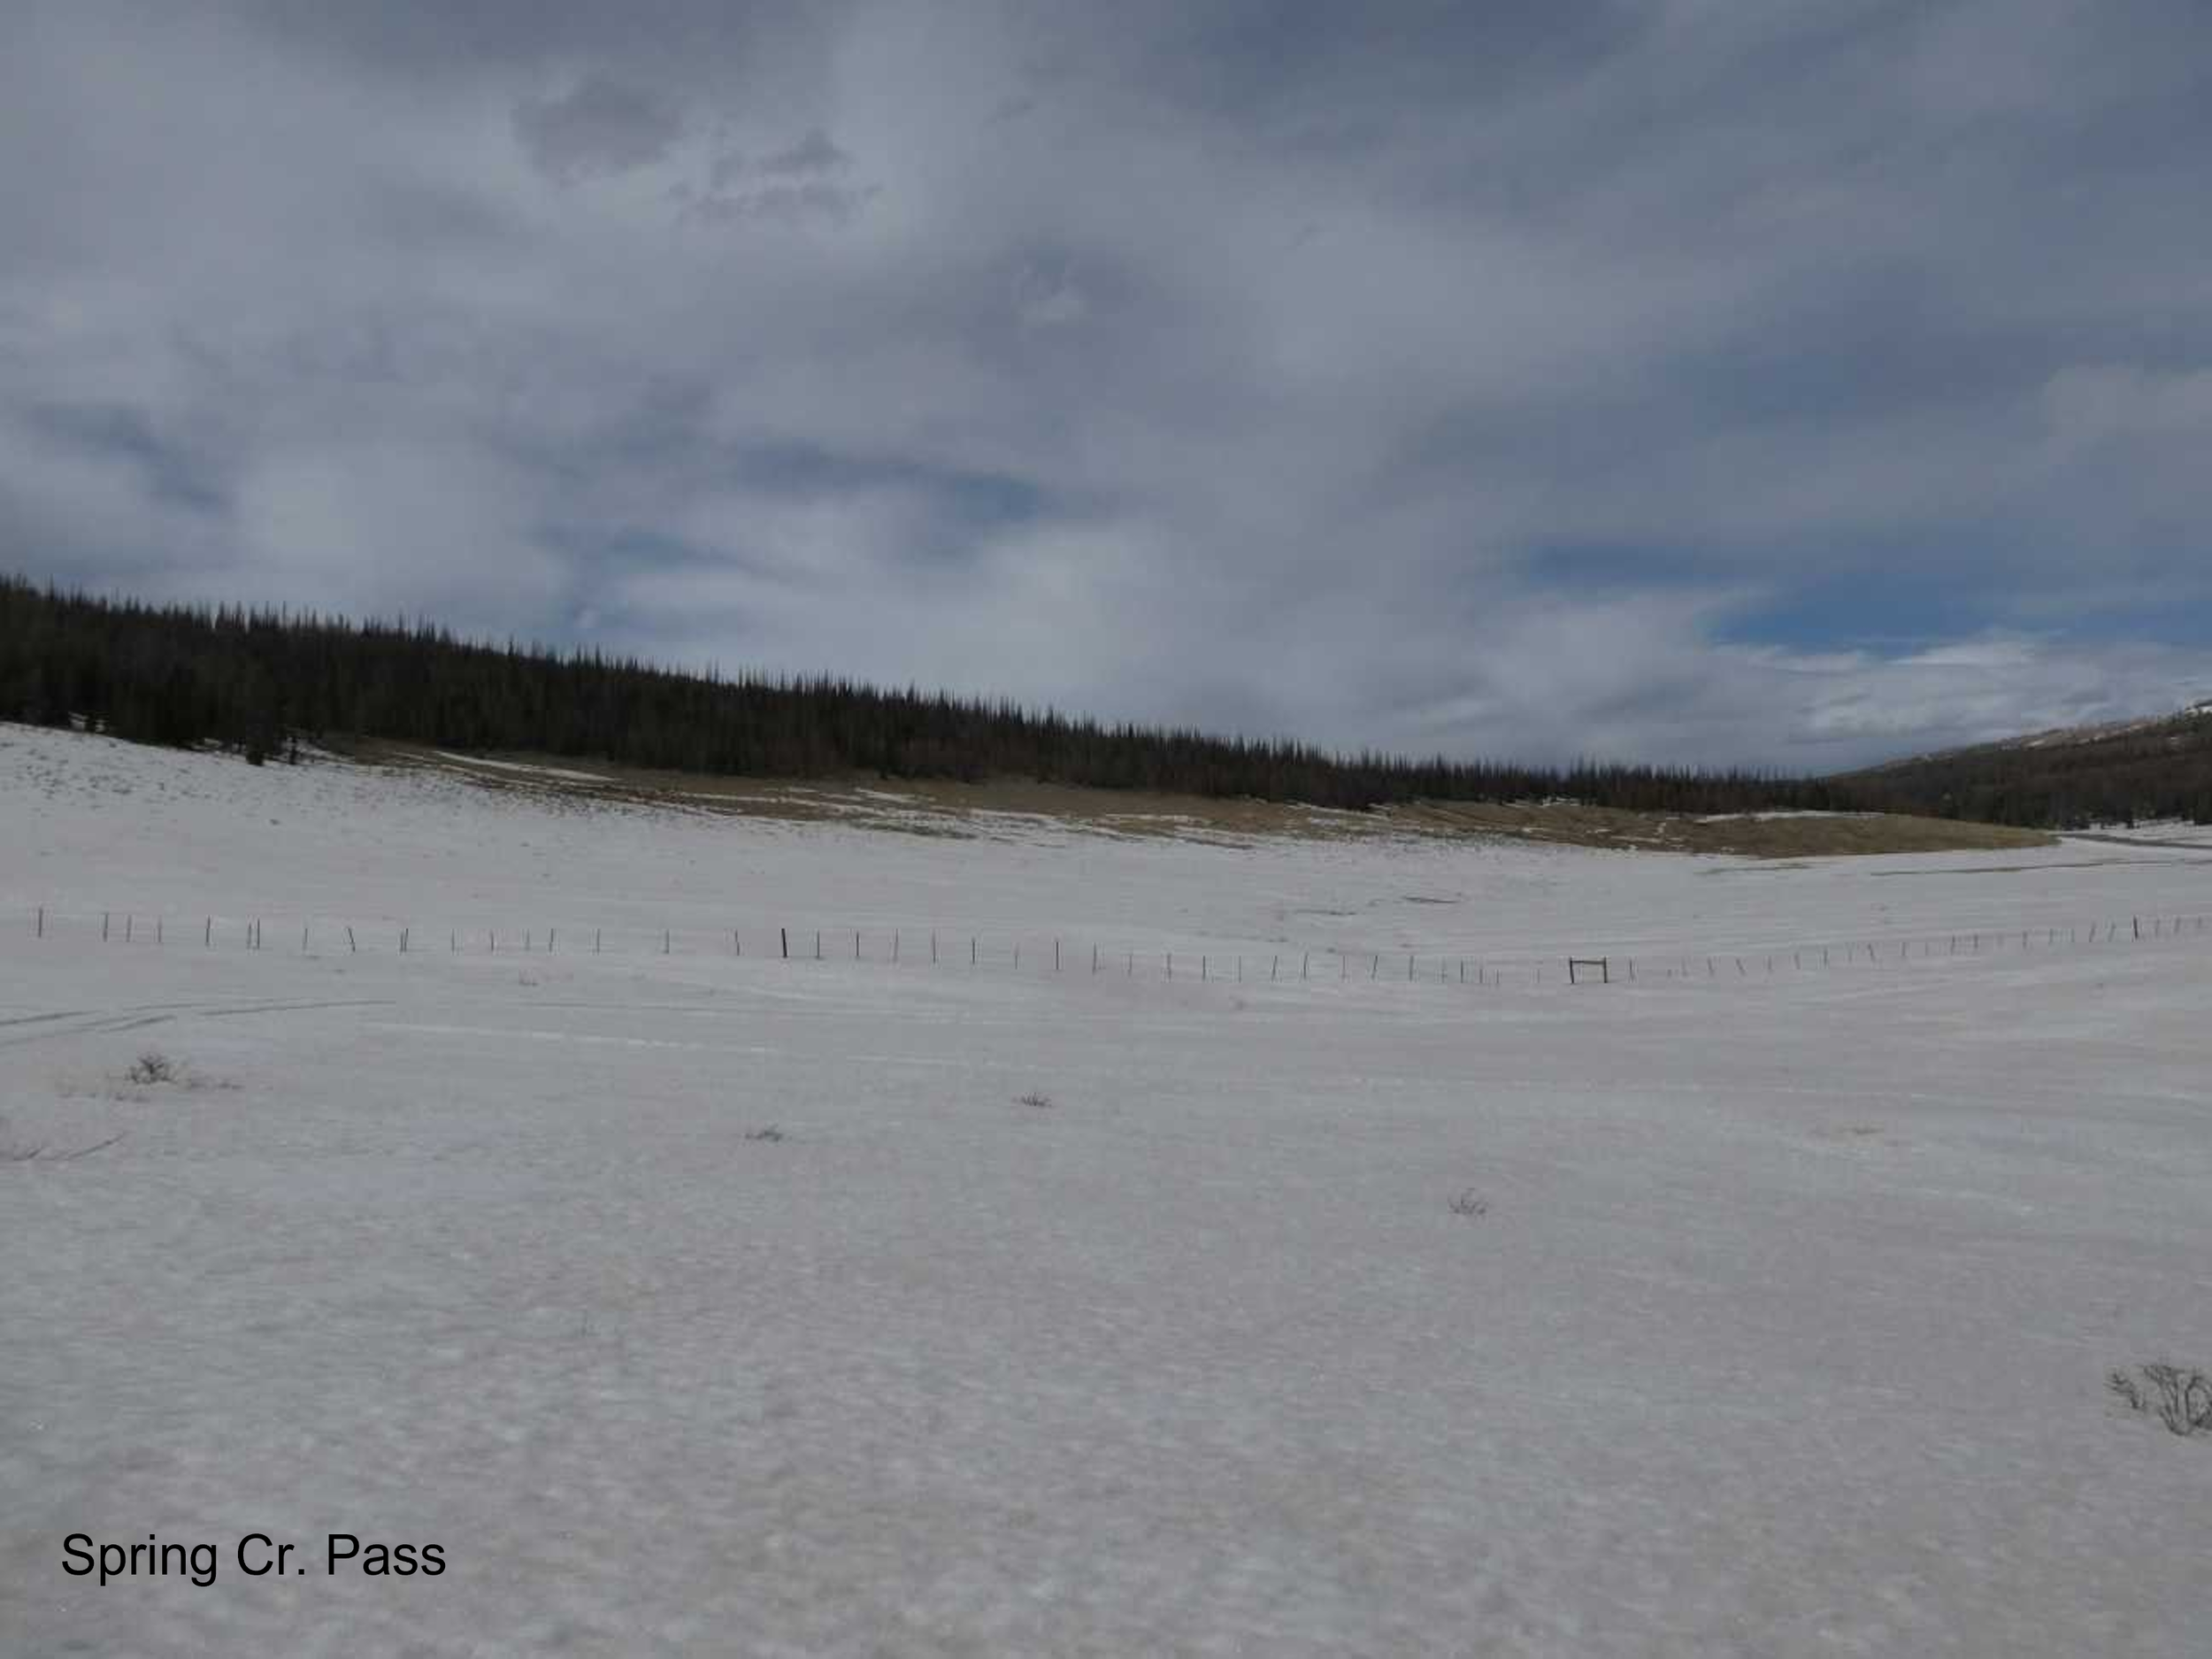
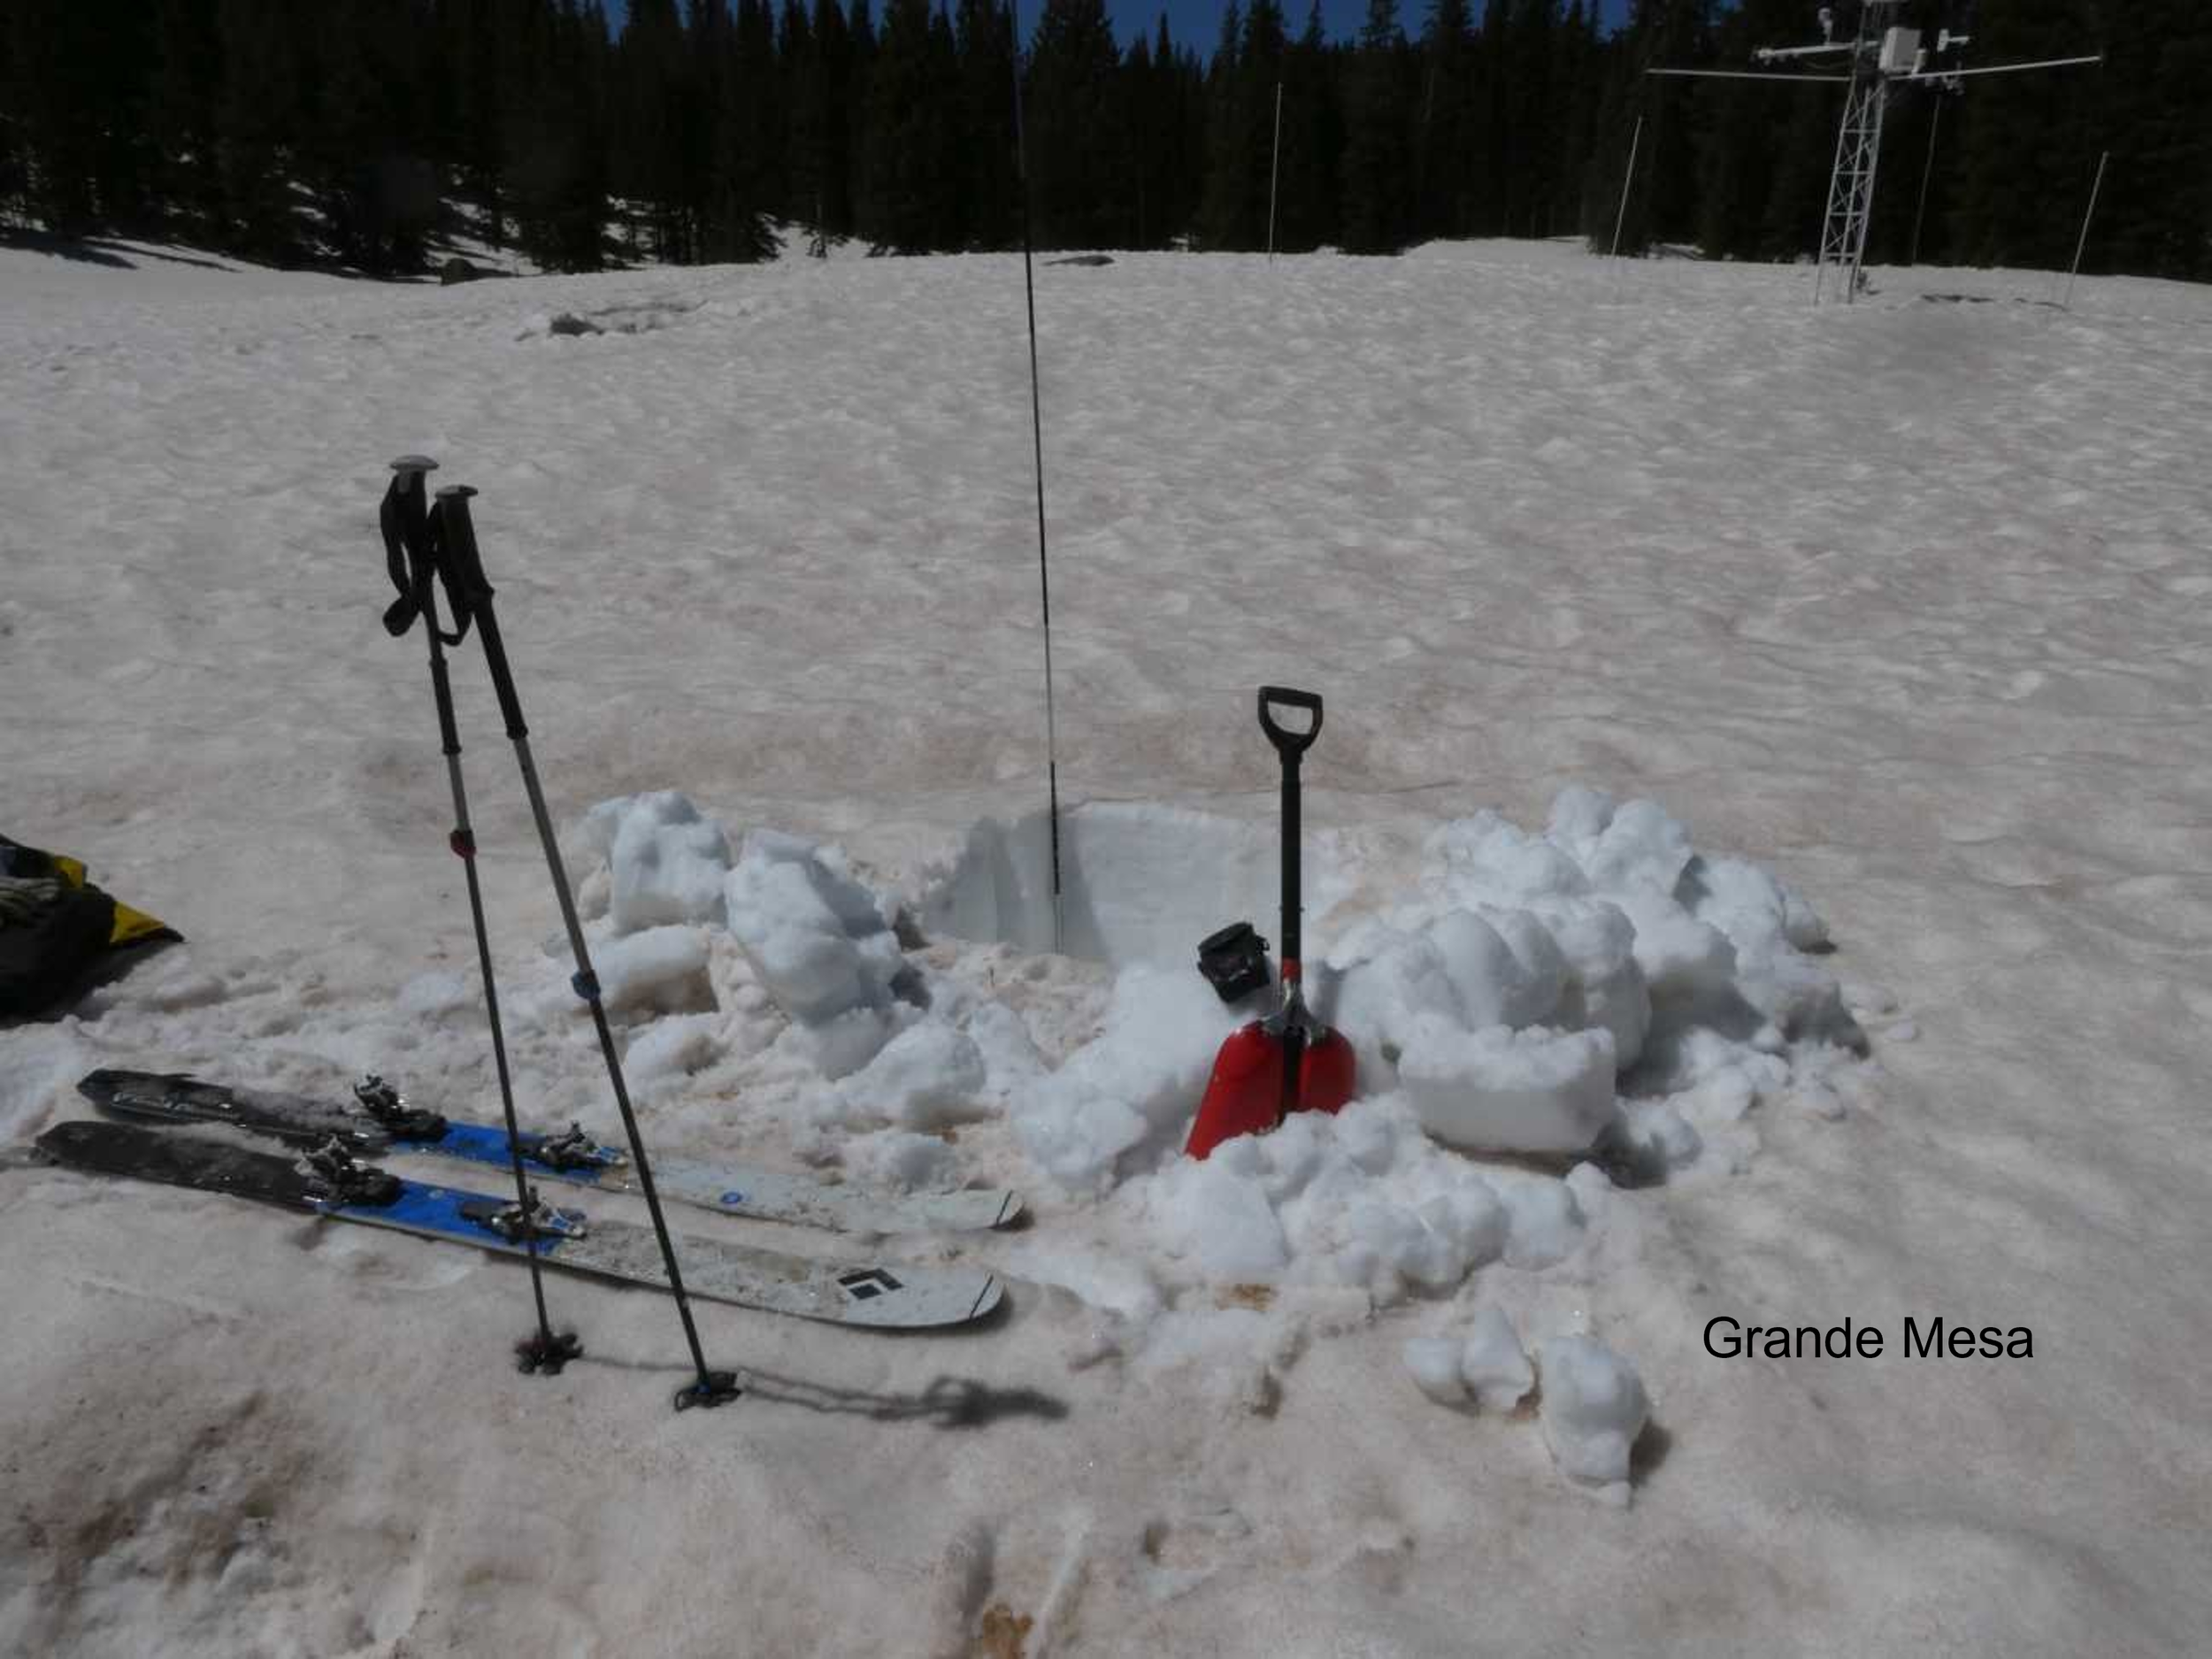
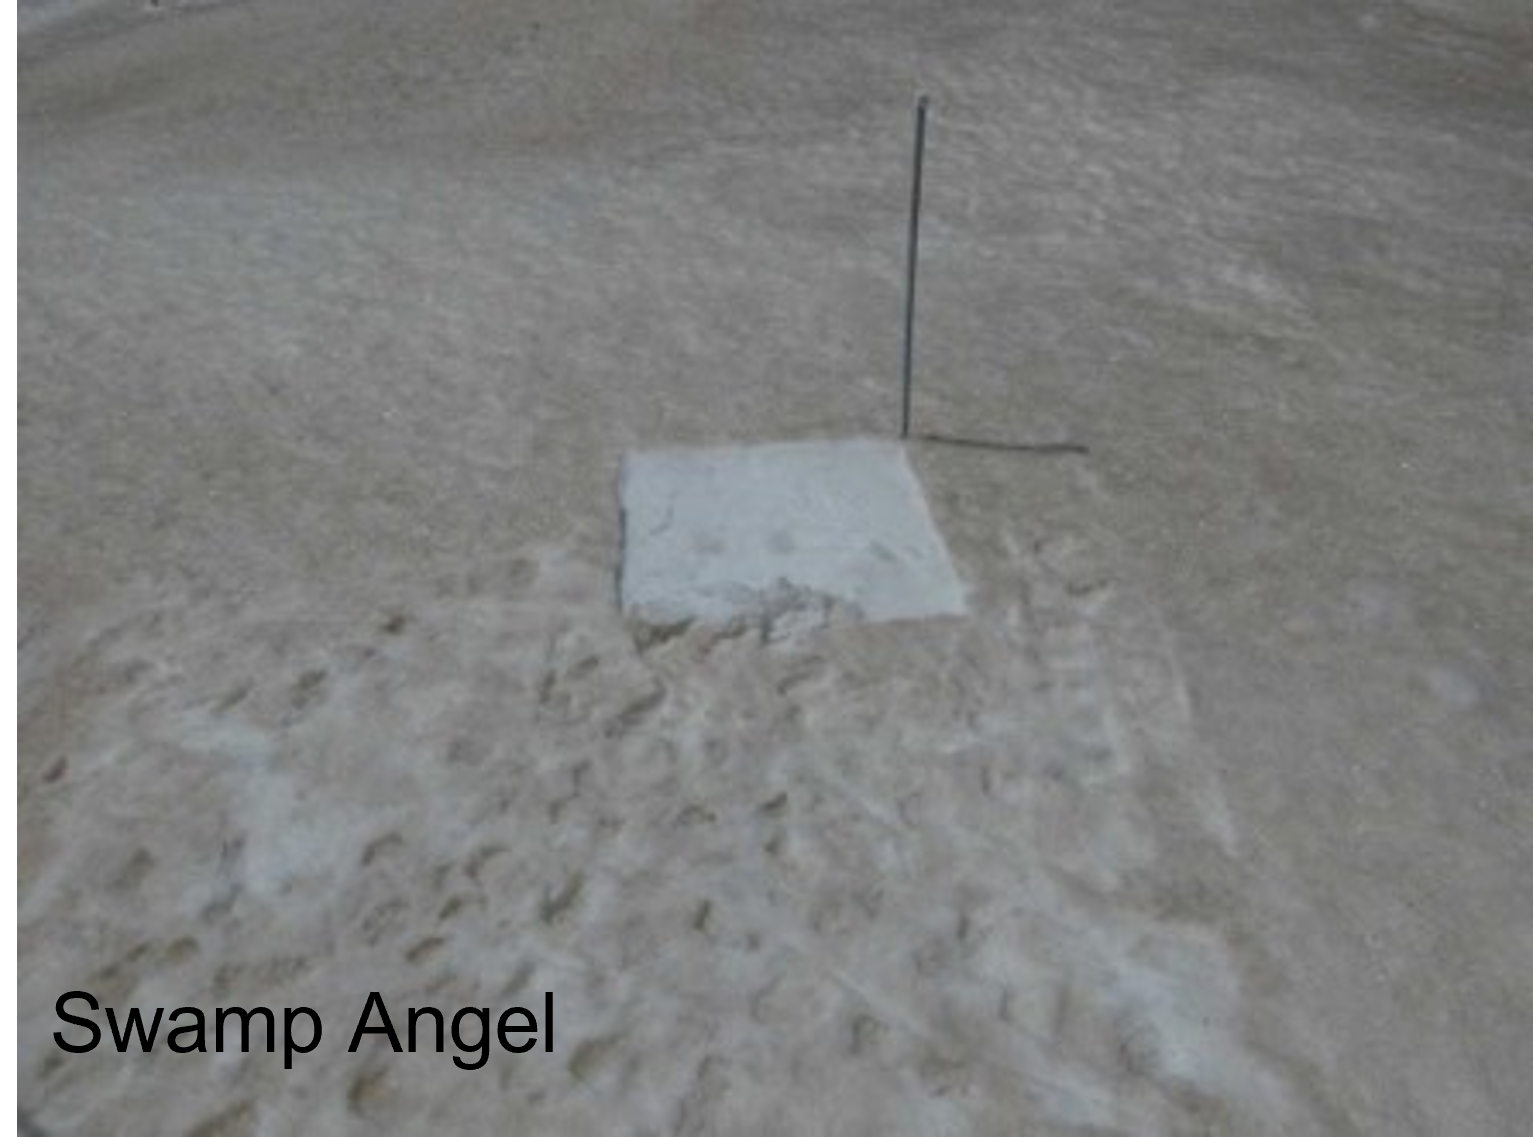
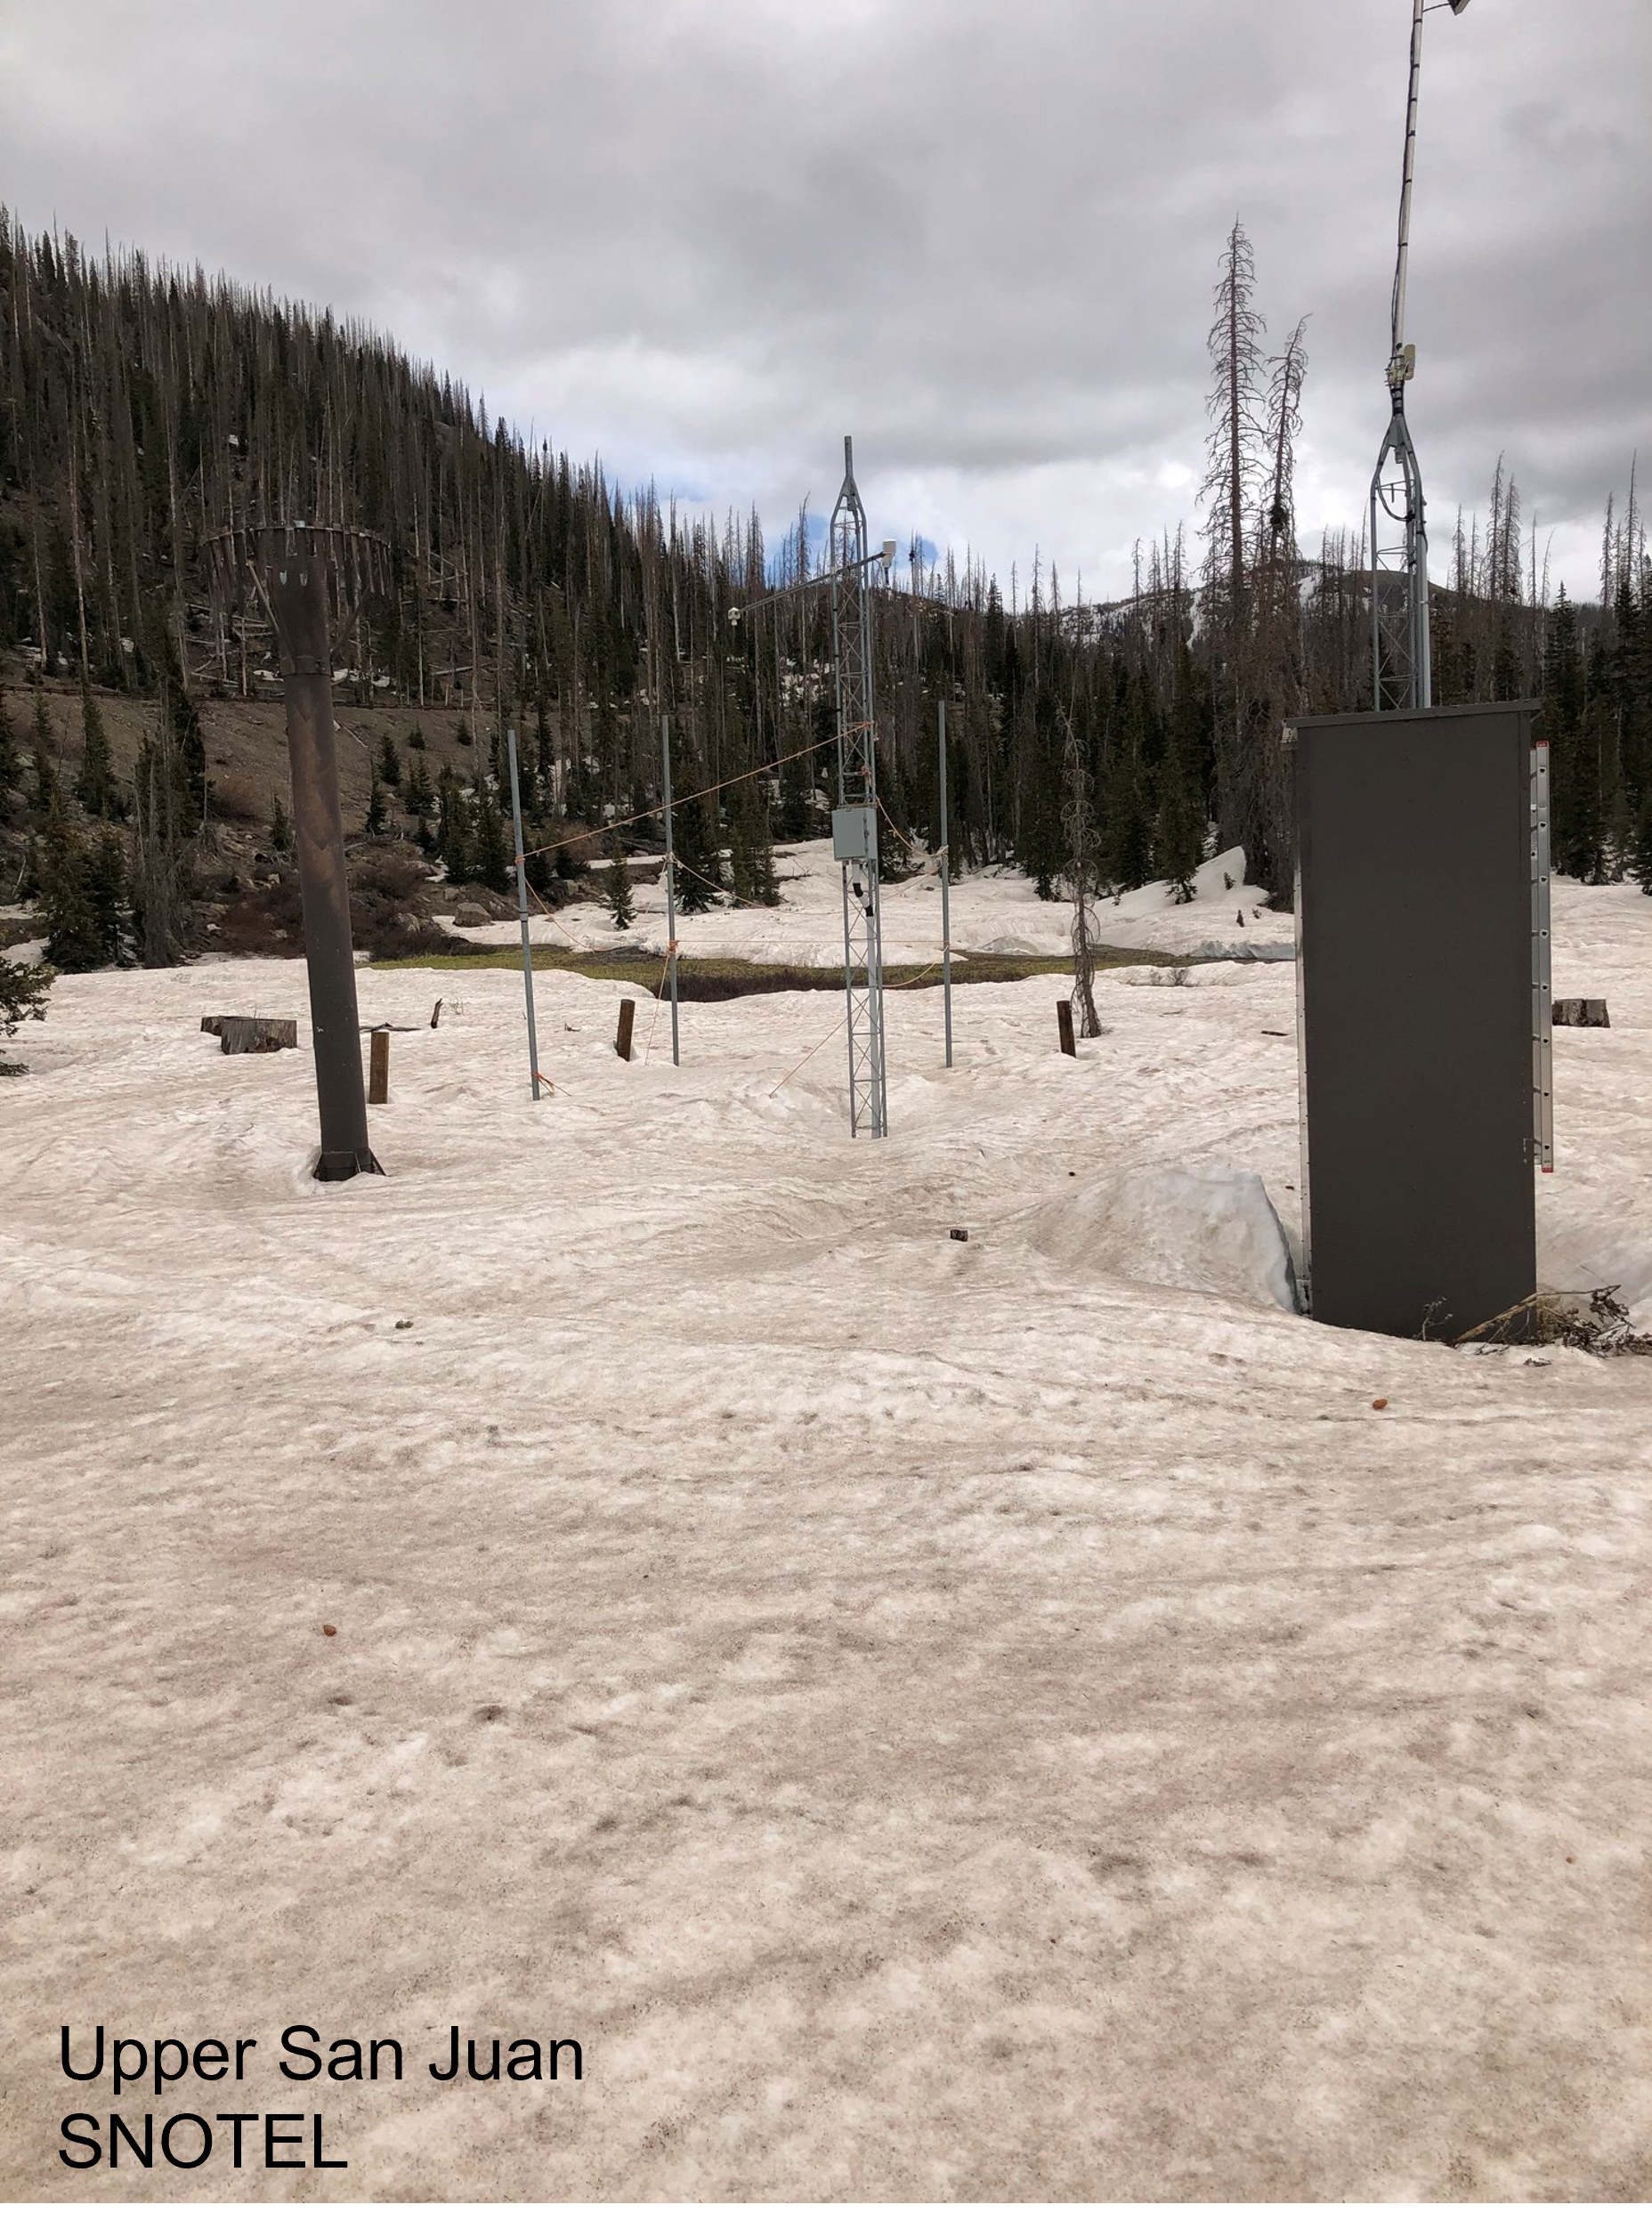
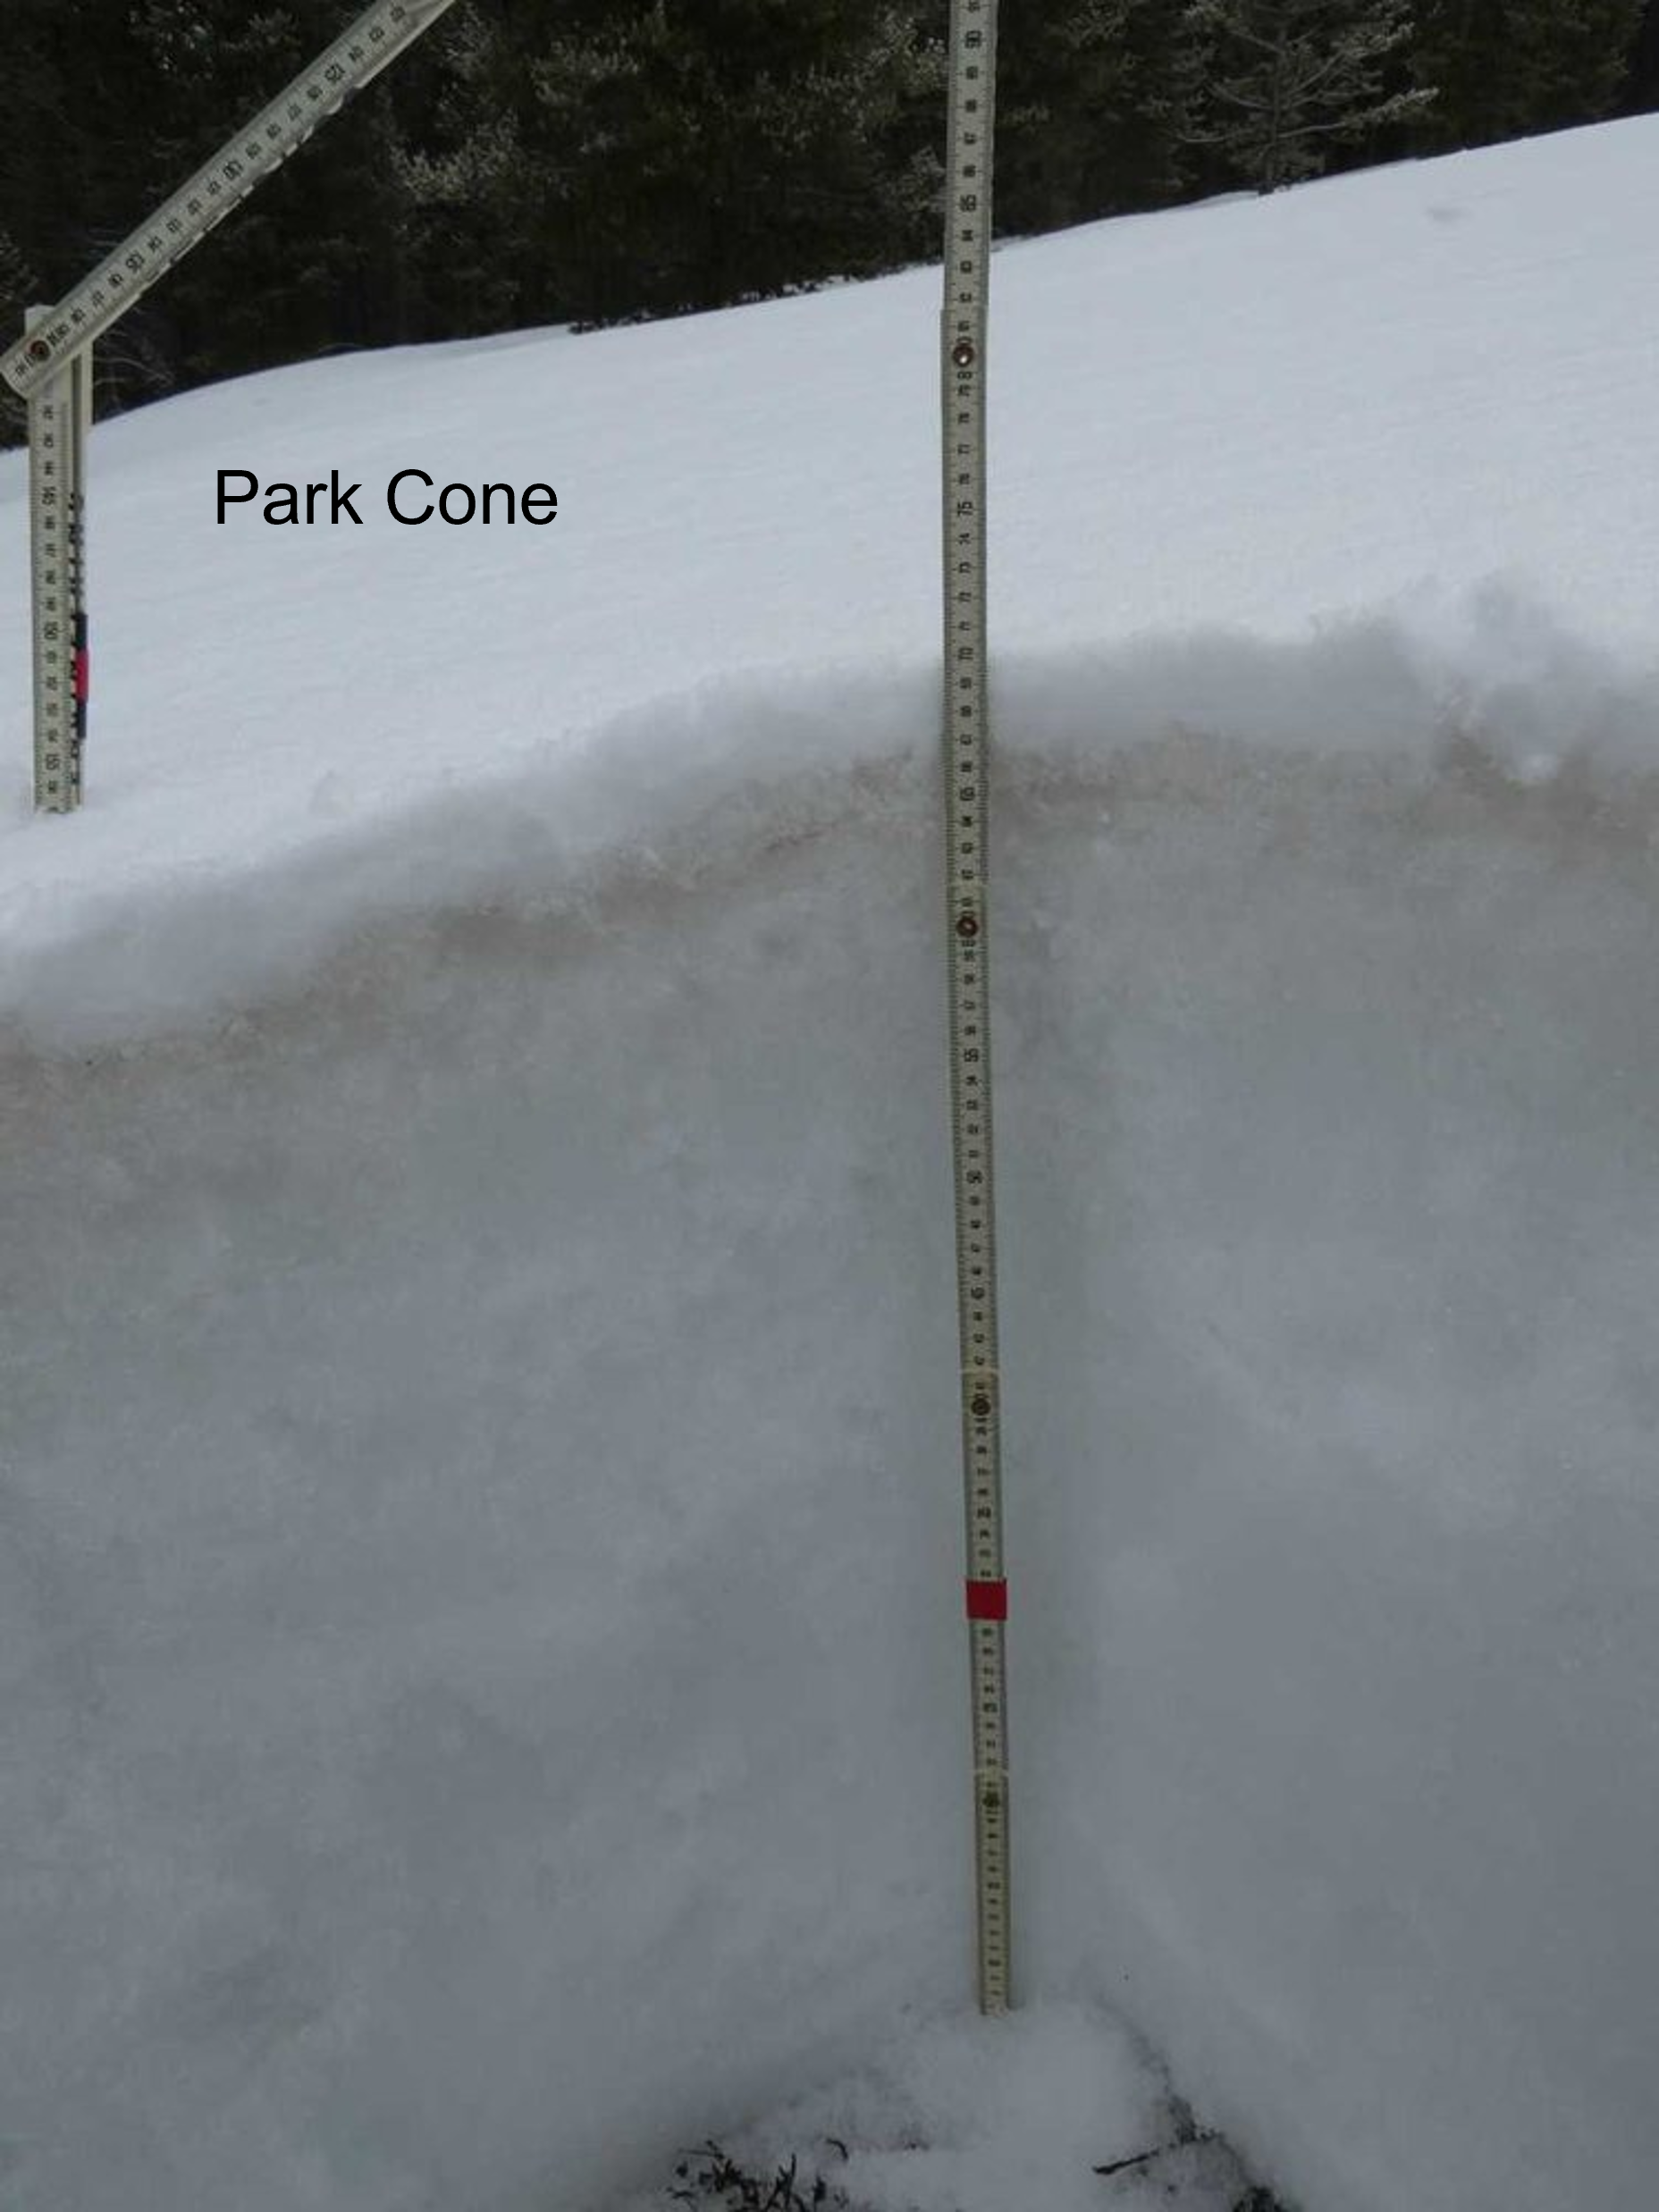
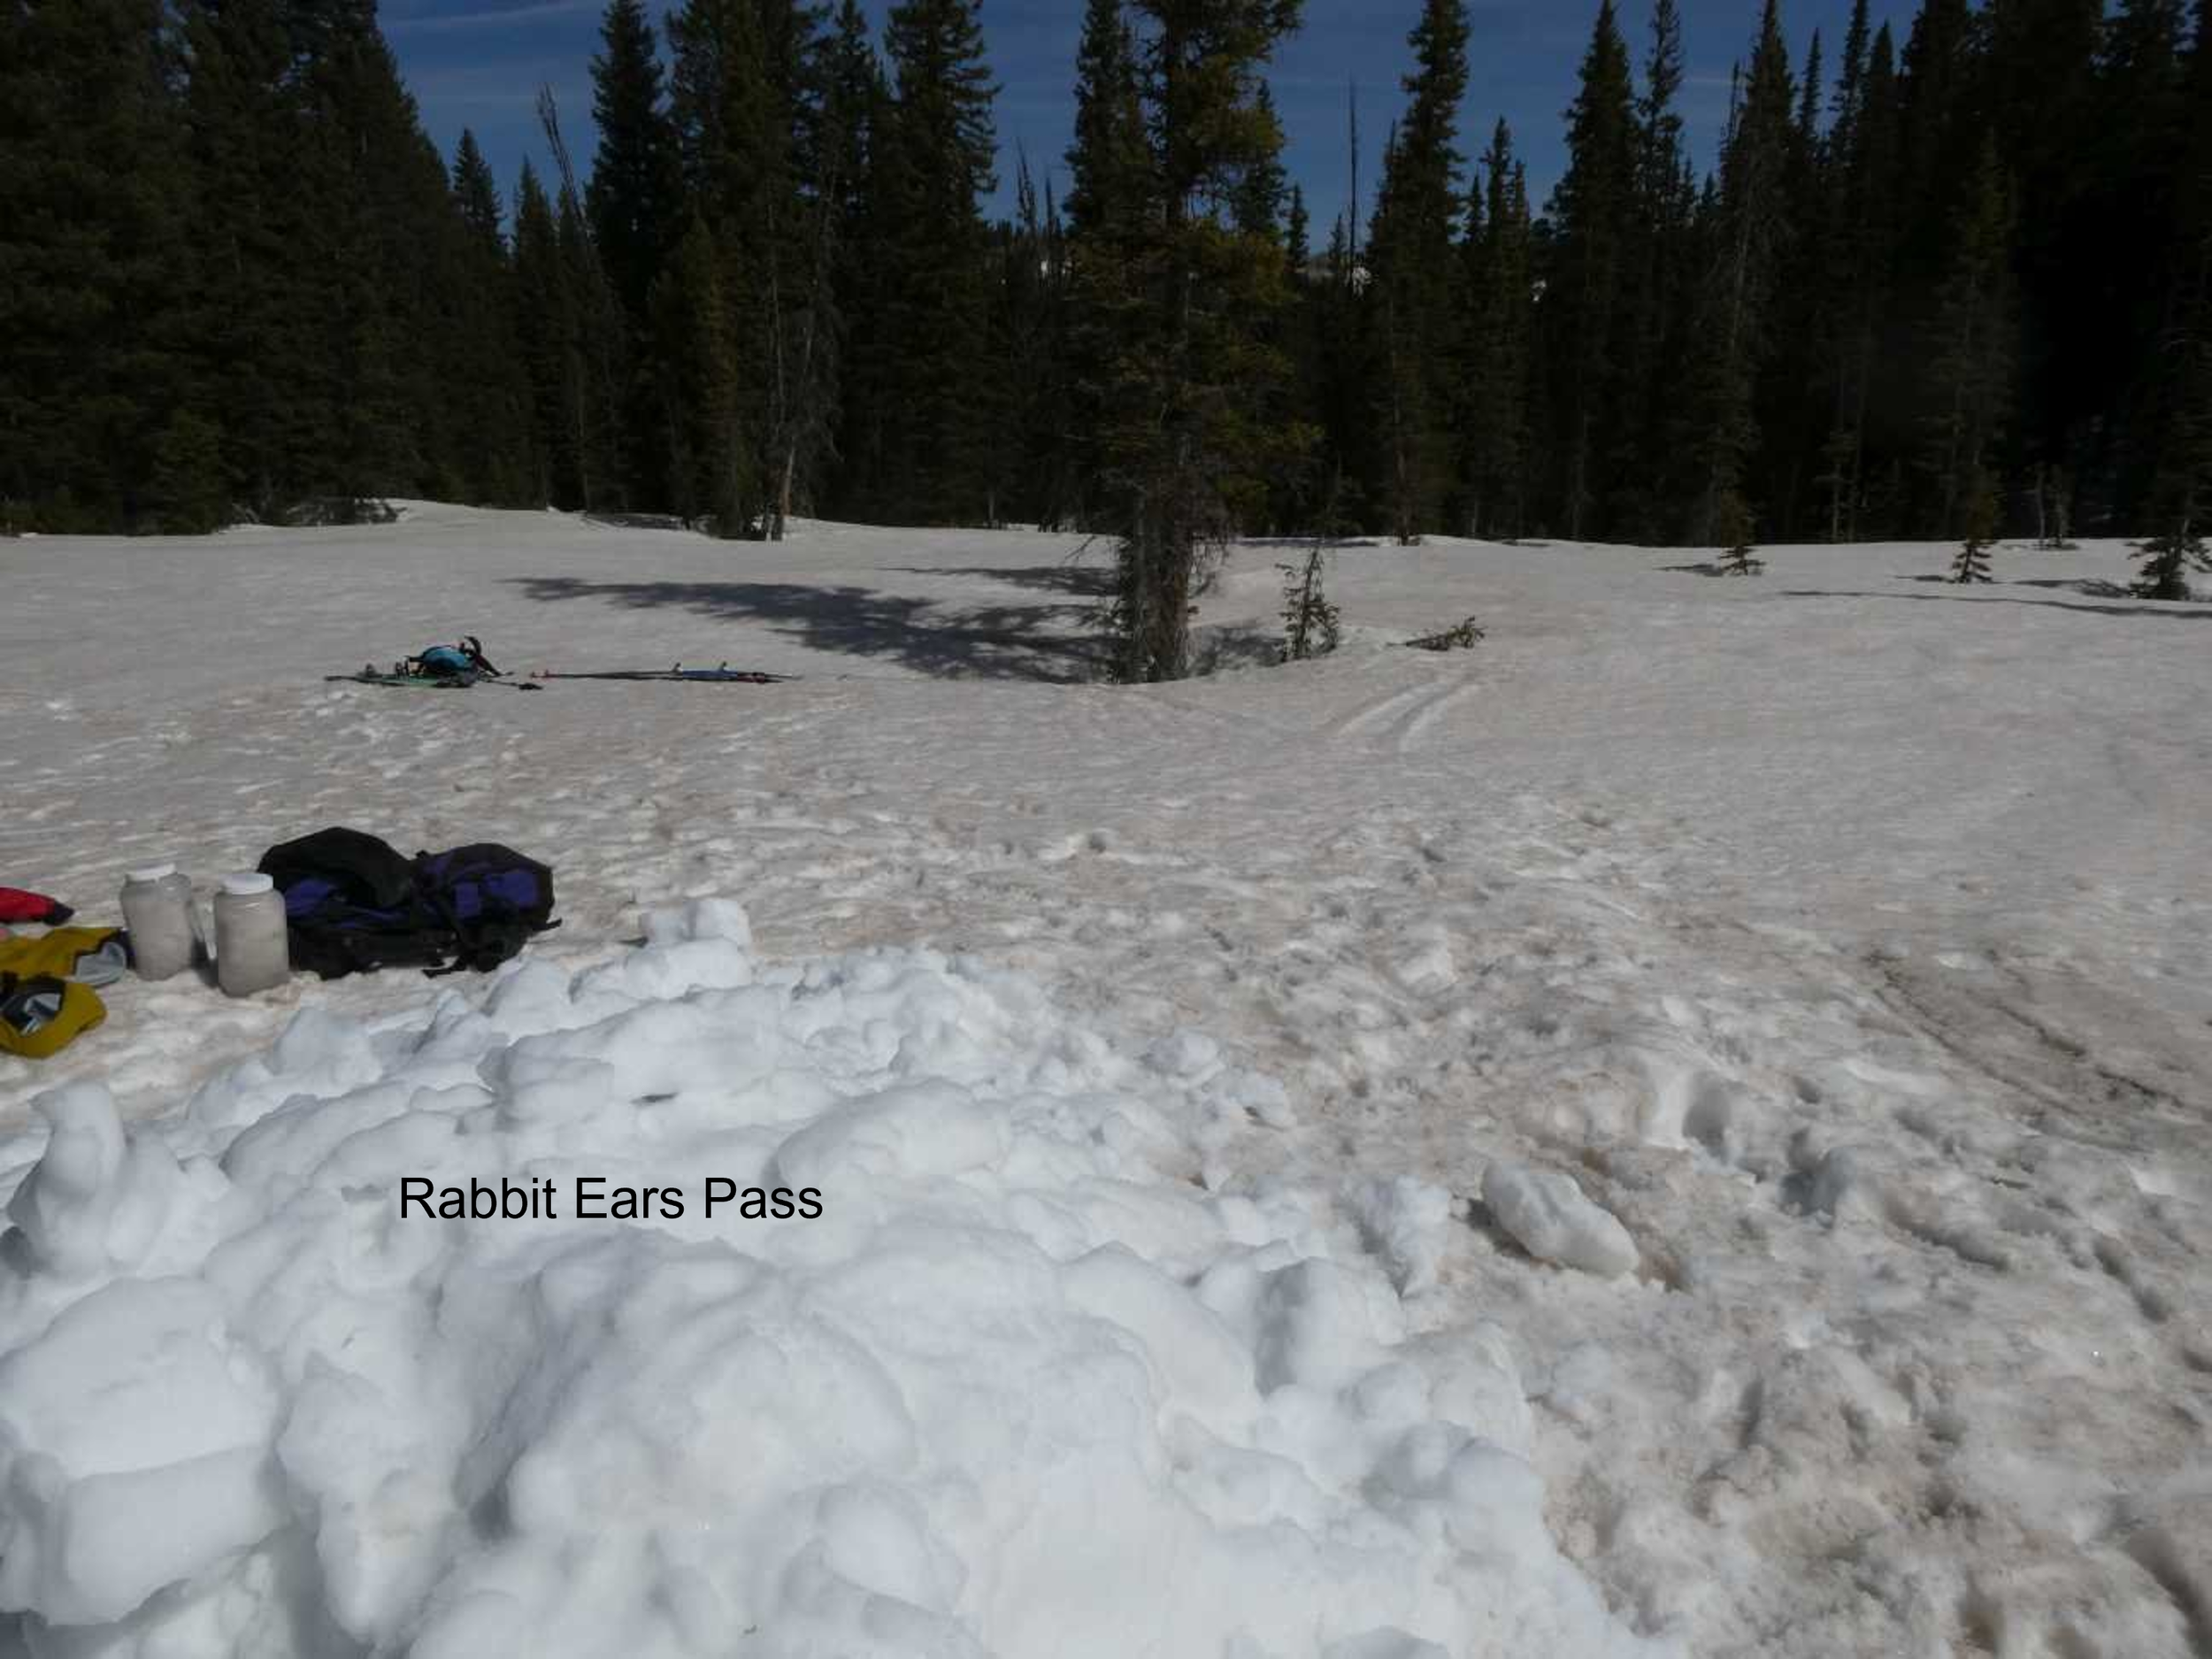
Above: Select photos of dust-on-snow and snowpack conditions for winter WY2022.
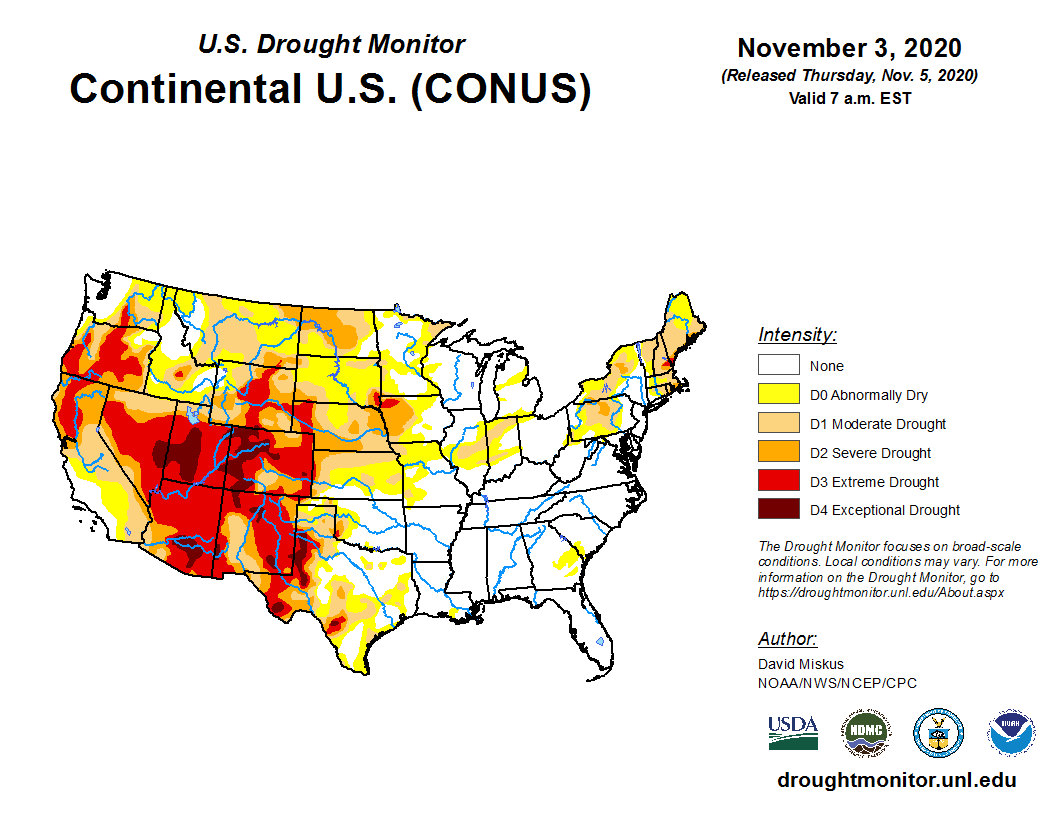
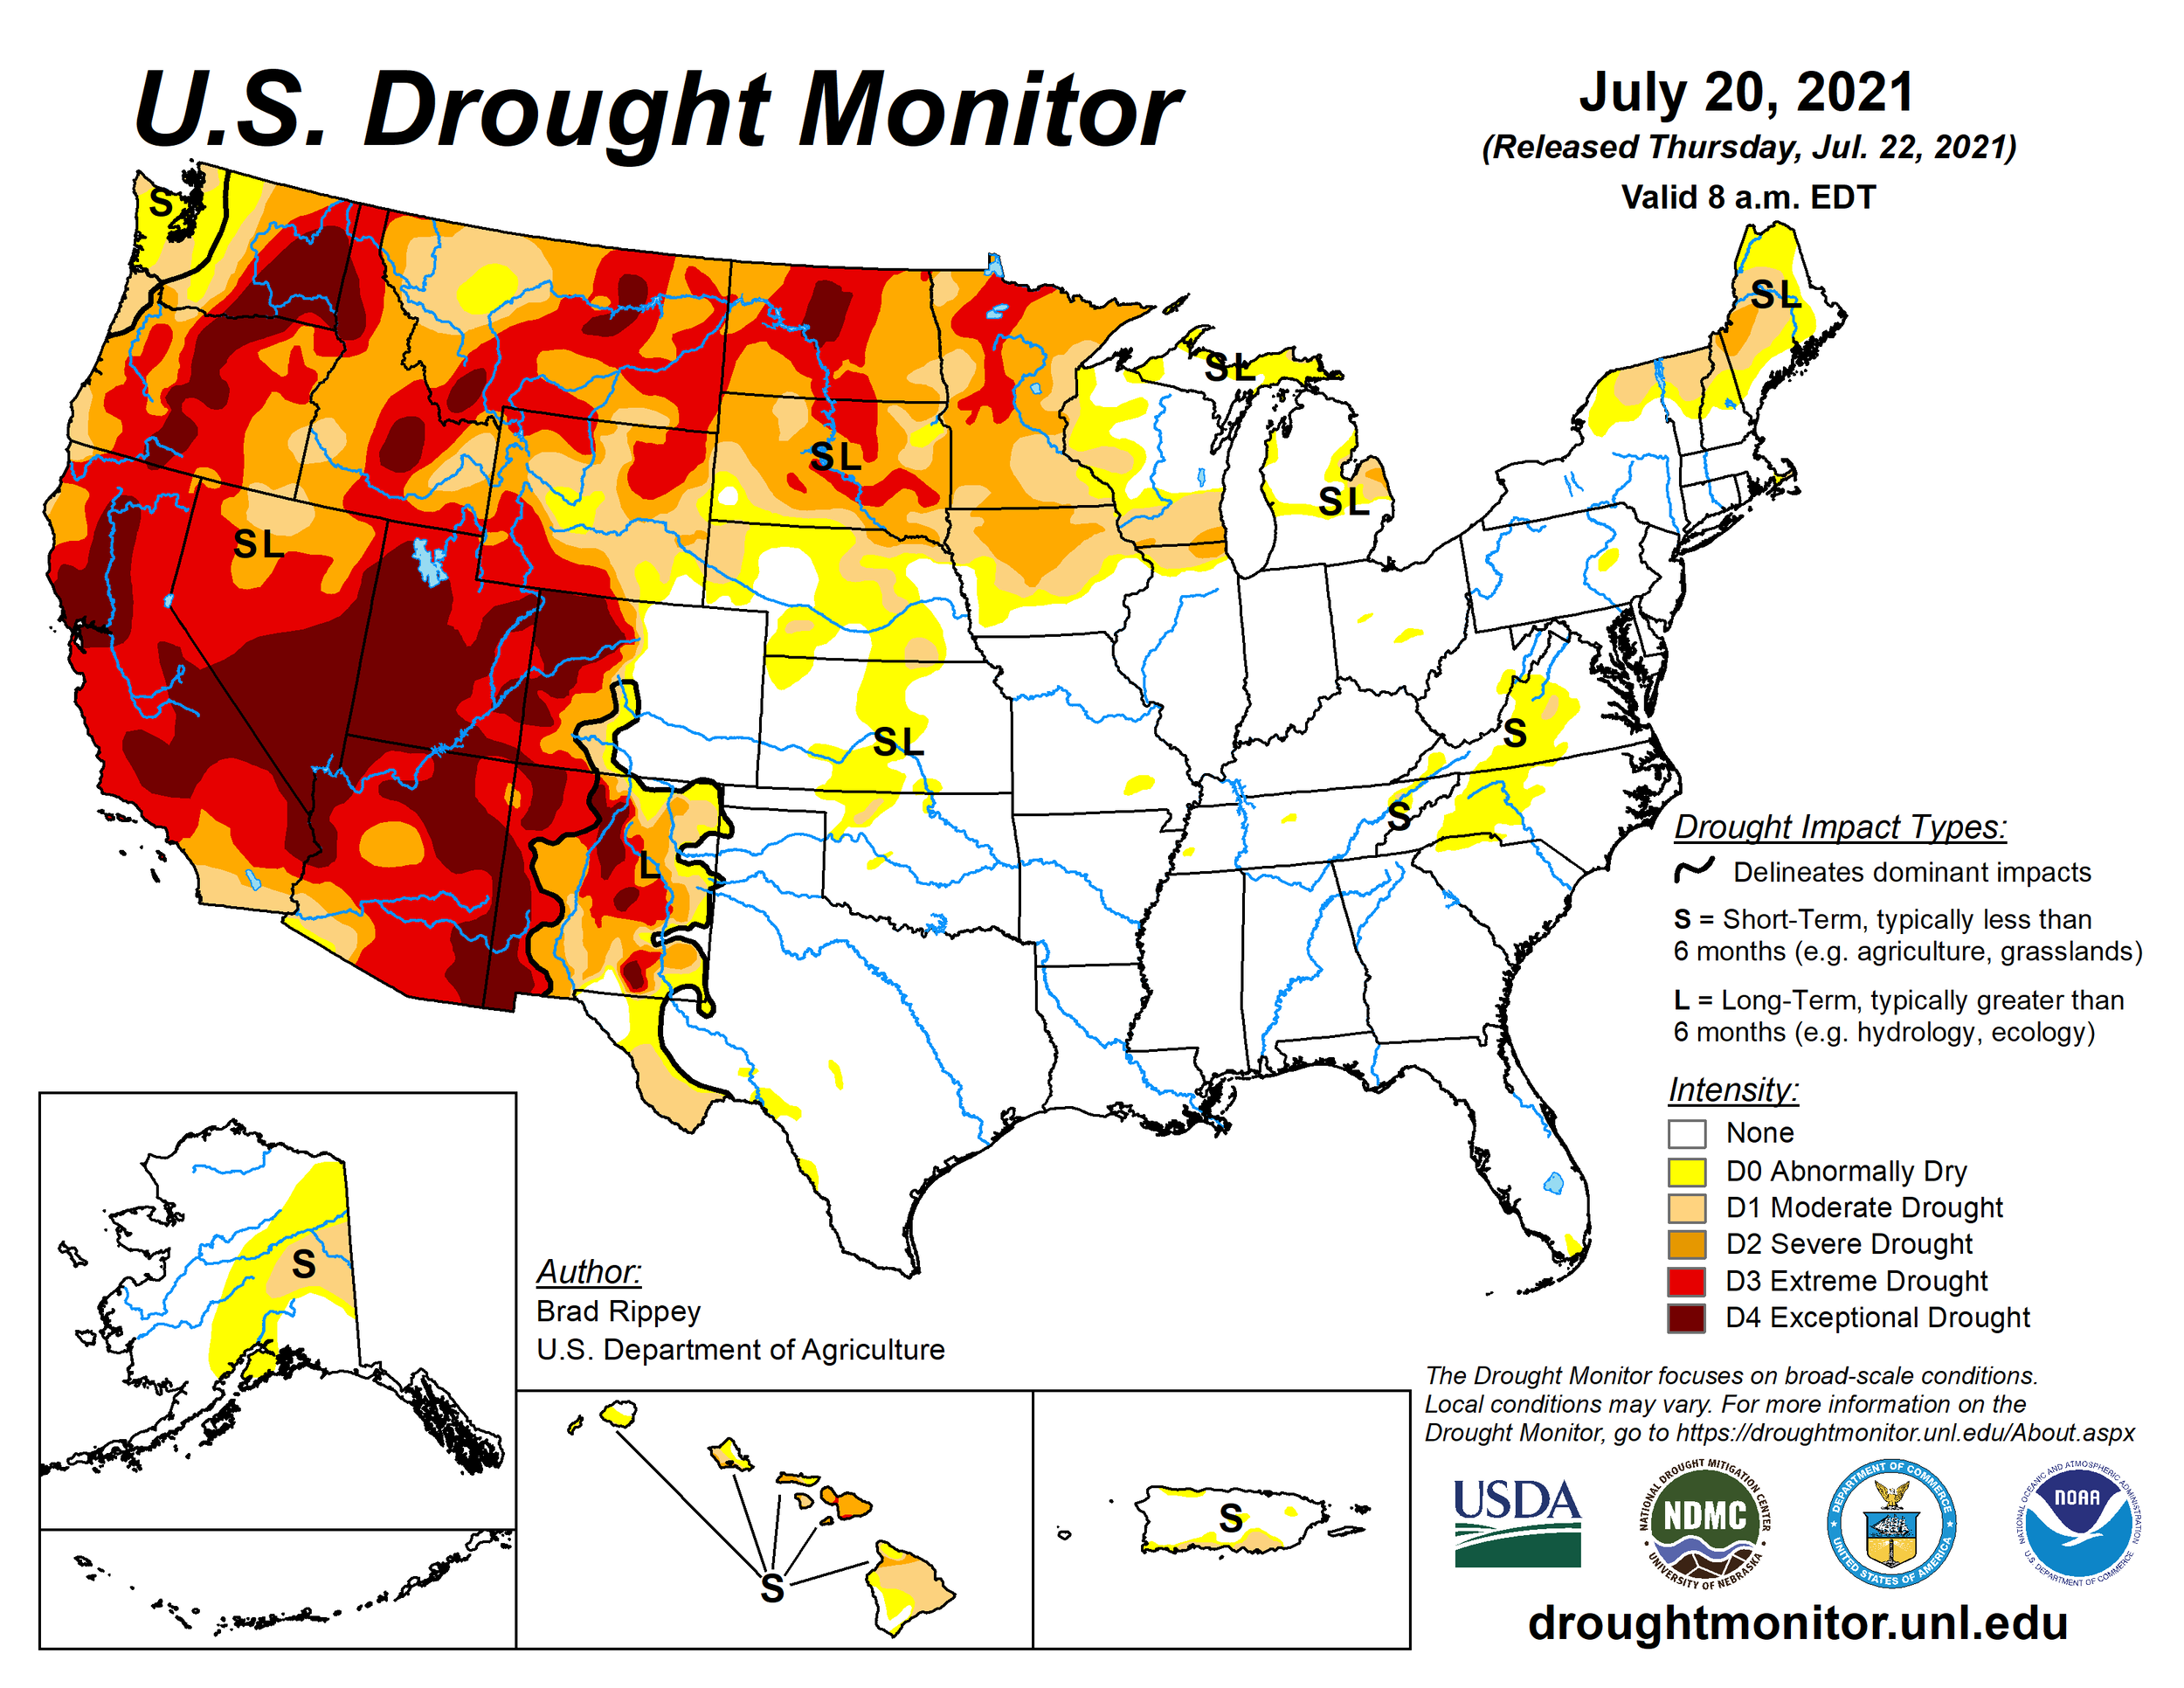
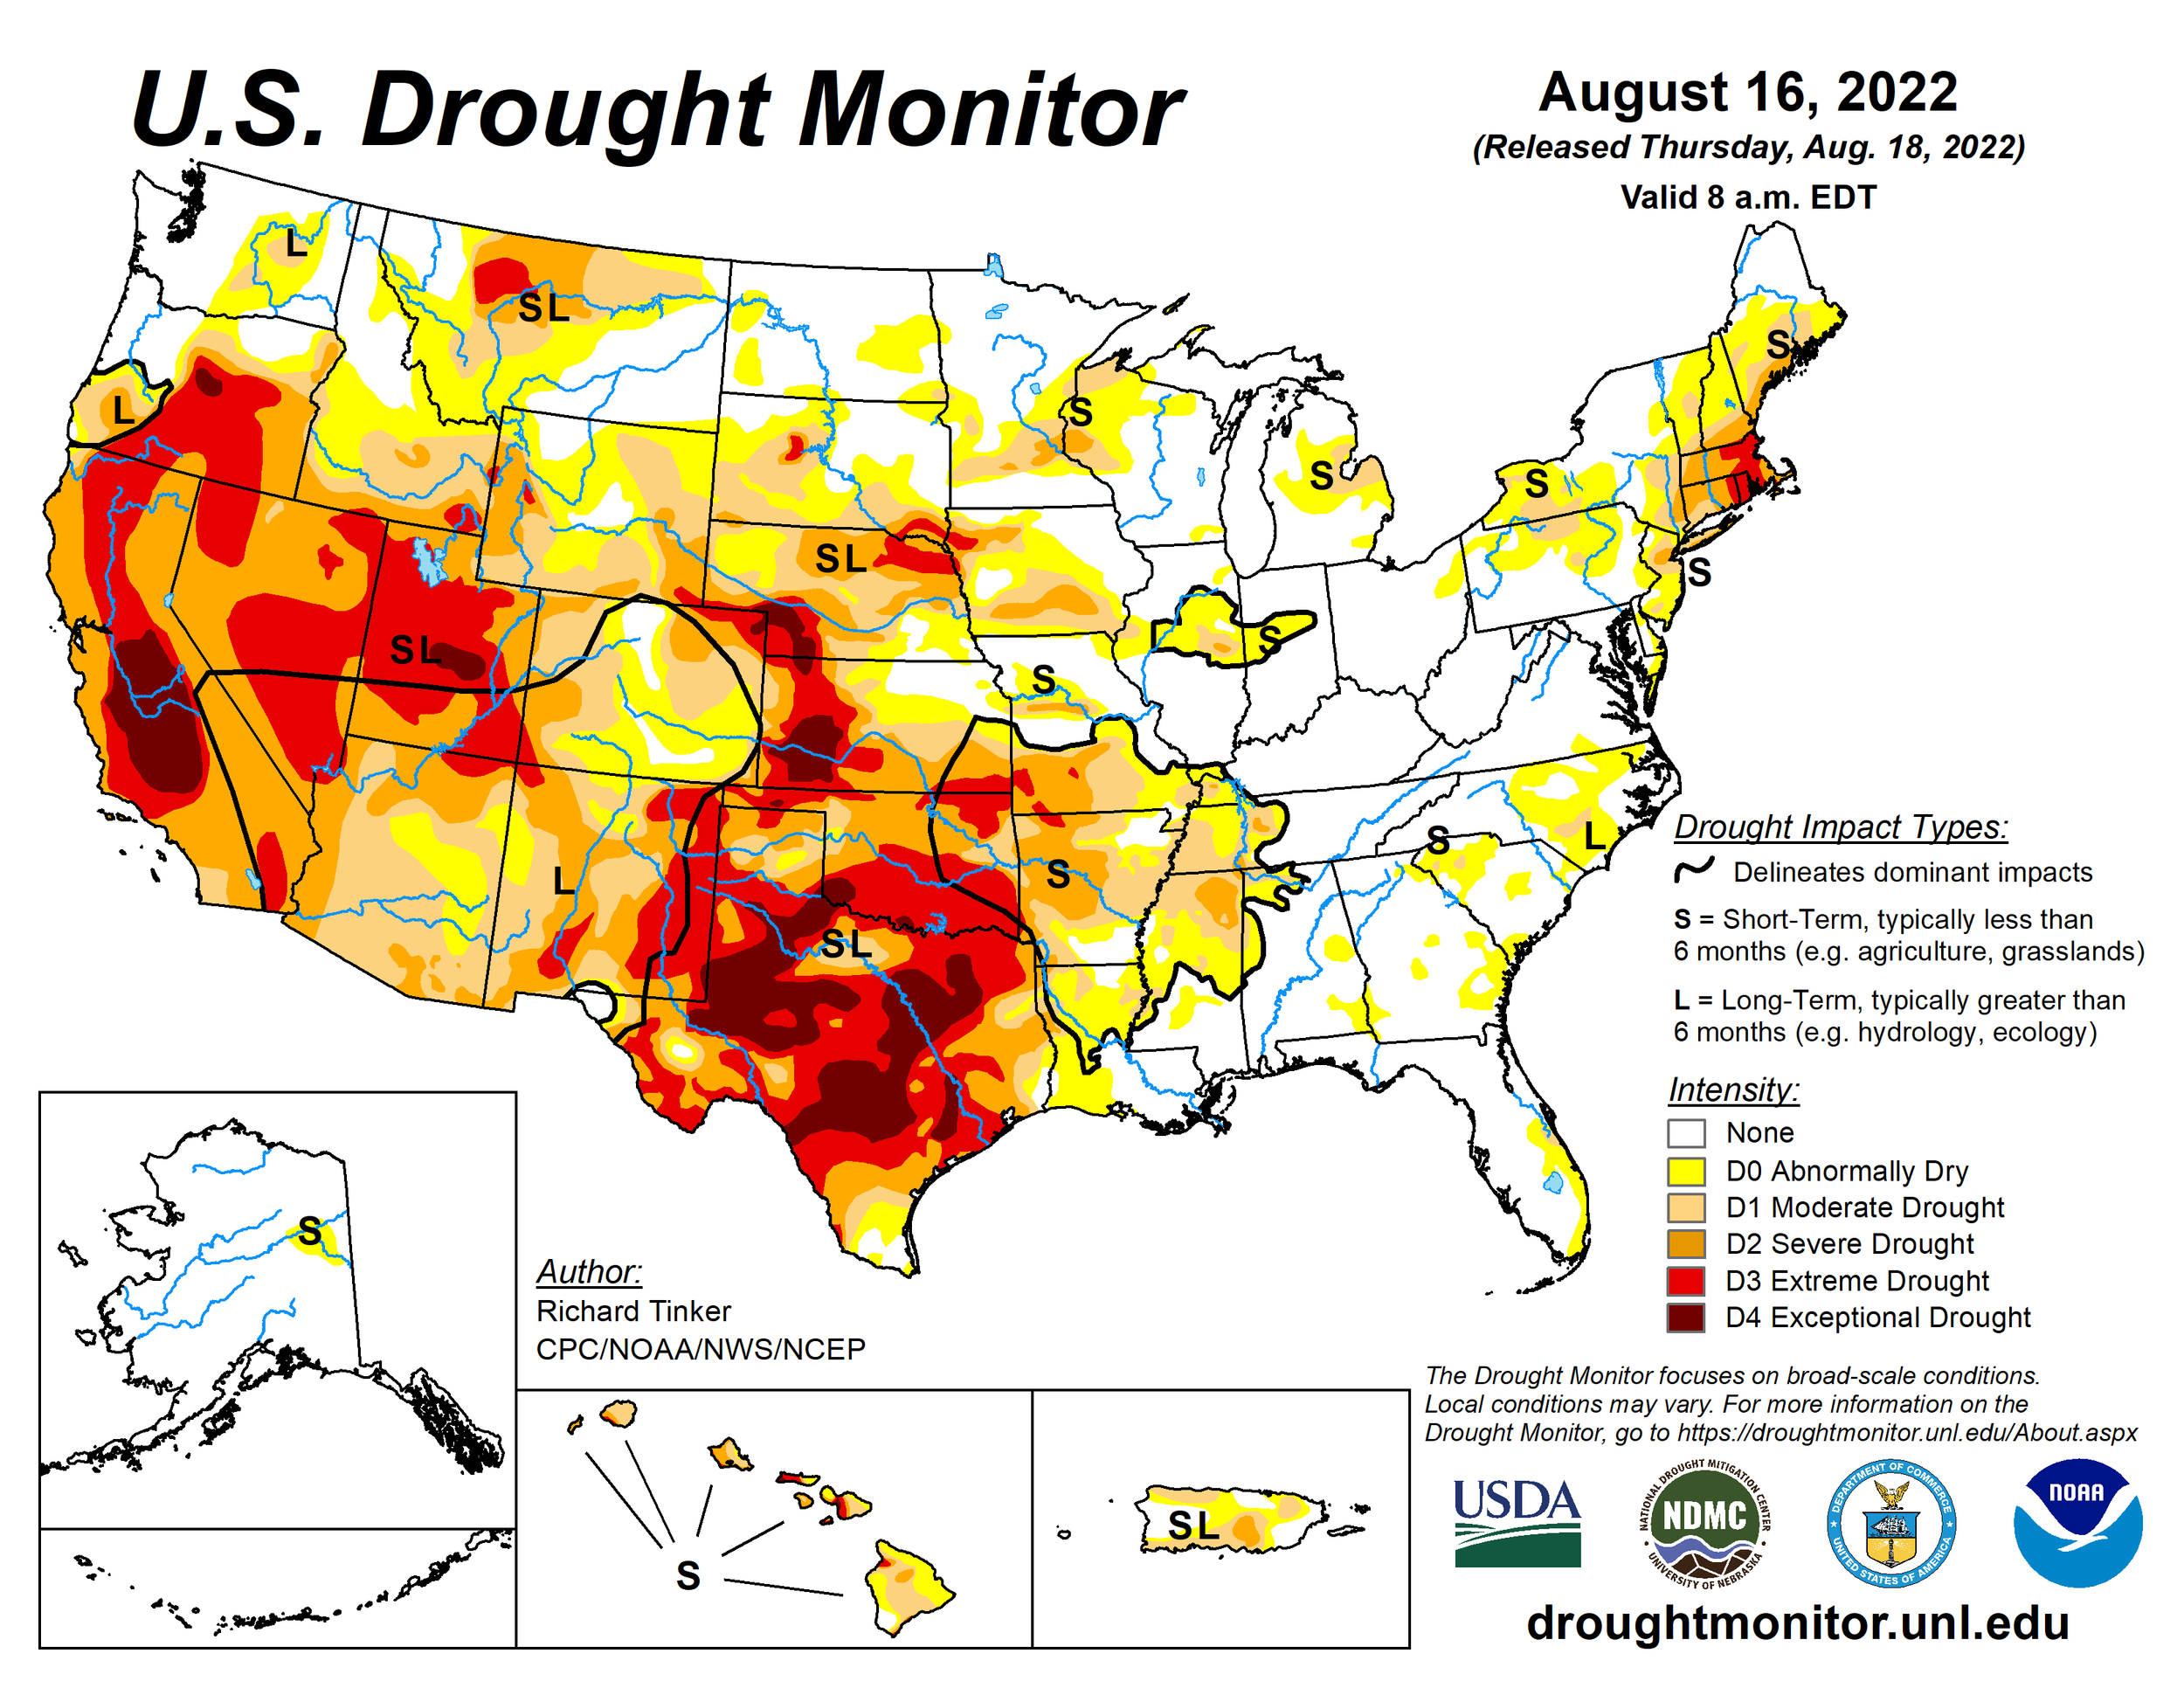
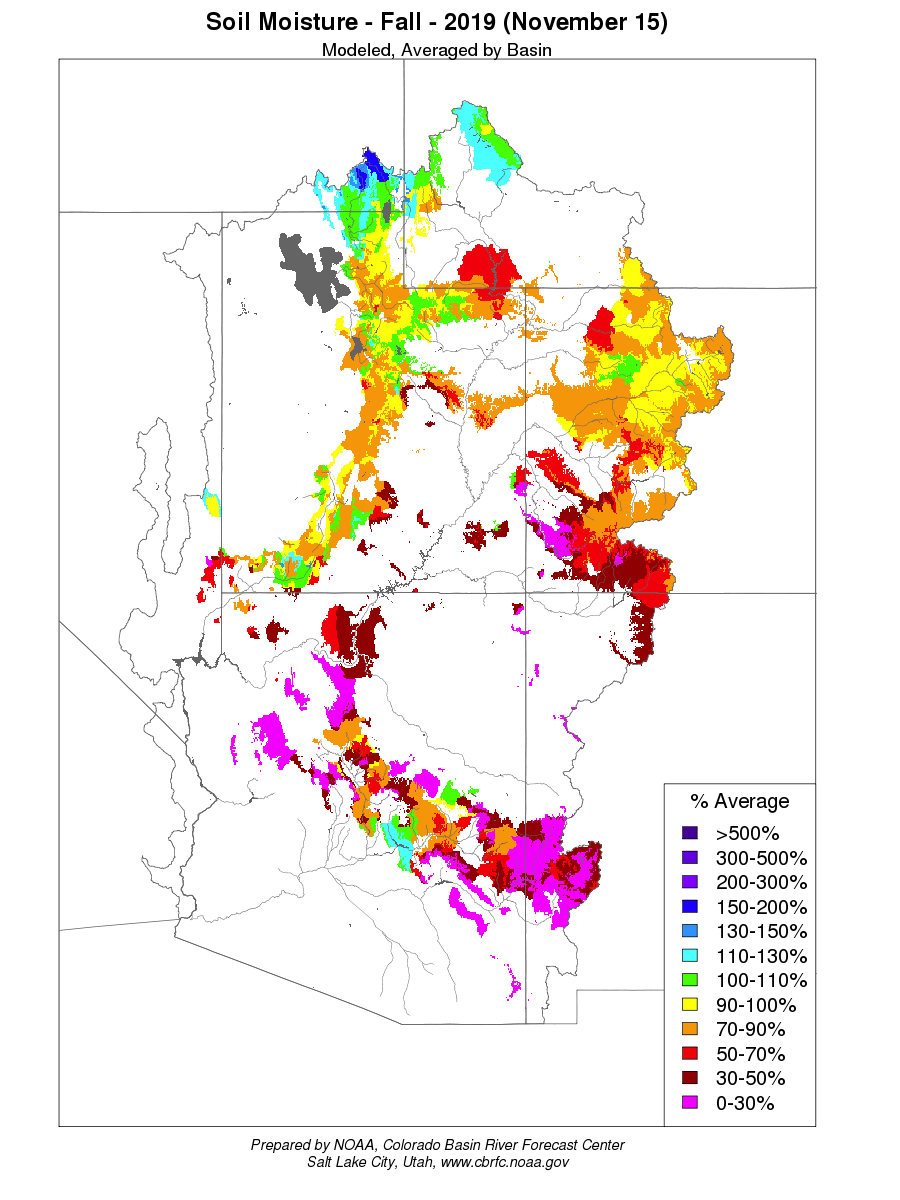
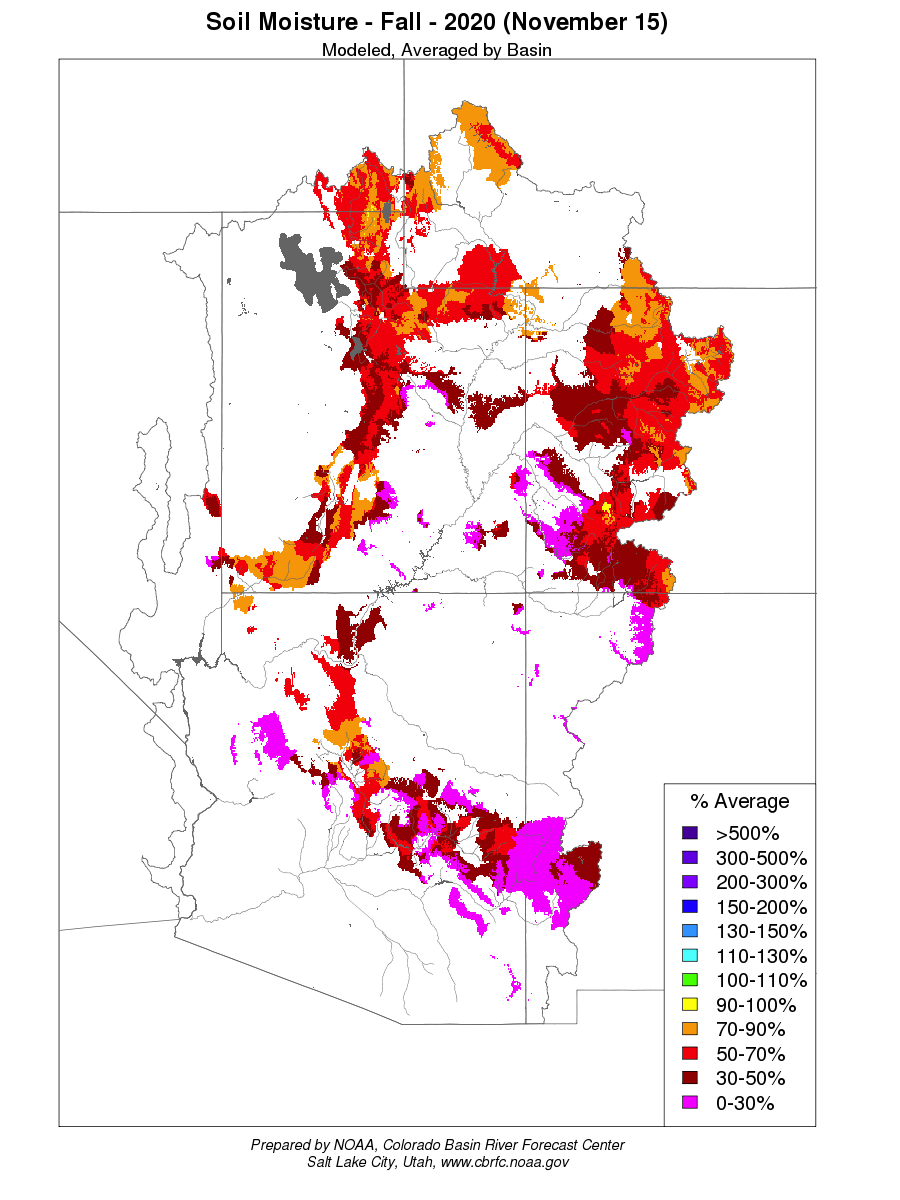
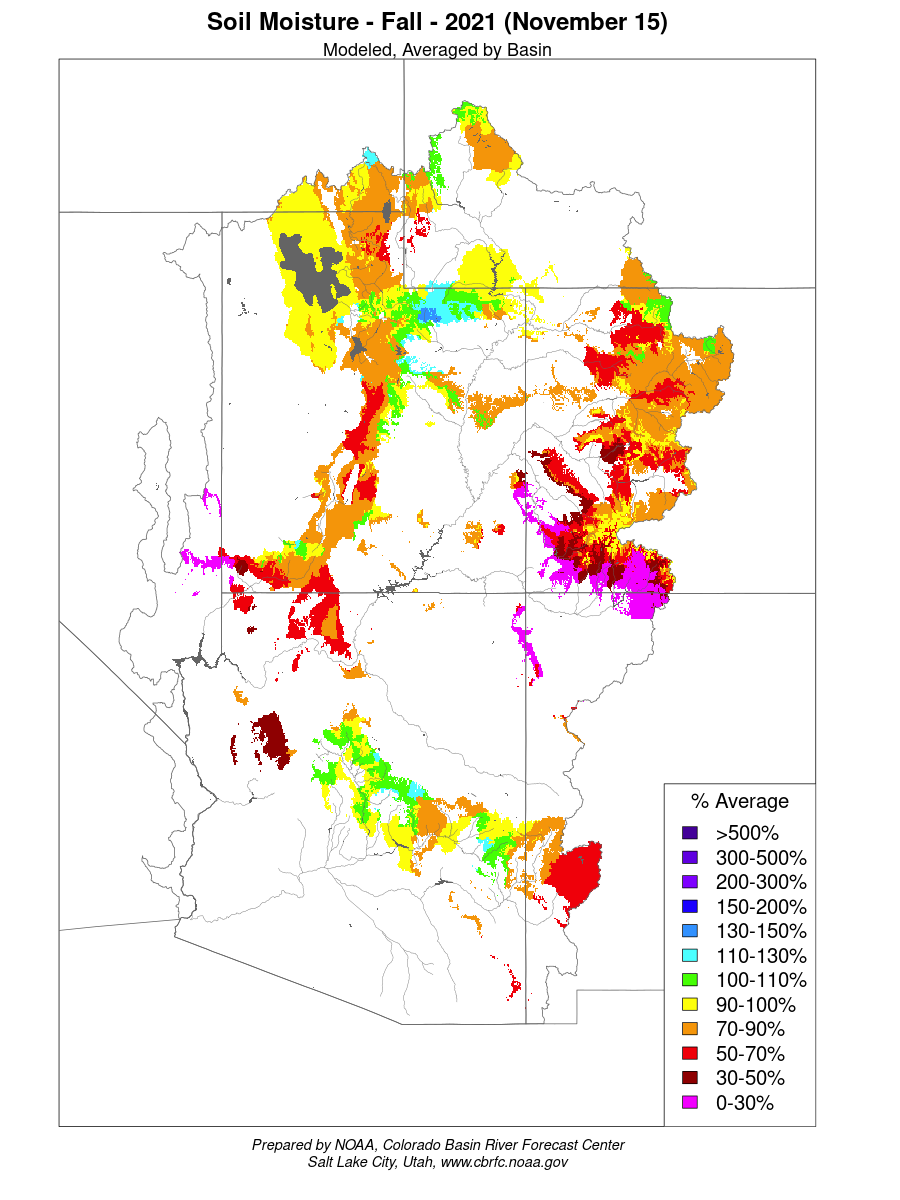
Below: Soil moisture conditions going into winter for the last three years. The beginning of WY2022 soil moisture was better than the previous year due to improved monsoon activity and a few early water year storms. Healthy soil moisture conditions generally improve the likelihood of more efficient snowmelt runoff.
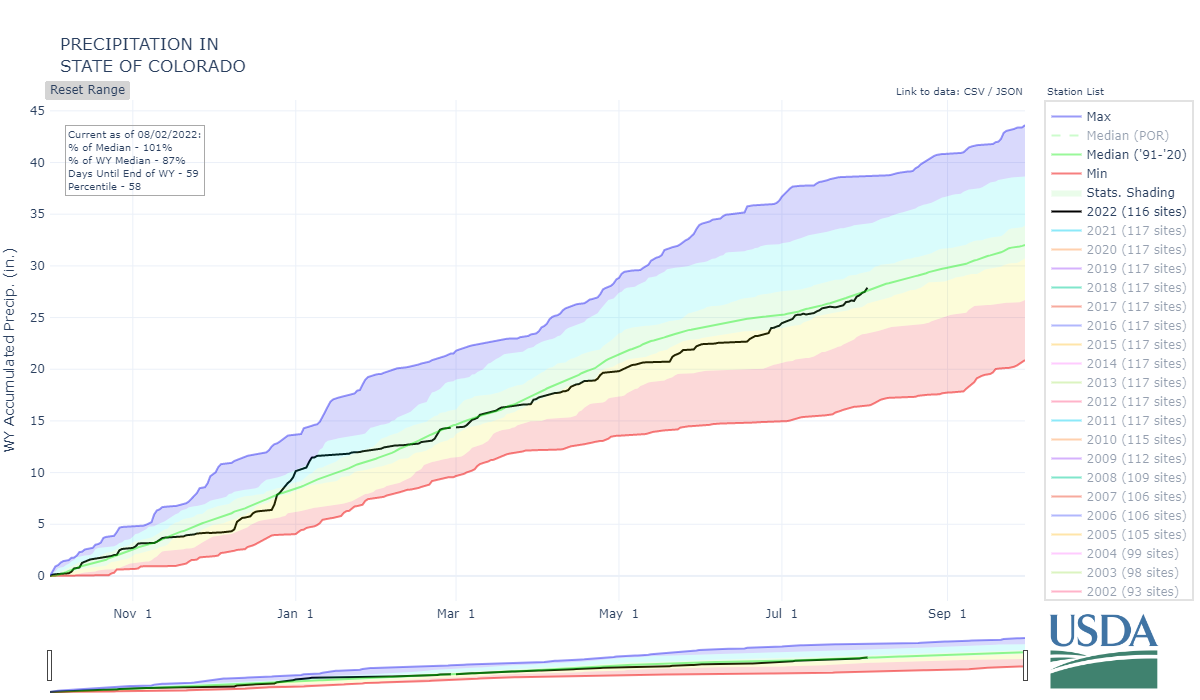
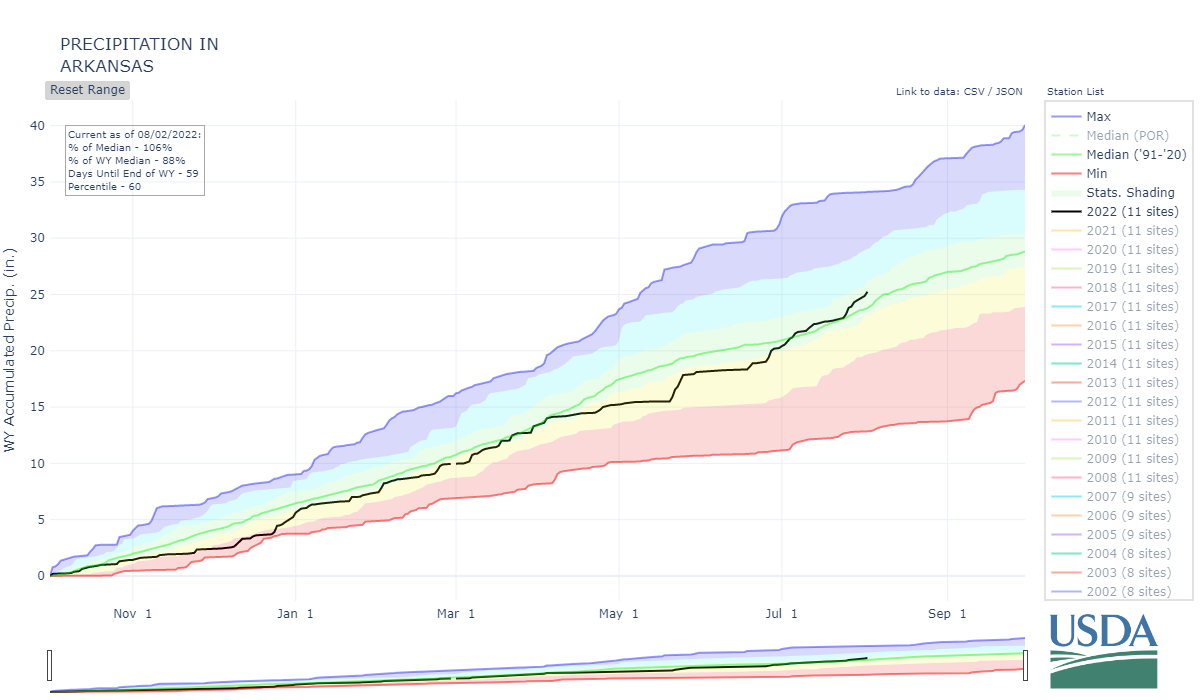
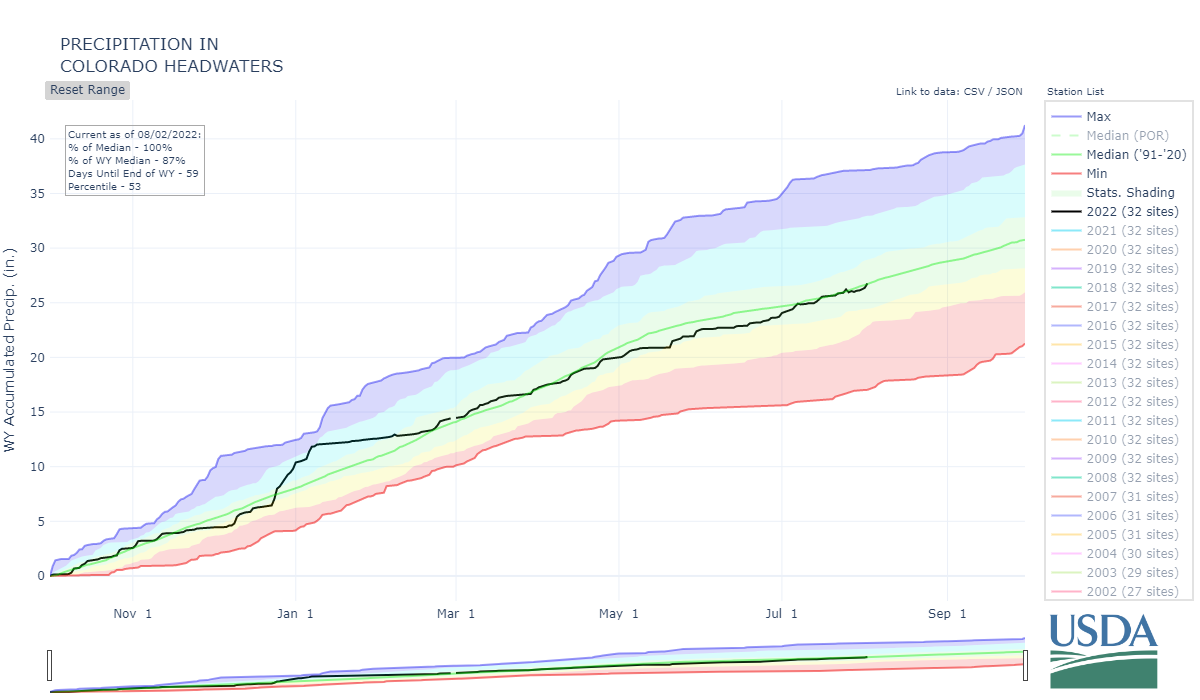
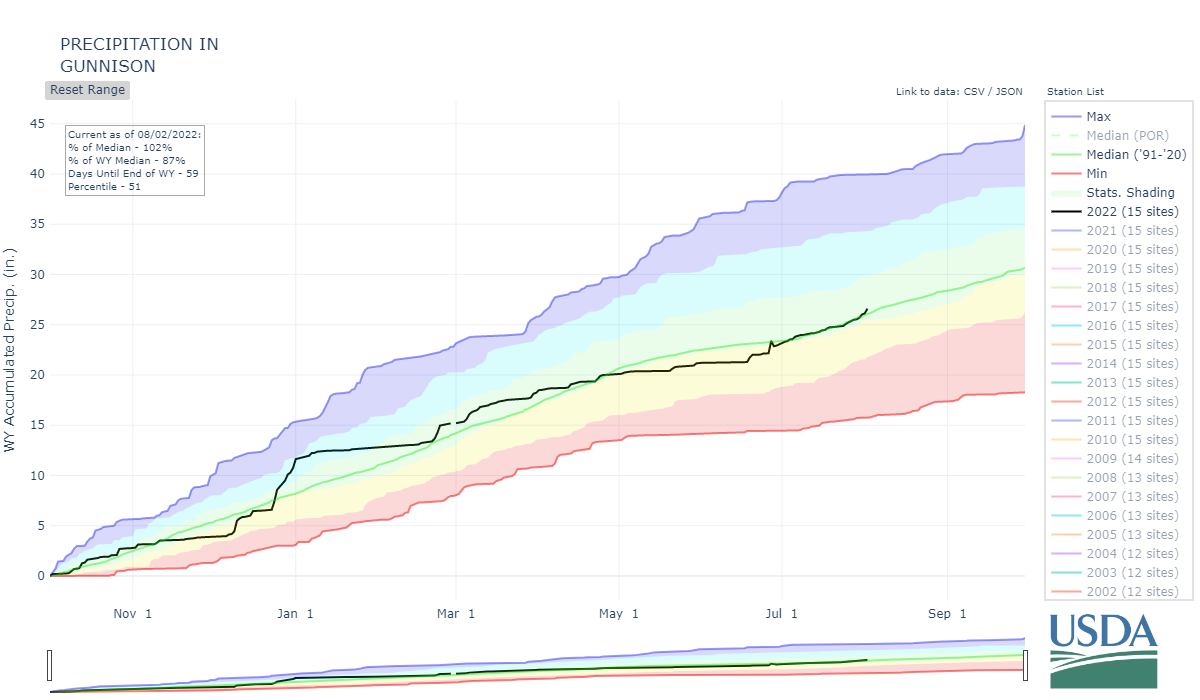
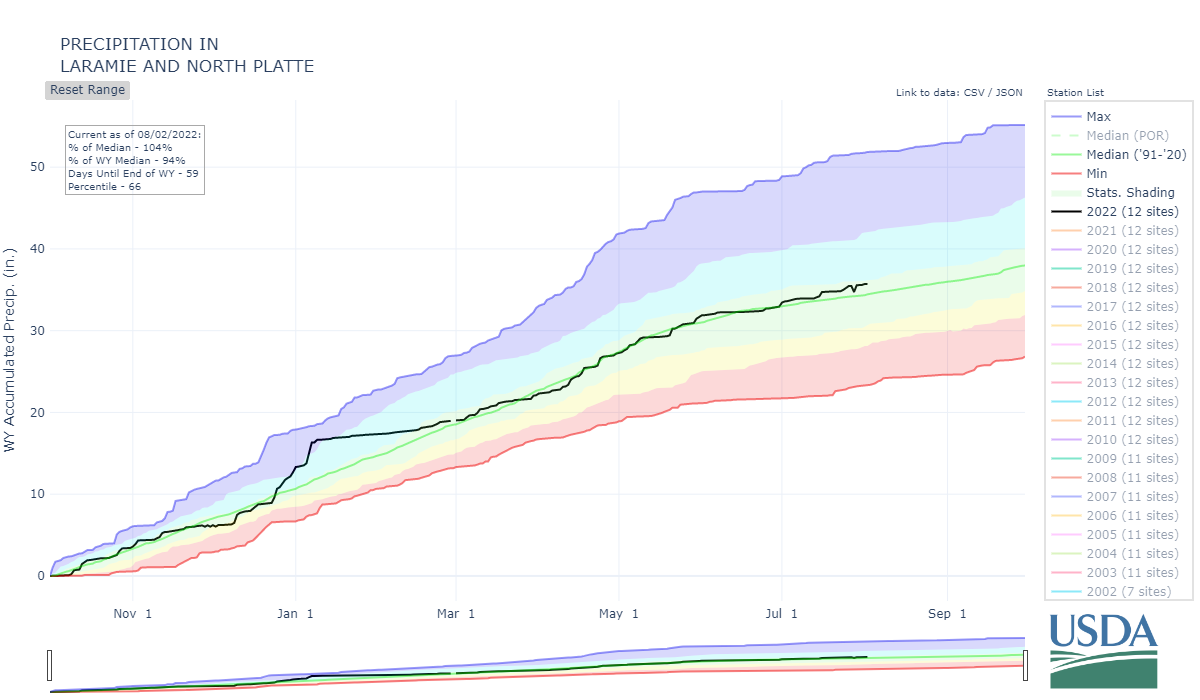
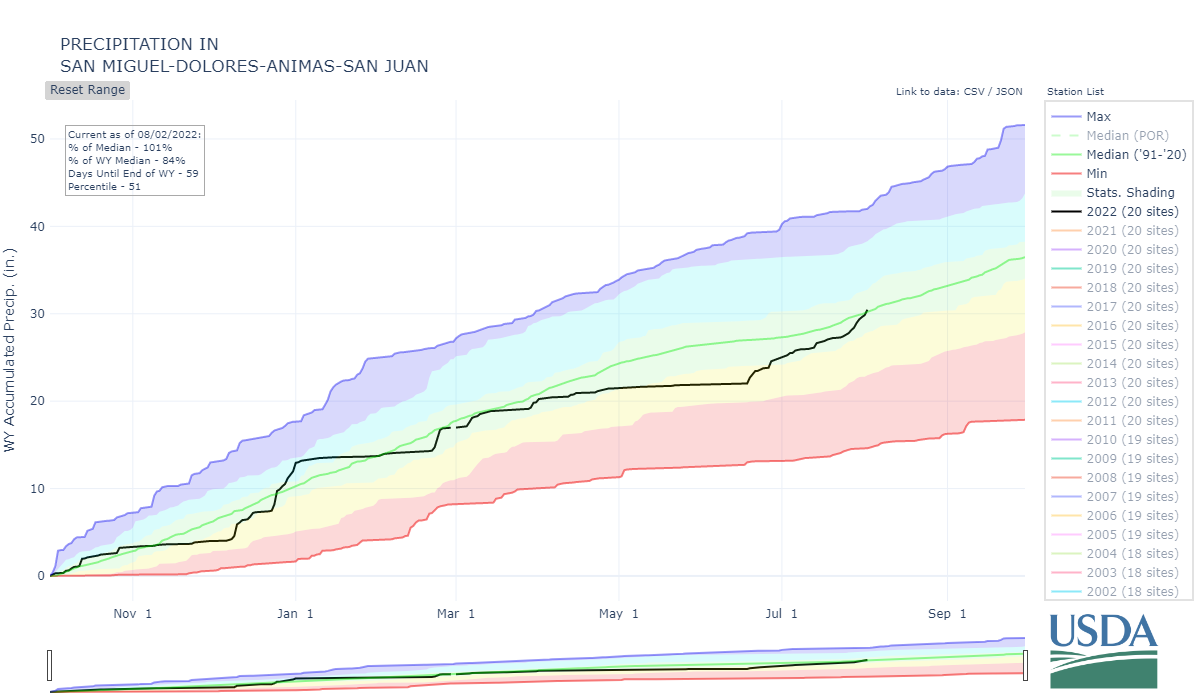
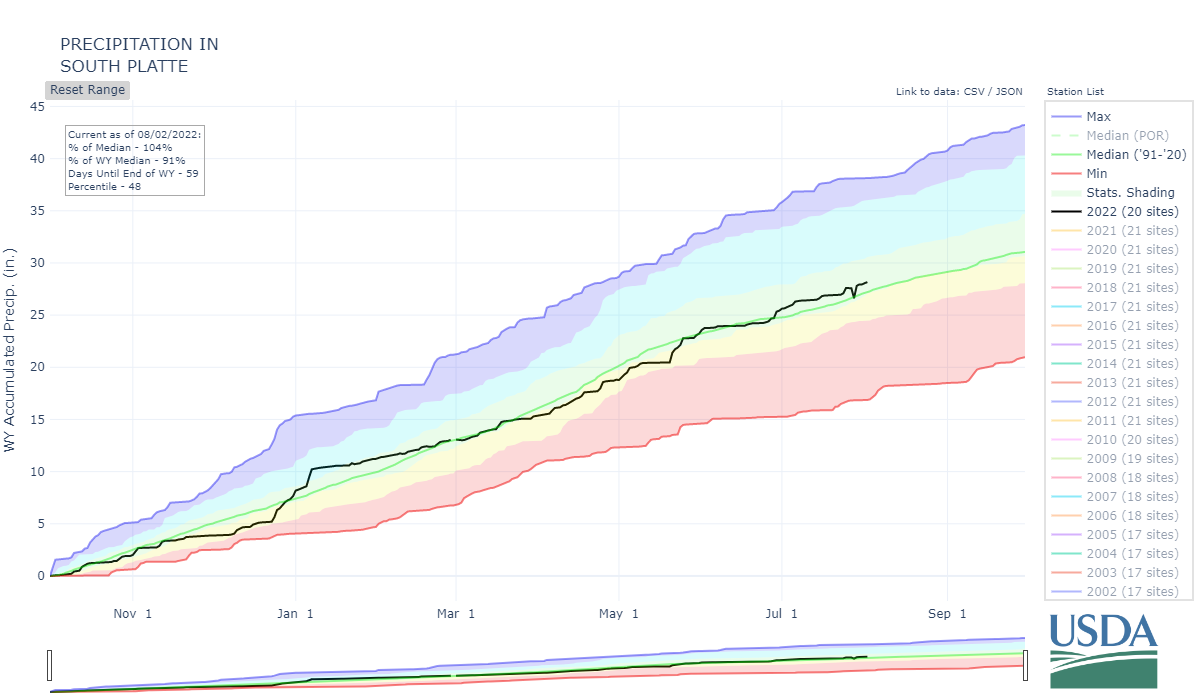
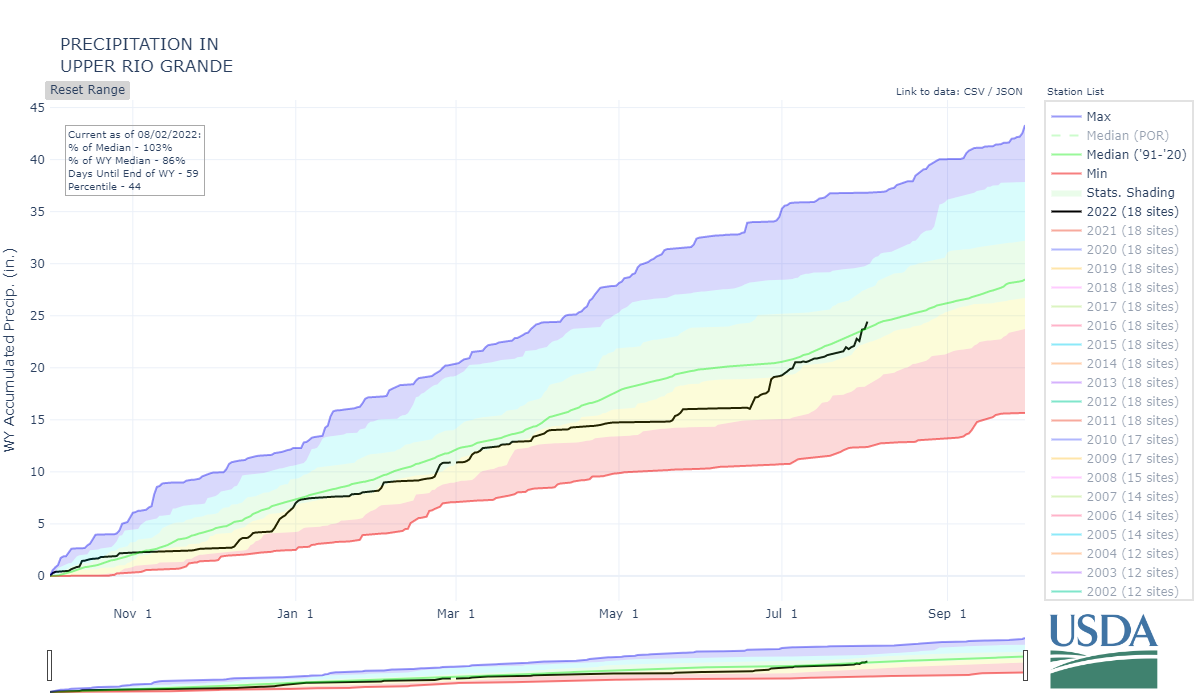
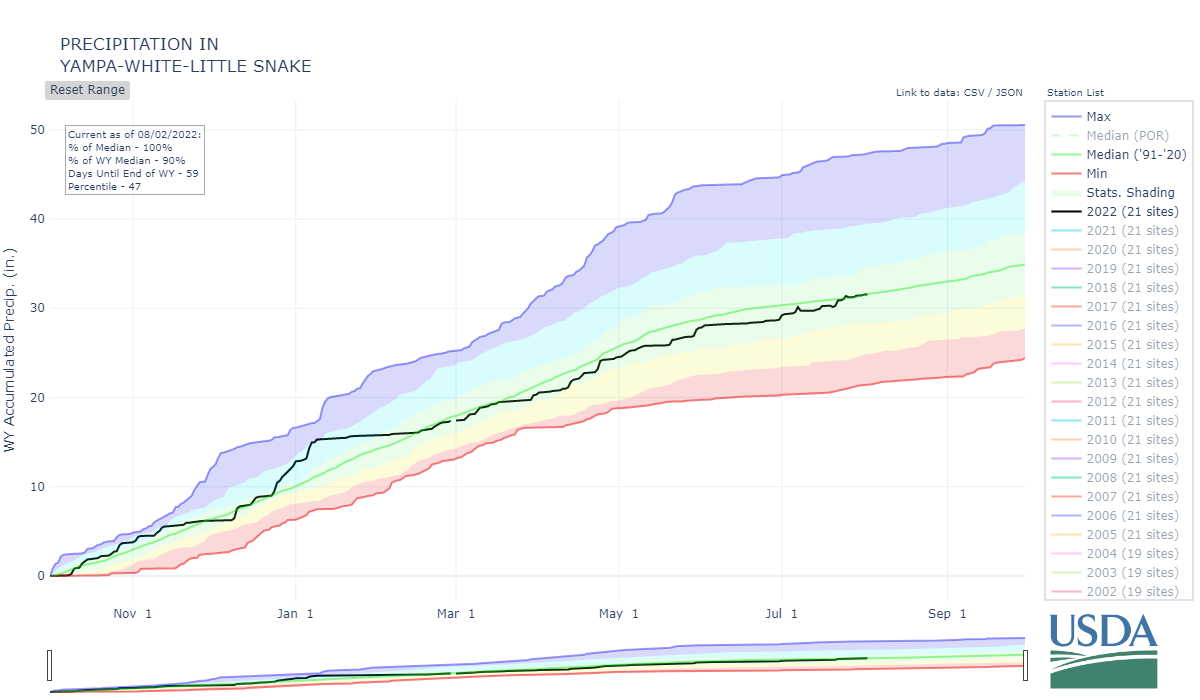
Above: Most major basins saw stair-step snow accumulation - periods of dryness followed by periods of wet - up until around April. Spring precipitation favored central and northern basins while southern basins were warmer and dryer. The summer monsoons have been plentiful so far summer of 2022 and a welcome relief in many areas of Colorado, particularly Southwest Colorado.
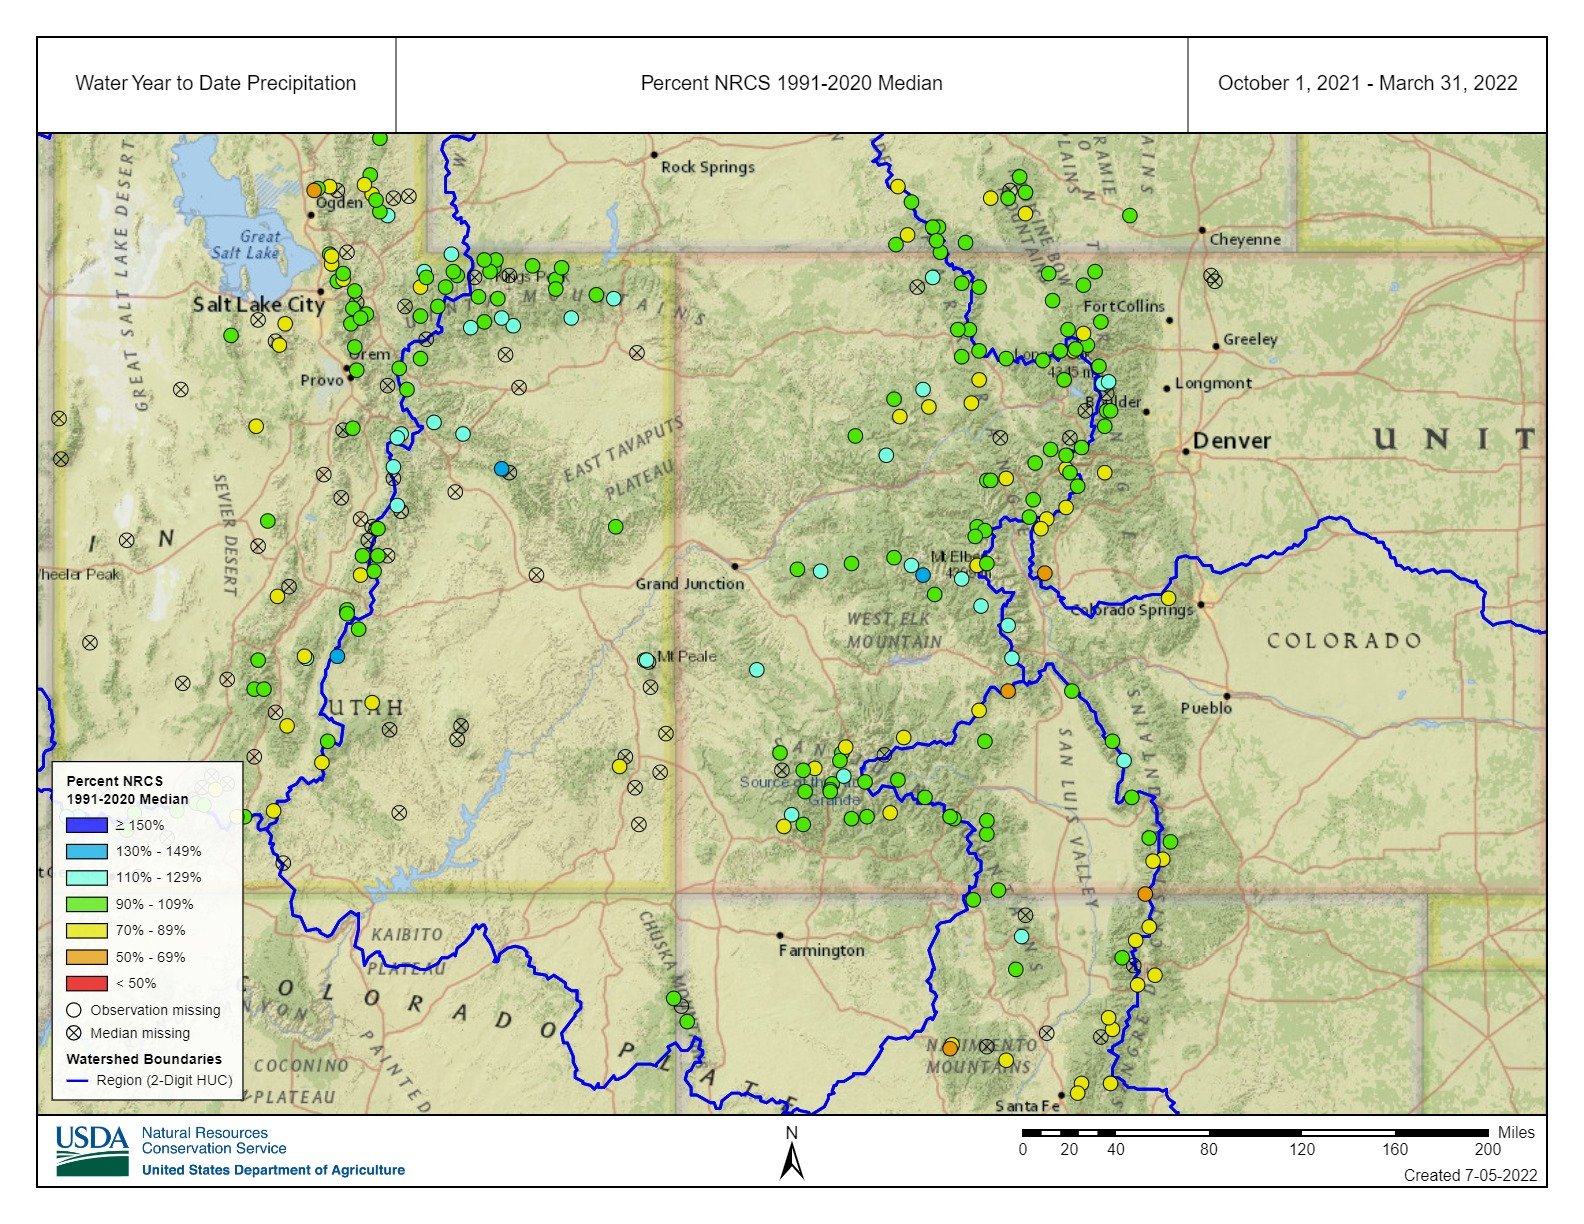
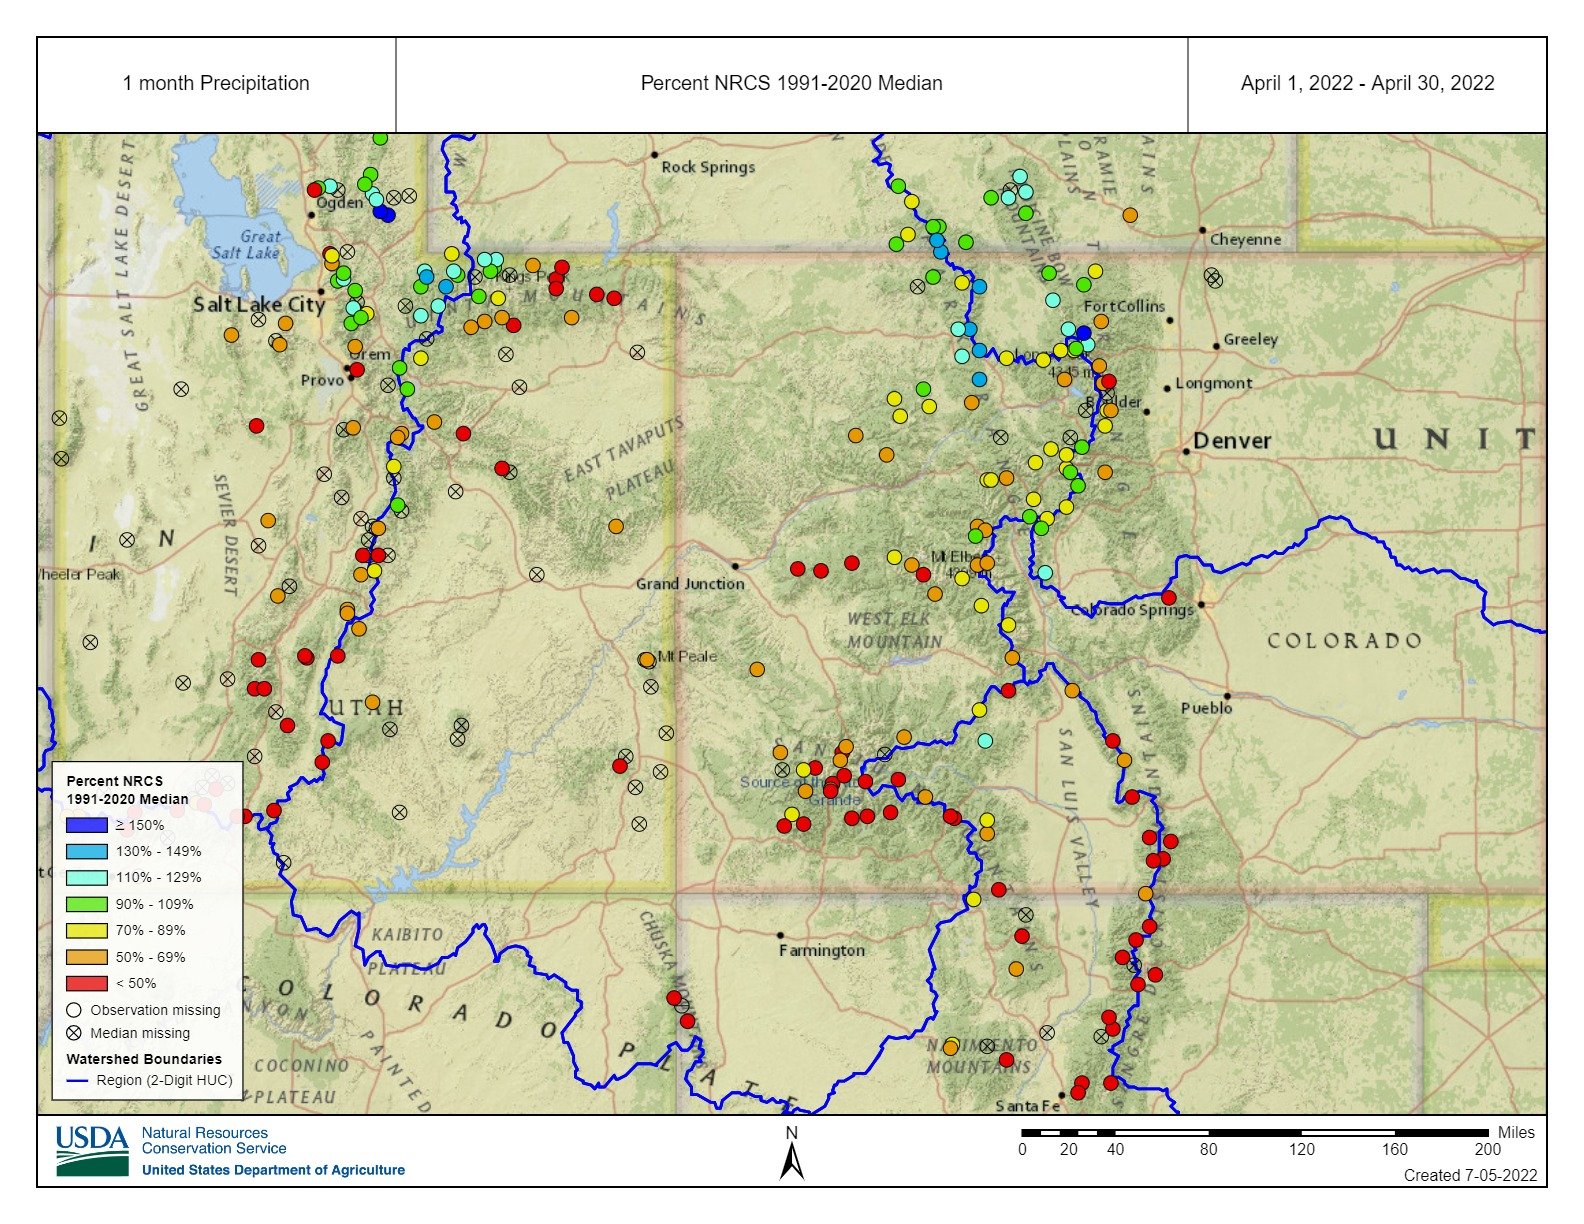
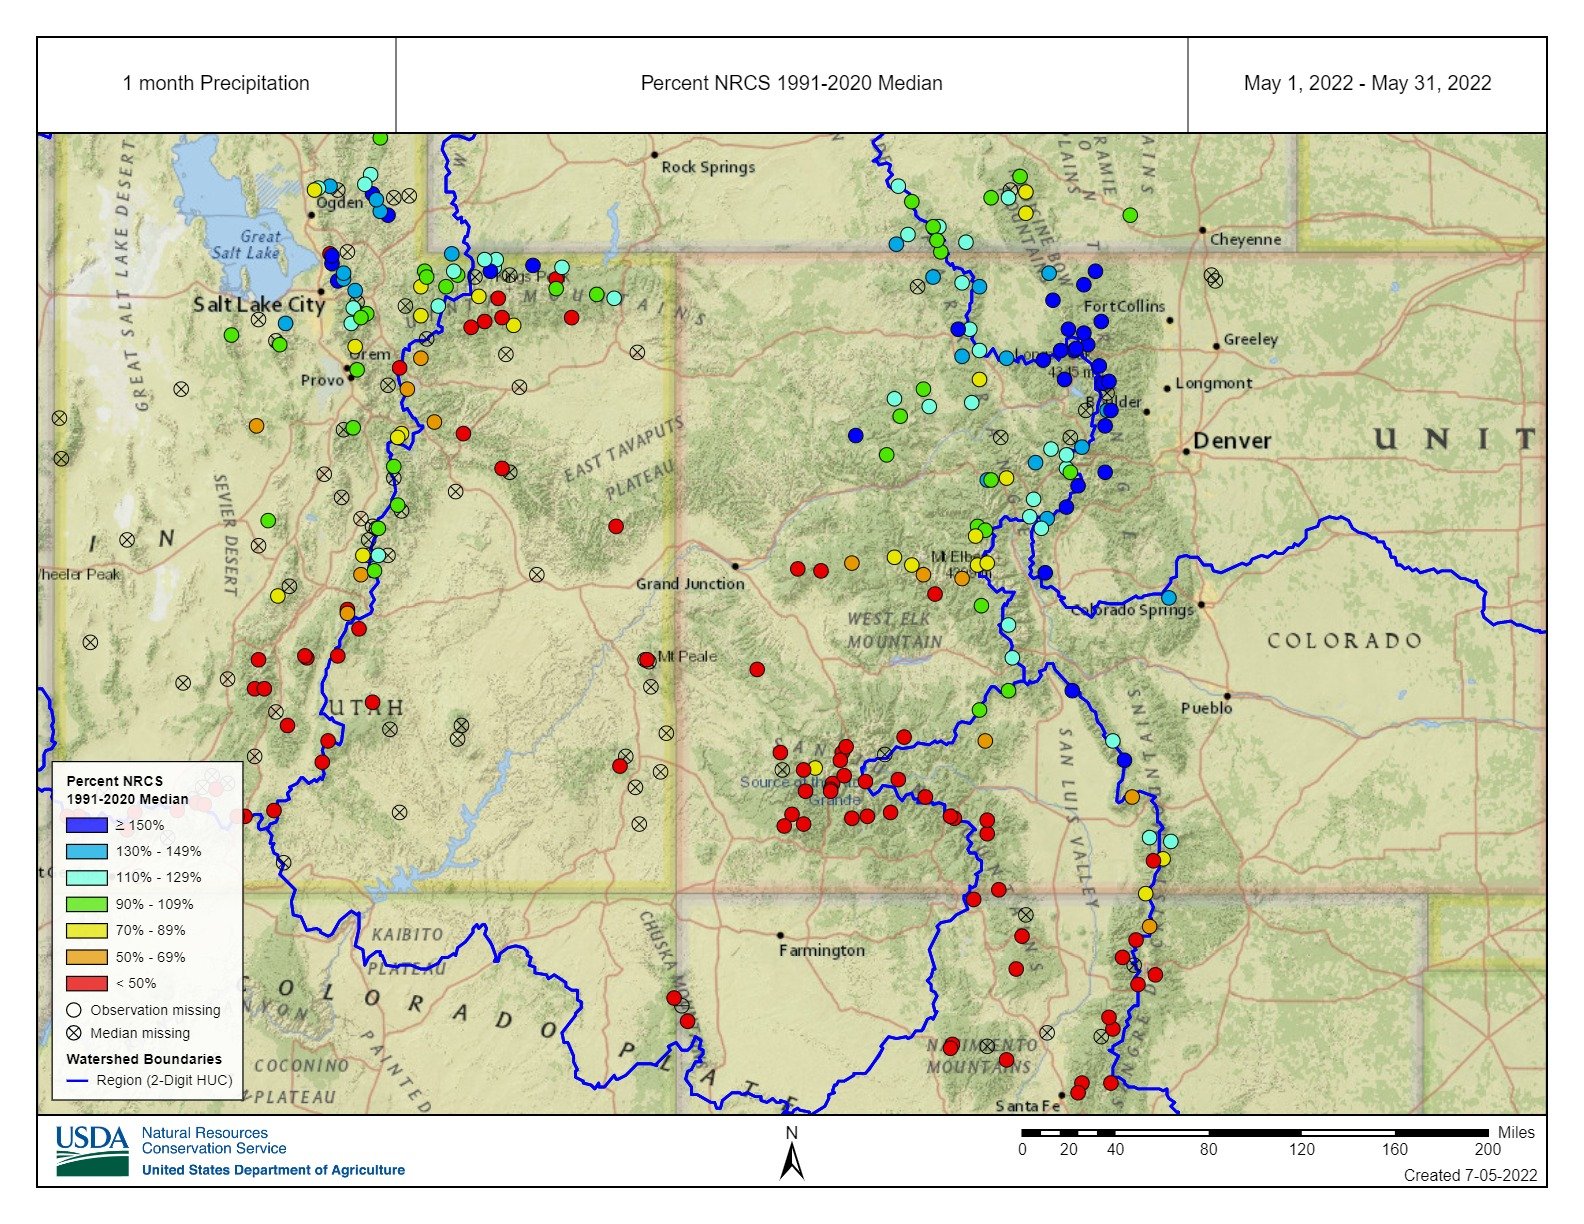
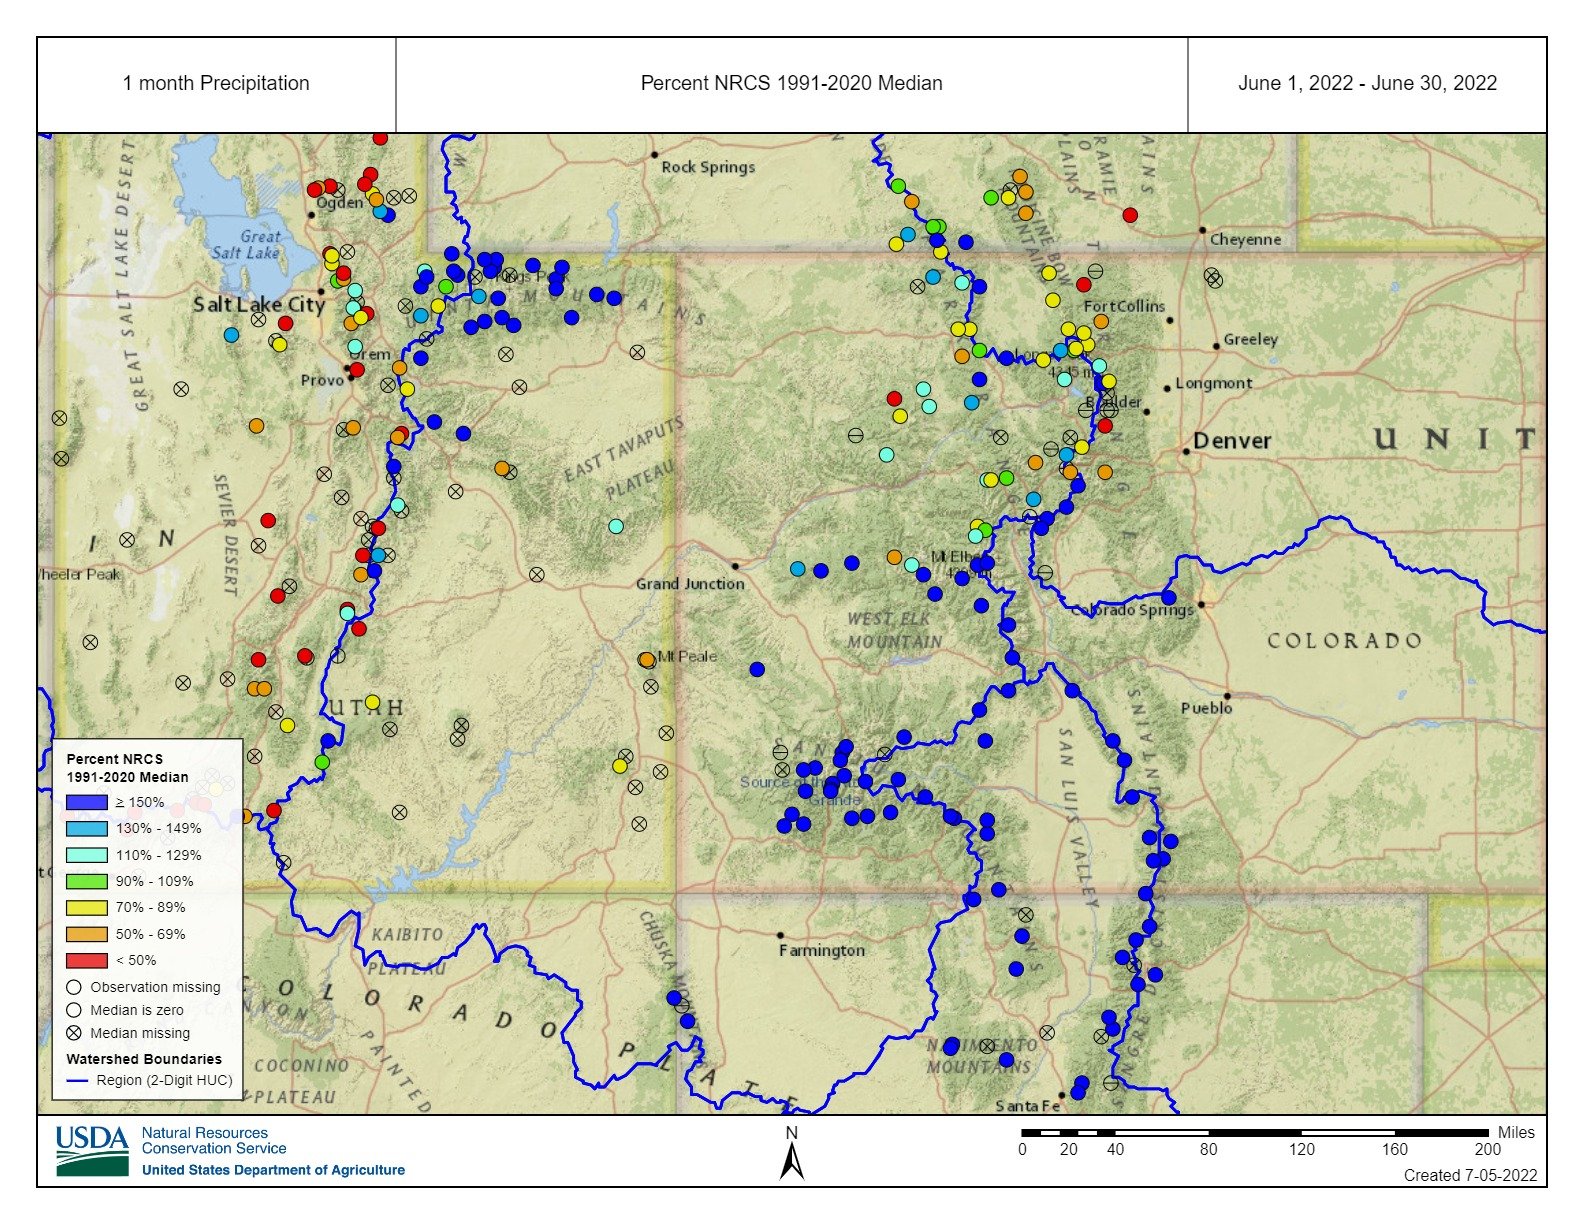
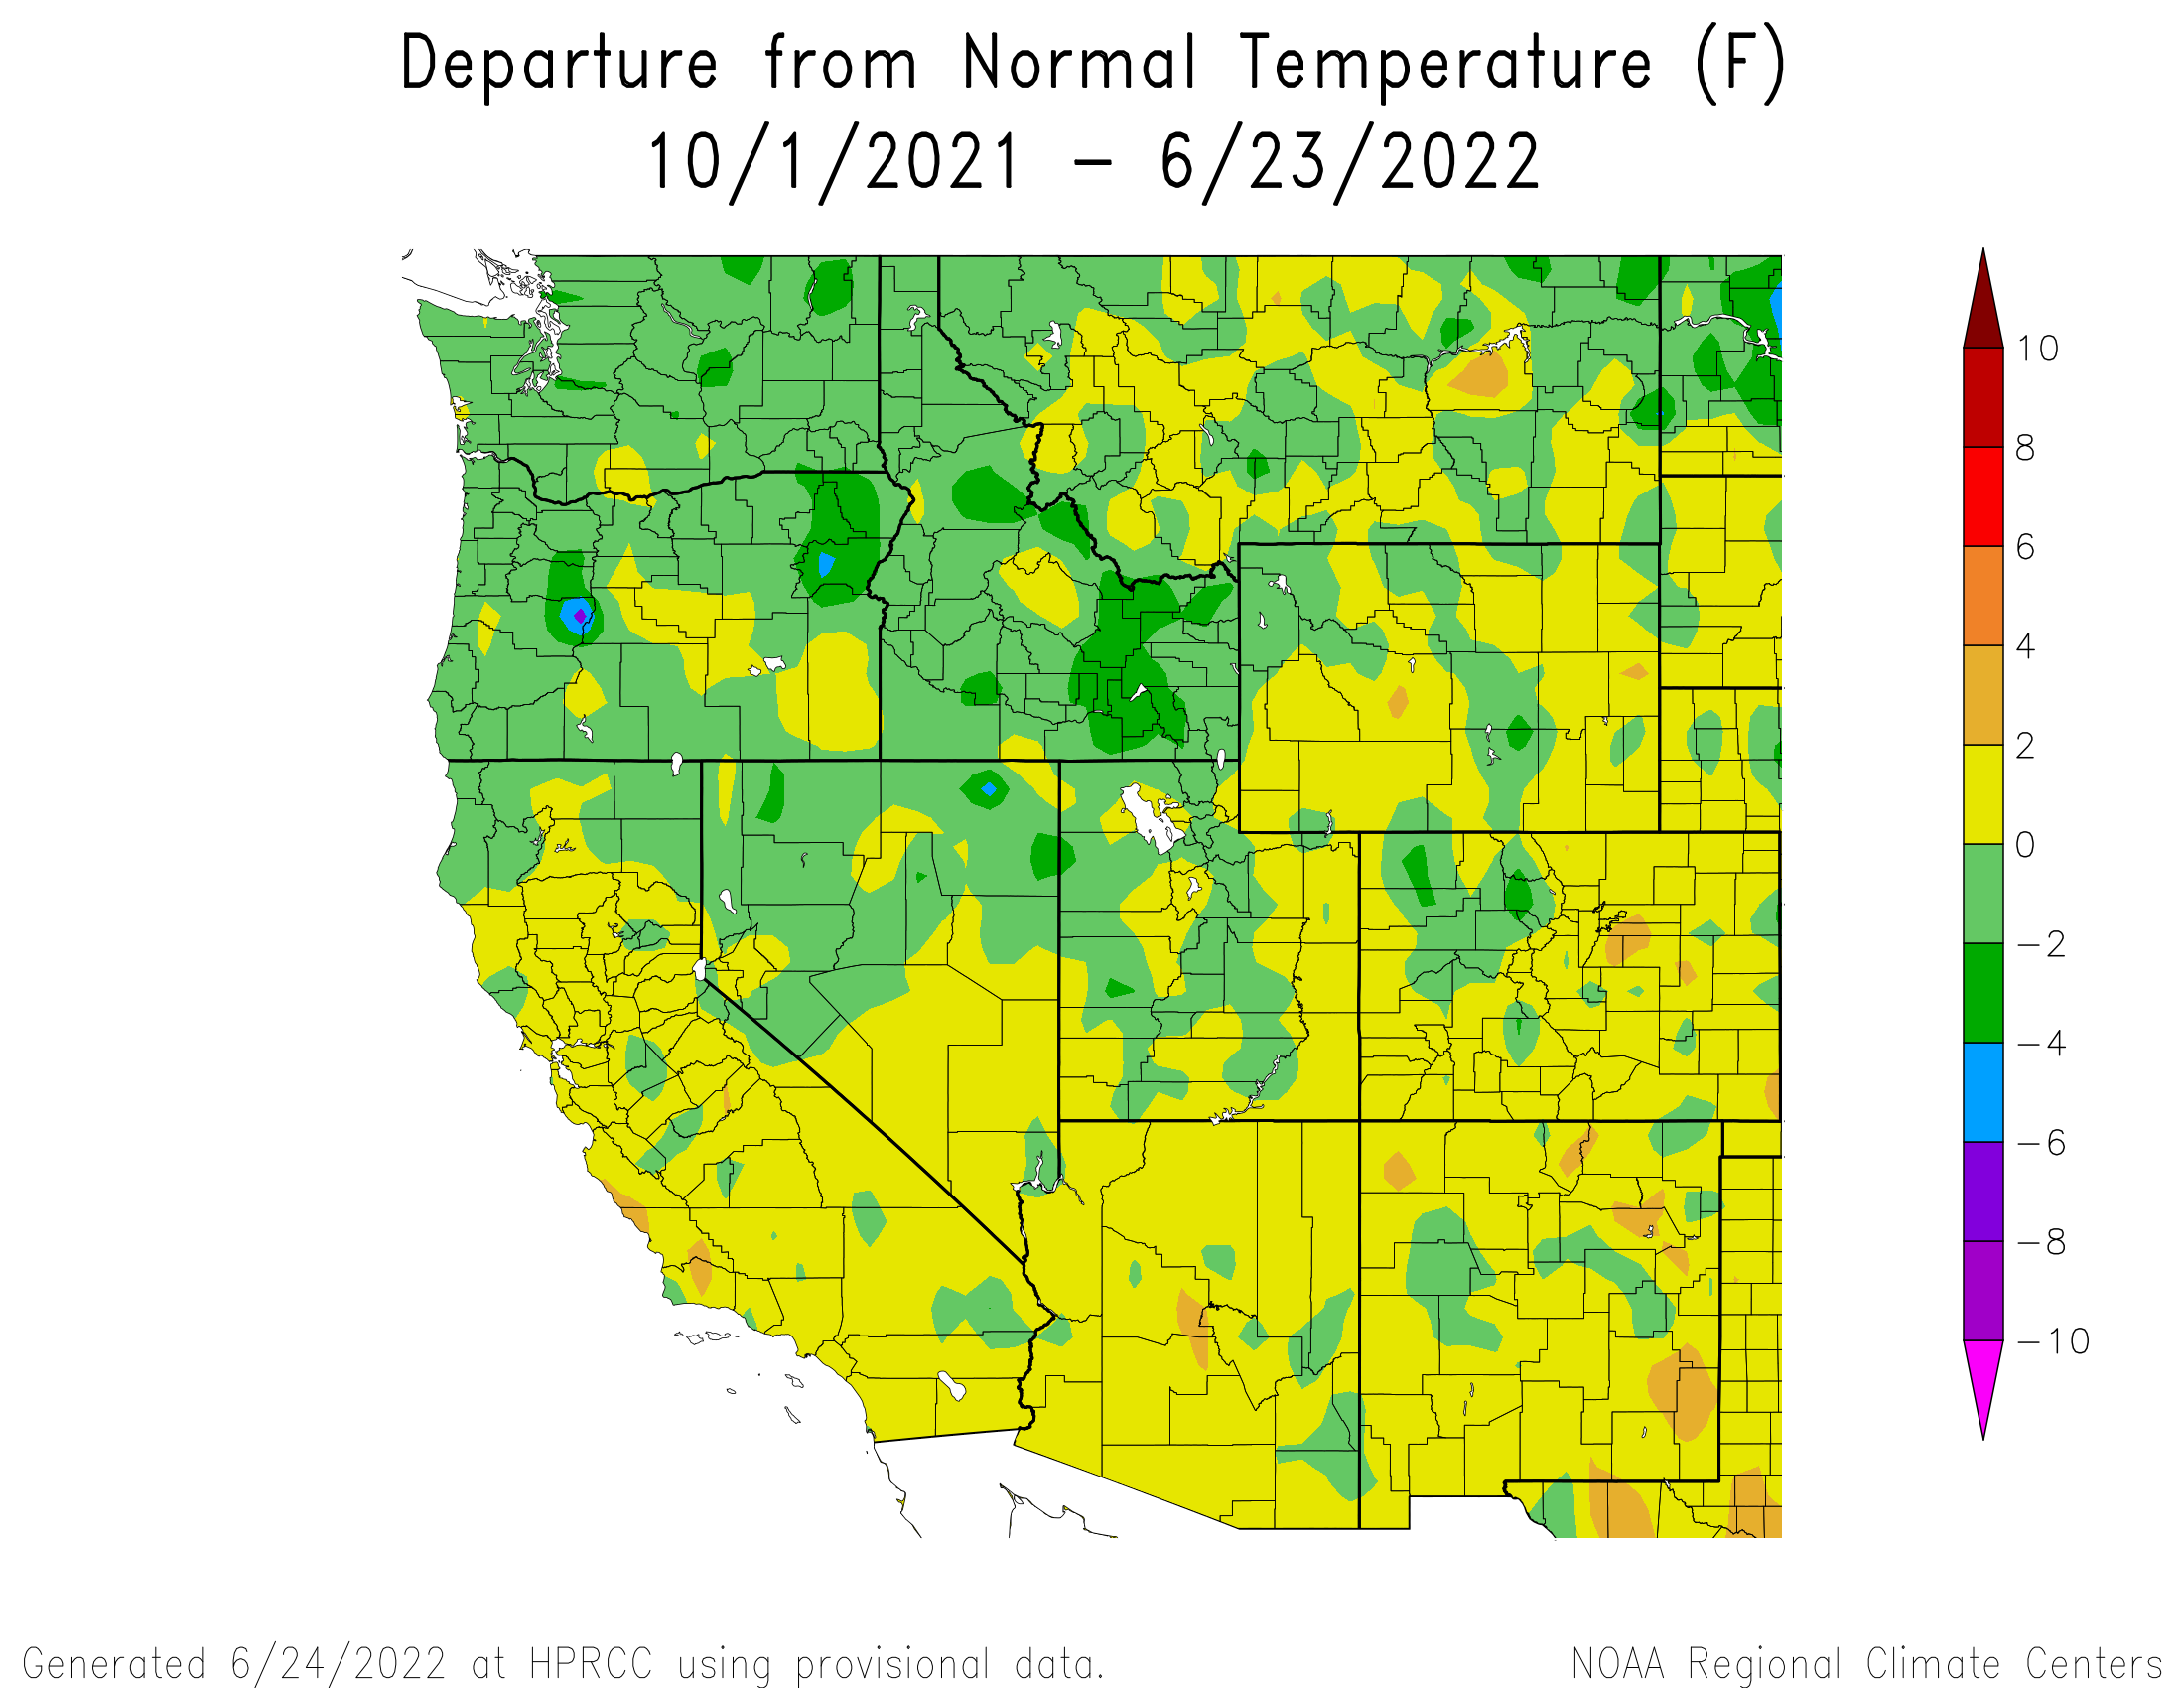
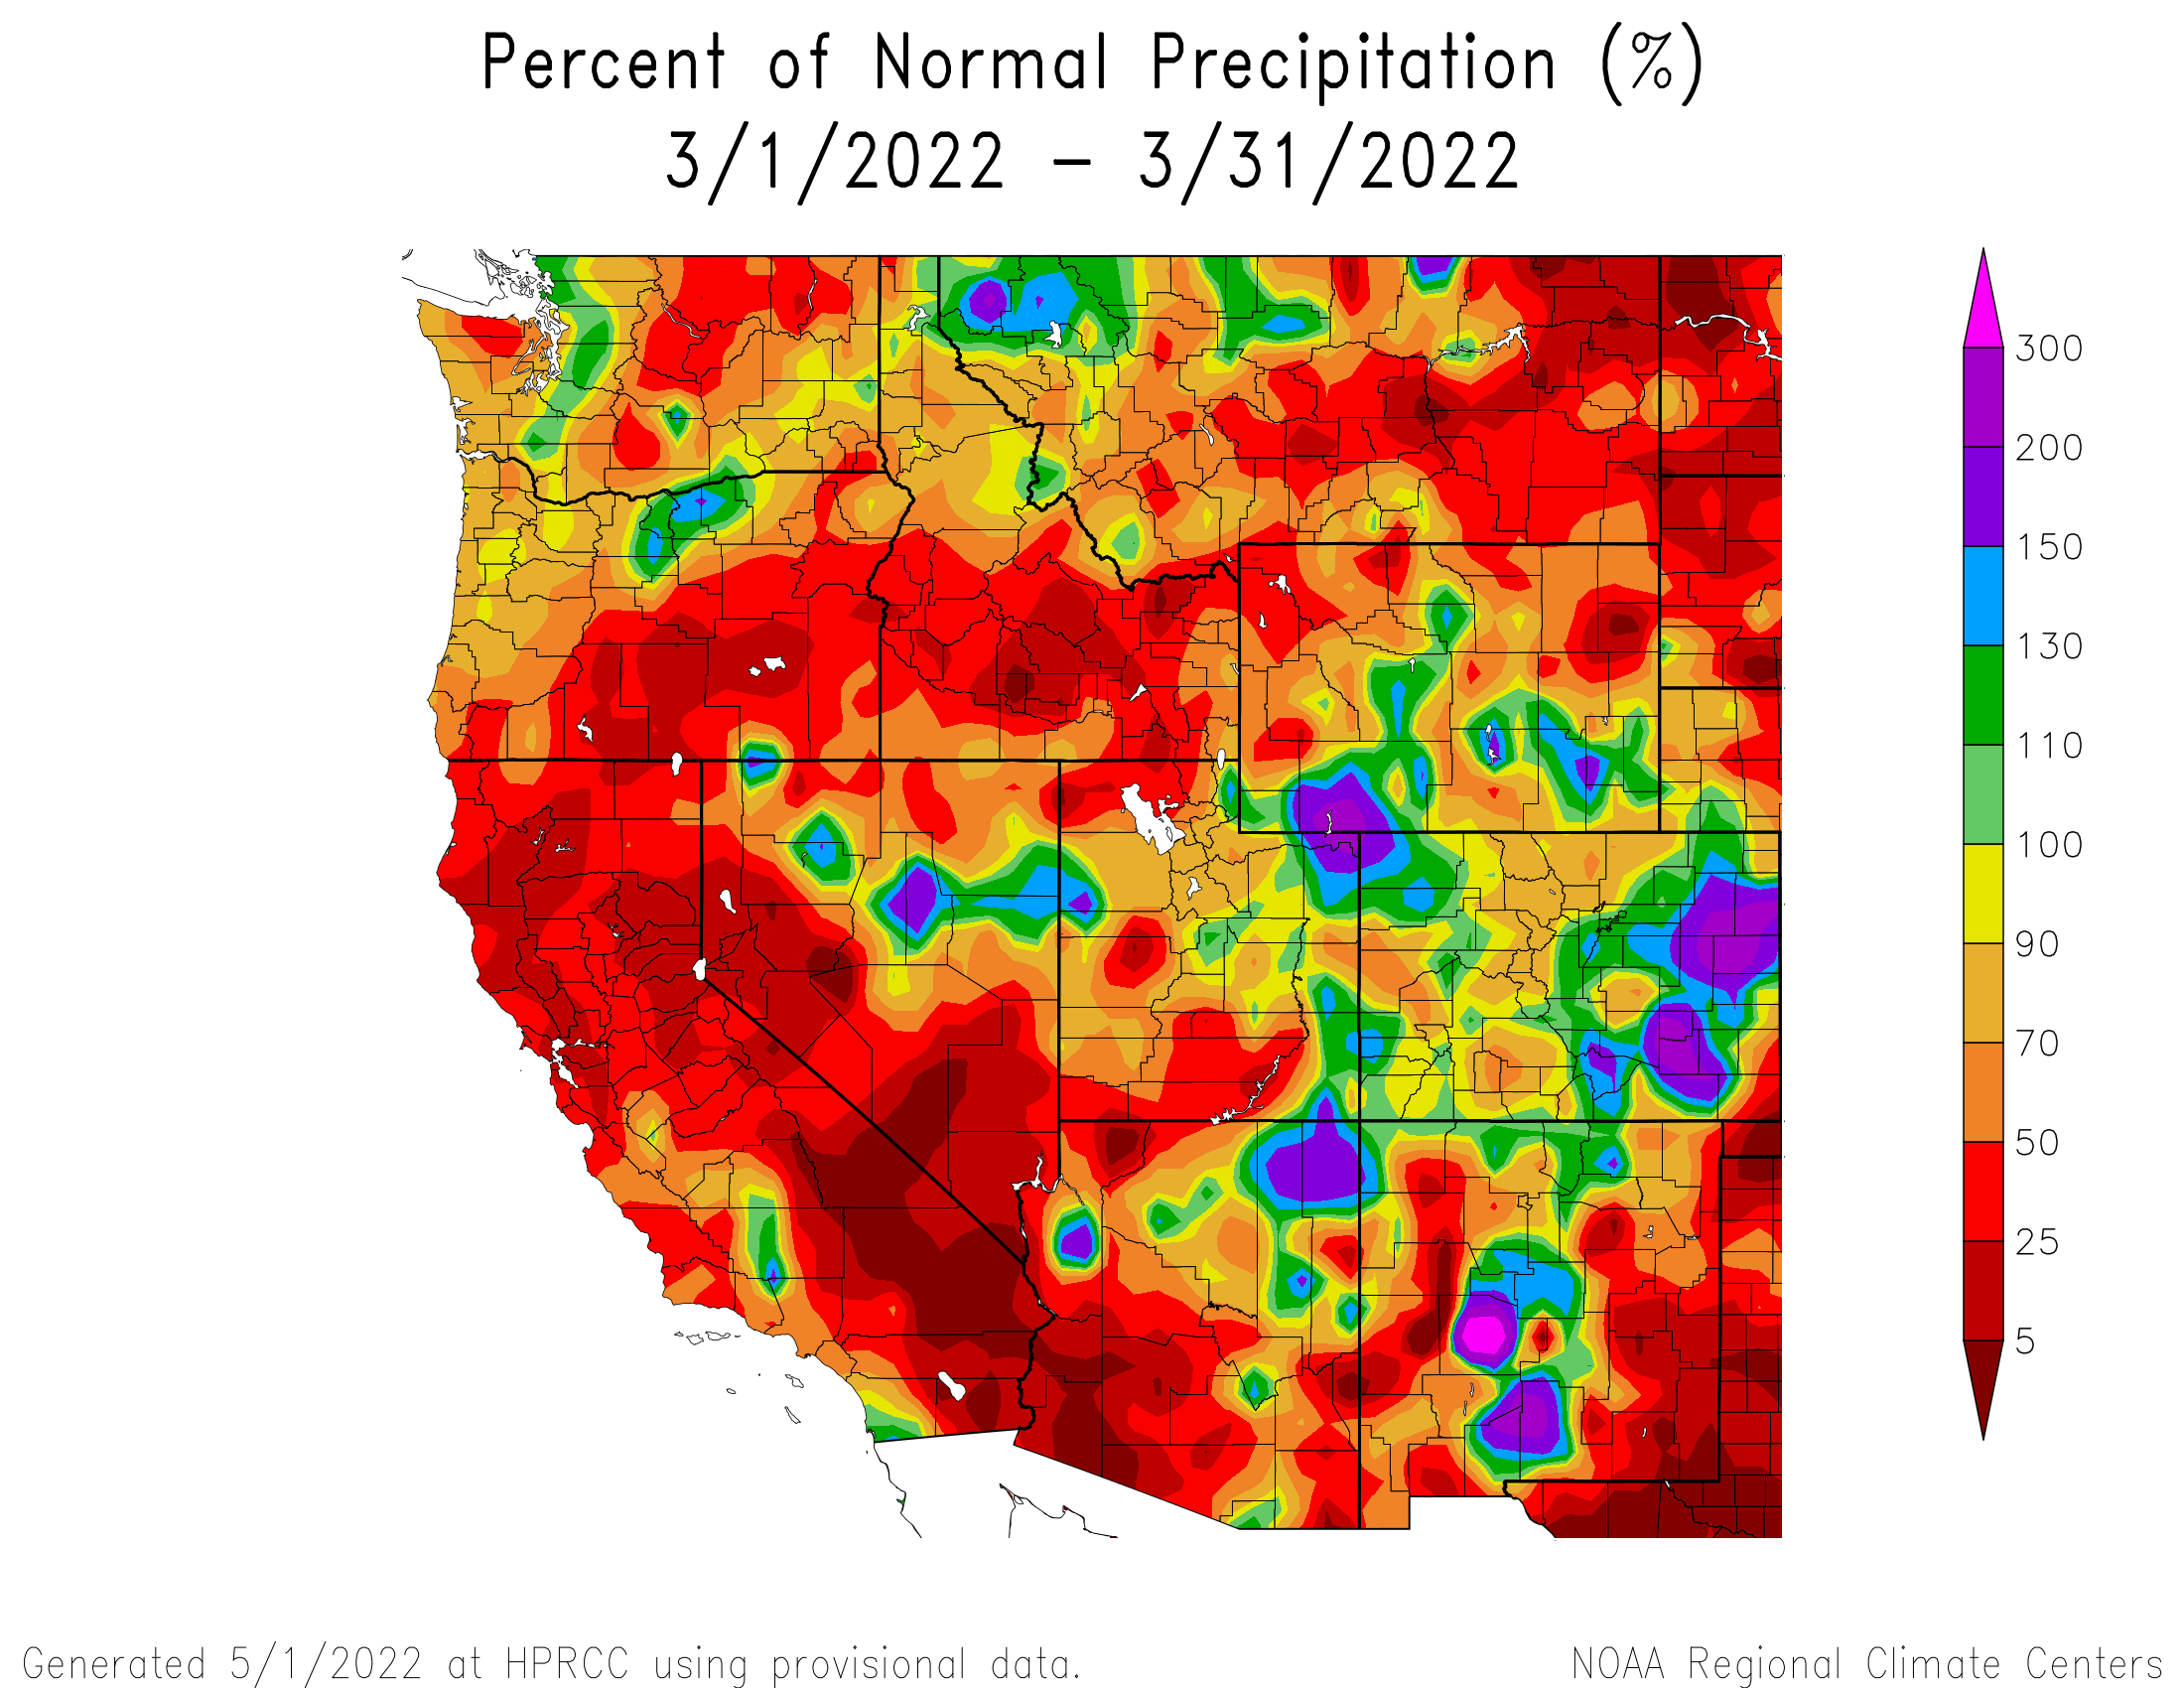
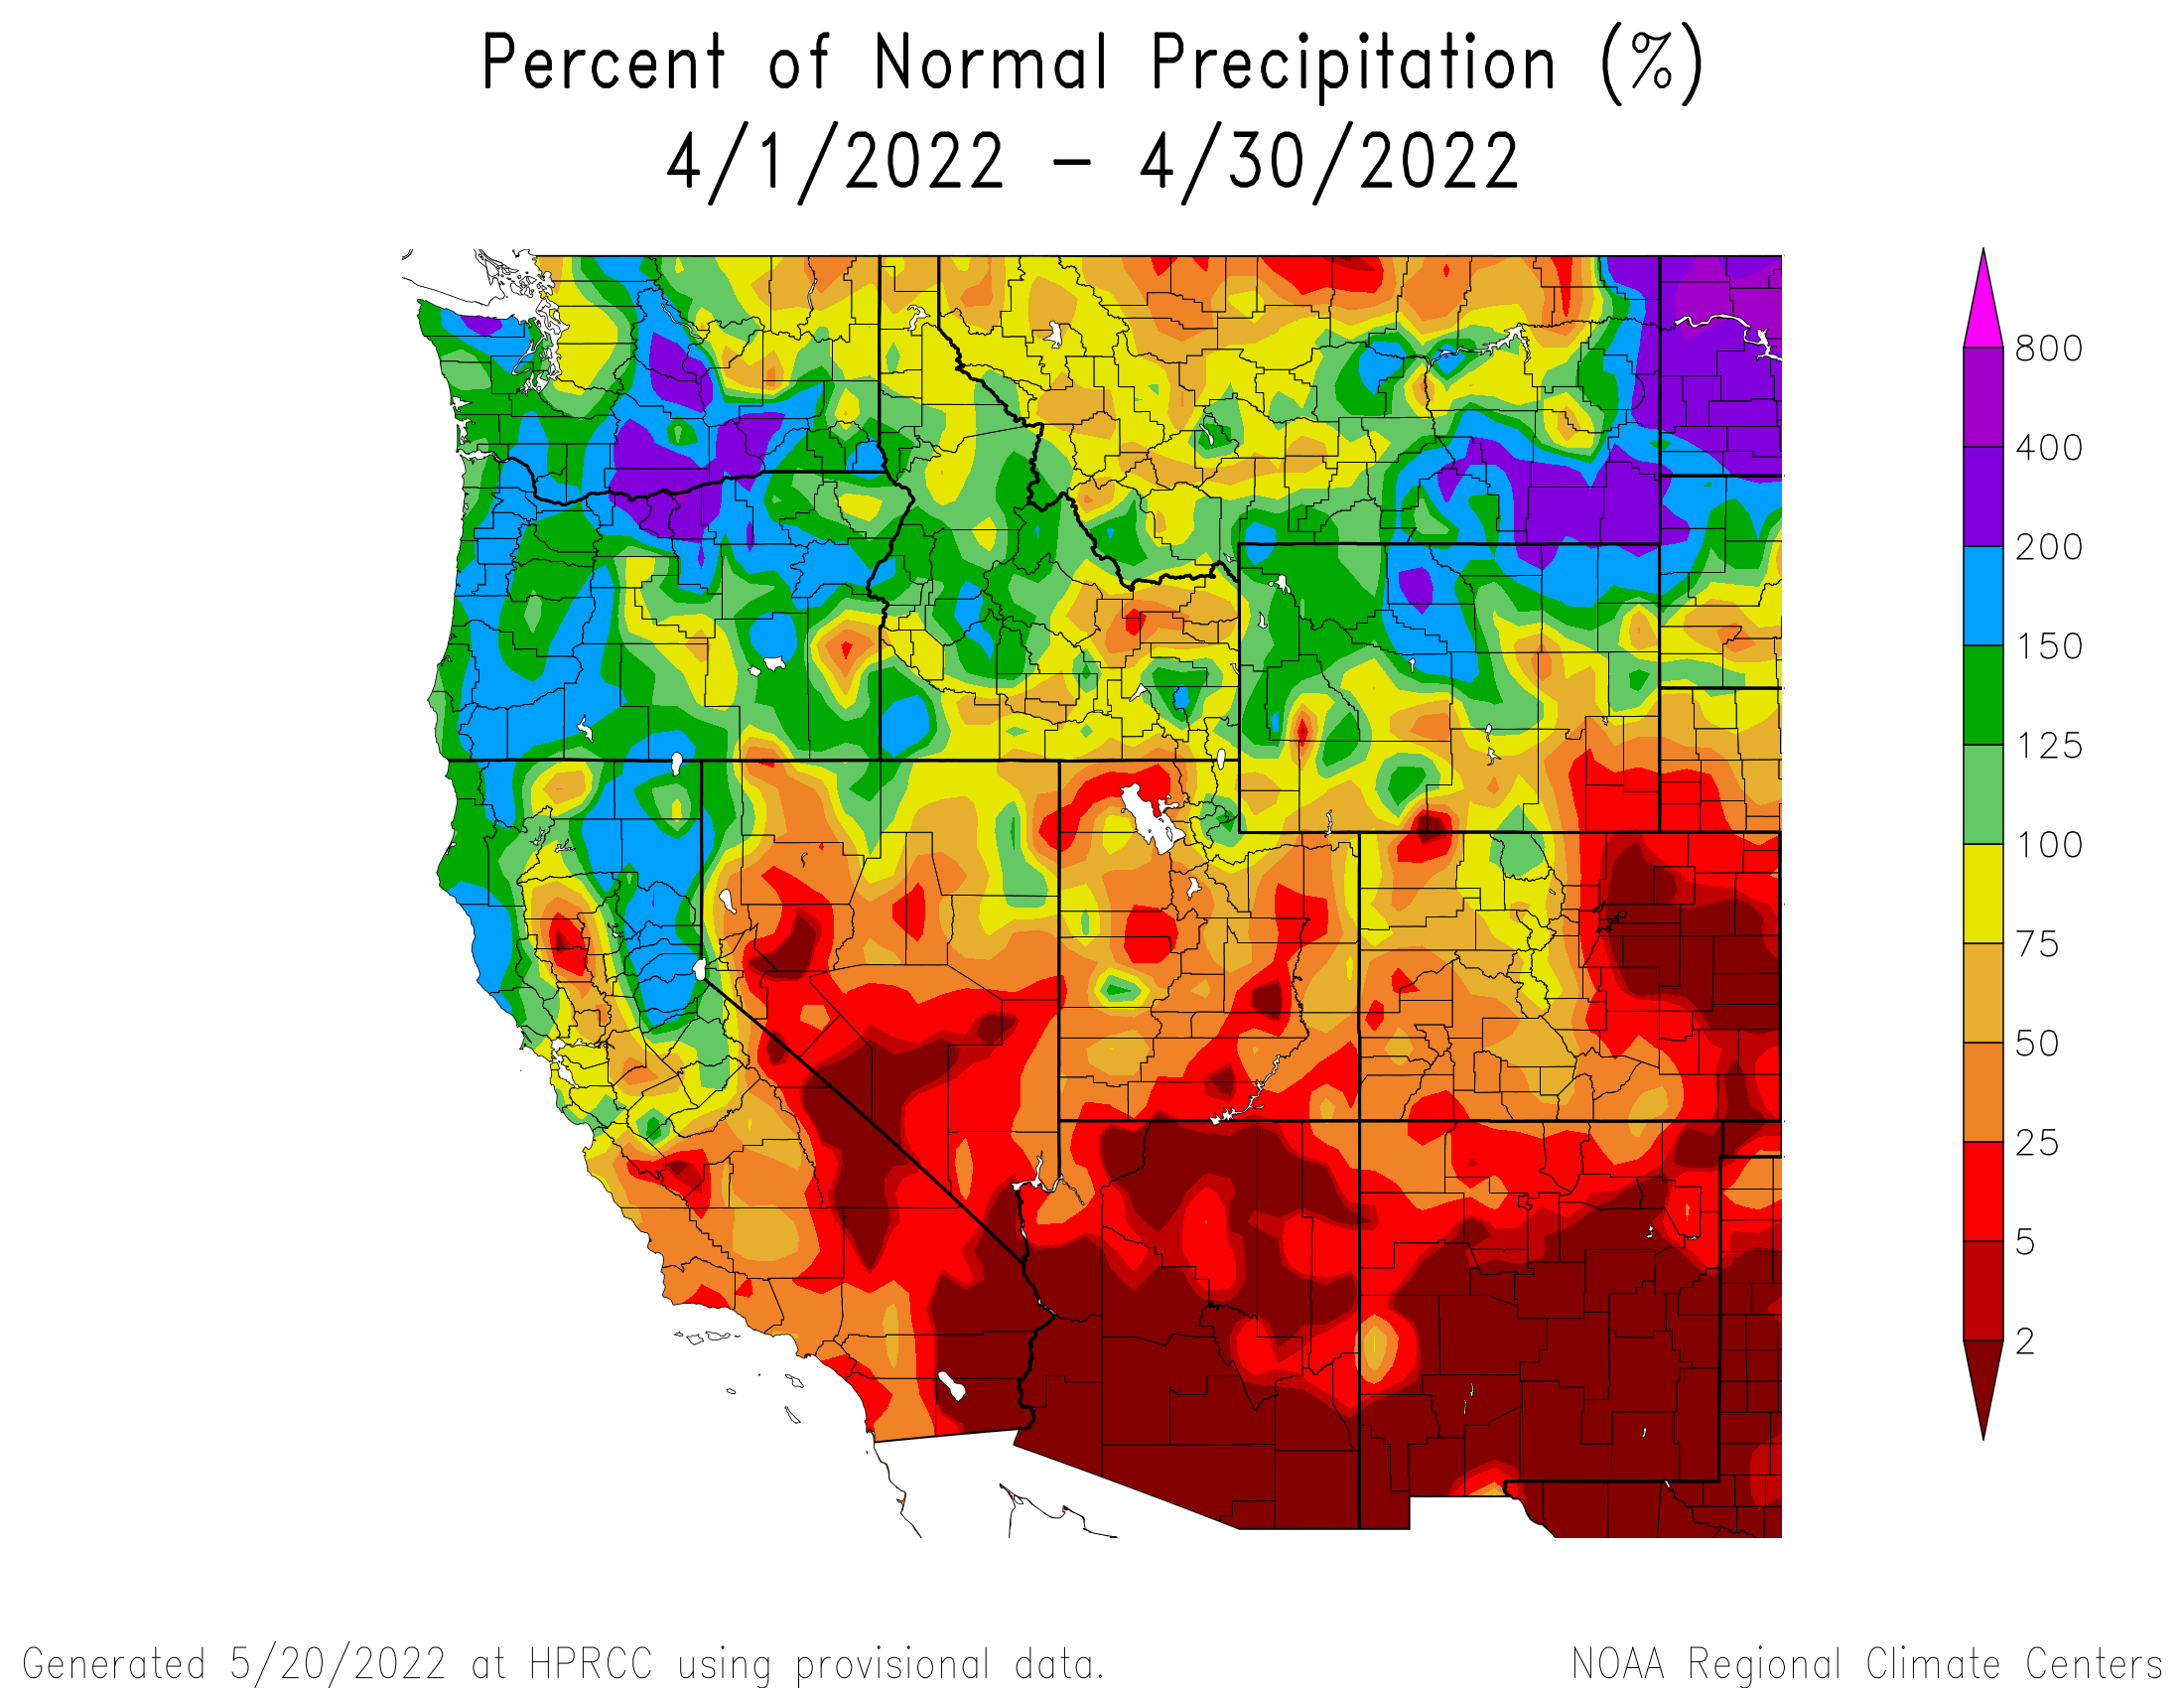
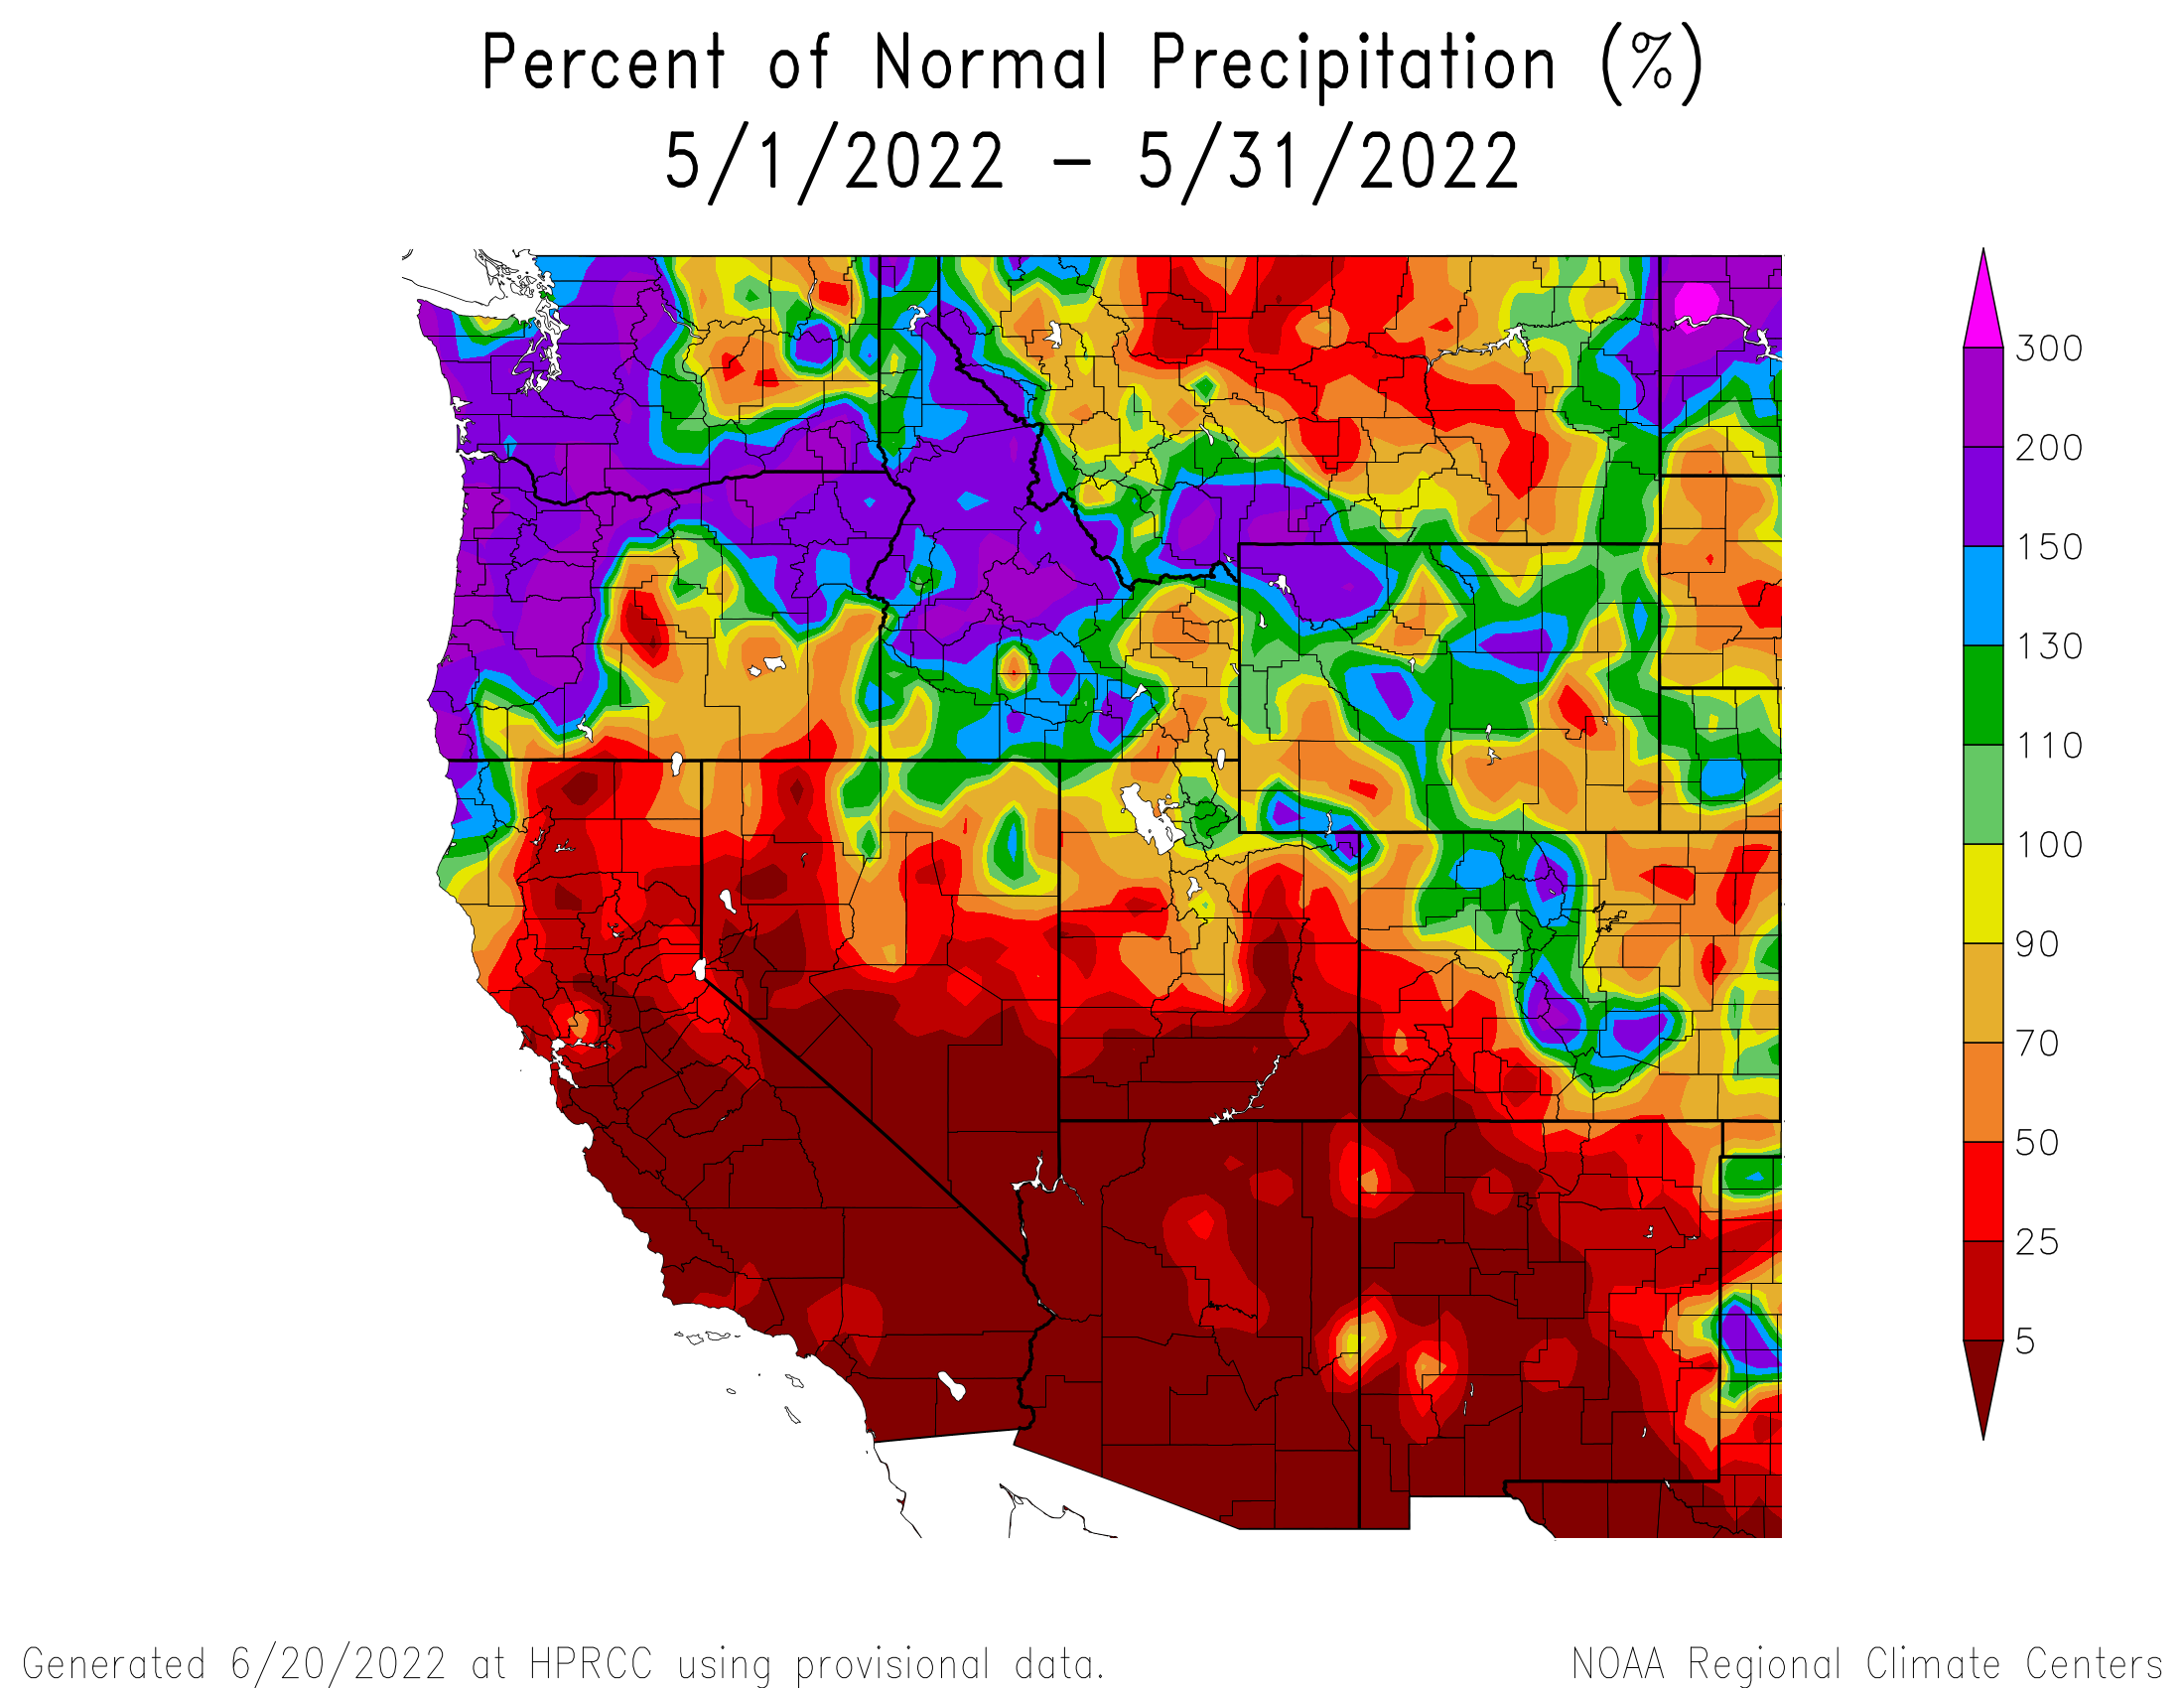
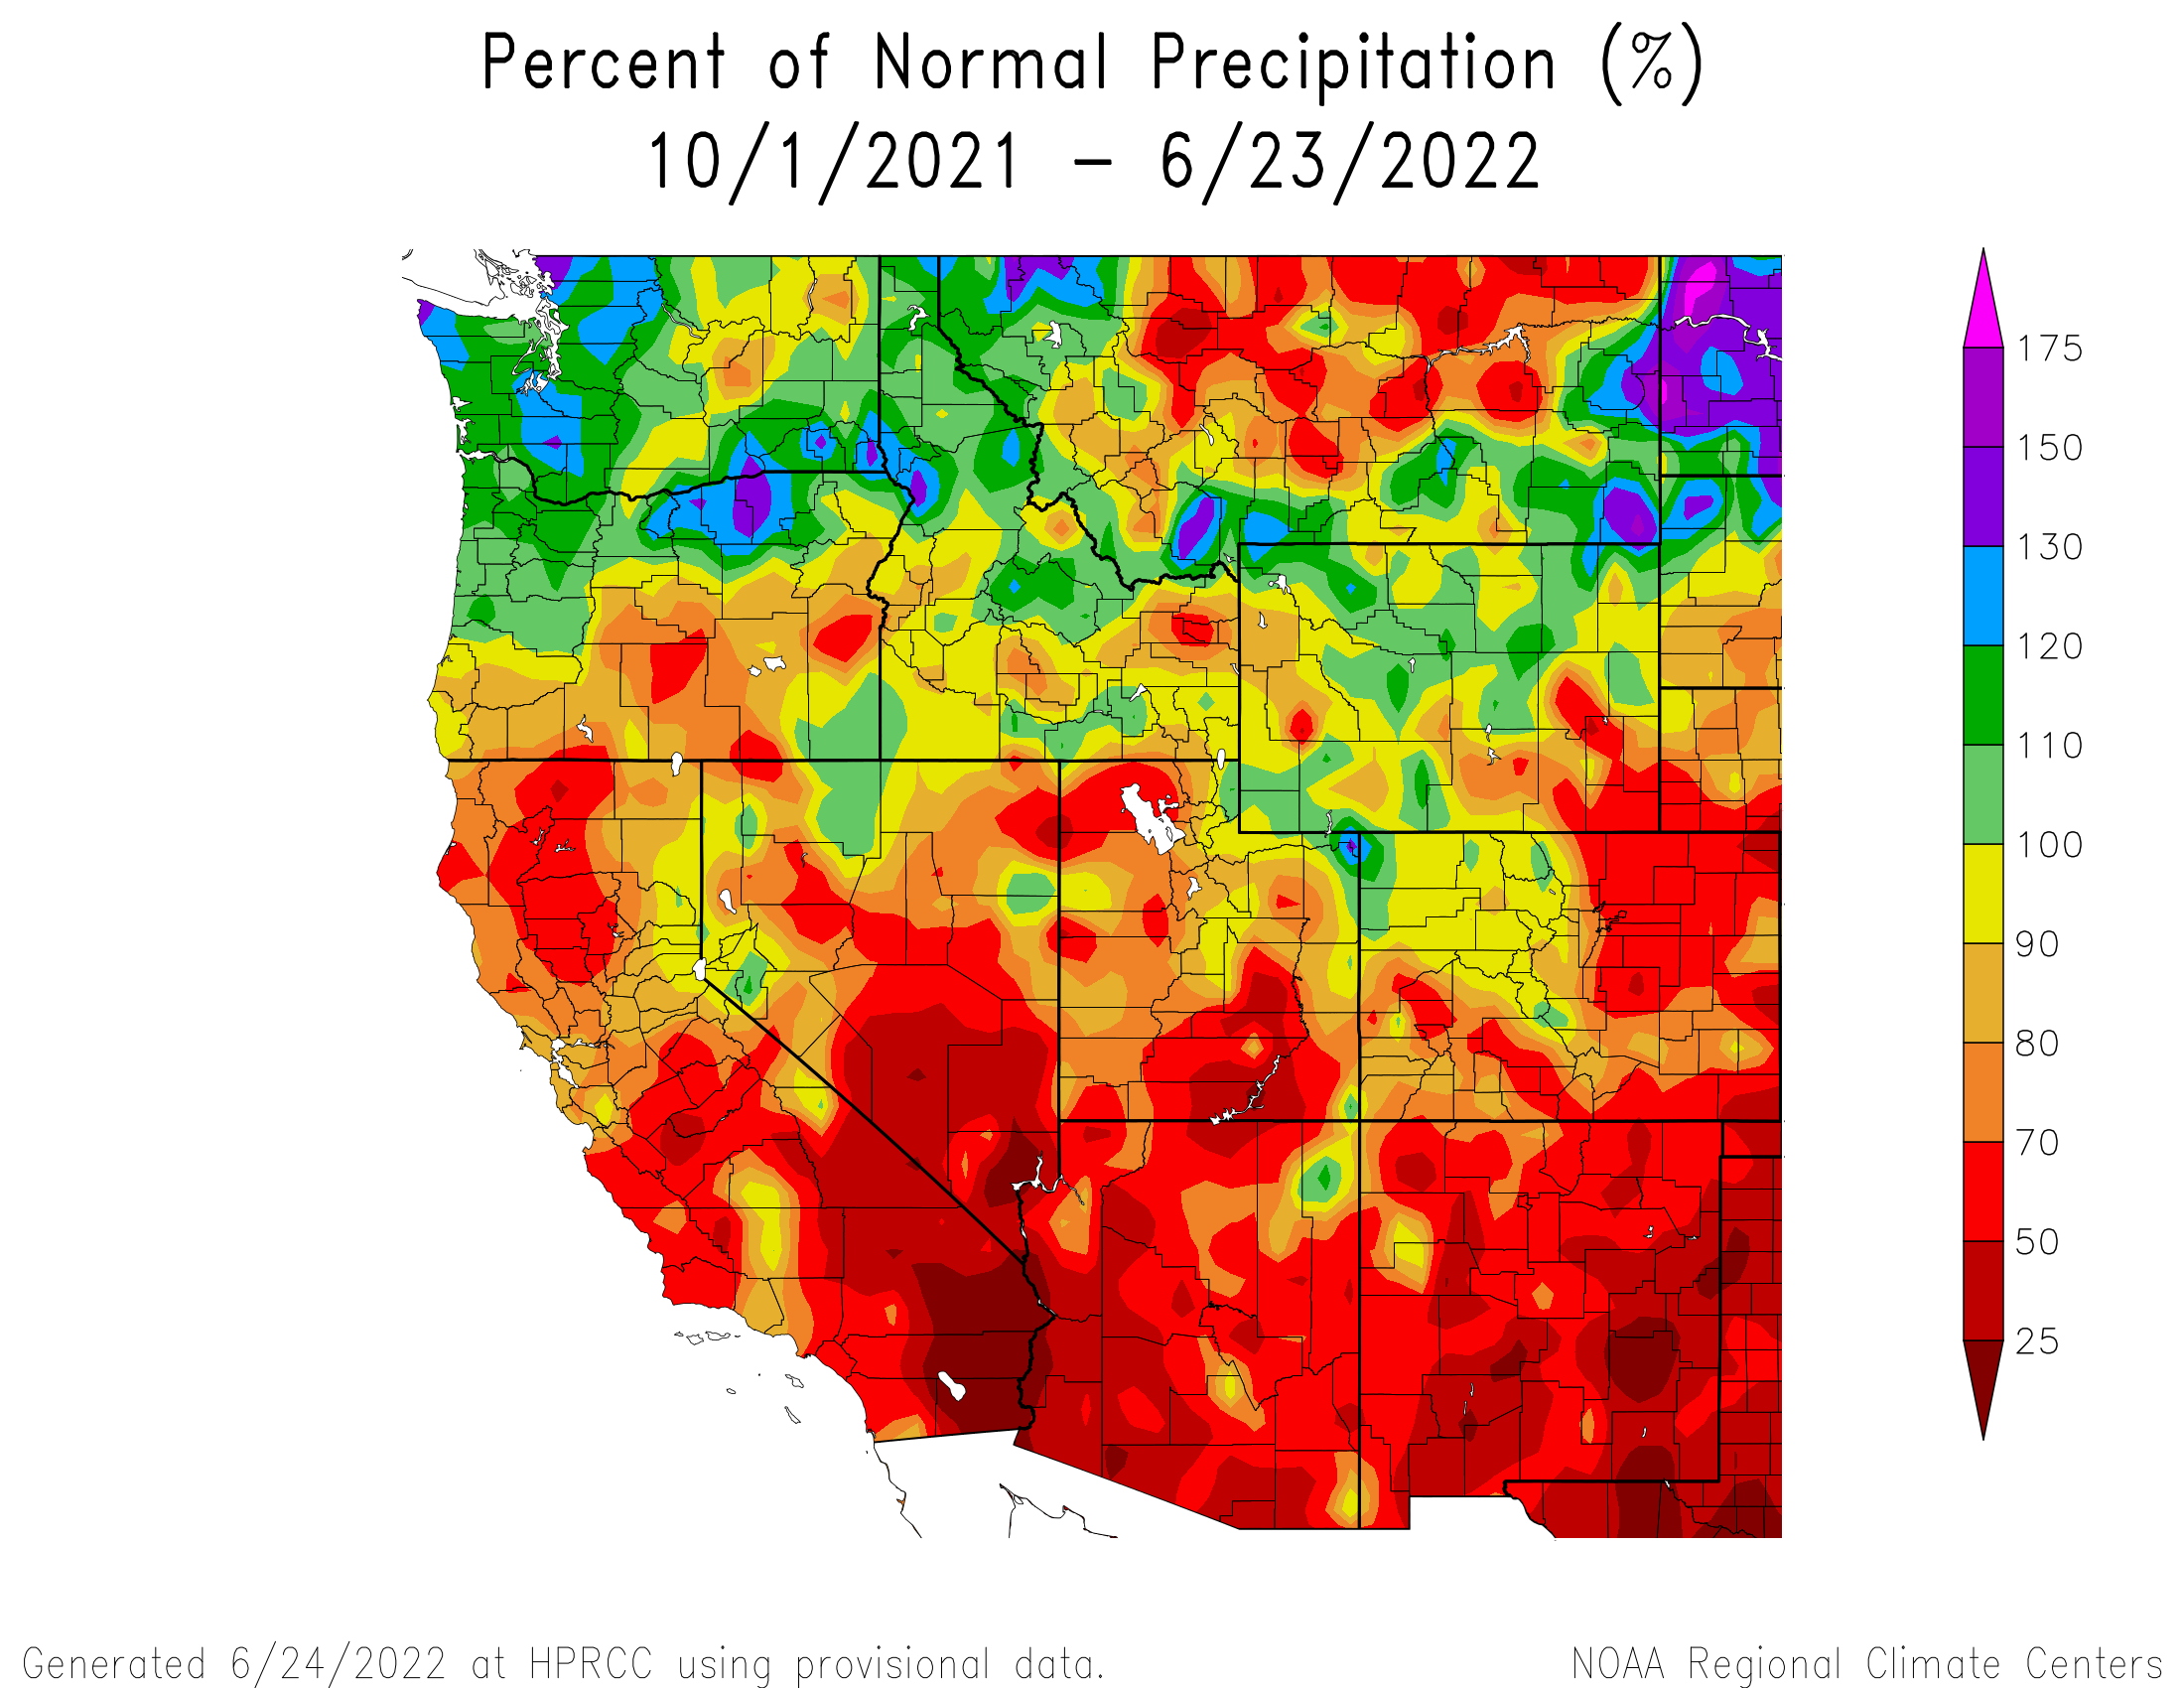
Above: Precipitation at SNOTEL stations for October thru March, April, May, and June. Up until the end of March most SNOTEL stations were largely near normal. Right about April 1 Colorado flatlined in terms of added precipitation except for the North Platte region. May was particularly devastating in the San Juan Mts and most of the Gunnison Basin, but Northern Colorado saw a welcome boost from a productive storm in latter May
SENATOR BECK STUDY BASIN DATA
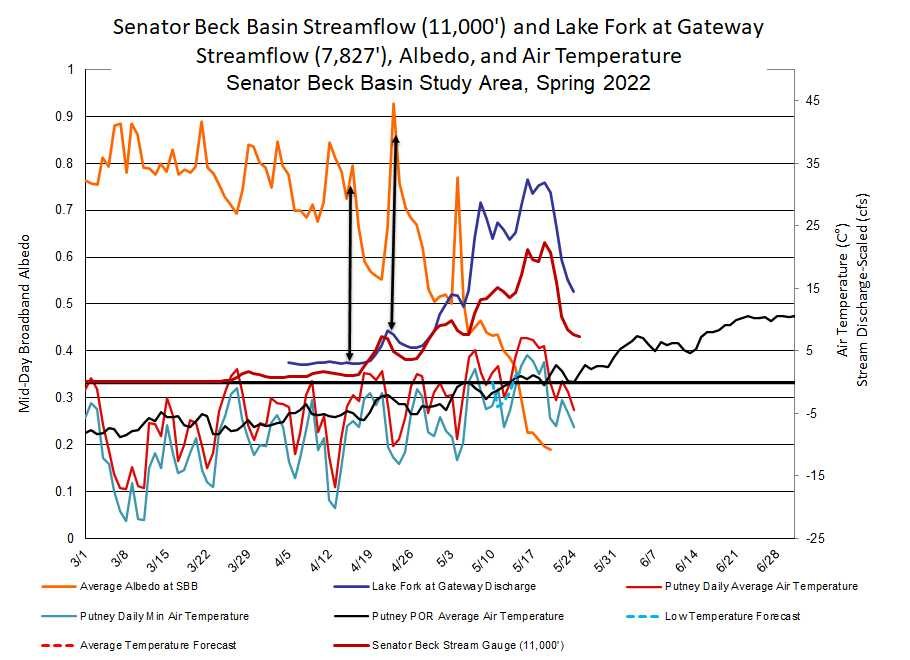
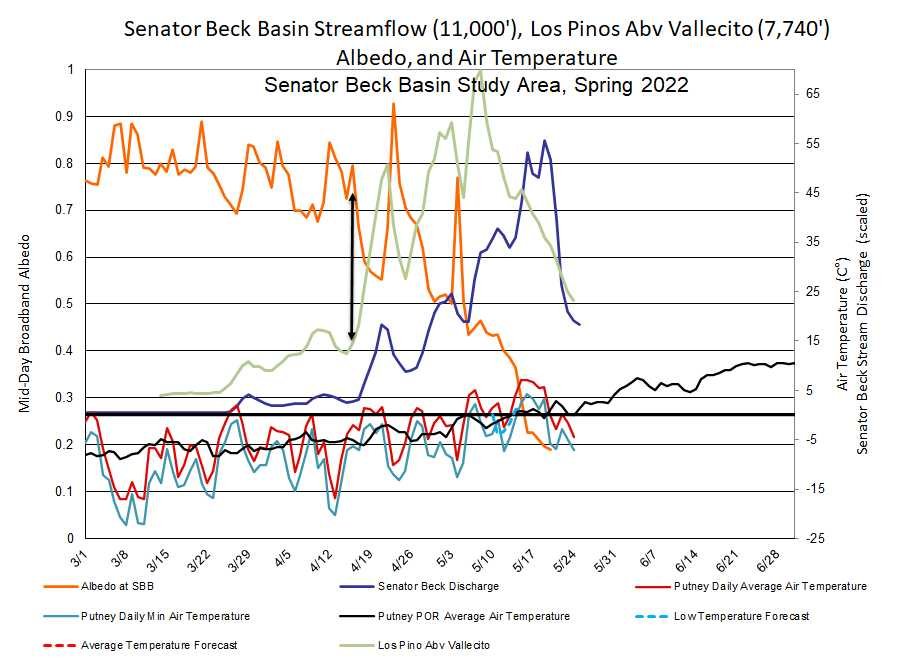
This section describes conditions and data collected by the Center for Snow and Avalanche Studies at our Senator Beck Basin Study Area (SBB) at Red Mountain Pass under our Mountain System Monitoring program, which includes the Colorado Dust-on-Snow Program (CODOS). At SBB, snowpack, weather, soils, and radiation conditions are monitored and measured at the well-sheltered subalpine Swamp Angel Study Plot (SASP, 11,060’) and at the more exposed, alpine Senator Beck Study Plot (SBSP, 12,180’). Nearby, wind speed, wind direction, air temperature, and humidity data are collected at the Putney Study Plot (PTSP, 12,323’), located to minimize the influence of local terrain on those measurements. Finally, SBB streamflow discharge is continuously measured at the SBB pour point at the Senator Beck Stream Gauge (SBSG, 11,030’), in a broad-crested, notched weir.

Winter storms got off to a decent start but then in January started falling behind in the storm count. The lack of spring storms, productive storms, really took its toll in the end. Typically, the above storm count plot looks a lot like the cumulative precipitation plot below, as the number of storms tapered off in spring so did any additional snow accumulation. All total we received 20 storms this winter, the average is around 24. A storm is defined as receiving 12 mm or more of precipitation with no break in precipitation greater than 12 hours. We received 2 storms in April and 0 in May. This winter we had 1 more storm than we did in WY2021. Winter storm reports can be viewed at the snowstudies.org website.

The above graph shows precipitation at SASP with snow depth at SASP and SBSP. After an encouraging start to the season, the tap was turned off in January and first half of February. Things picked up latter February and March but then dropped off in April and May. After going into April with a near normal snowpack, it was devastating to see another warm/dry spring combined with high dust loads result in rapid snowpack ablation.

Above: Water Year 2022 cumulative precipitation, in April we received 2.0” precipitation and in May we received 0.7”. The average is closer to 4.4” and 3”, respectively.
SNOWPACK CONDITIONS
We went into the winter under better (but not great) conditions than the previous year in terms of soil moisture due to improved monsoon activity. The month of October also improved soil moisture with 3 notable moist winter storms. In the San Juan Mountains an October 12 storm provided enough snow to mark the beginning of winter in the high country. November was hot/dry and kicked off the stairstep accumulation pattern began that lasted until around April 1. The notable accumulation periods were the last half of December, latter February, and mid-March. April and May were generally cooler/wetter across northern basins and warmer/drier across southern basins, which had a big impact on snowmelt as shown in the images below.
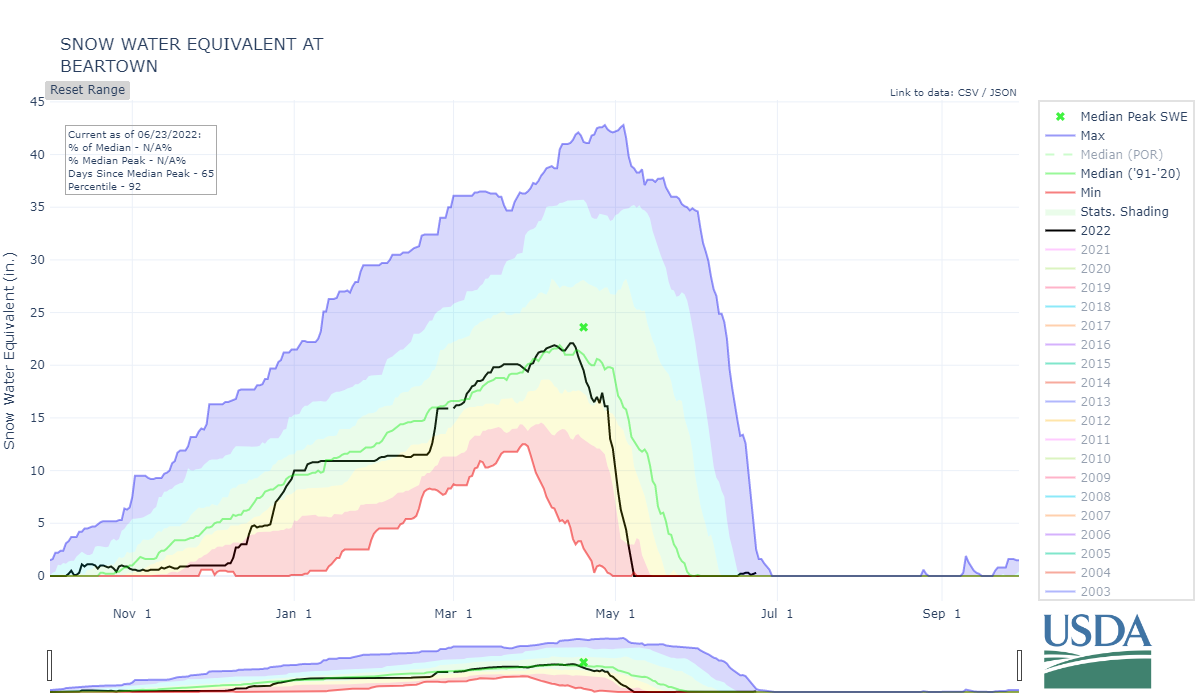
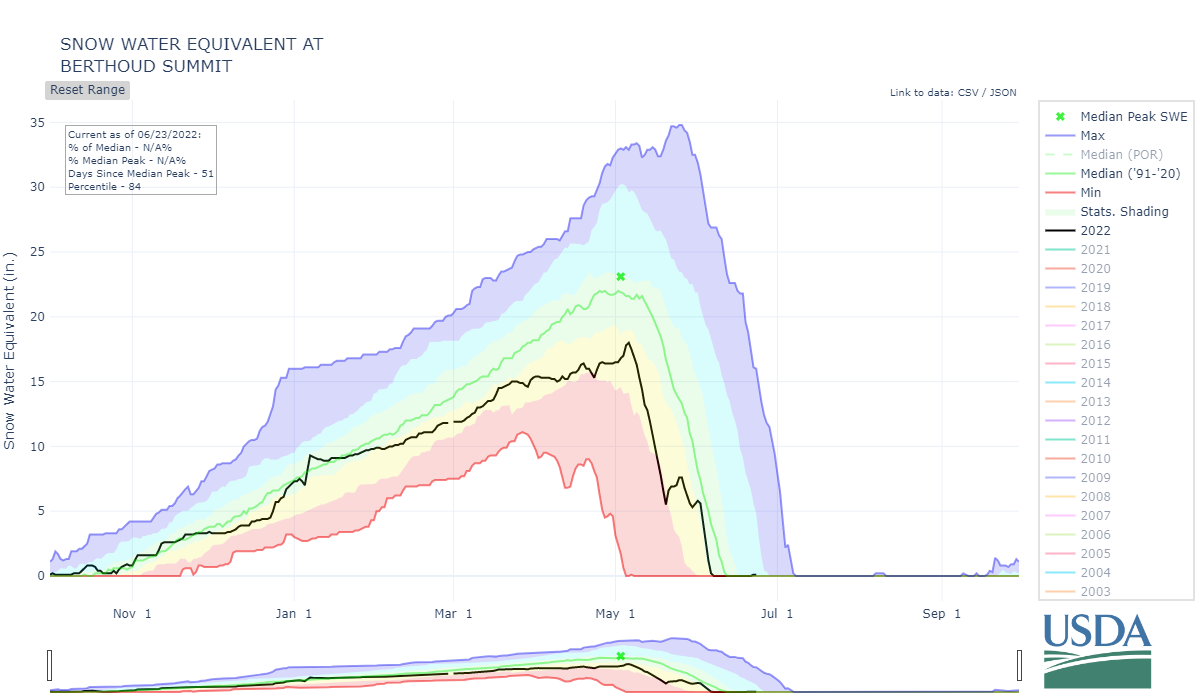
It is worth mentioning that the alpine environment (above ~12,000’) had a very shallow snowpack according to our Senator Beck Study Plot (see SWE and snow depth plots below). High elevations are notoriously difficult to monitor but SBSP has proven to be indicative of high terrain in the region over the last 20 years. SNOTEL stations do not capture snowpack conditions above 11,000’. Hydroclimate stations above treeline are very rare, in fact SBSP is the only station in Colorado (some have recently come online but only with 1-2 years data record). This year the reason for the high elevation shallow snowpack is in large part the record high winds all of Colorado experienced, notably in spring. Particularly in the San Juan’s this meant very little snow remaining in late spring and early summer to maintain normal streamflow.
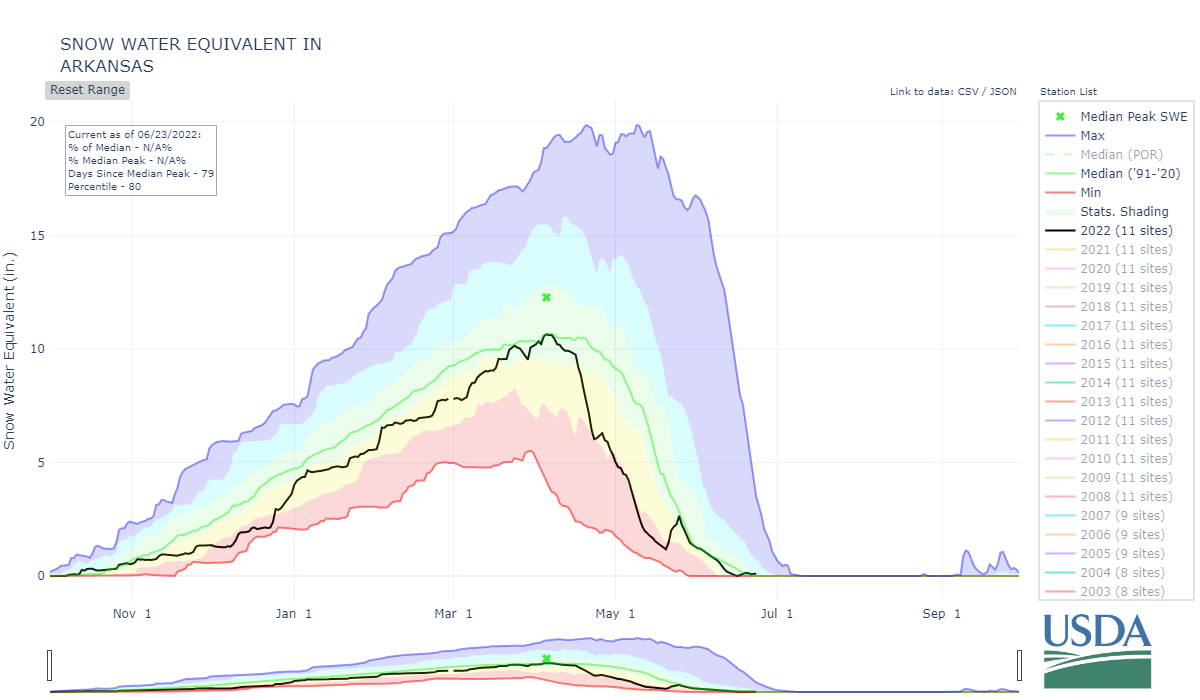
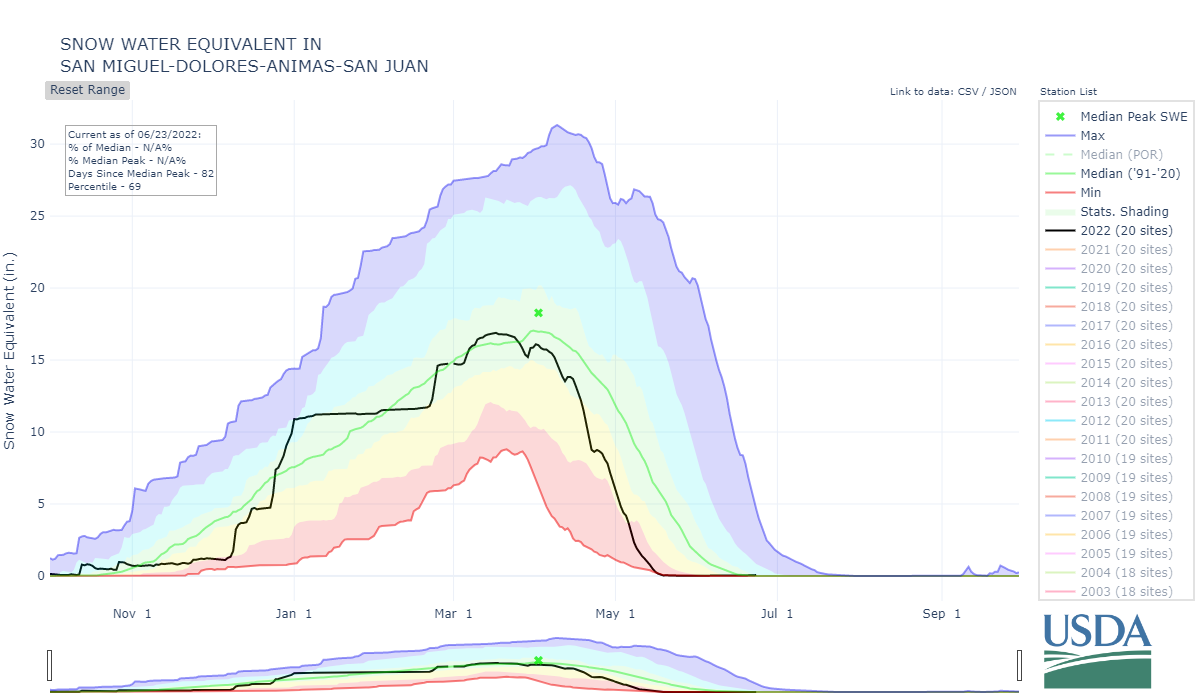
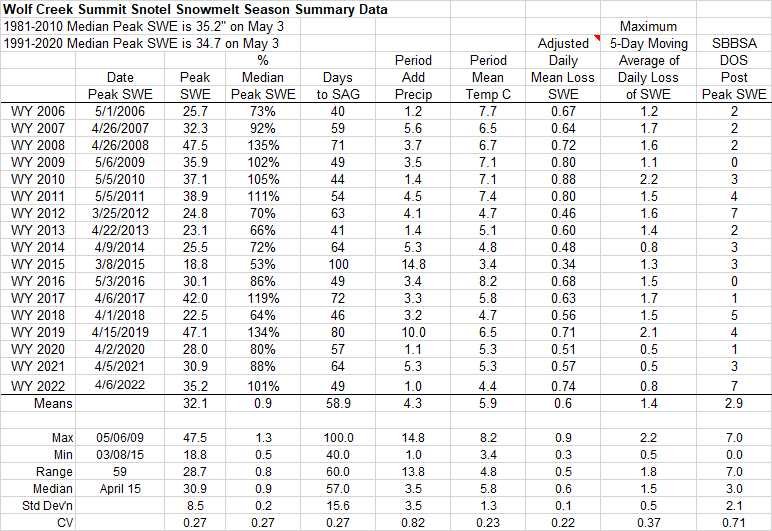
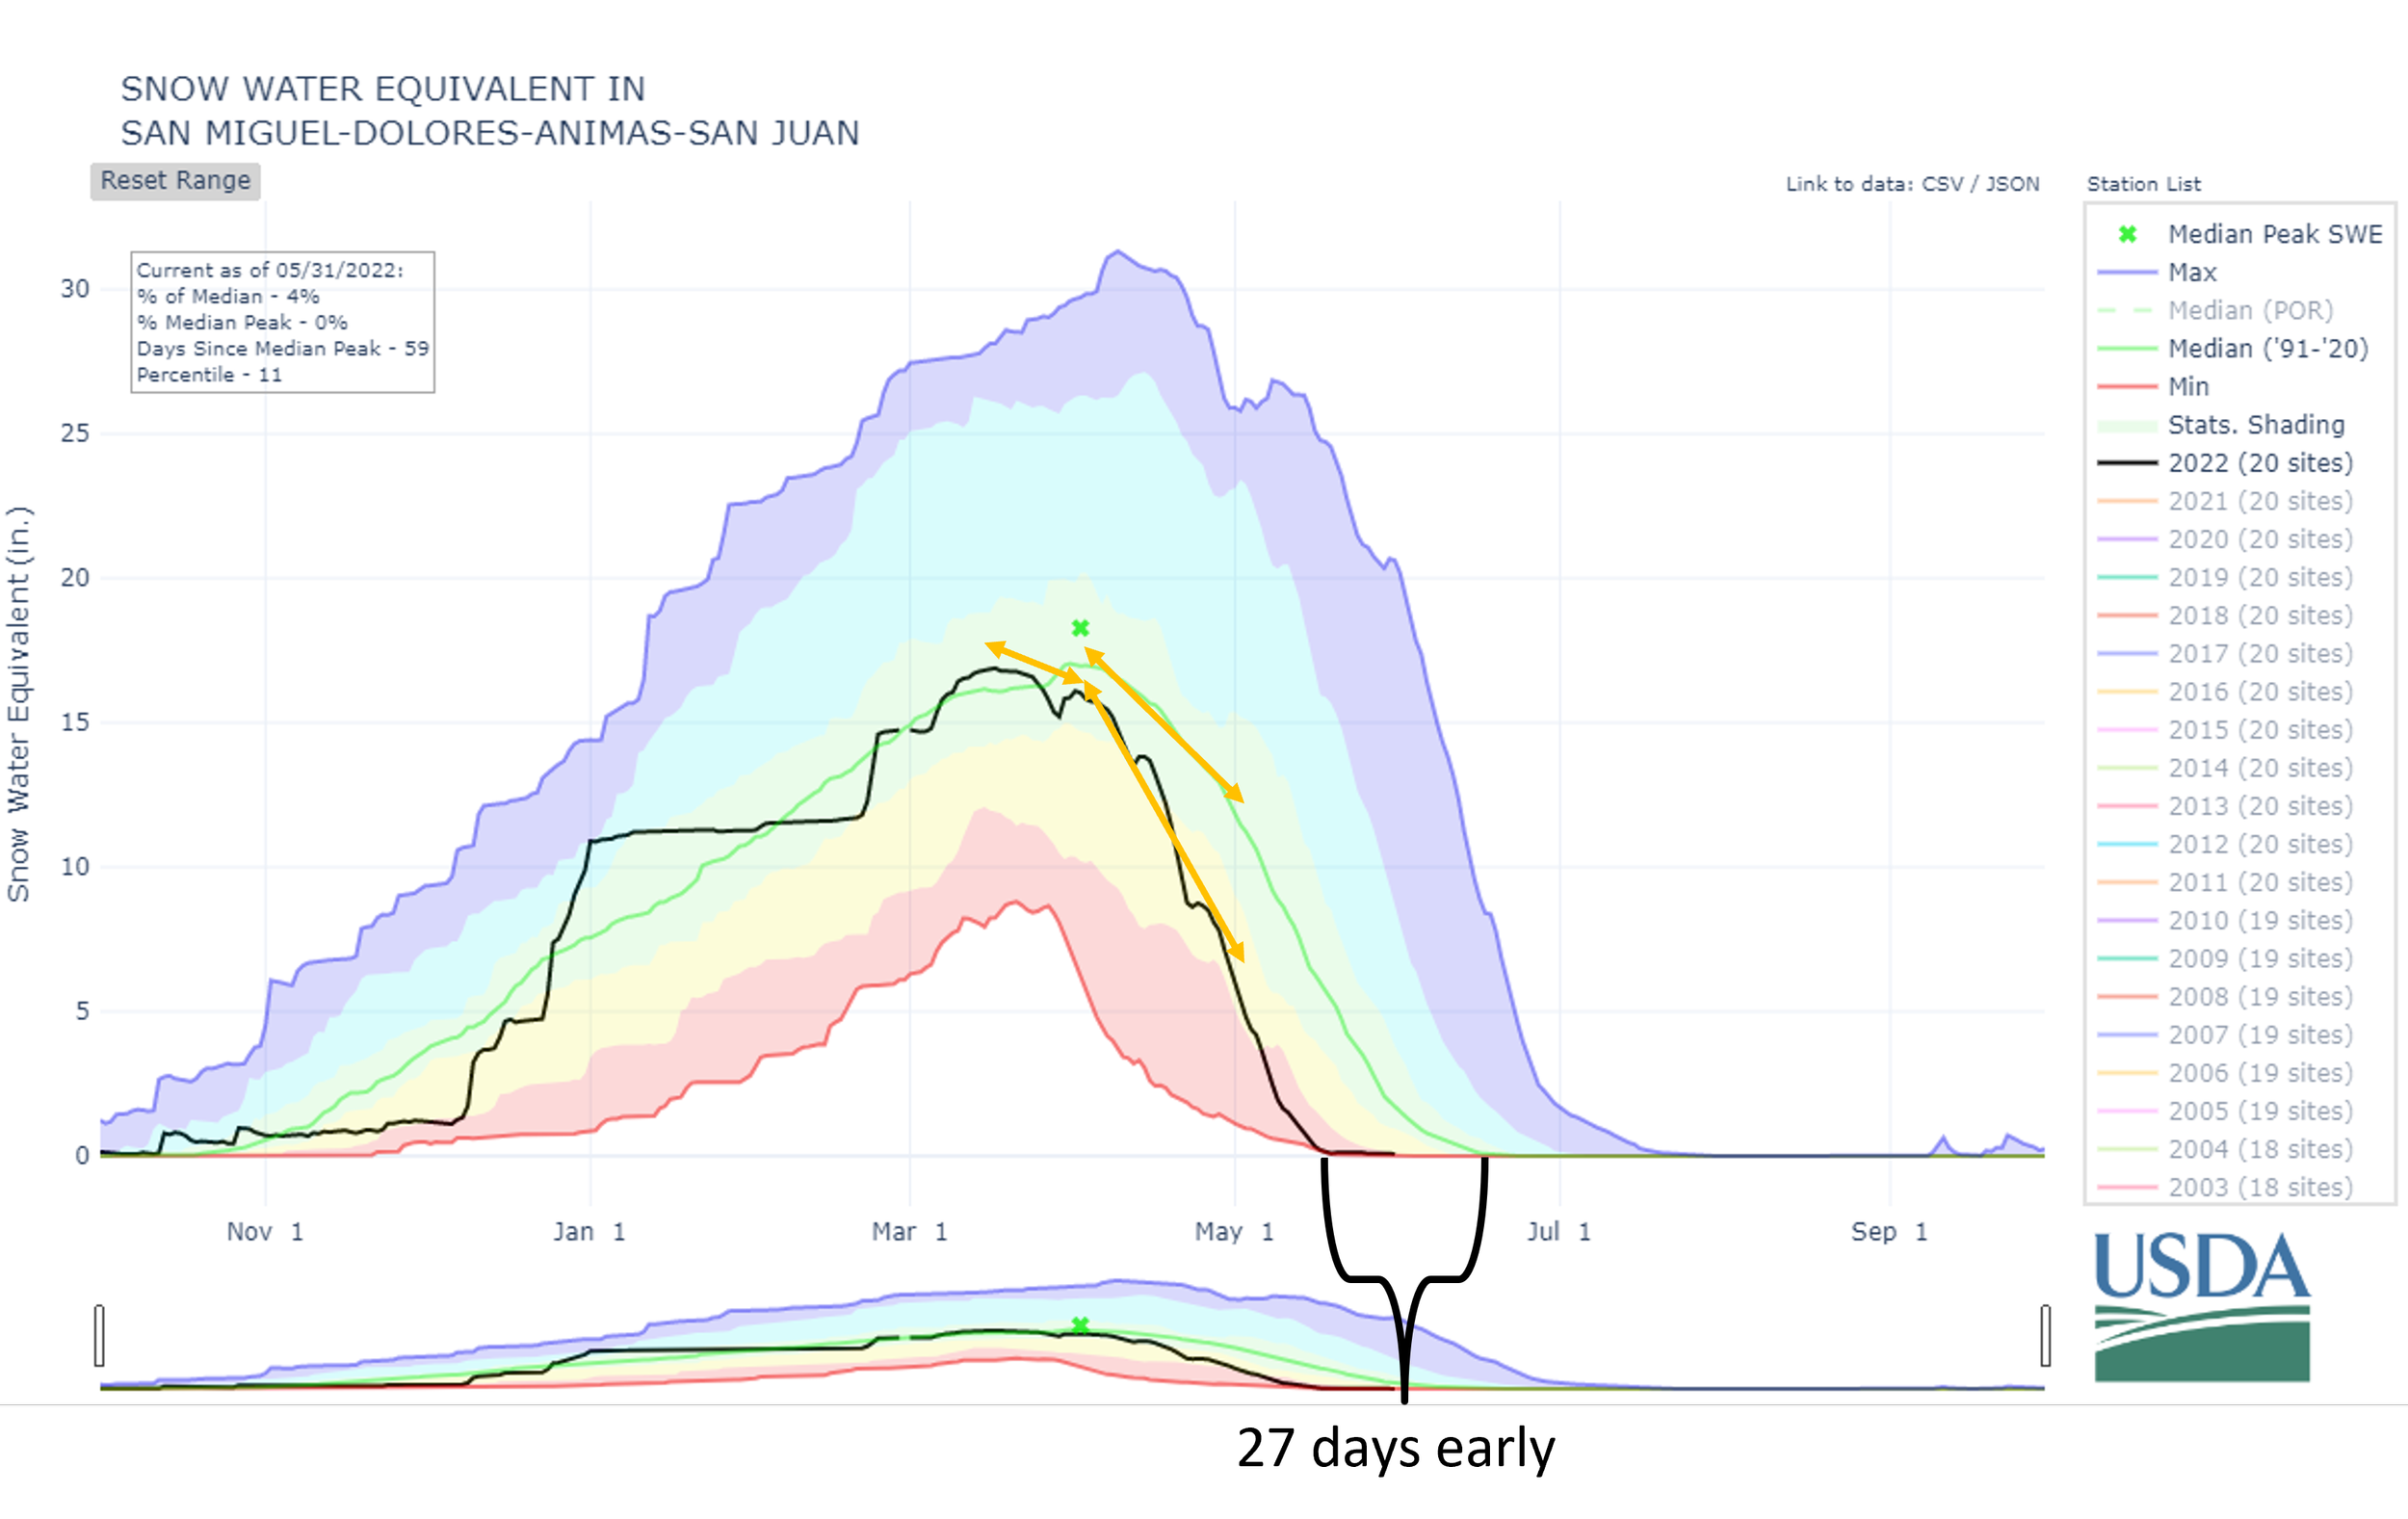
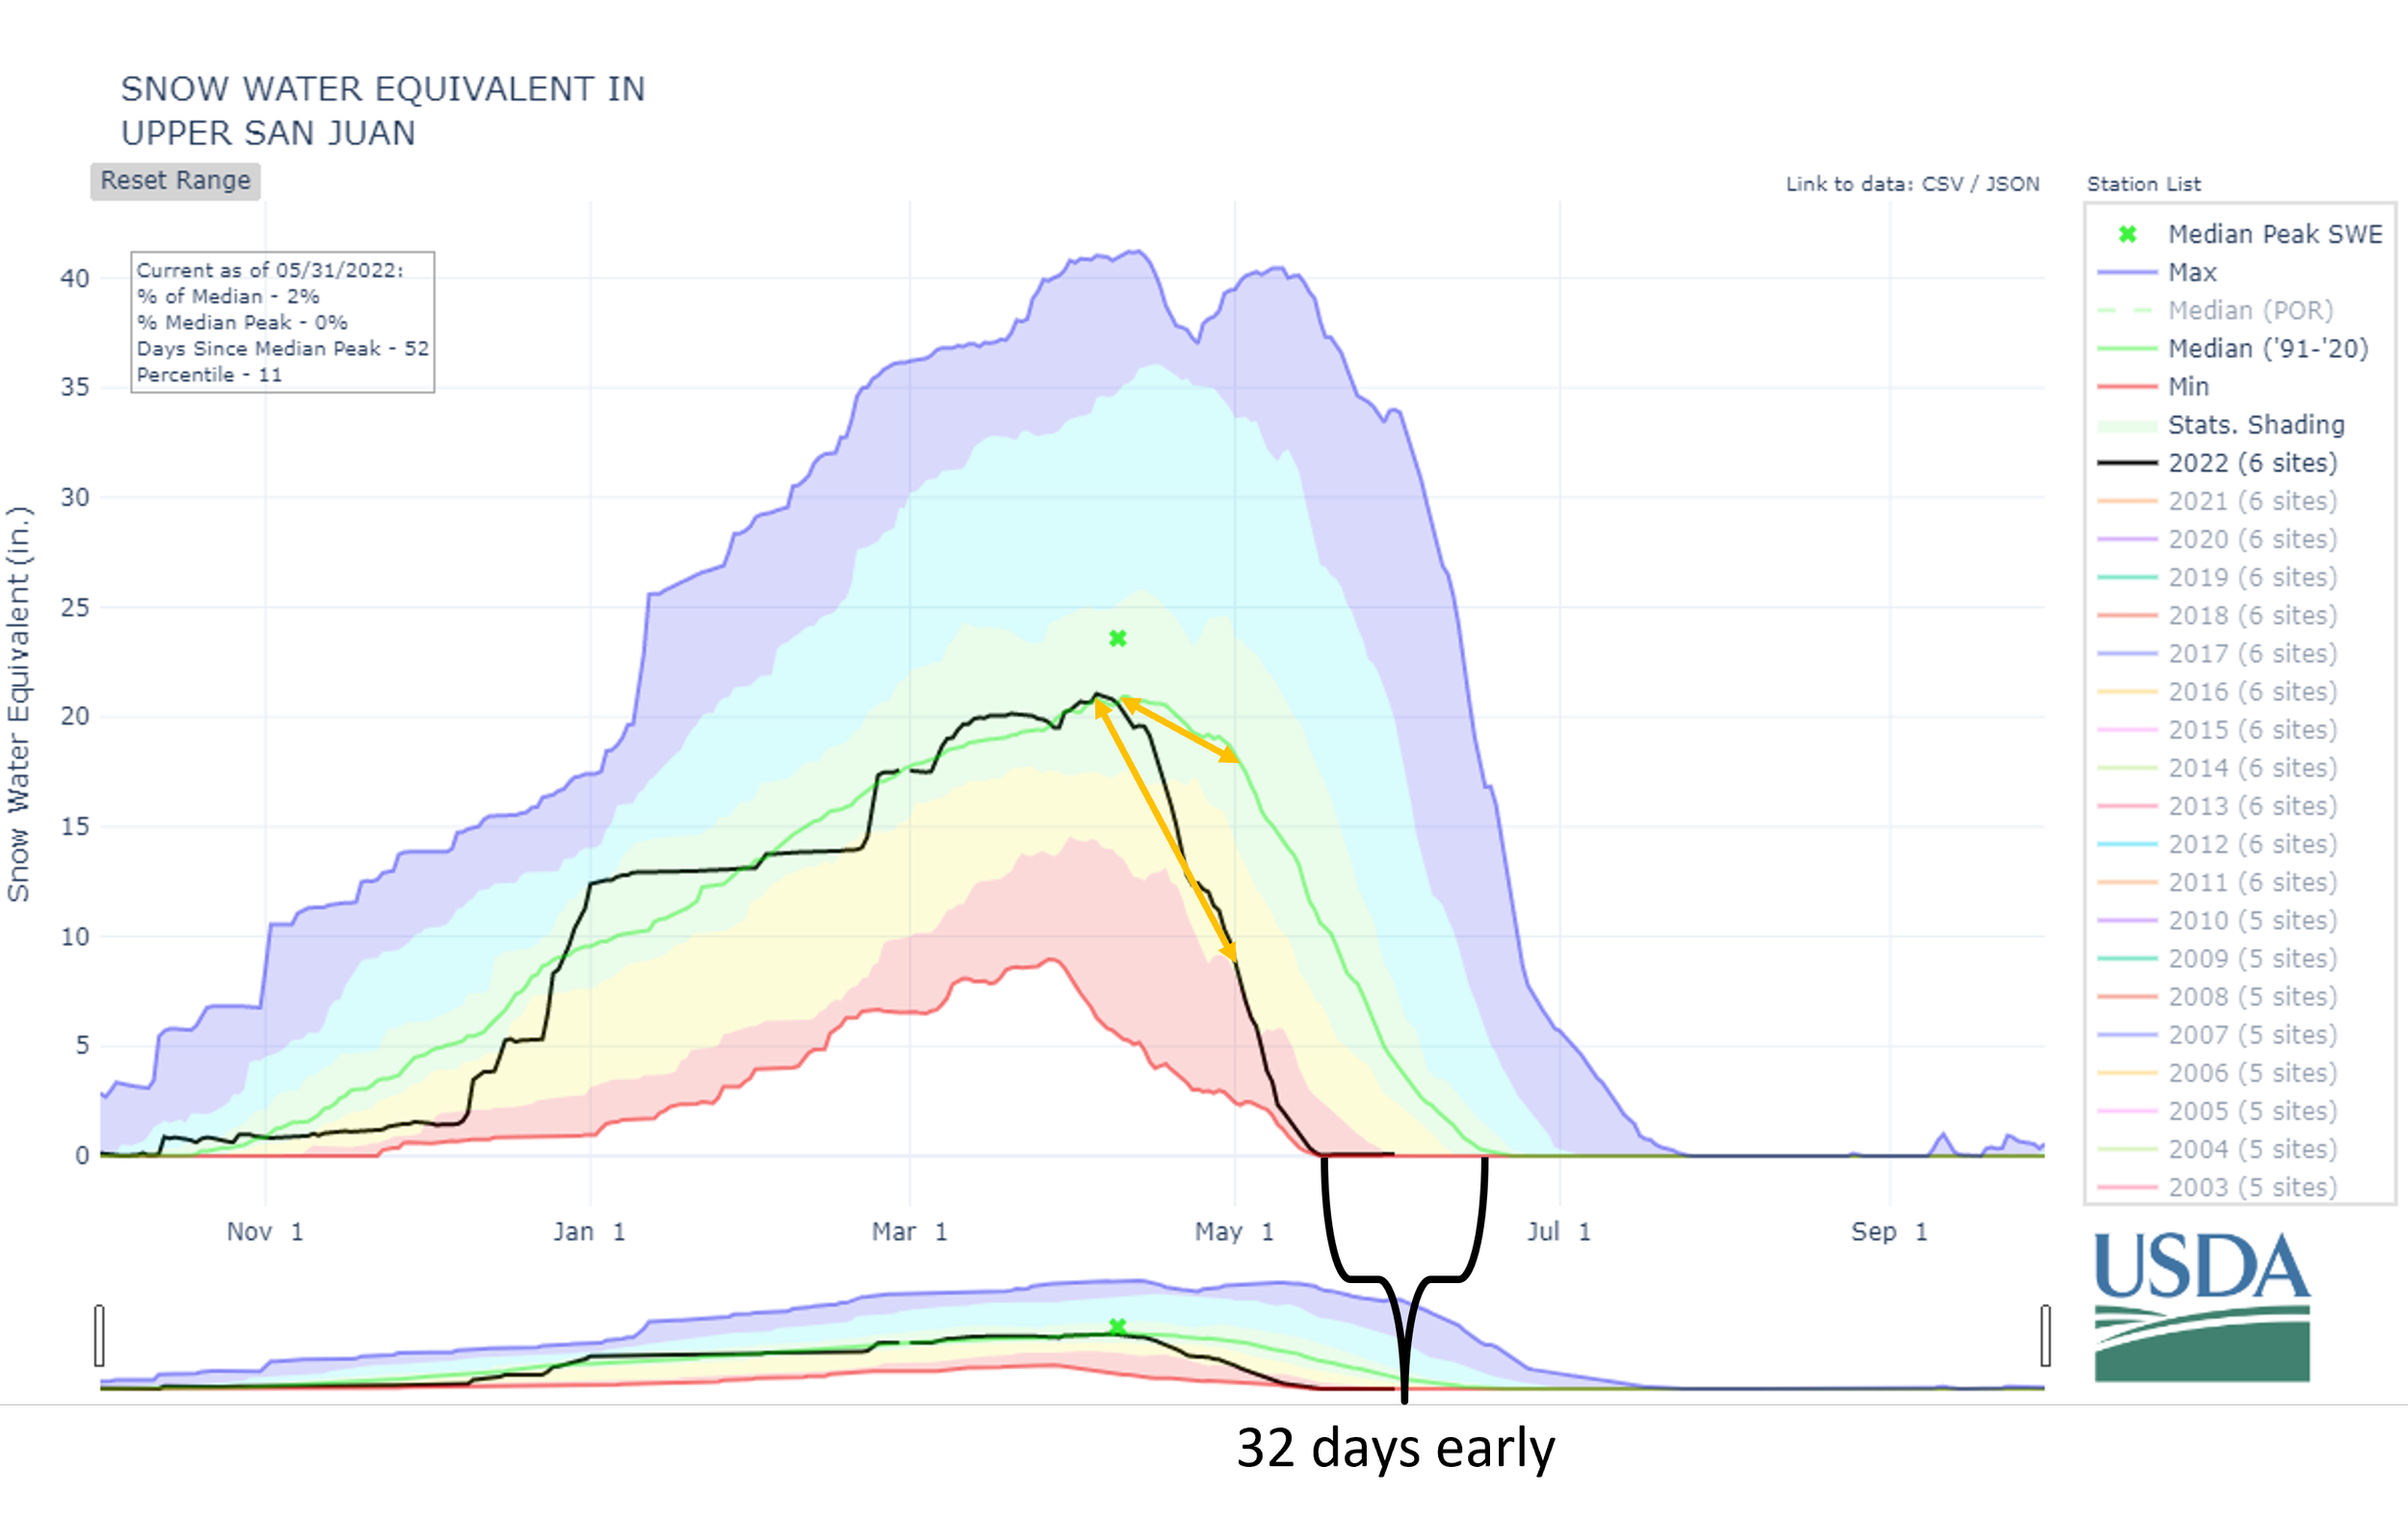
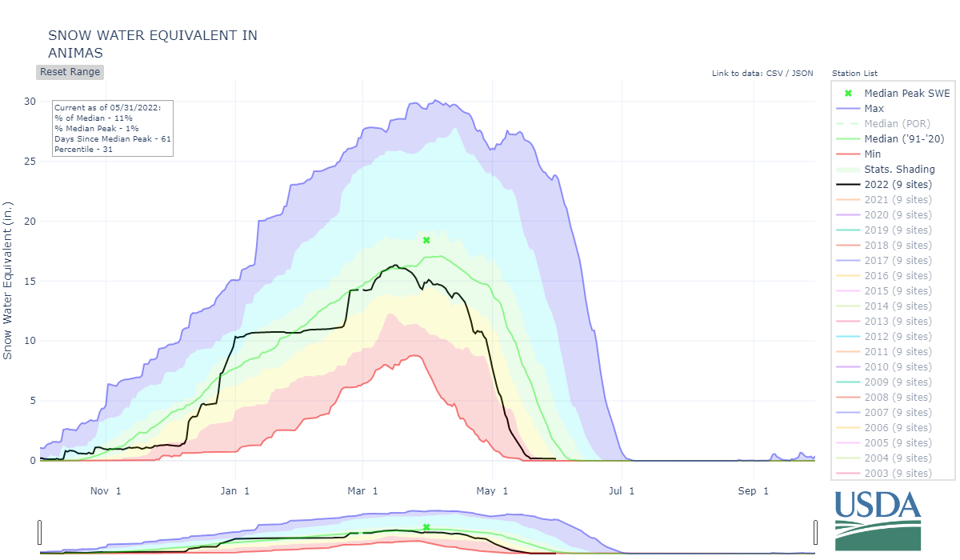
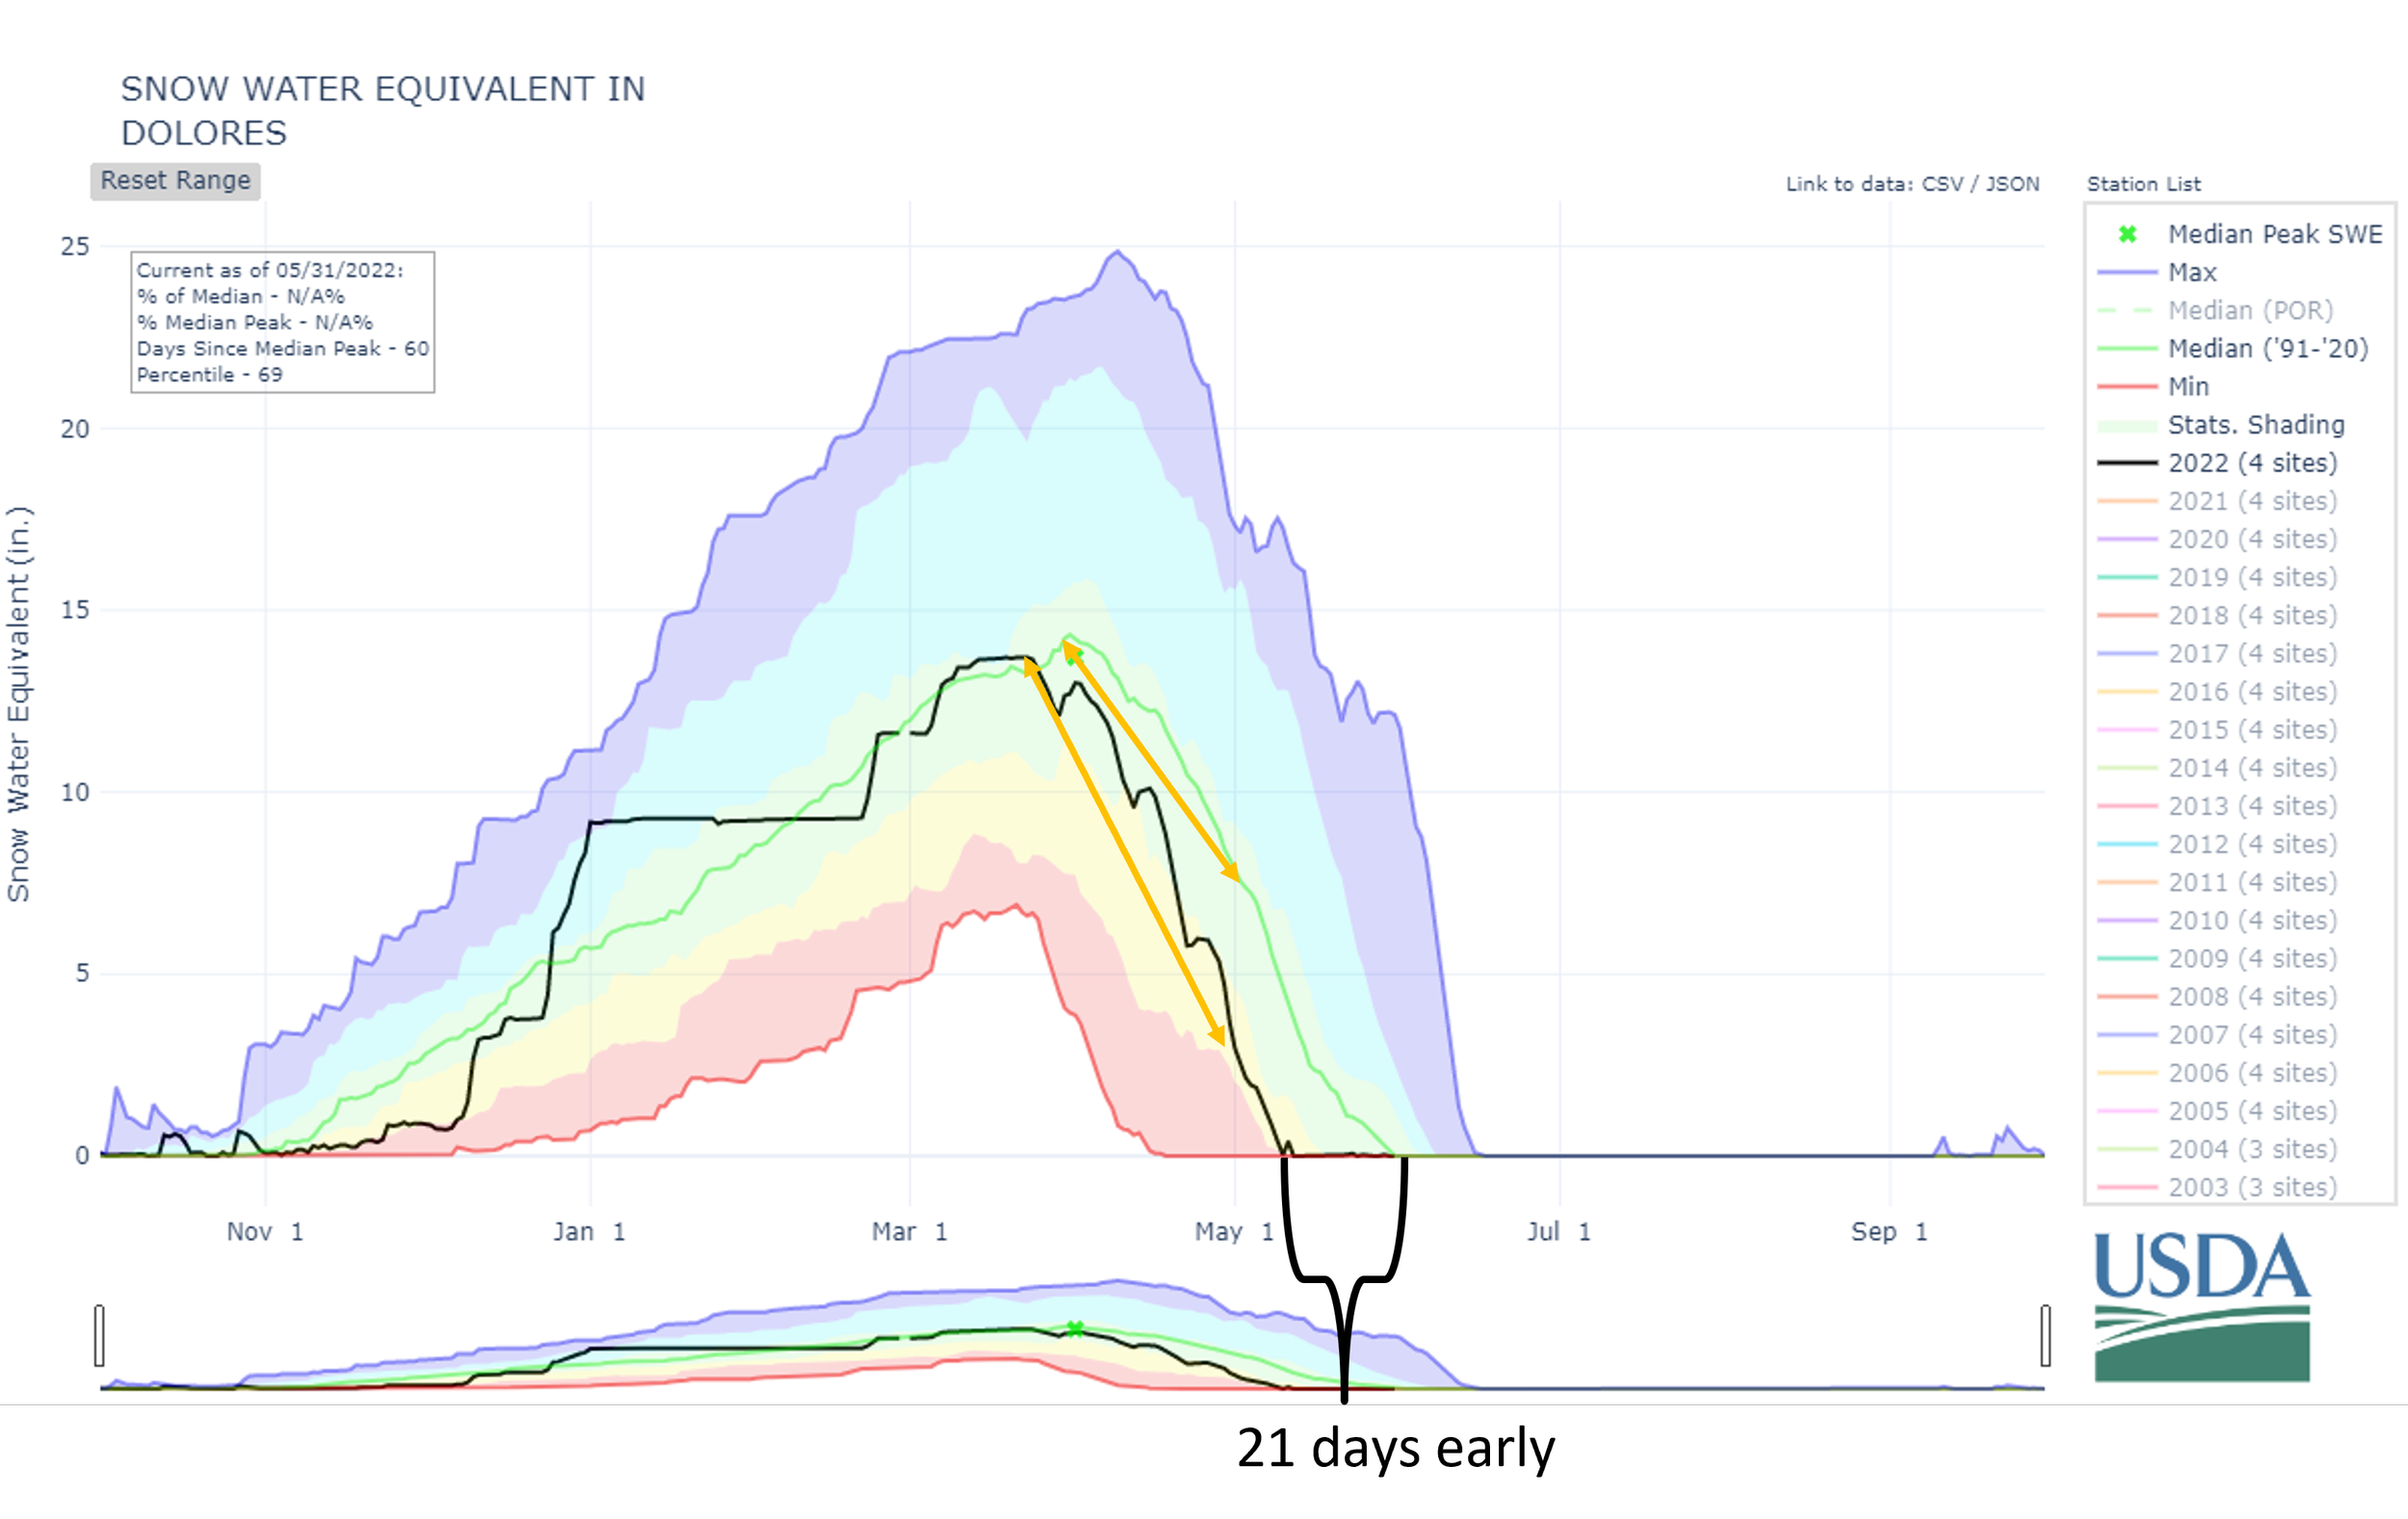
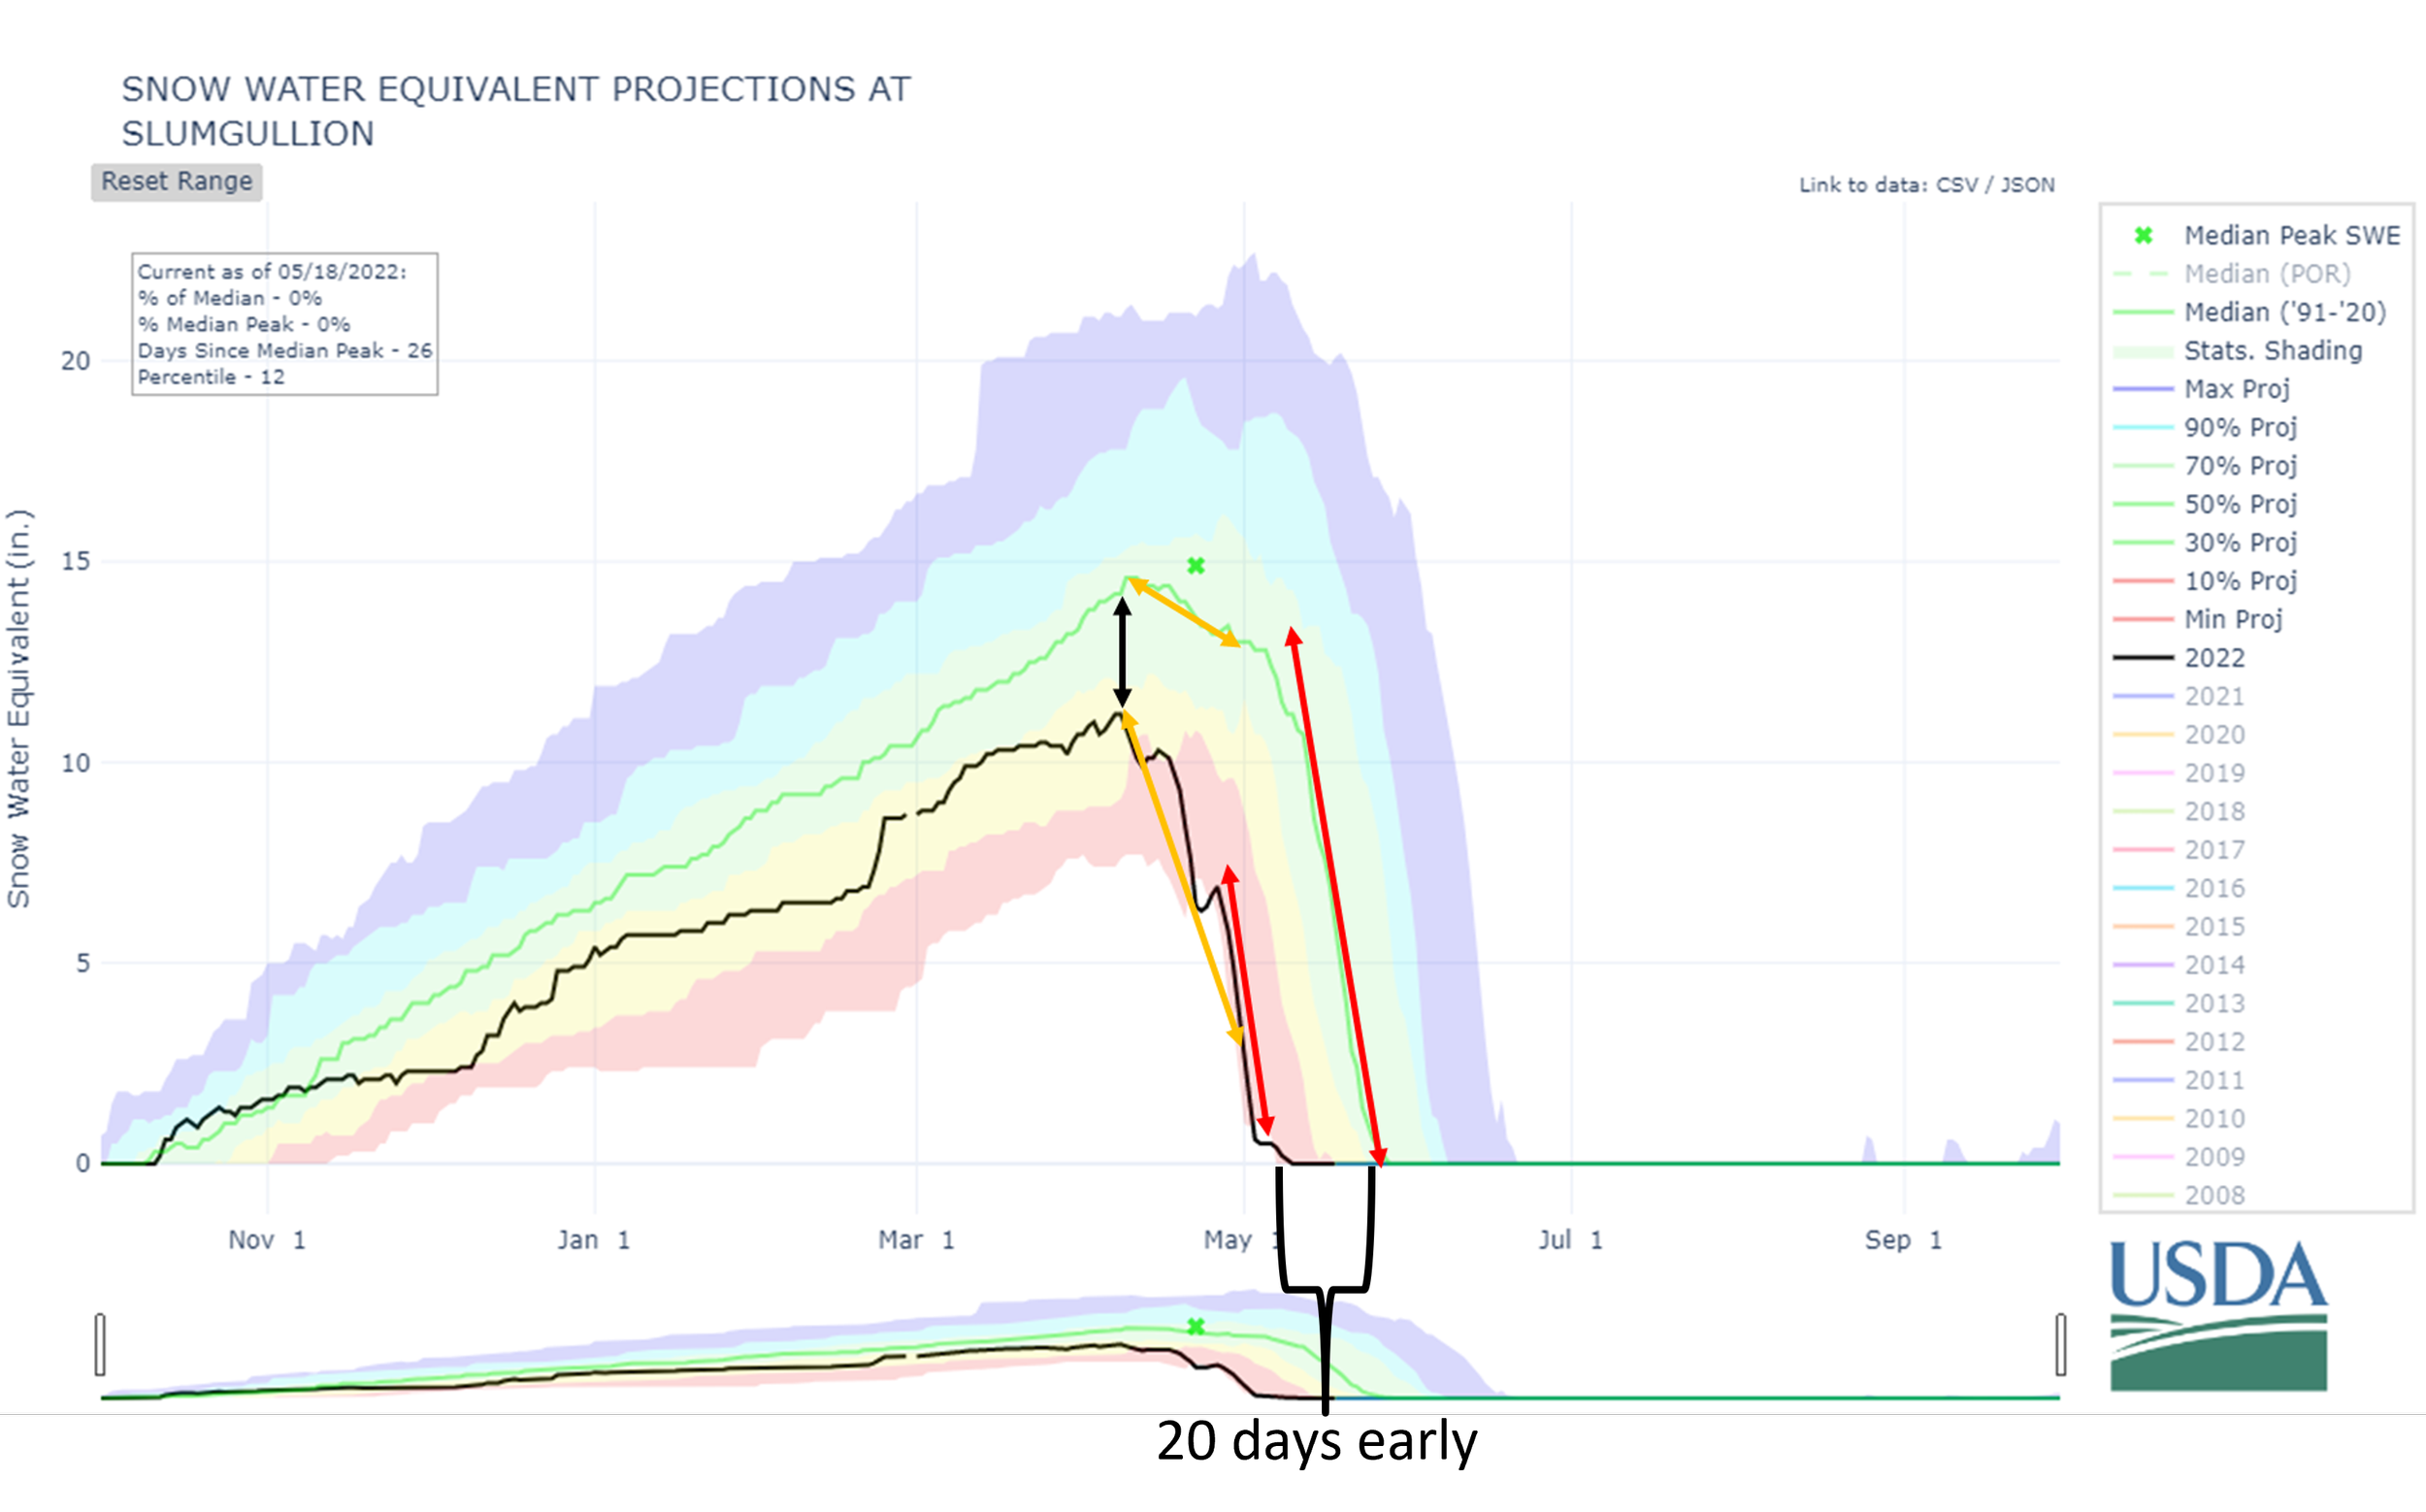
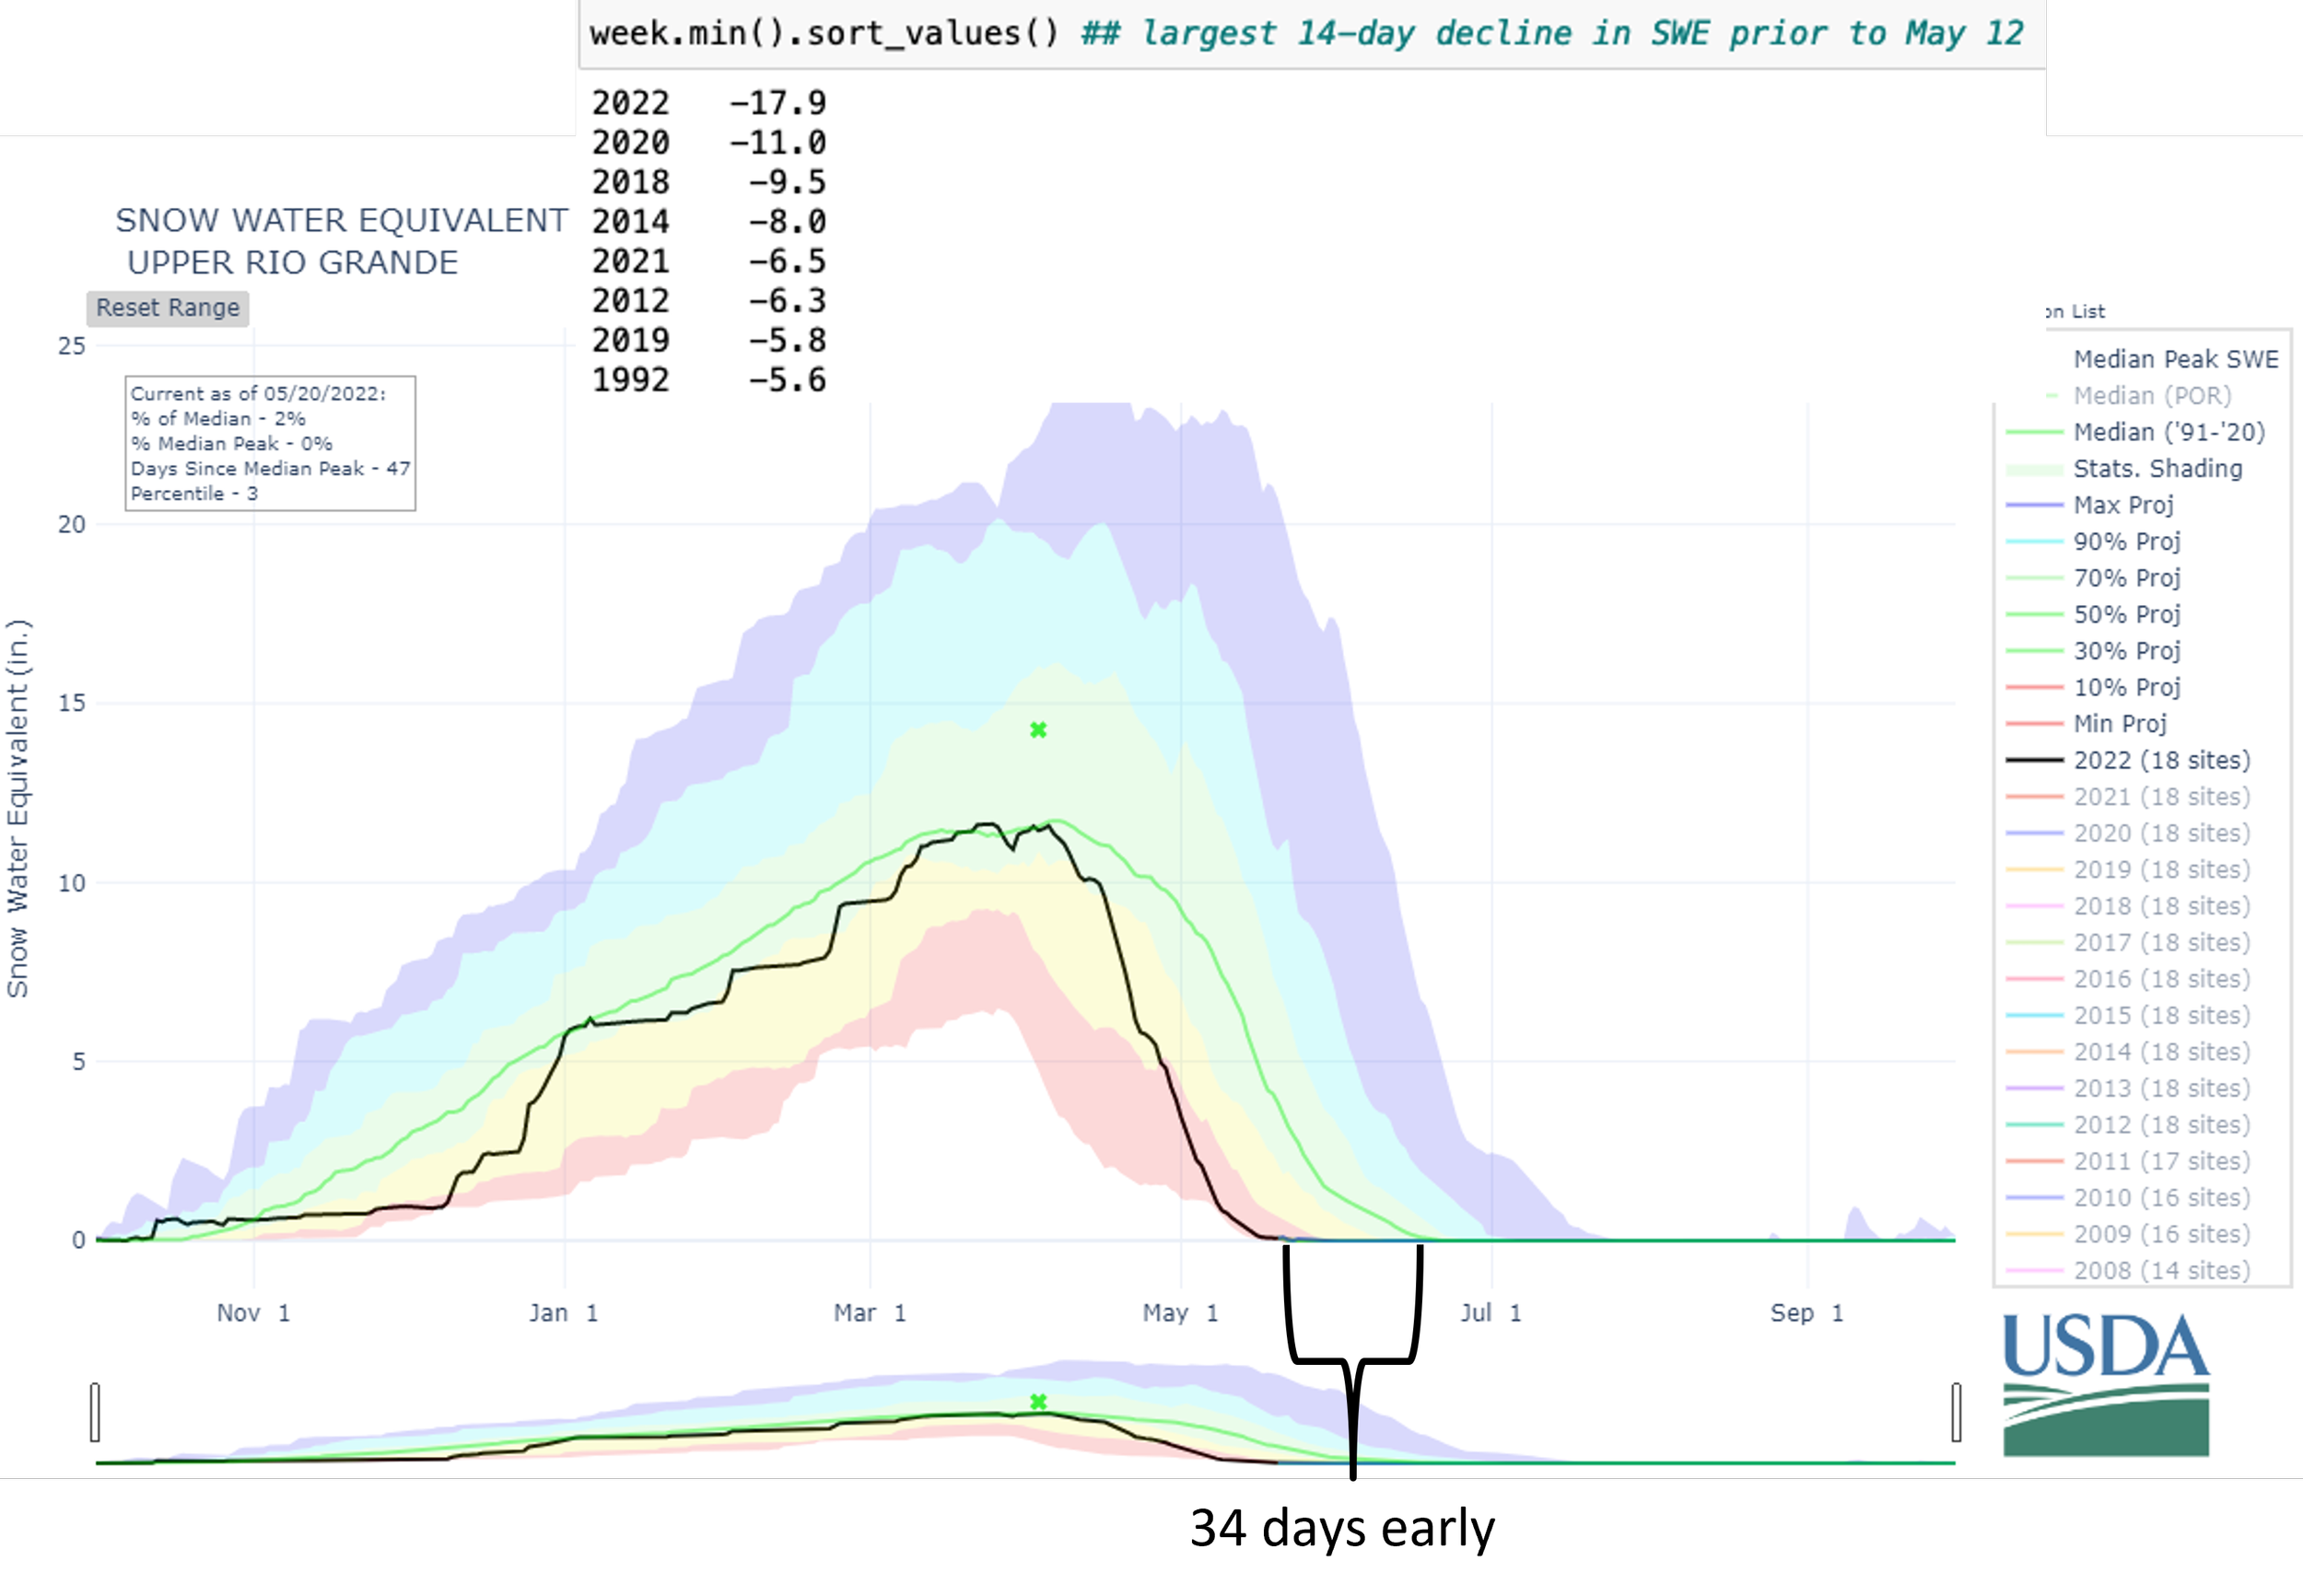
Due to the severe dust conditions we saw a record early start of snowmelt at a record snowmelt rate particularly towards Central/Southern Colorado - where spring was warmer and drier - thereby allowed dust exposure to stay at the snow surface. Starting in April it was shocking to see such early and rapid snowmelt rates. Snow was gone at Swamp Angel Study Plot (11,060’) on May 16, 20 days earlier than normal and at Senator Beck Study site on May 18, about 4 weeks early. The Wolf Creek SNOTEL (and the Basin as a whole), after hitting normal peak SWE (albeit 24 days earlier than normal) melted out 1-month earlier than normal, the same date of melt out in WY2018 - a notorious low snowpack year. The San Miguel/Dolores/Animas/San Juan Basins SNOTELS’s melted 28 days early. SNOTEL’s in the Animas Basin melted 24 days earlier than normal, again a near record melt date. The Arkansas Basin was on track for record early melt-out as well but a productive storm starting May 18 extended full melt-out by a couple of weeks, and provided a nice late season boost that also encompassed the South Platte Basin. The Colorado Mainstem had the most “normal” looking SWE hydrograph by hitting a normal peak SWE, and with the help of a few spring precipitation events, a near normal ablation date. In a reversal with the Southern Basins, the Yampa fell short of achieving normal peak SWE but April precipitation prolonged snowmelt until the normal time-frame. Below are tables and graphs exploring this unique snow season in more detail.
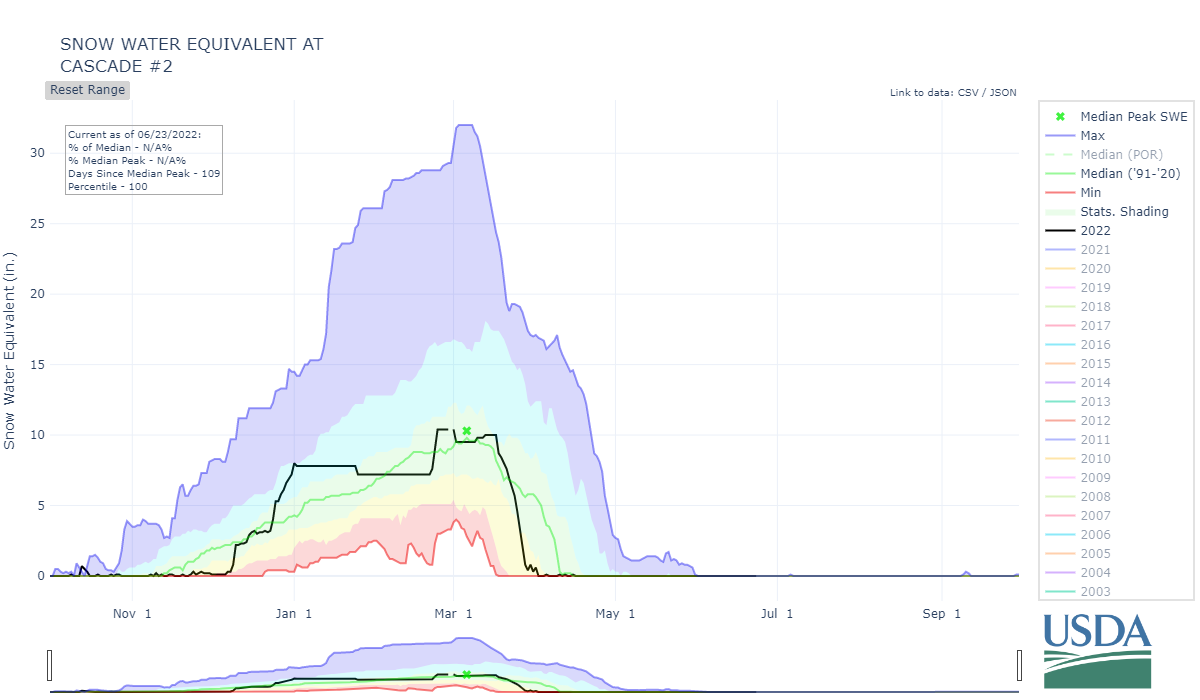
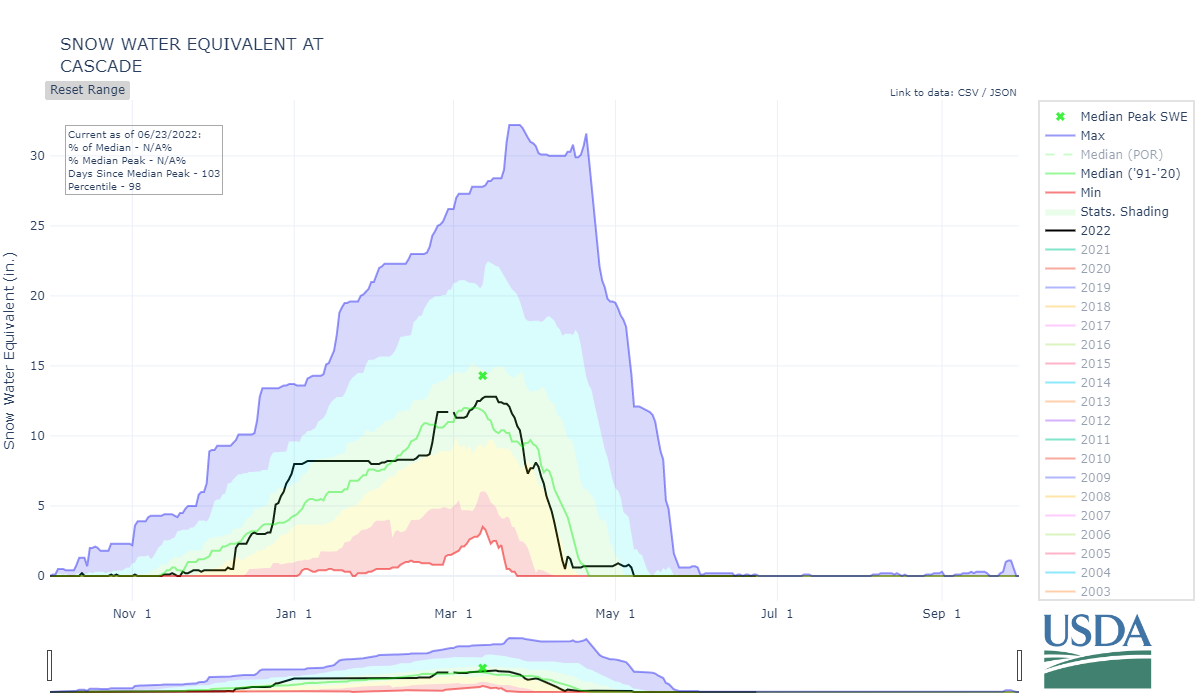
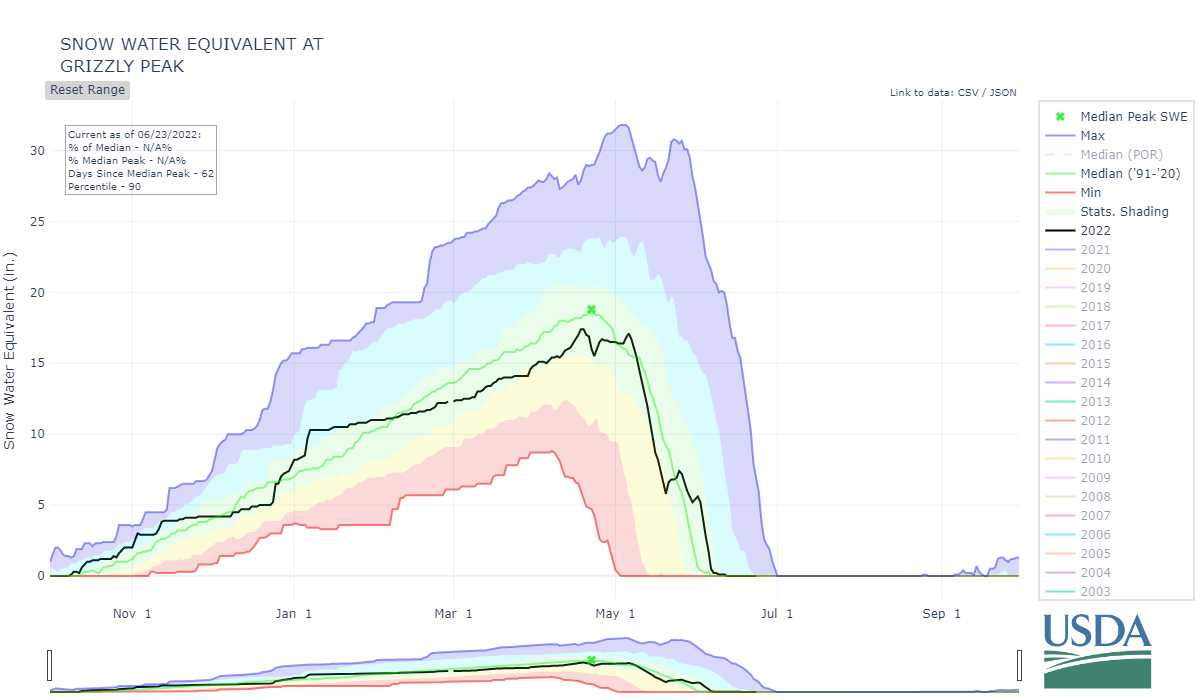
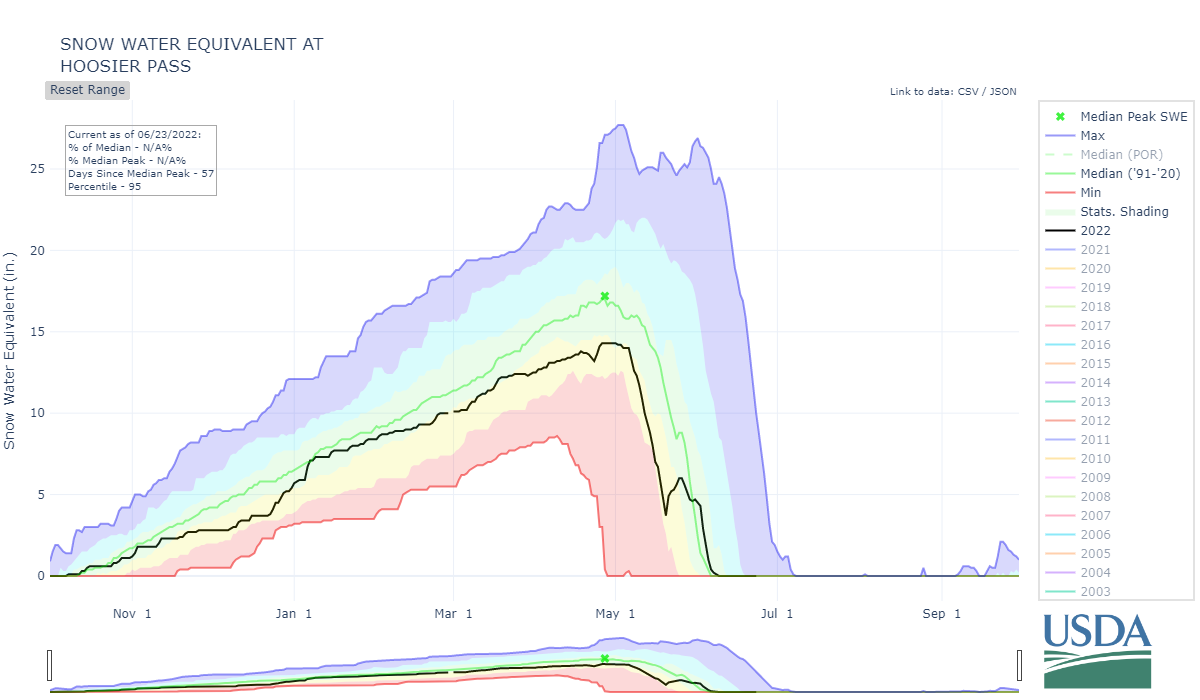
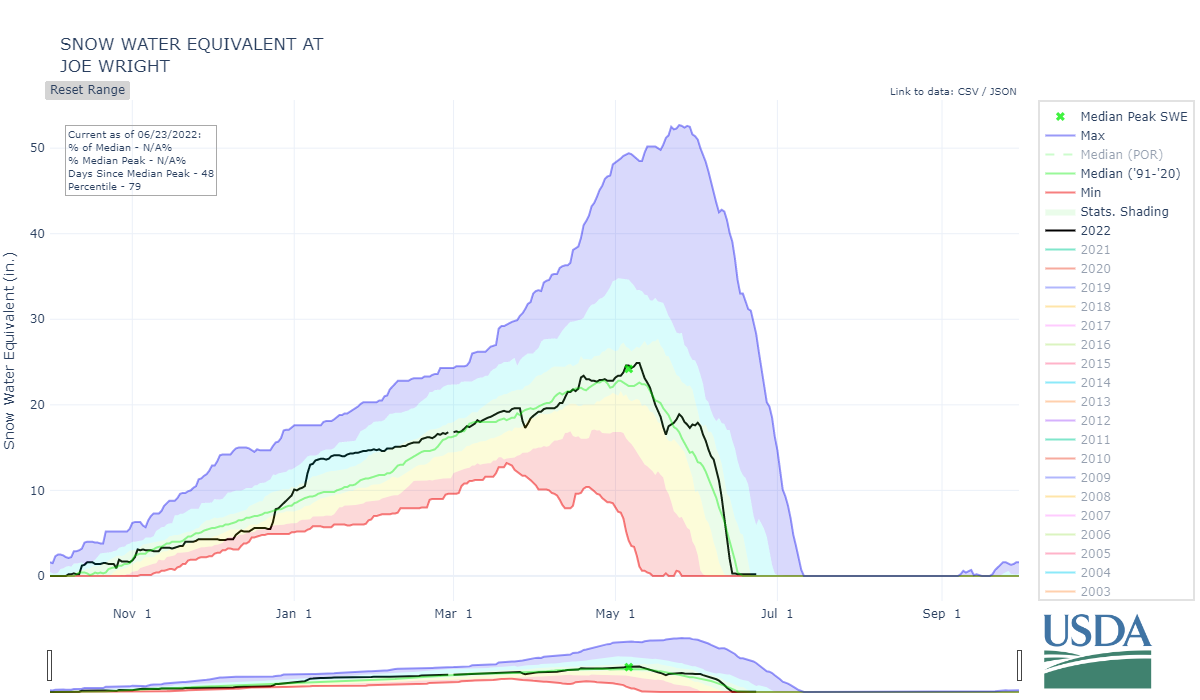
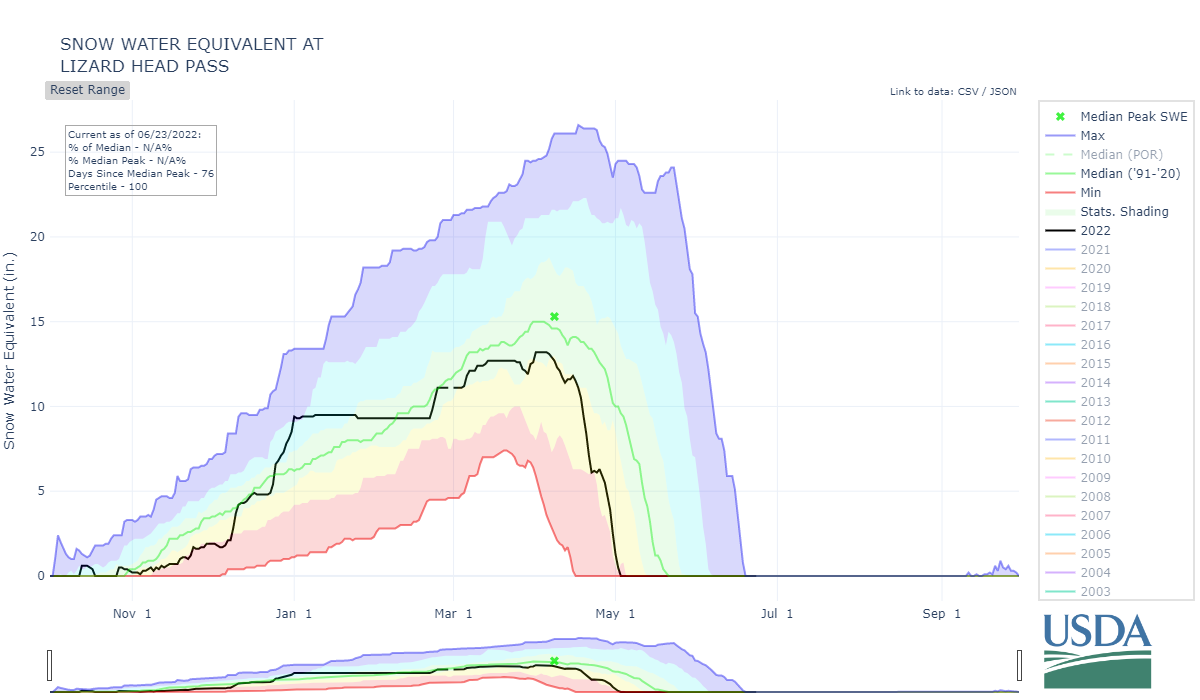
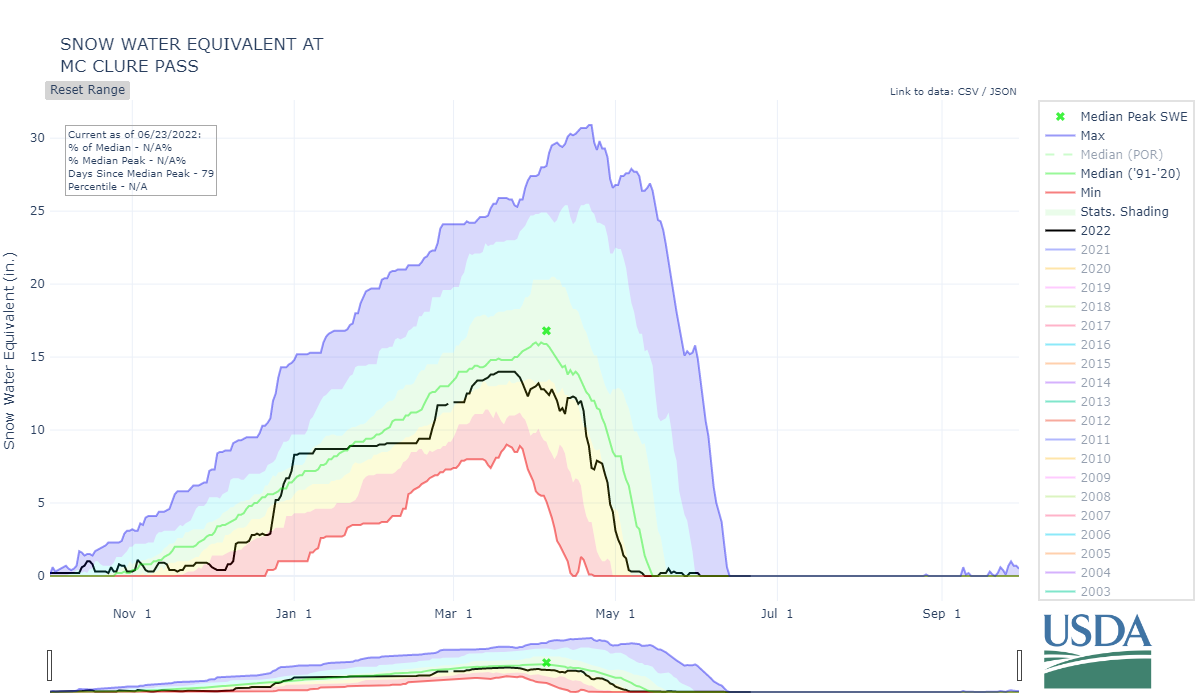
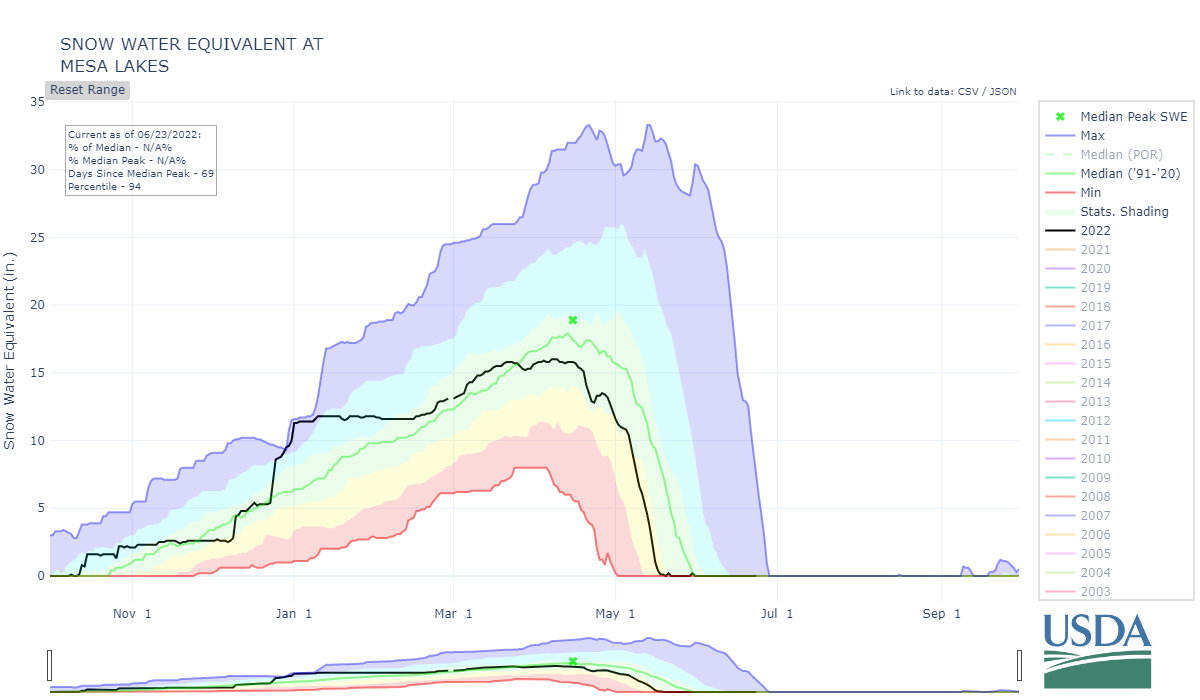
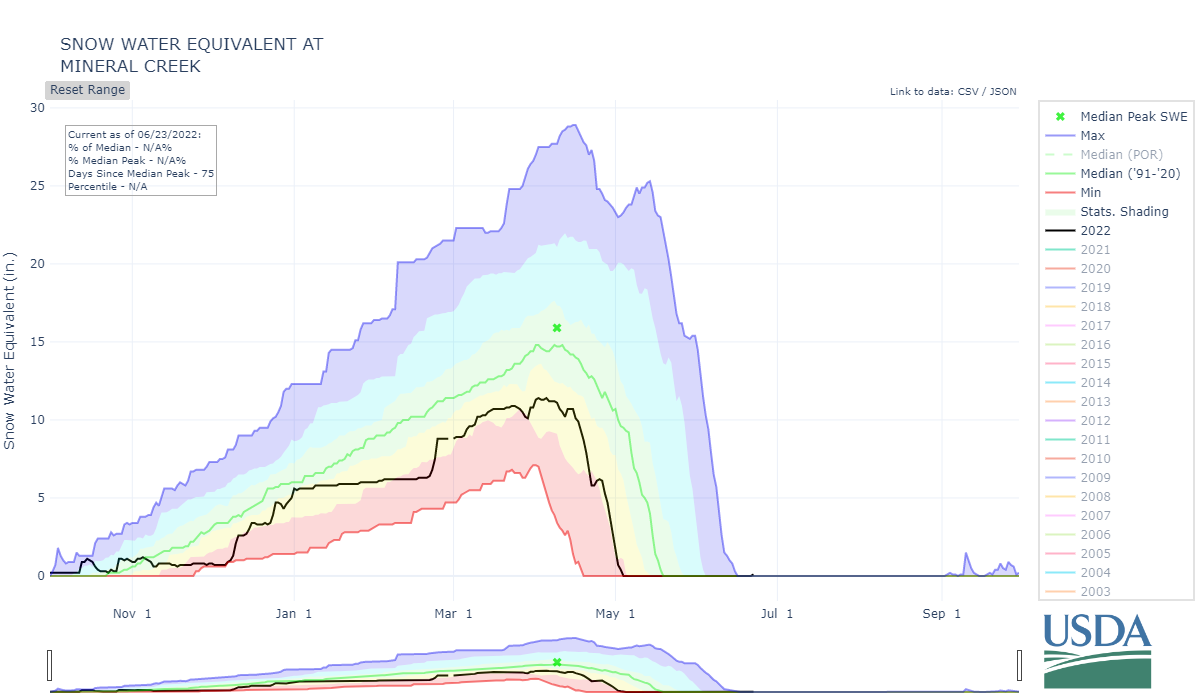
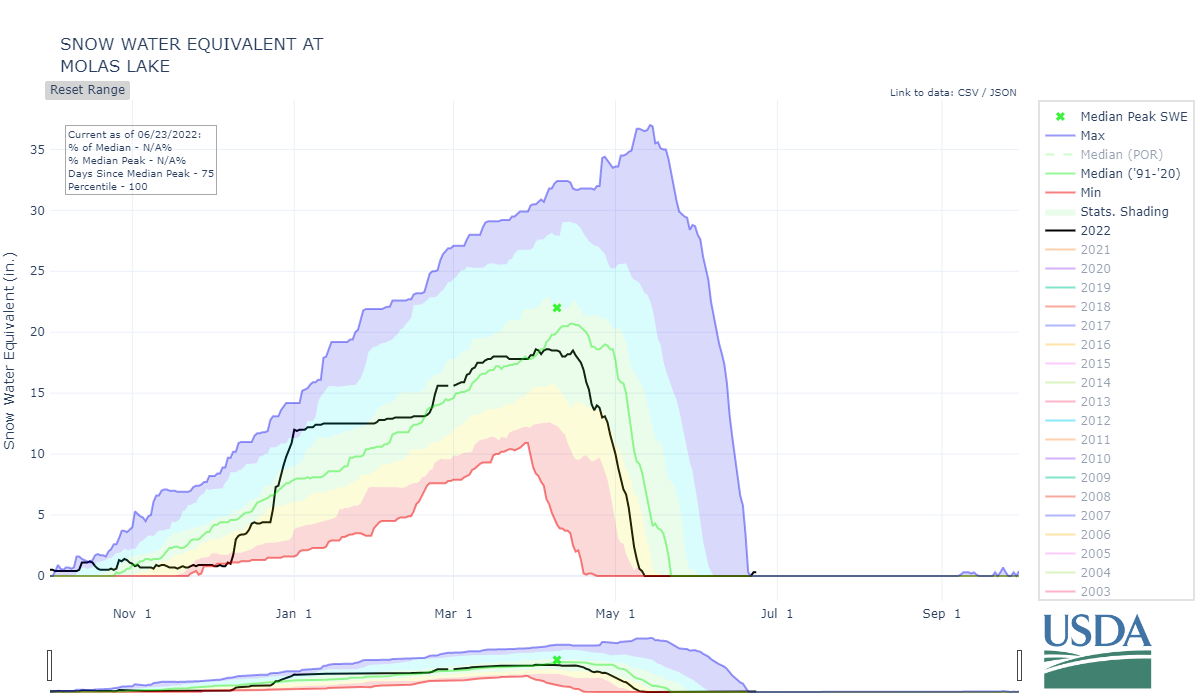
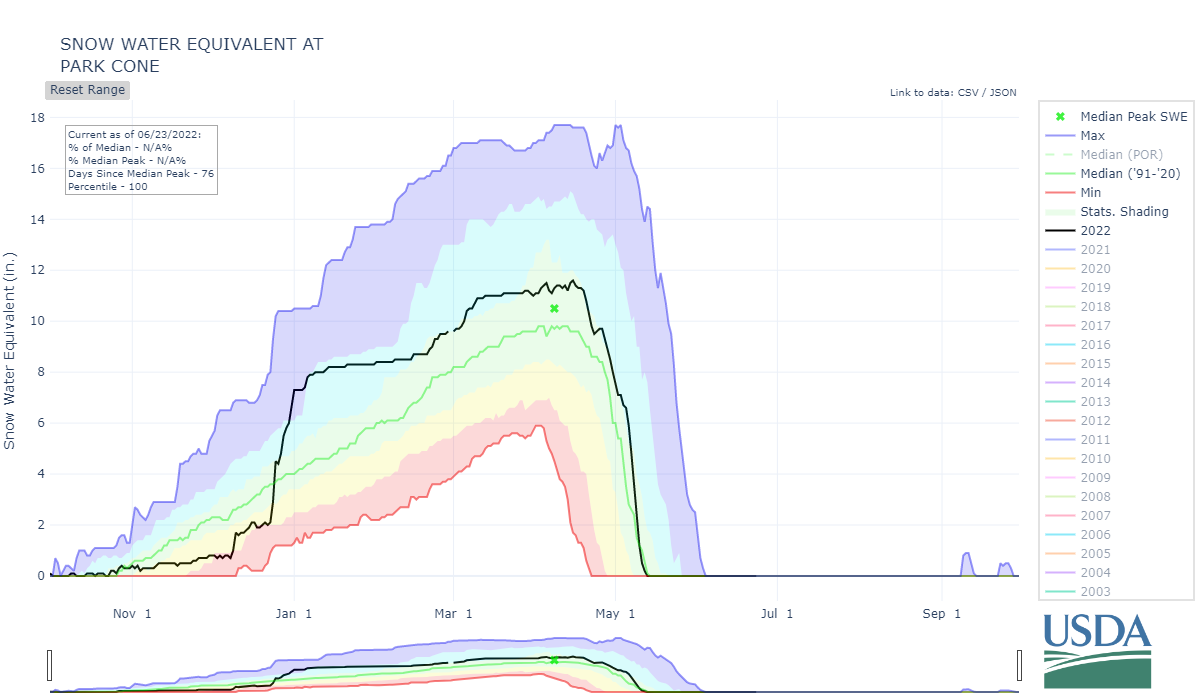
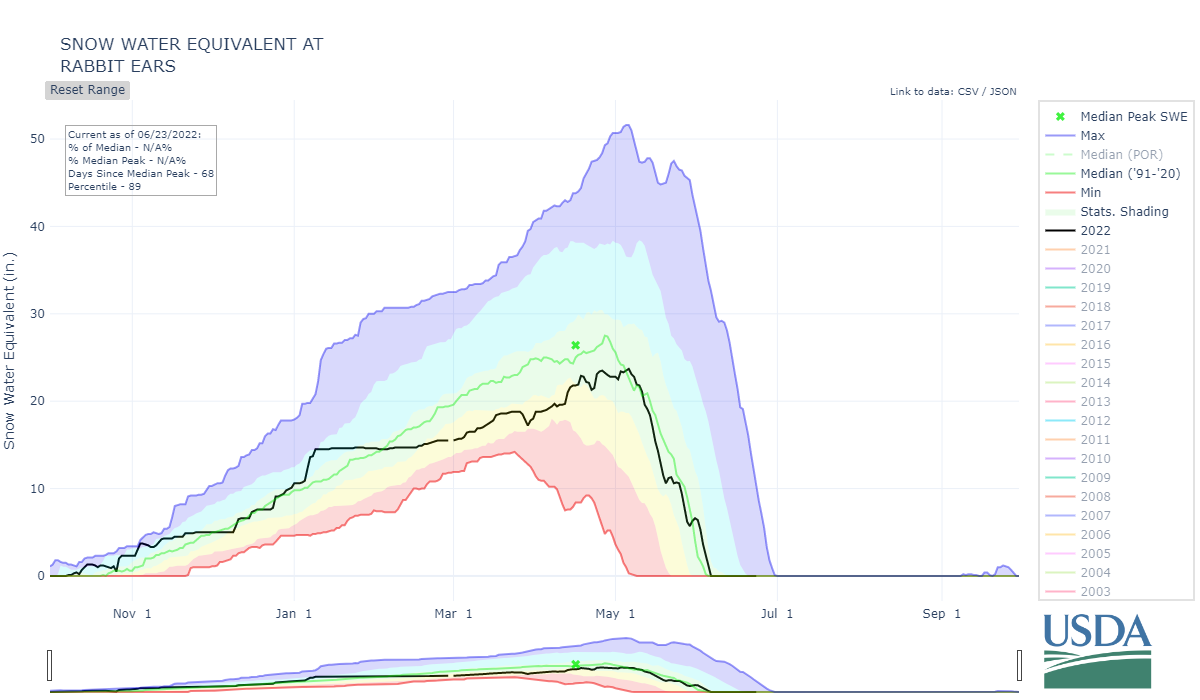
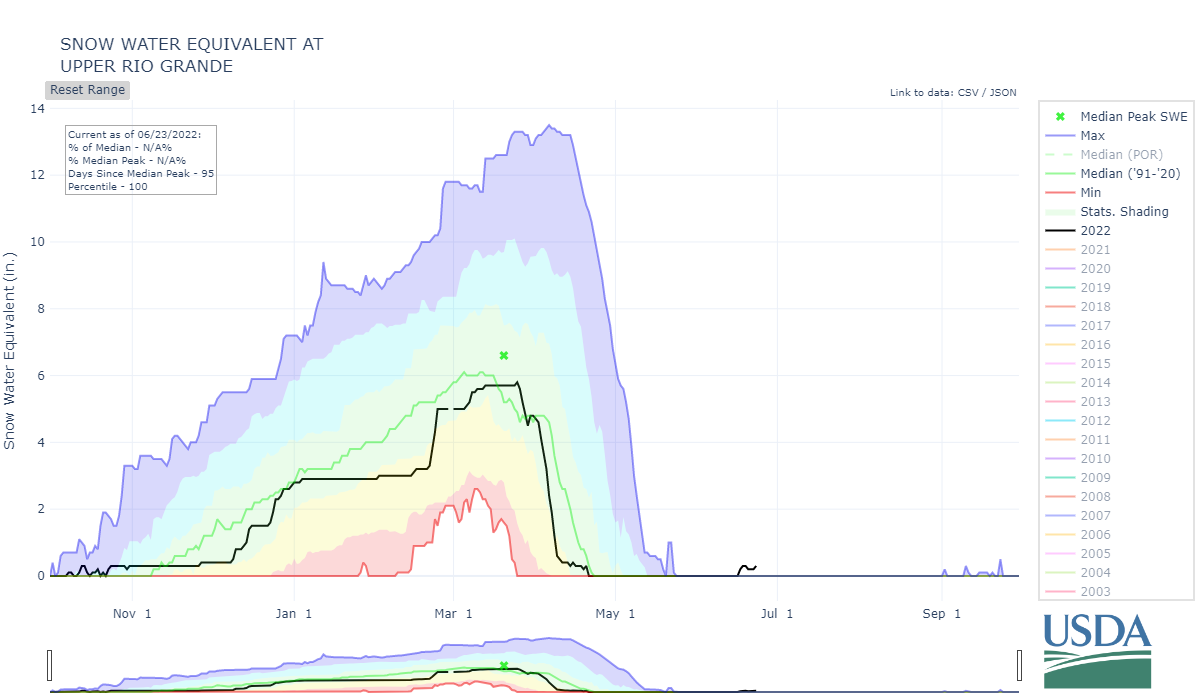
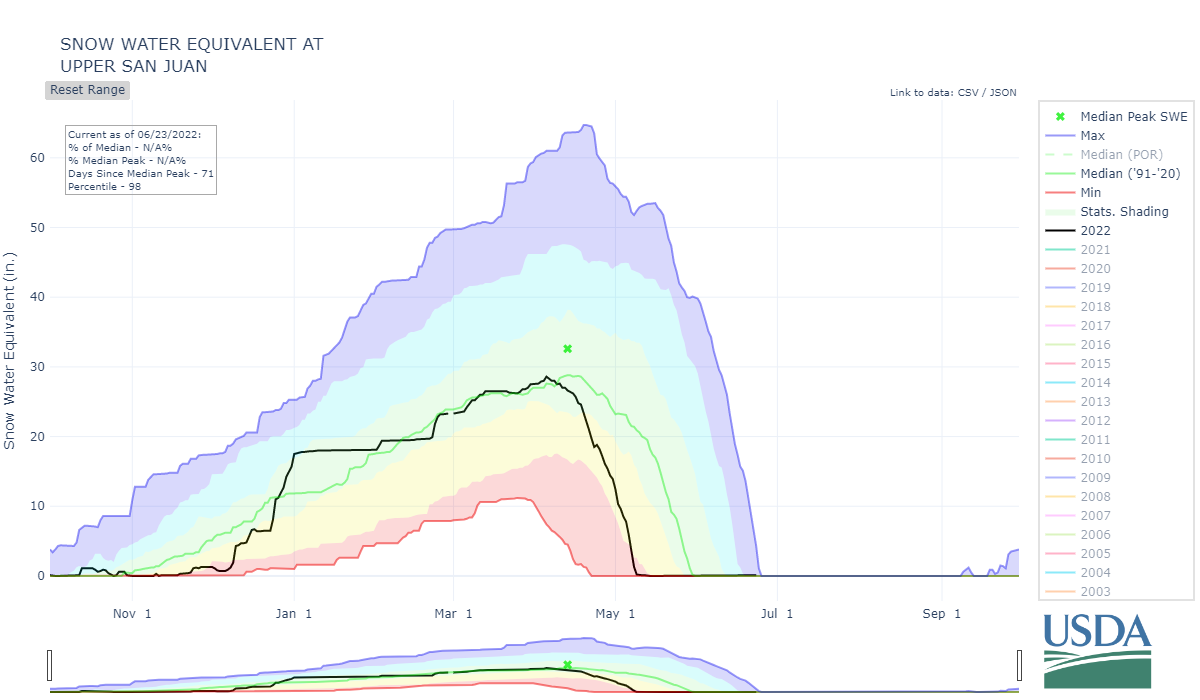
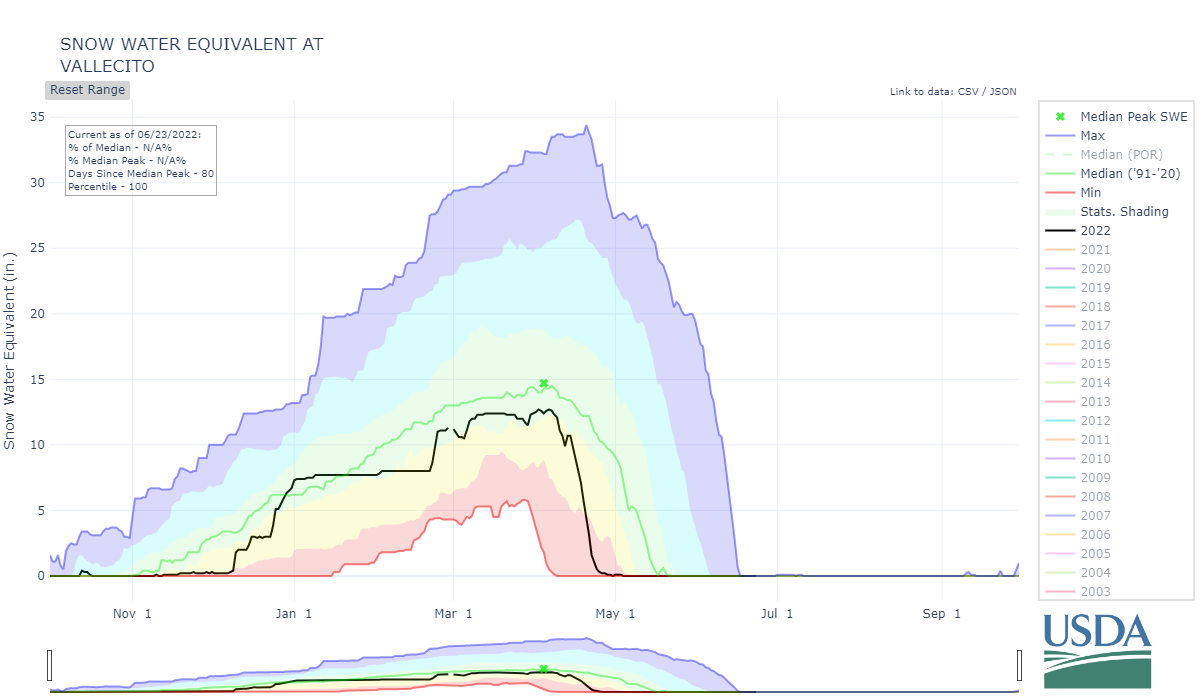
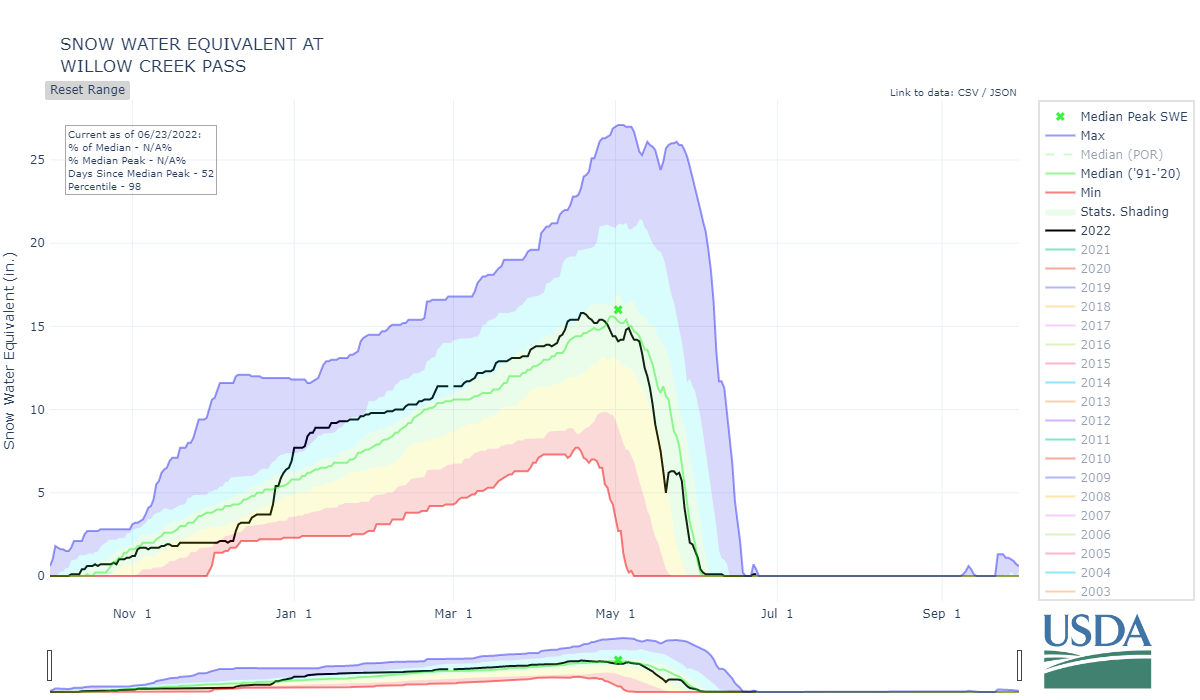
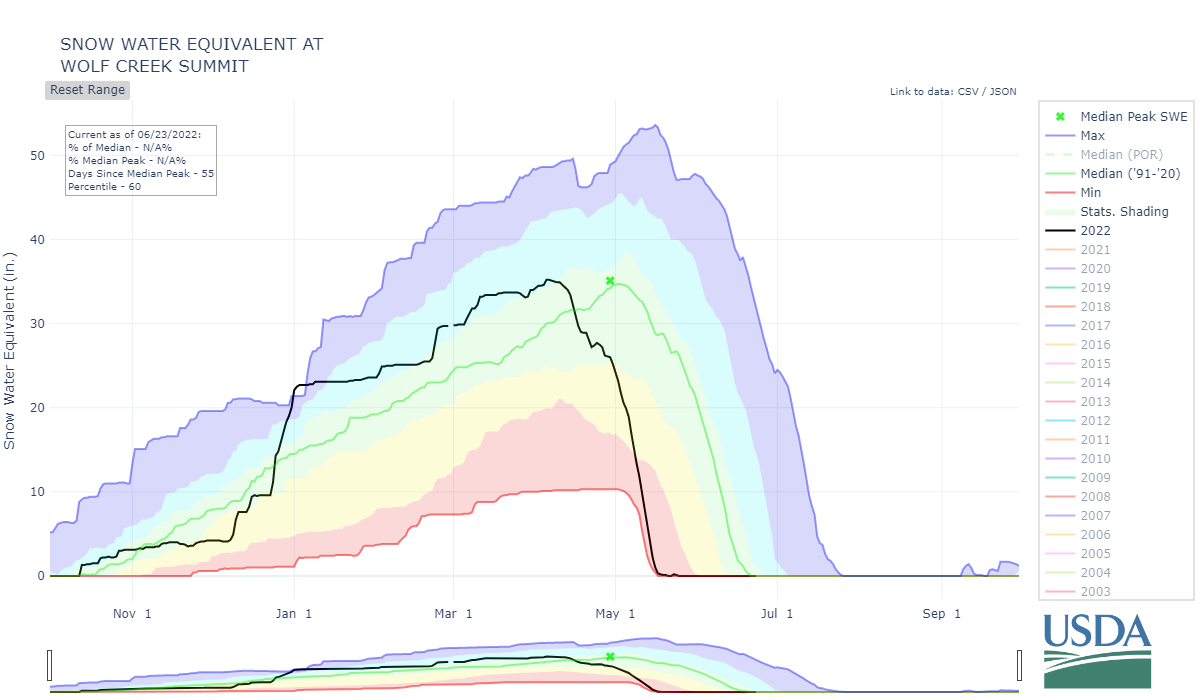

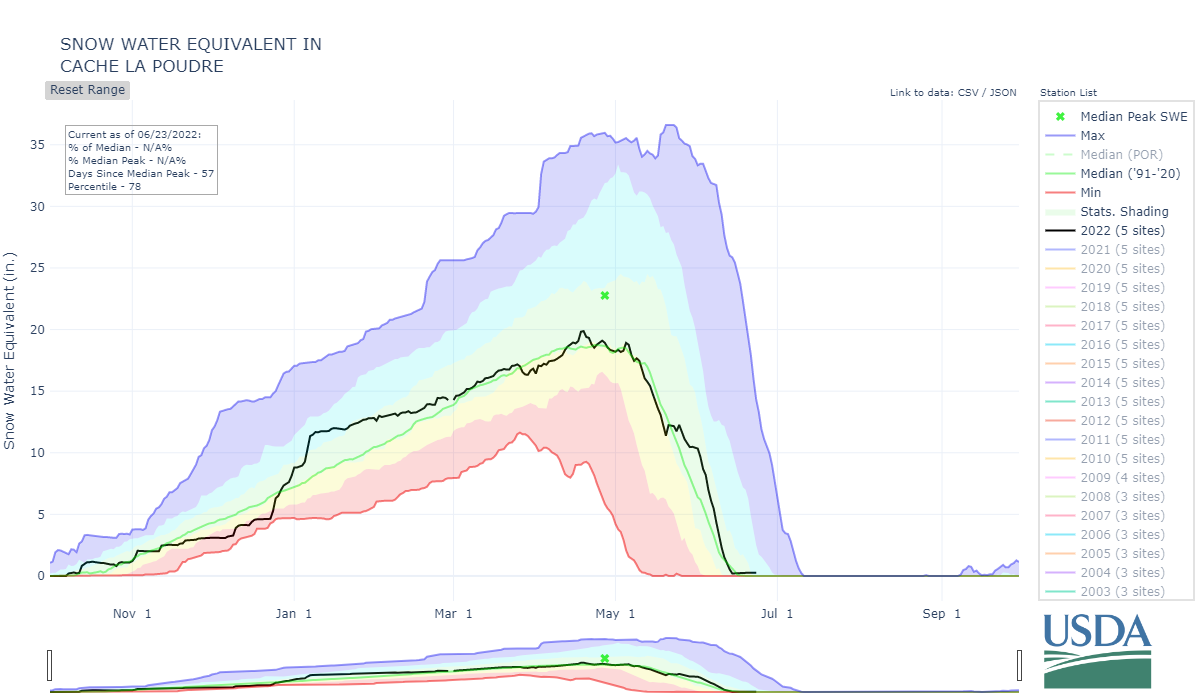
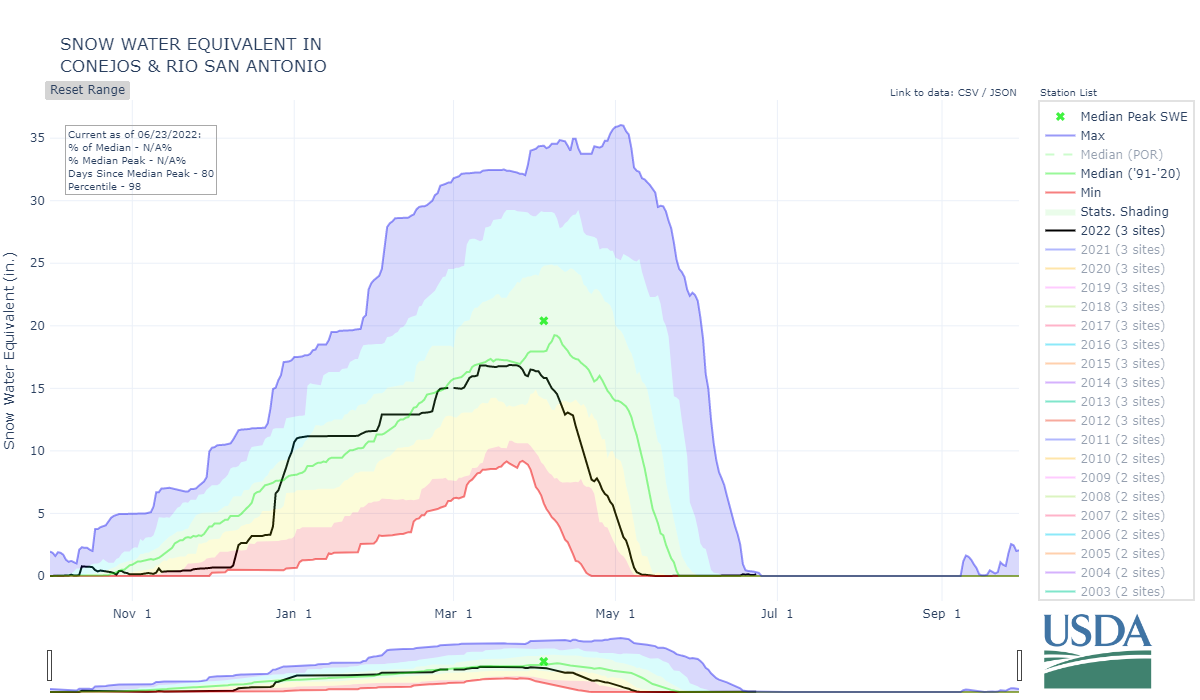
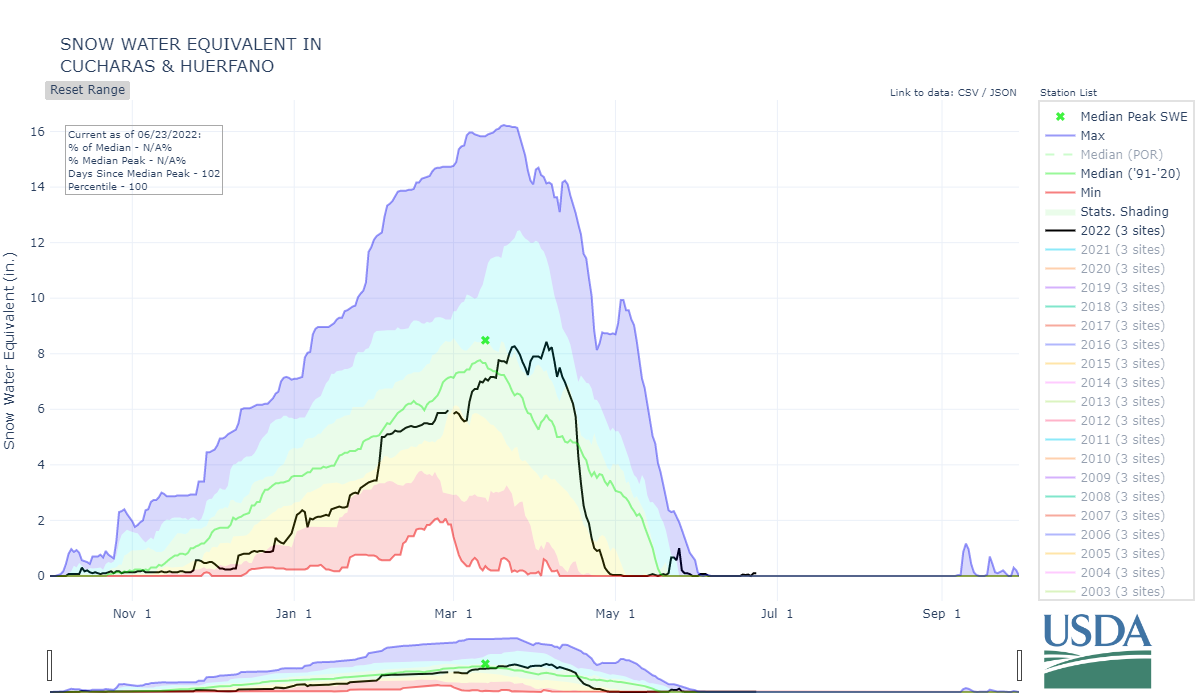
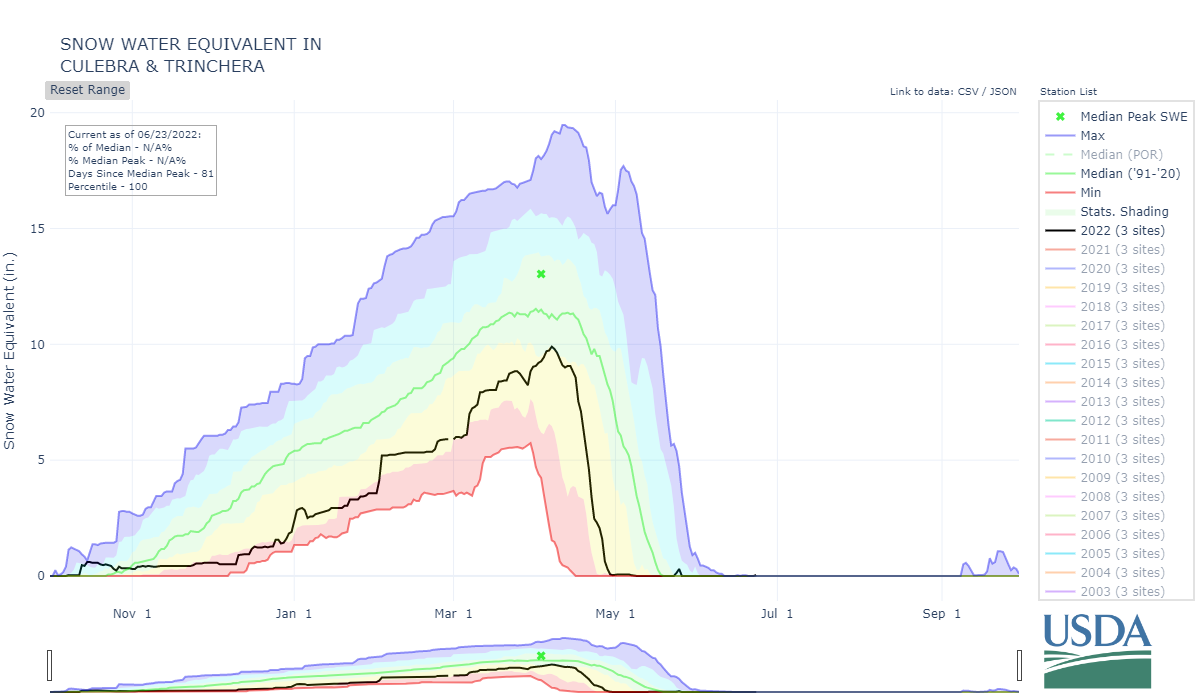
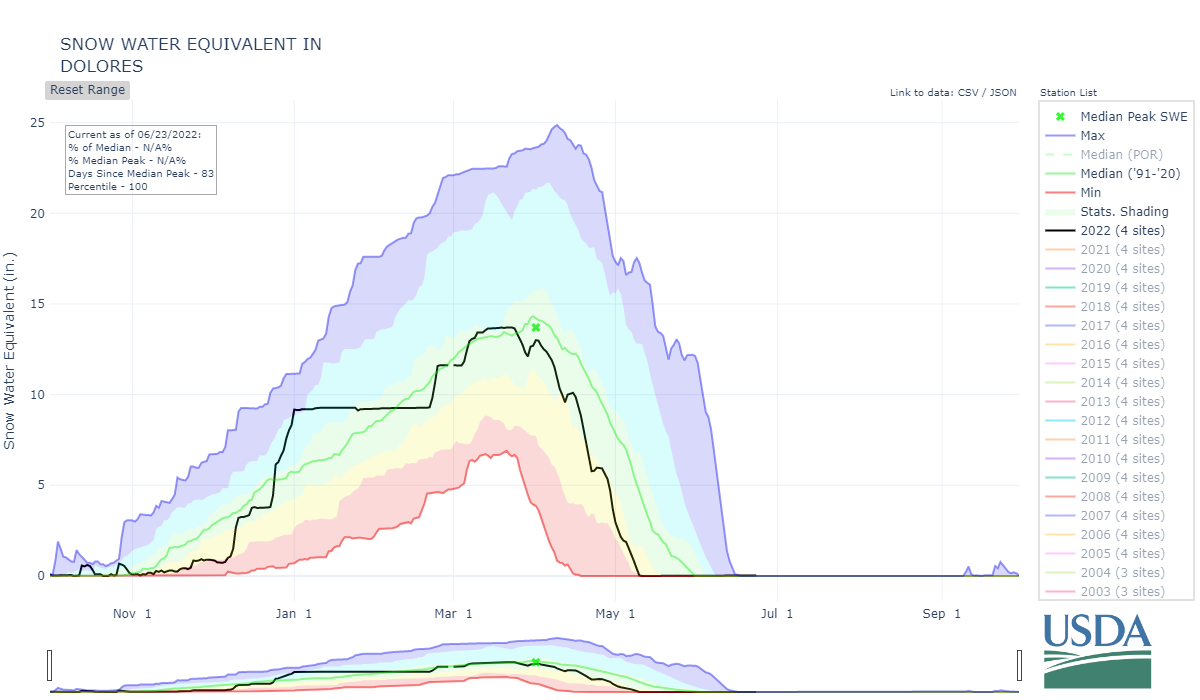
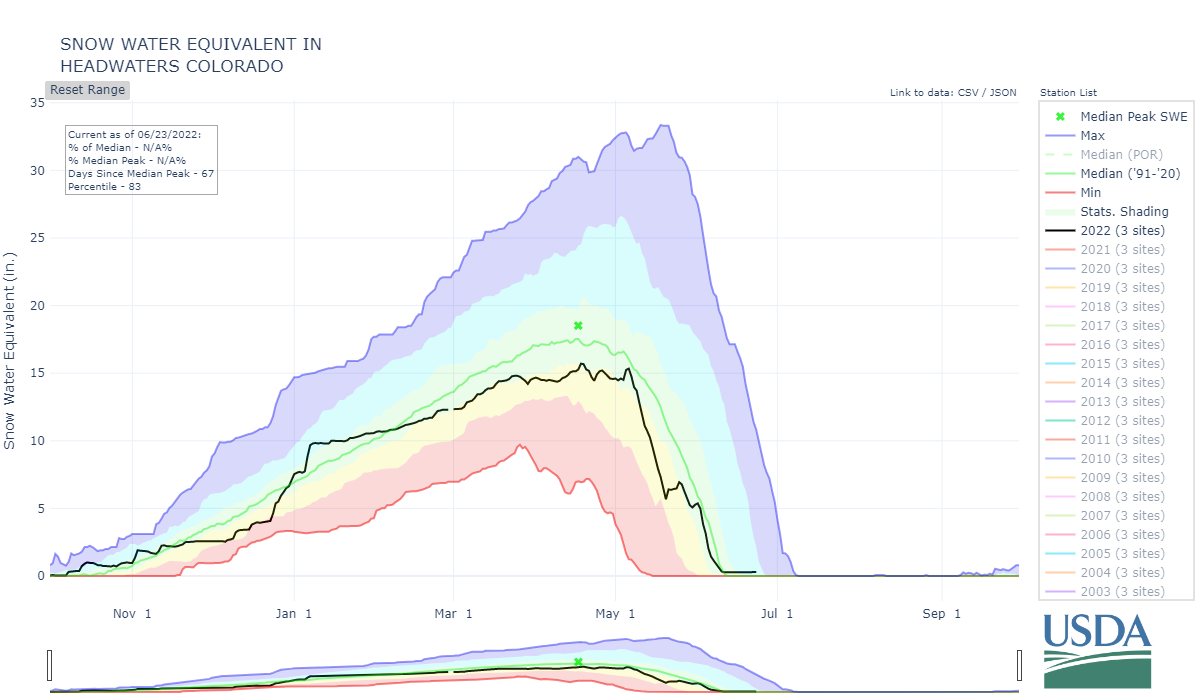
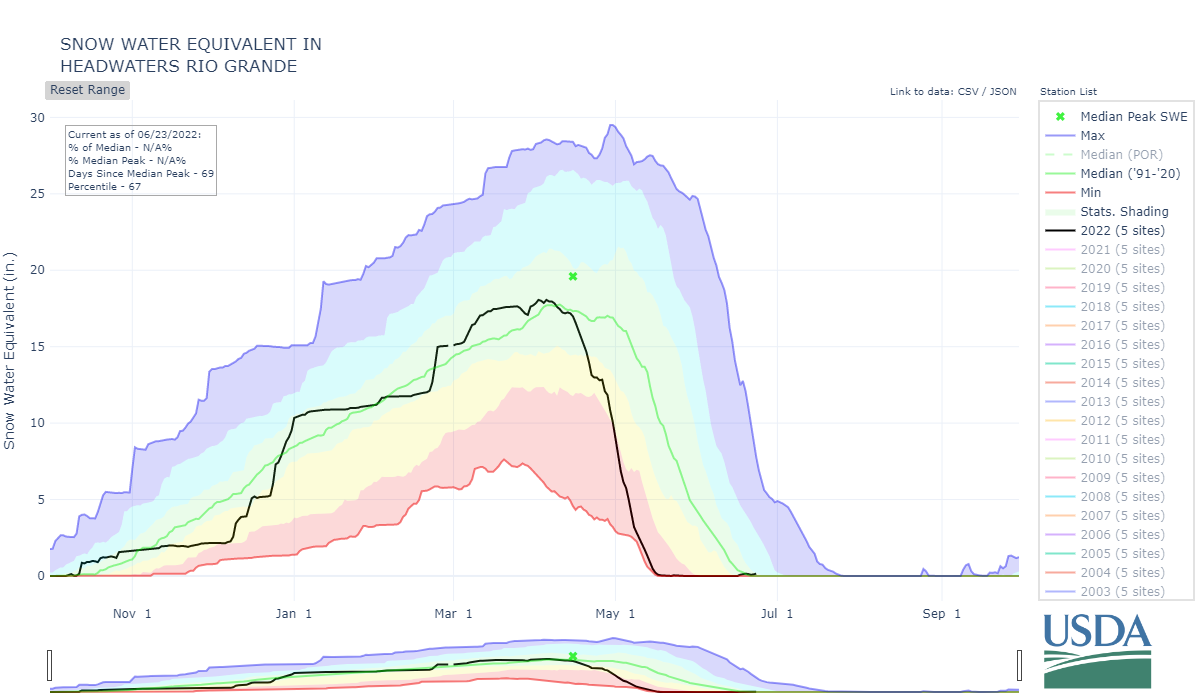
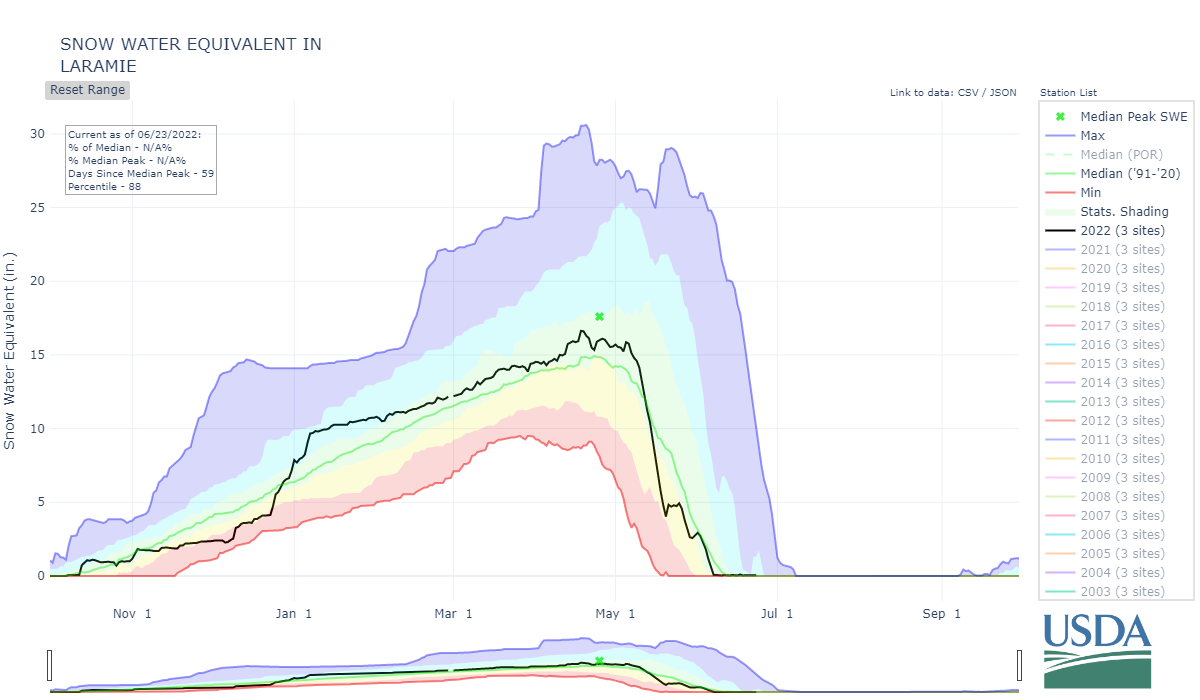
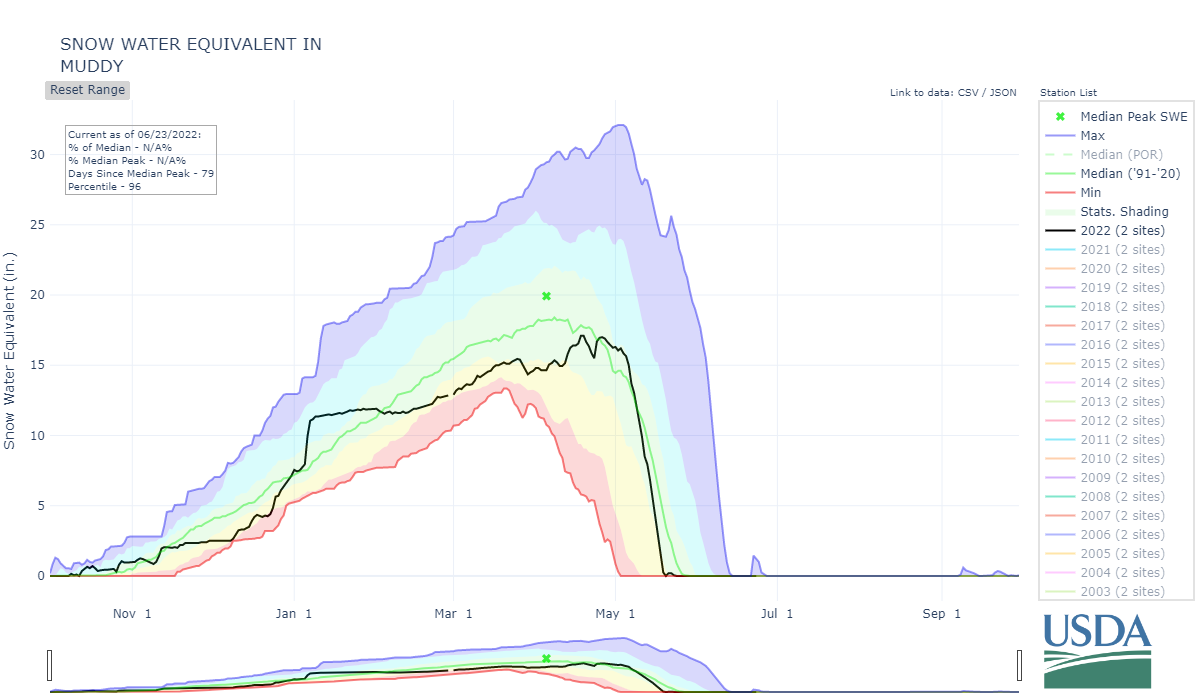
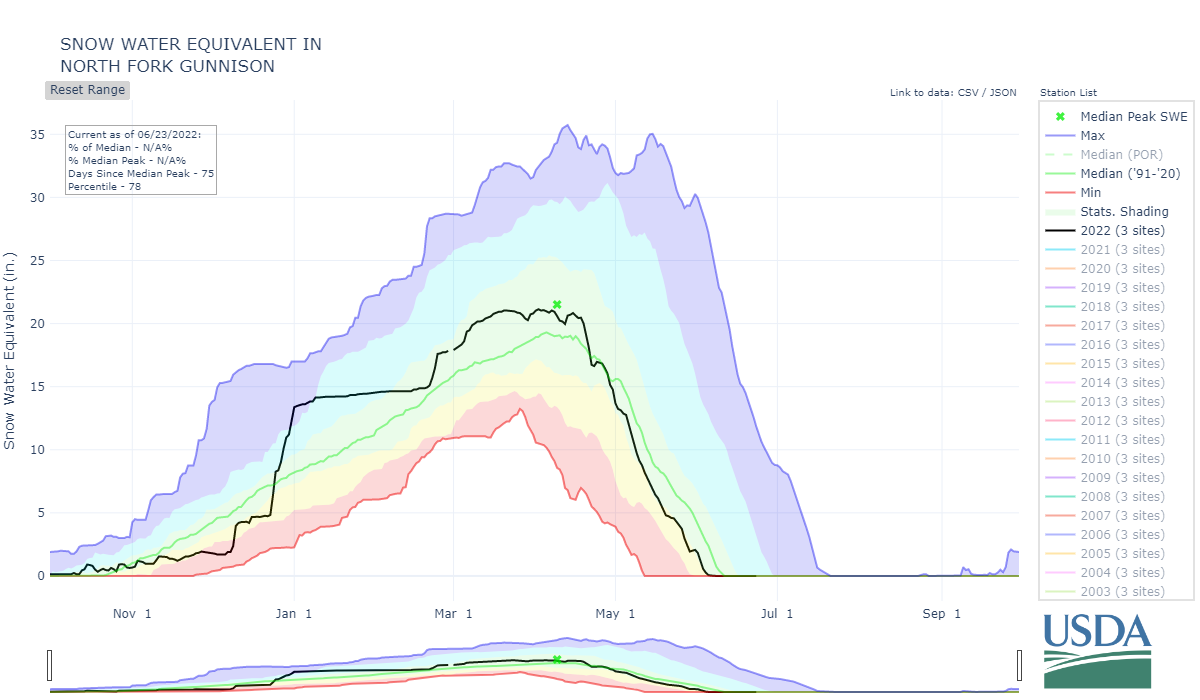
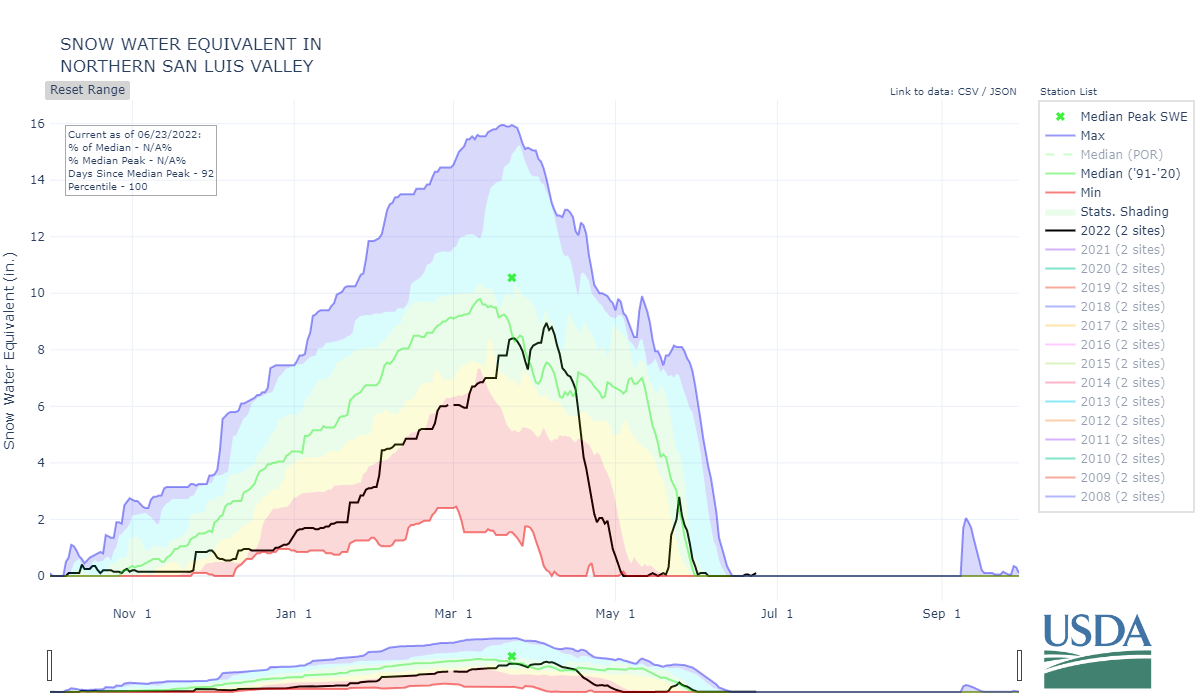
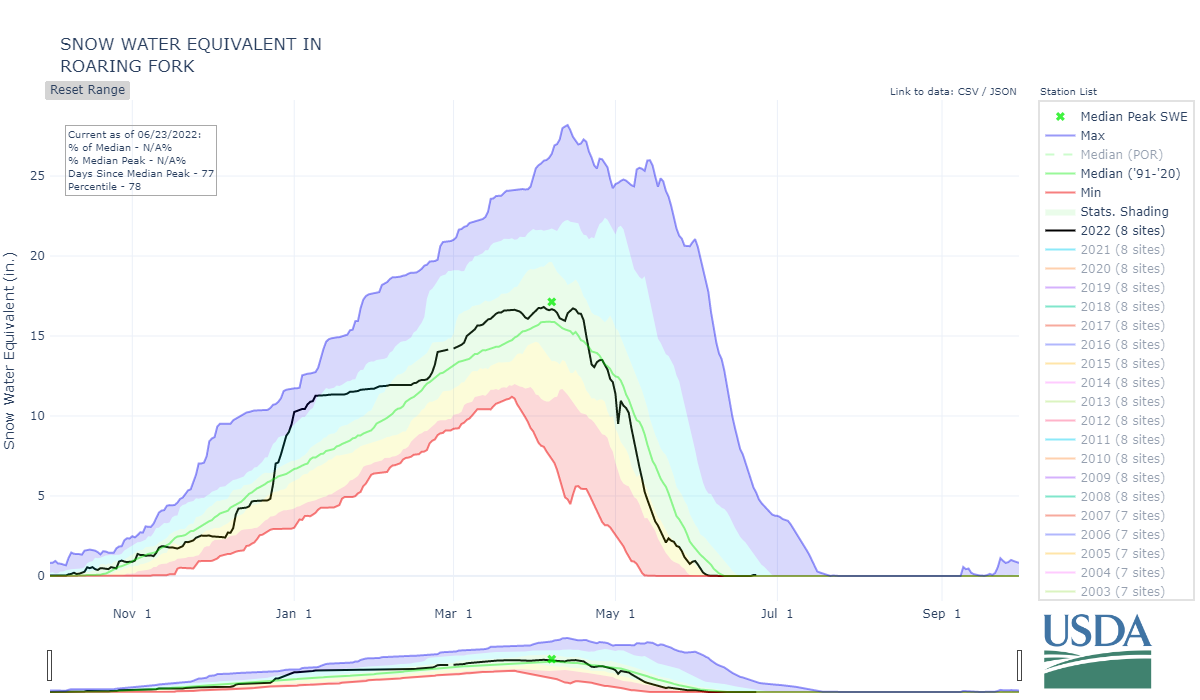
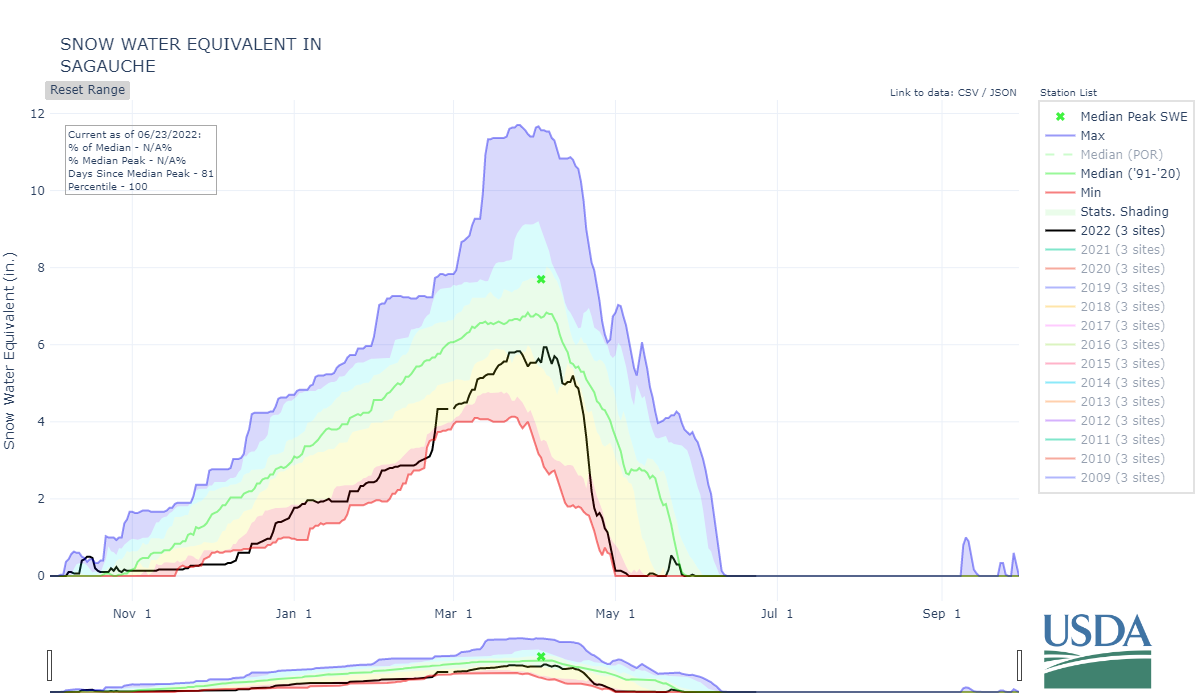
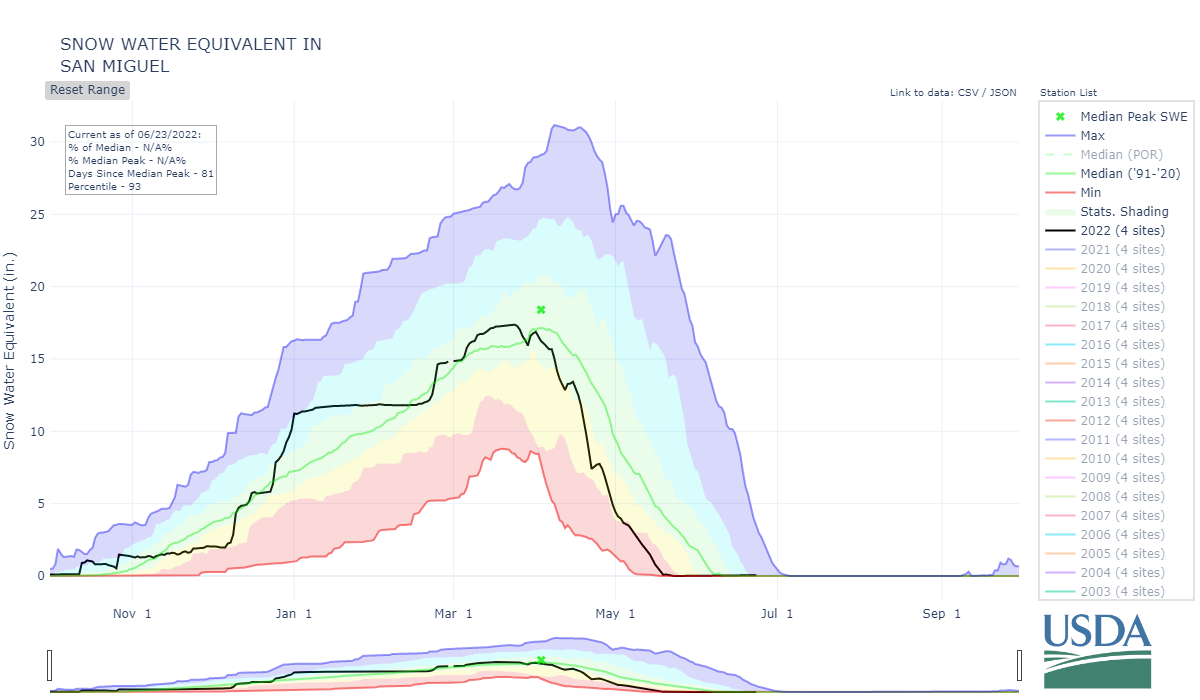
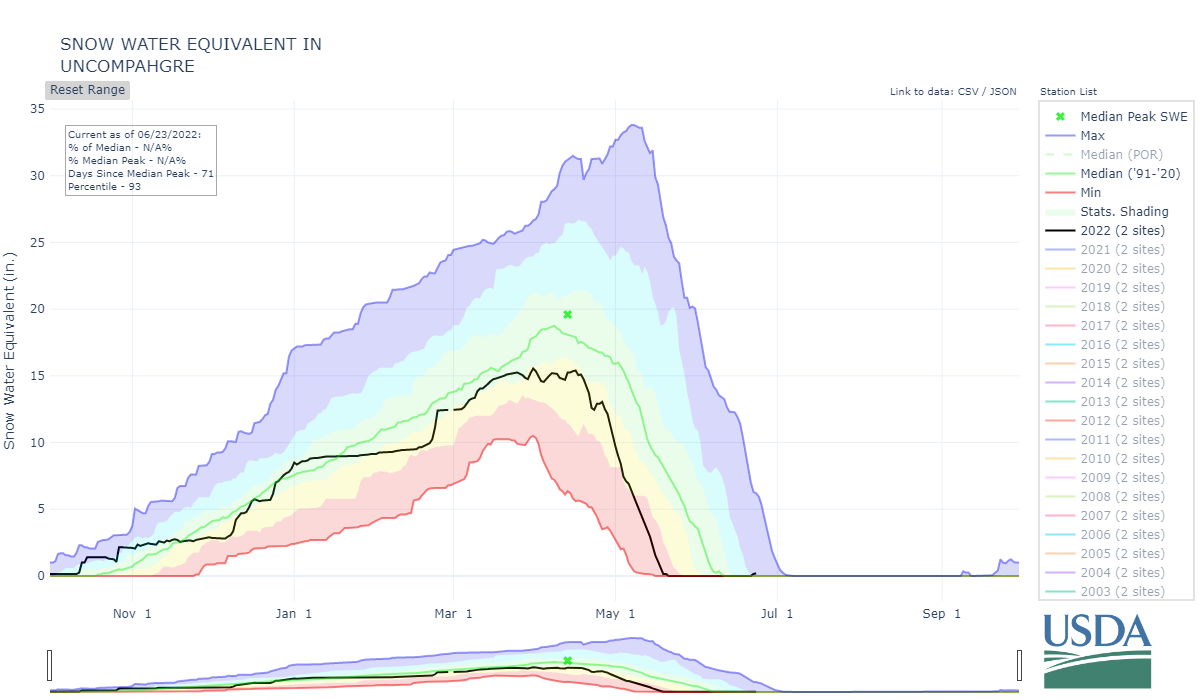
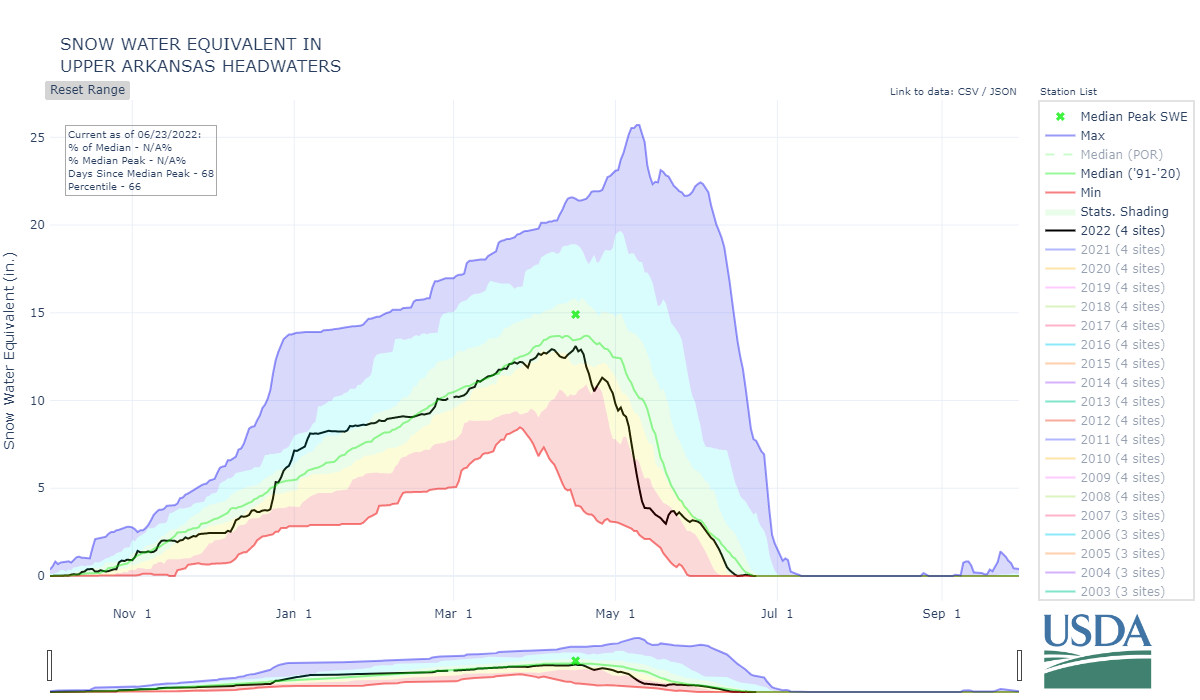
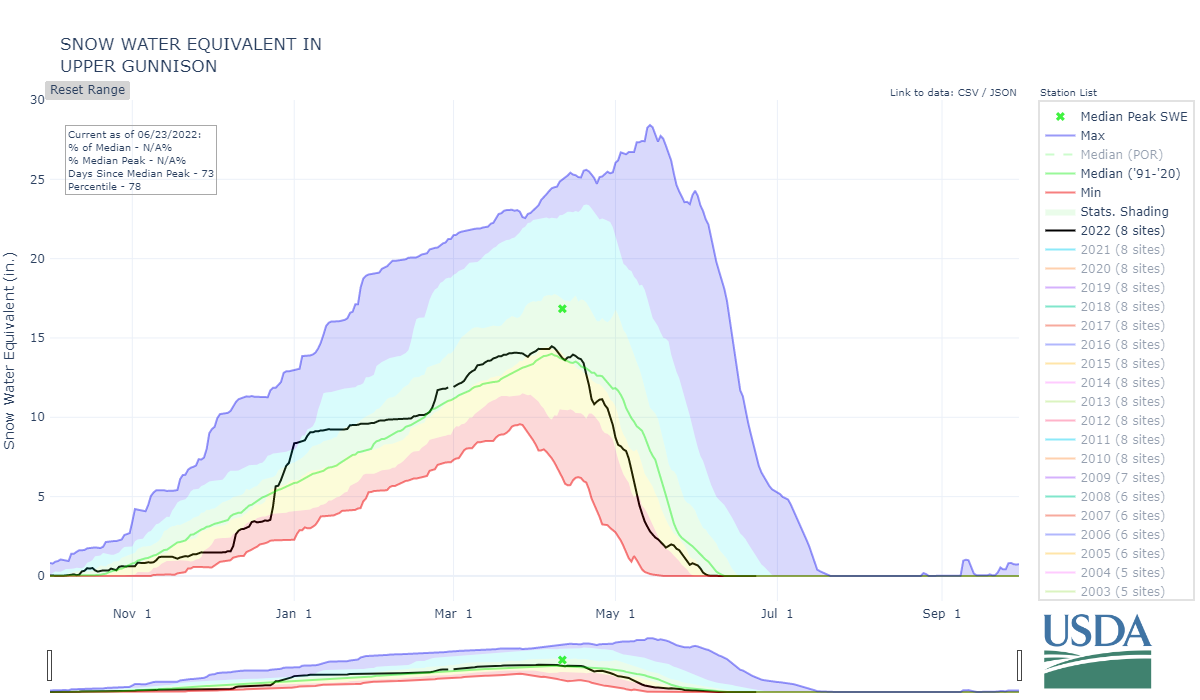
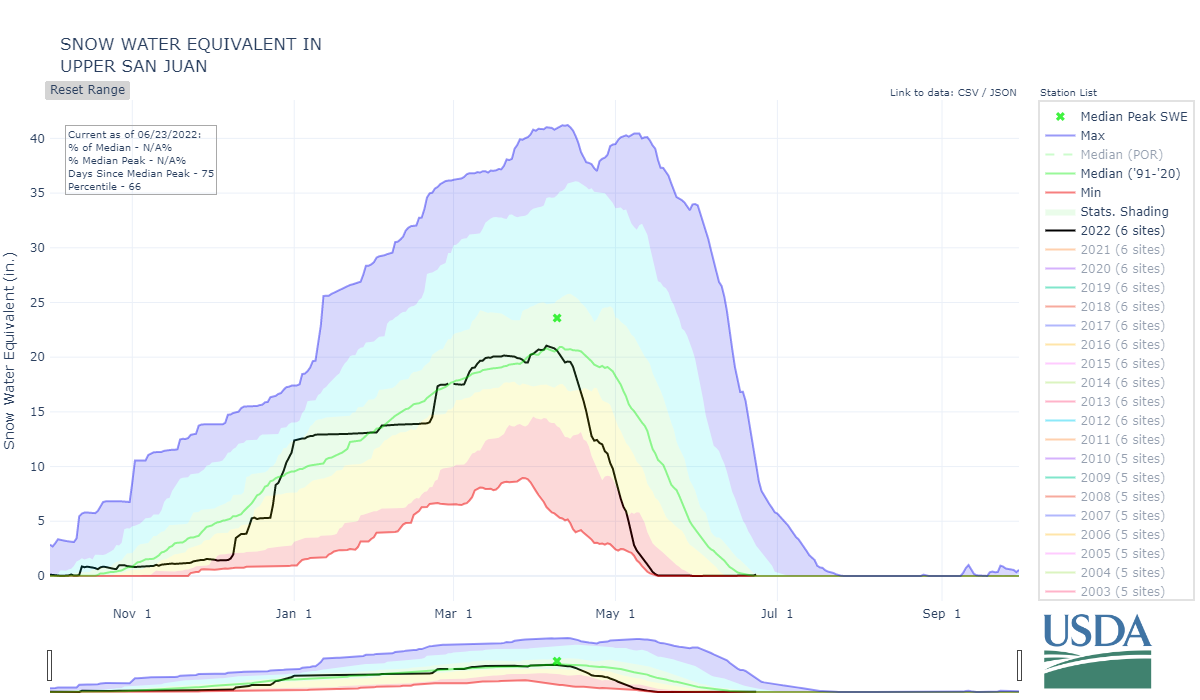
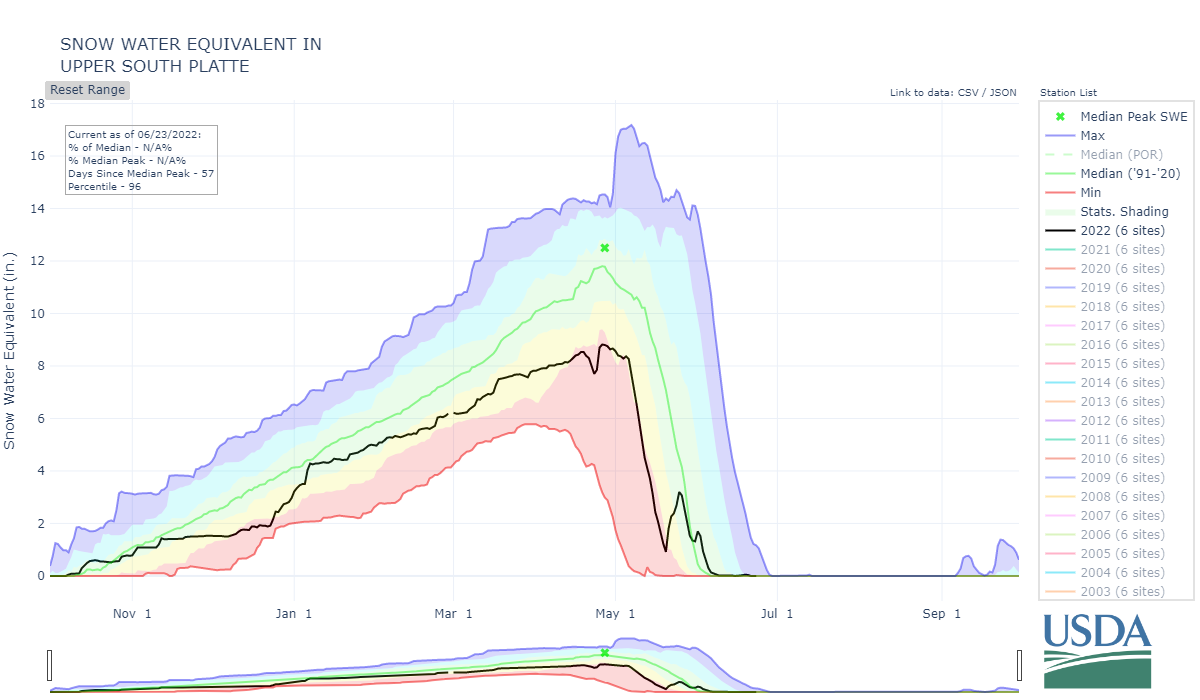
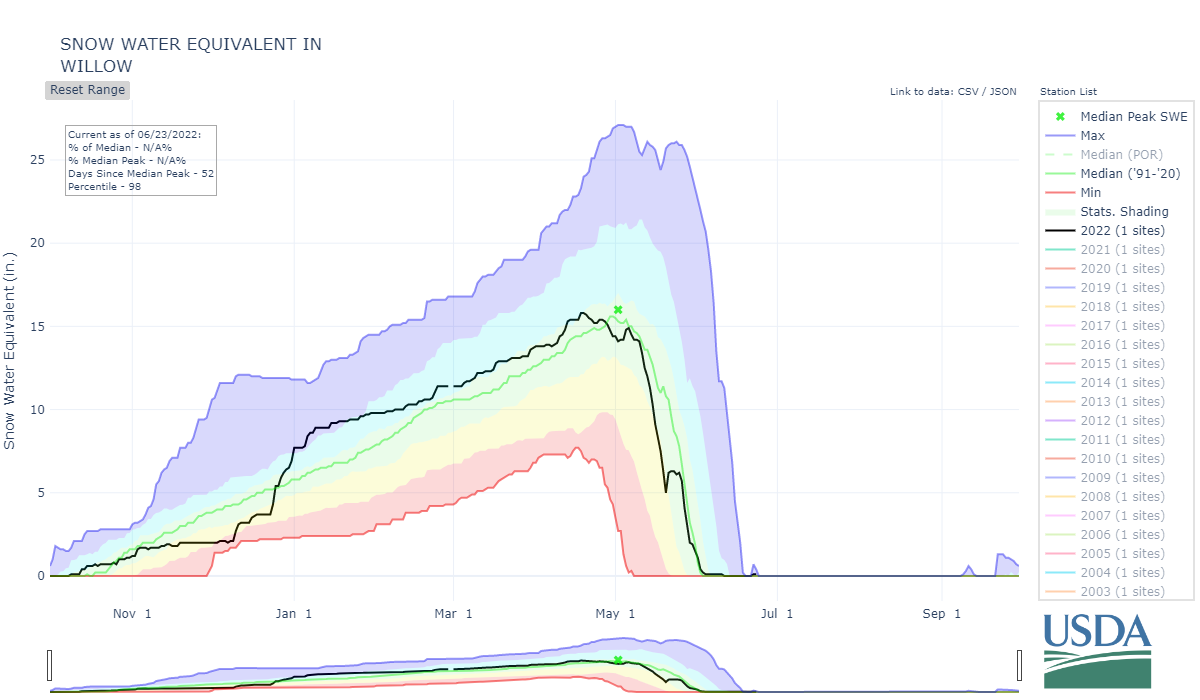
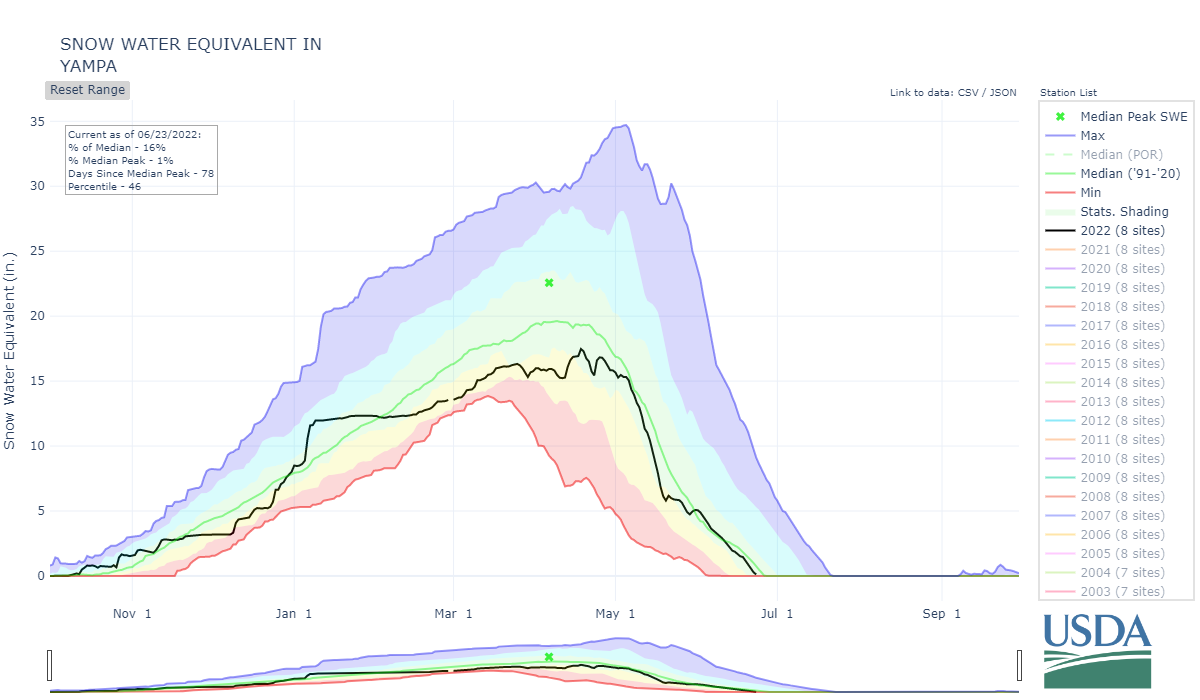
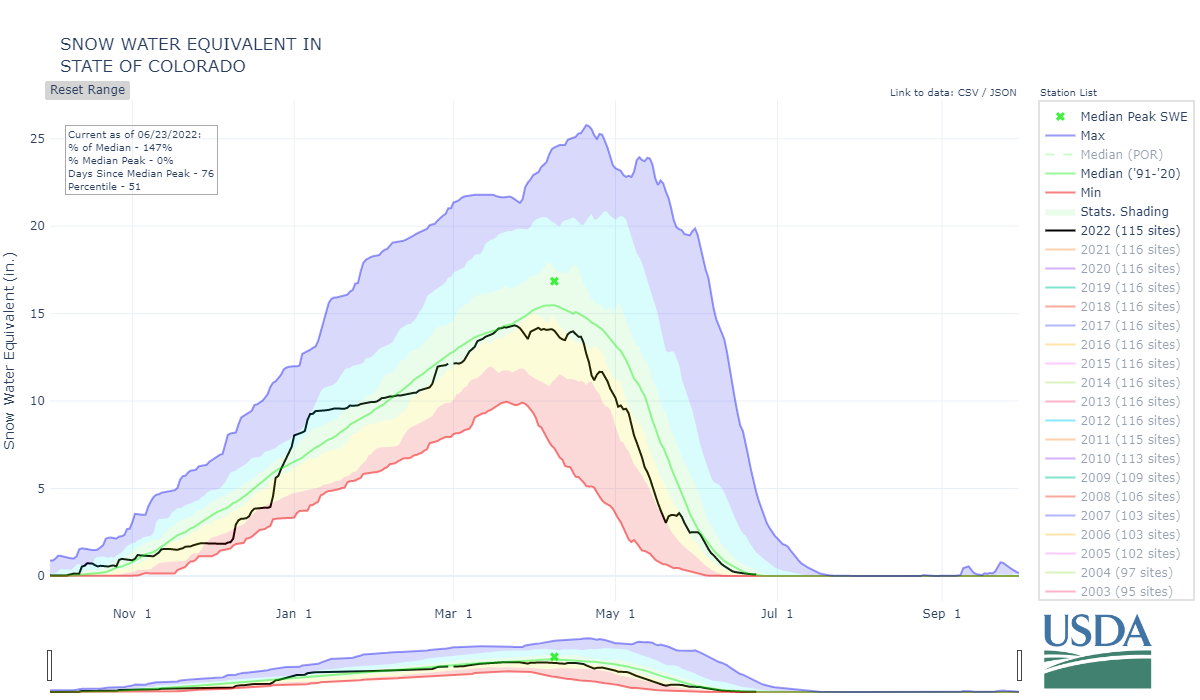
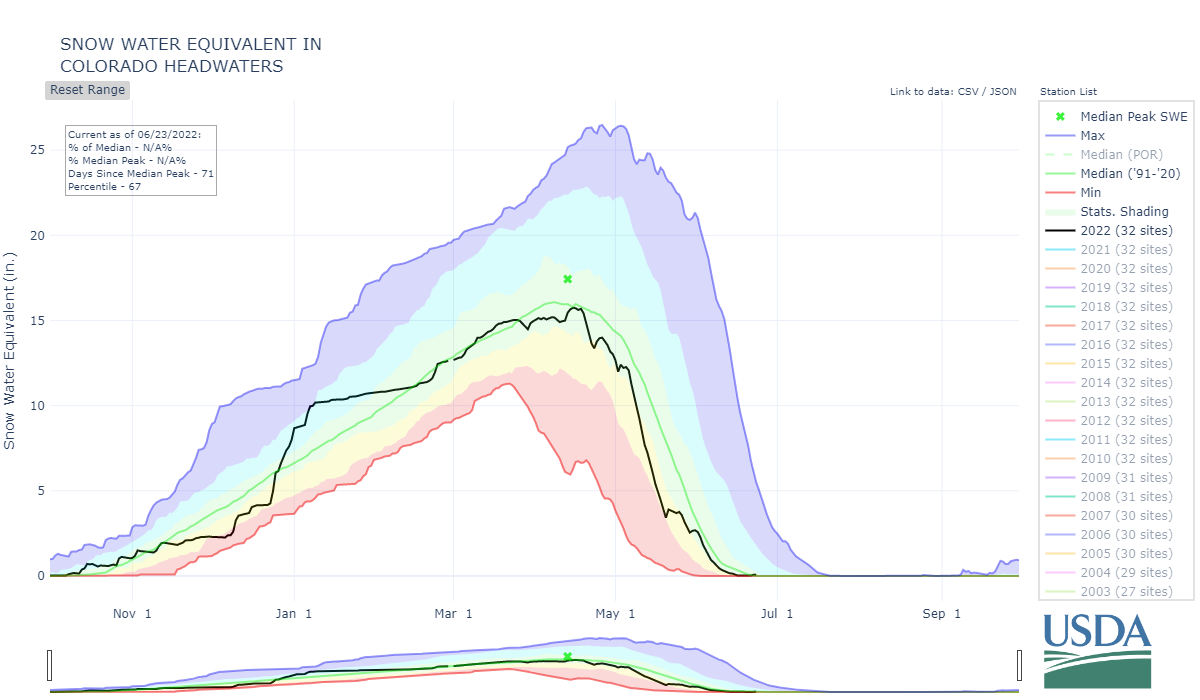
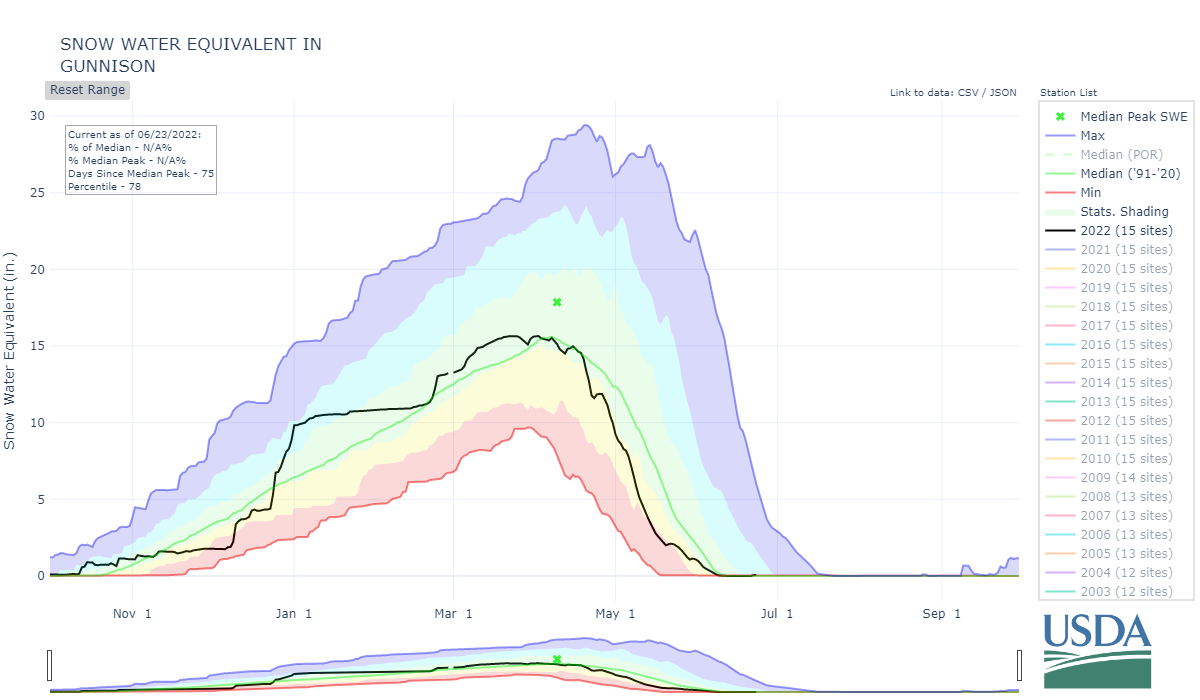
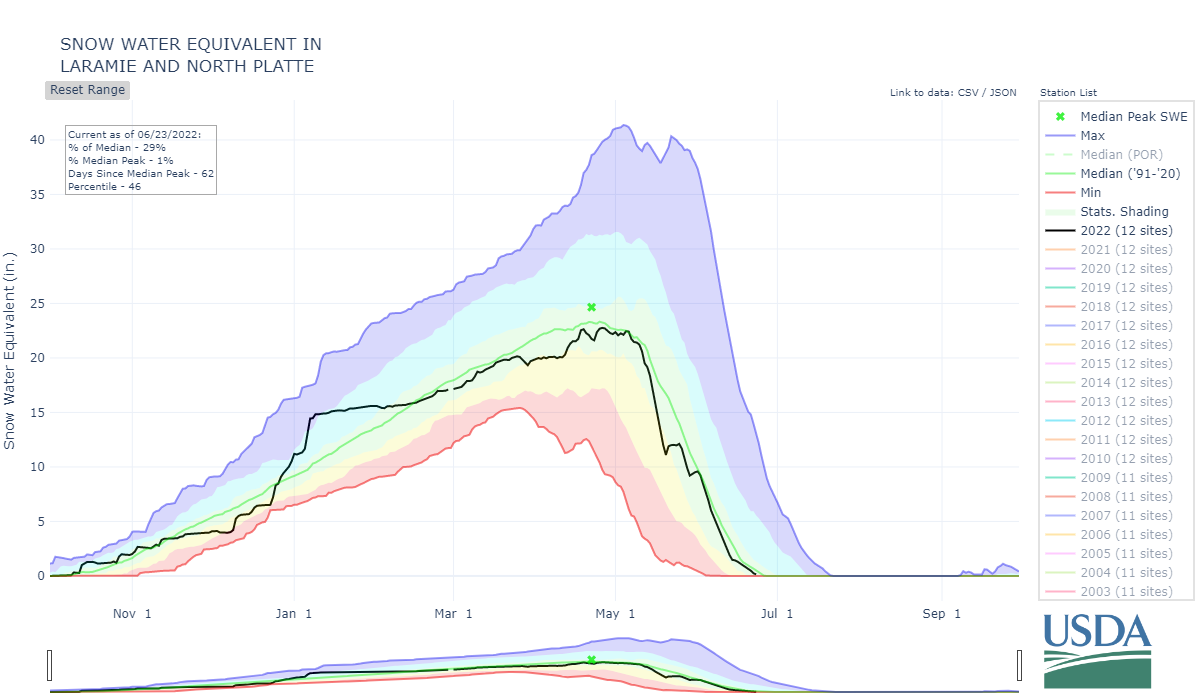
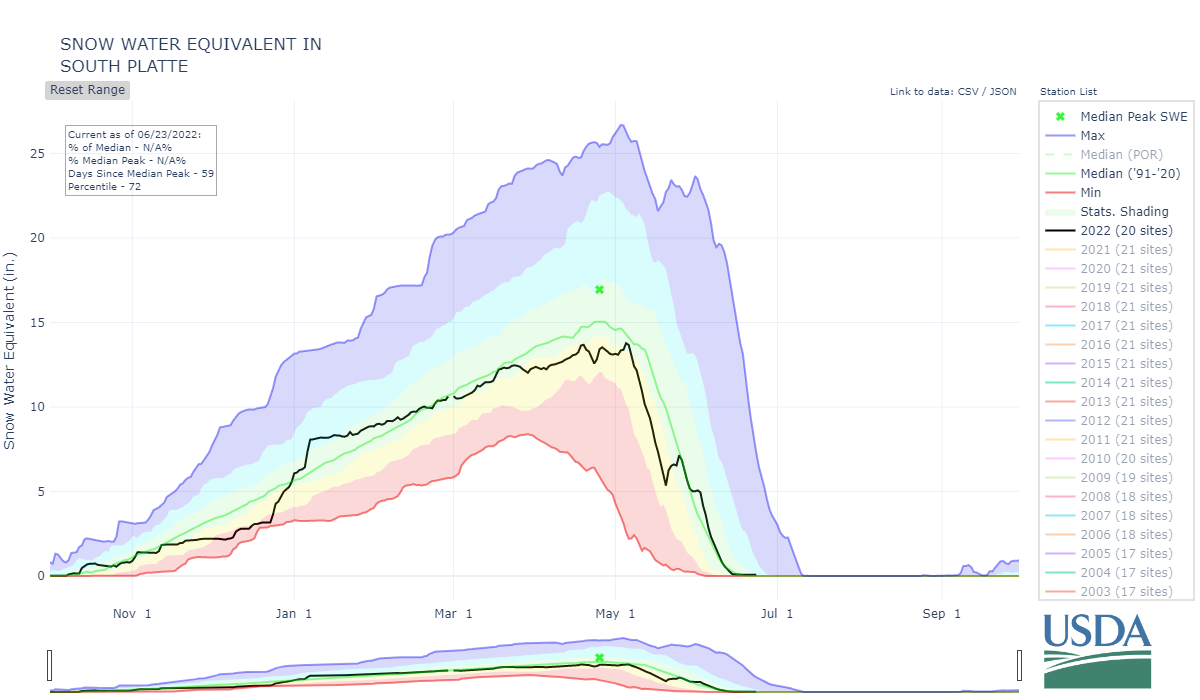
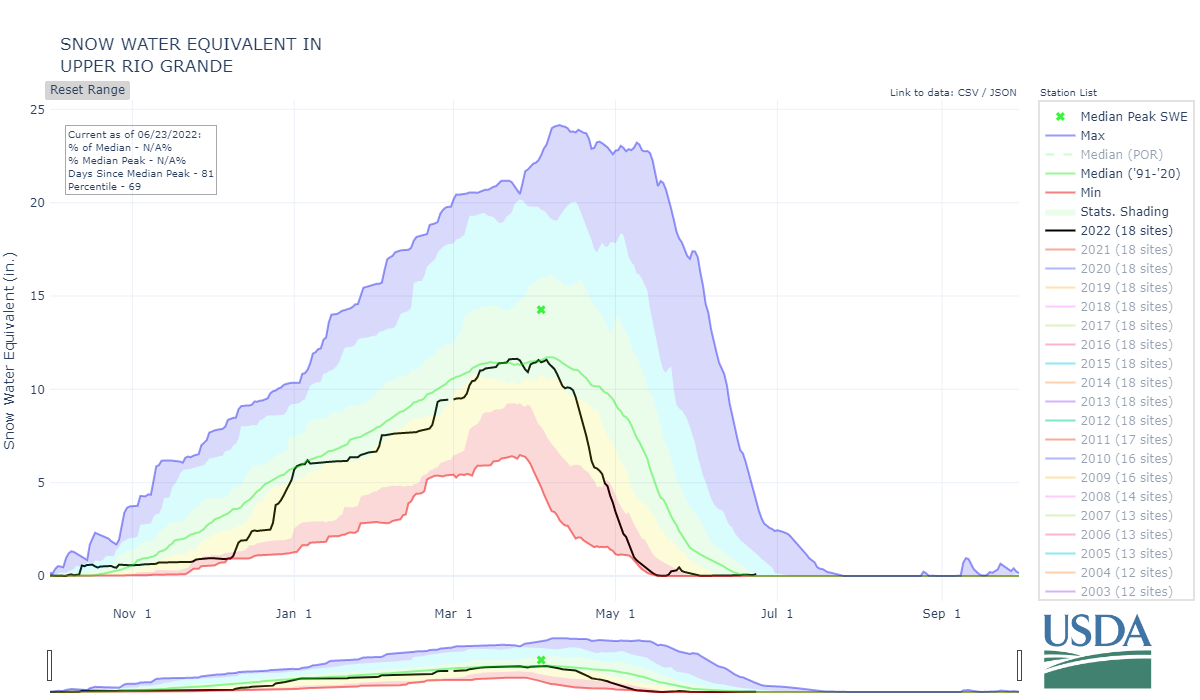
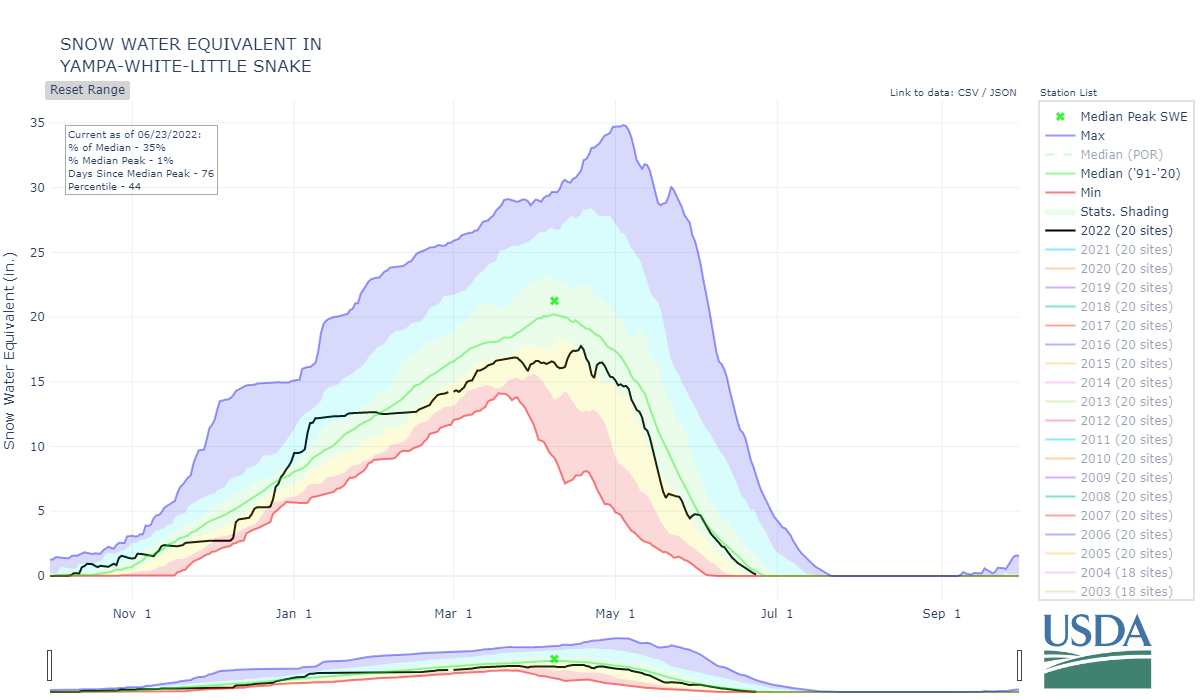
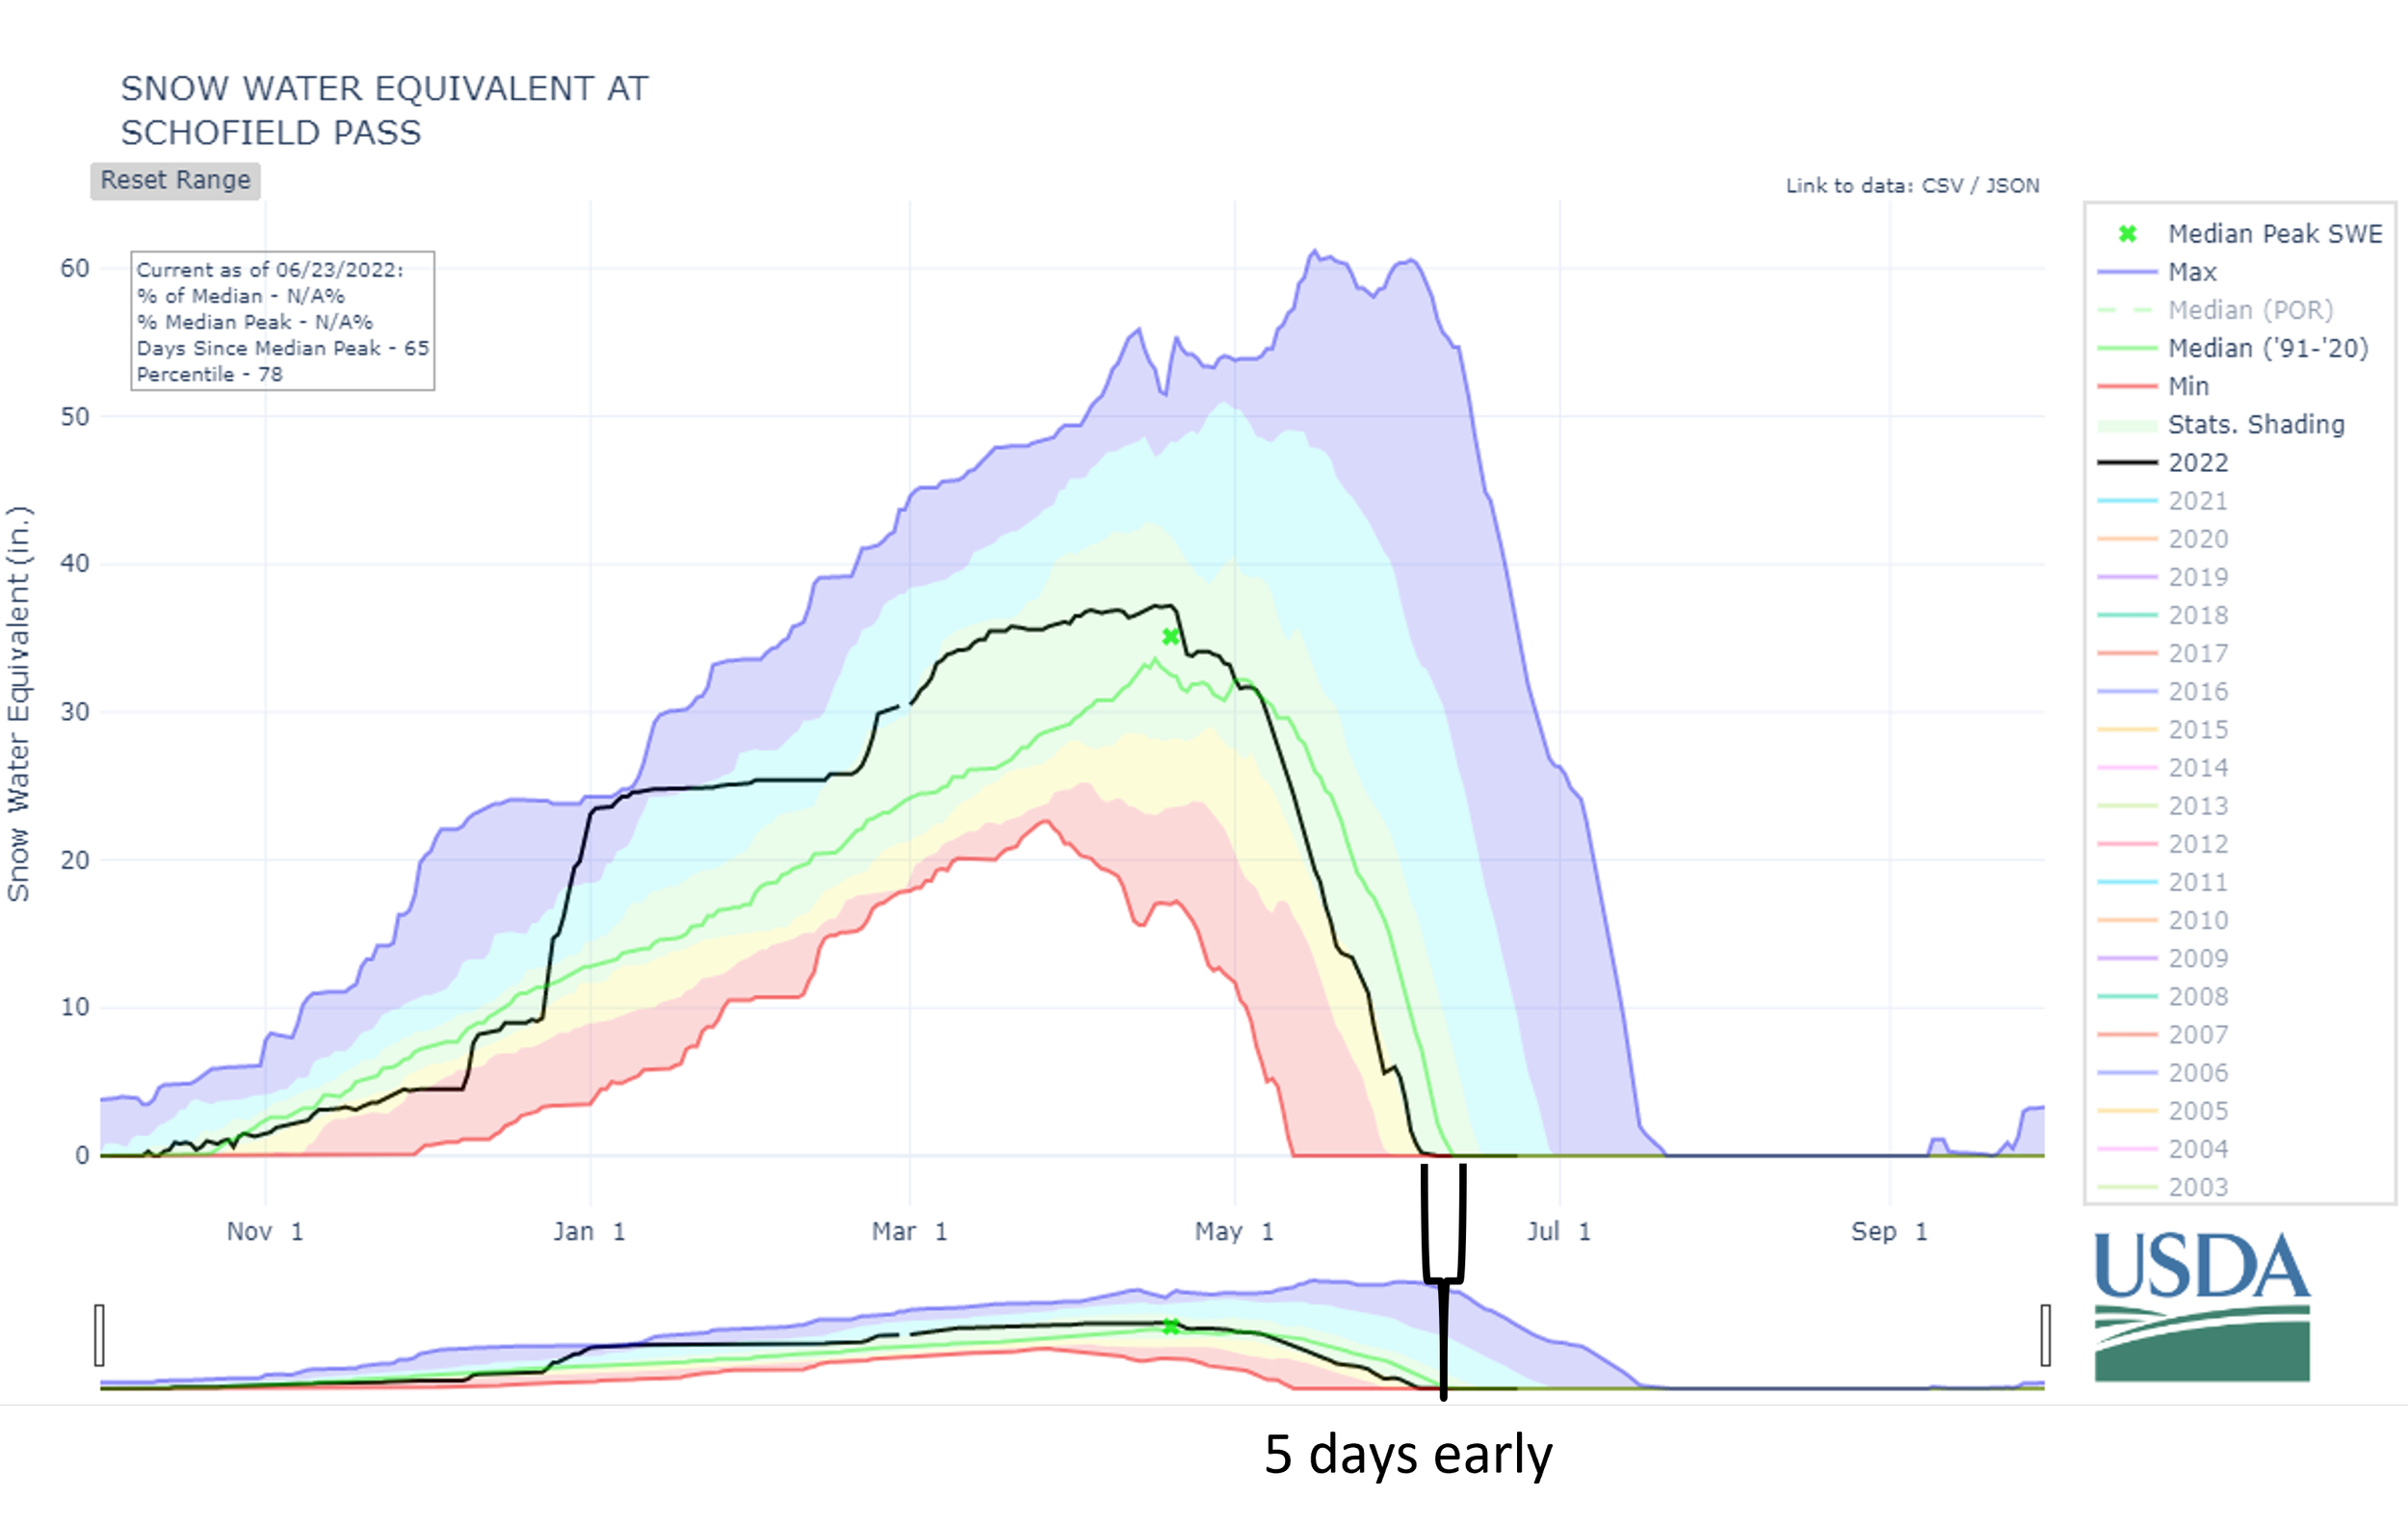
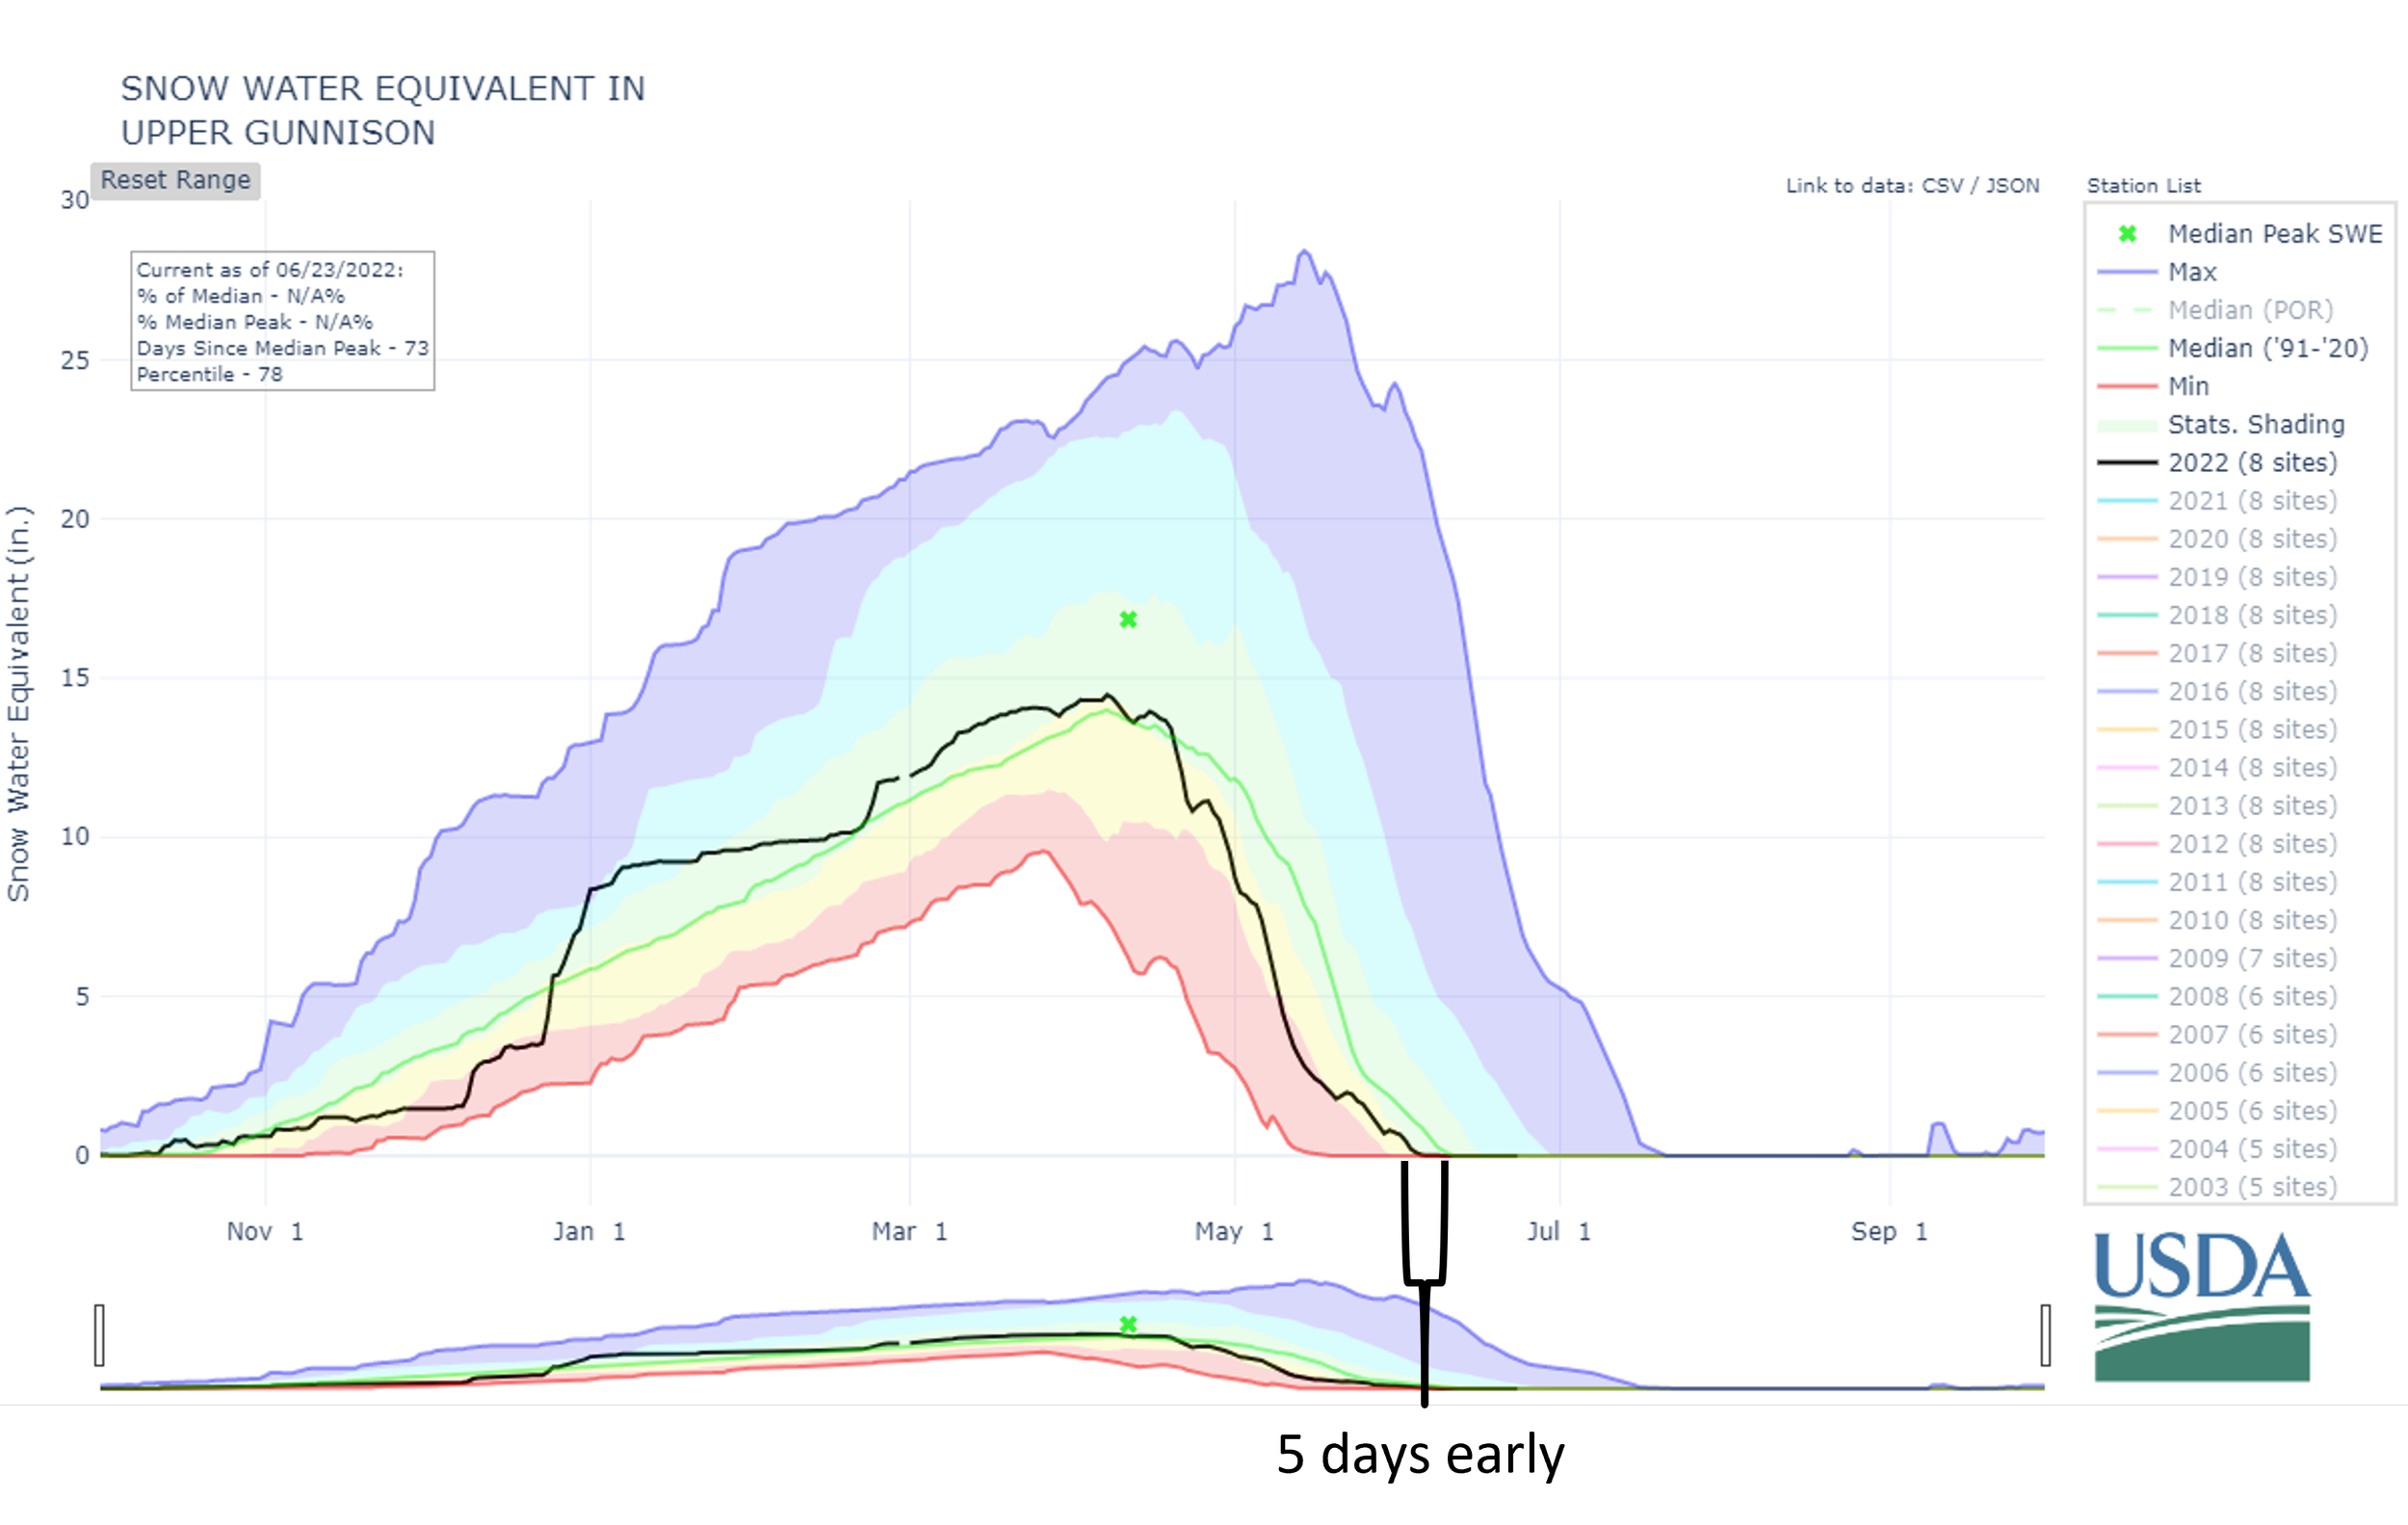
Above: Most major basins attained a peak SWE very close too their median, for some the timing was shifted, earlier or later, compared to the norm. The South Platte and Yampa fell a few inches short of normal peak SWE but were able to hold onto the snow into June, which was not the case for southern basins. Most of the above plots illustrate the rapid snowmelt seen across the state.
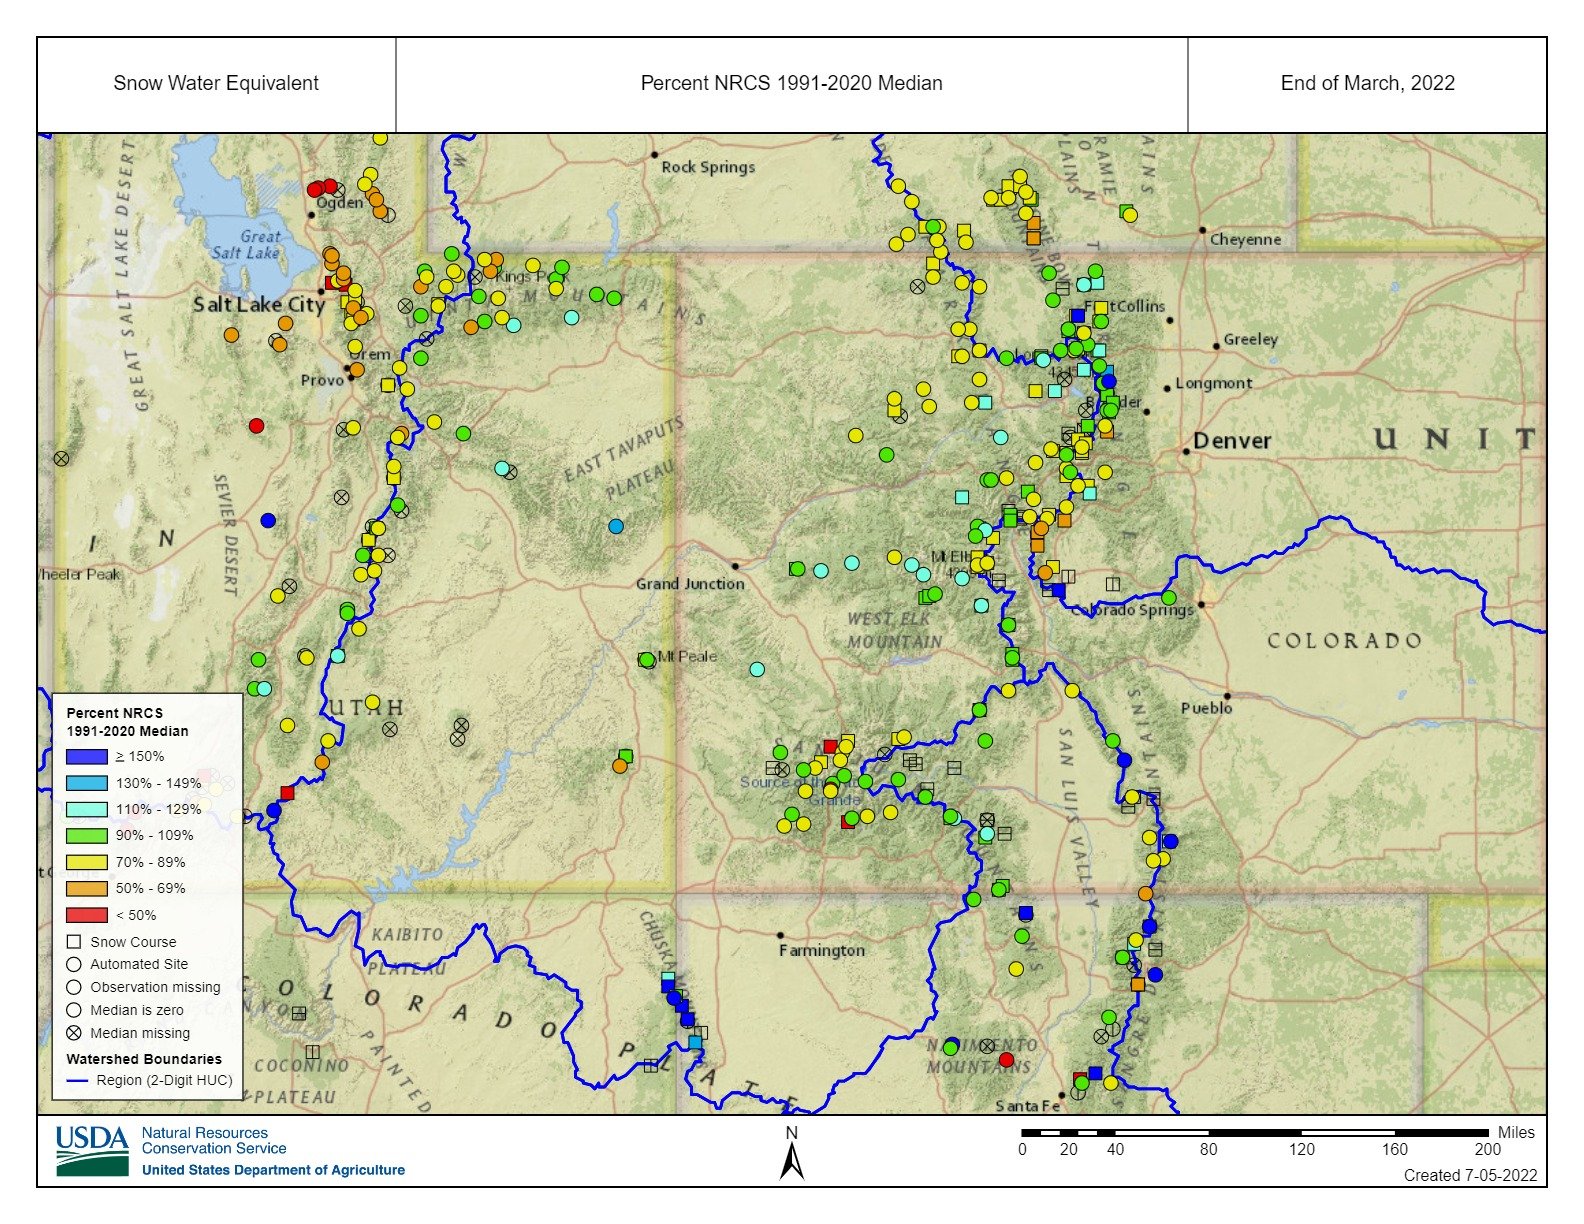
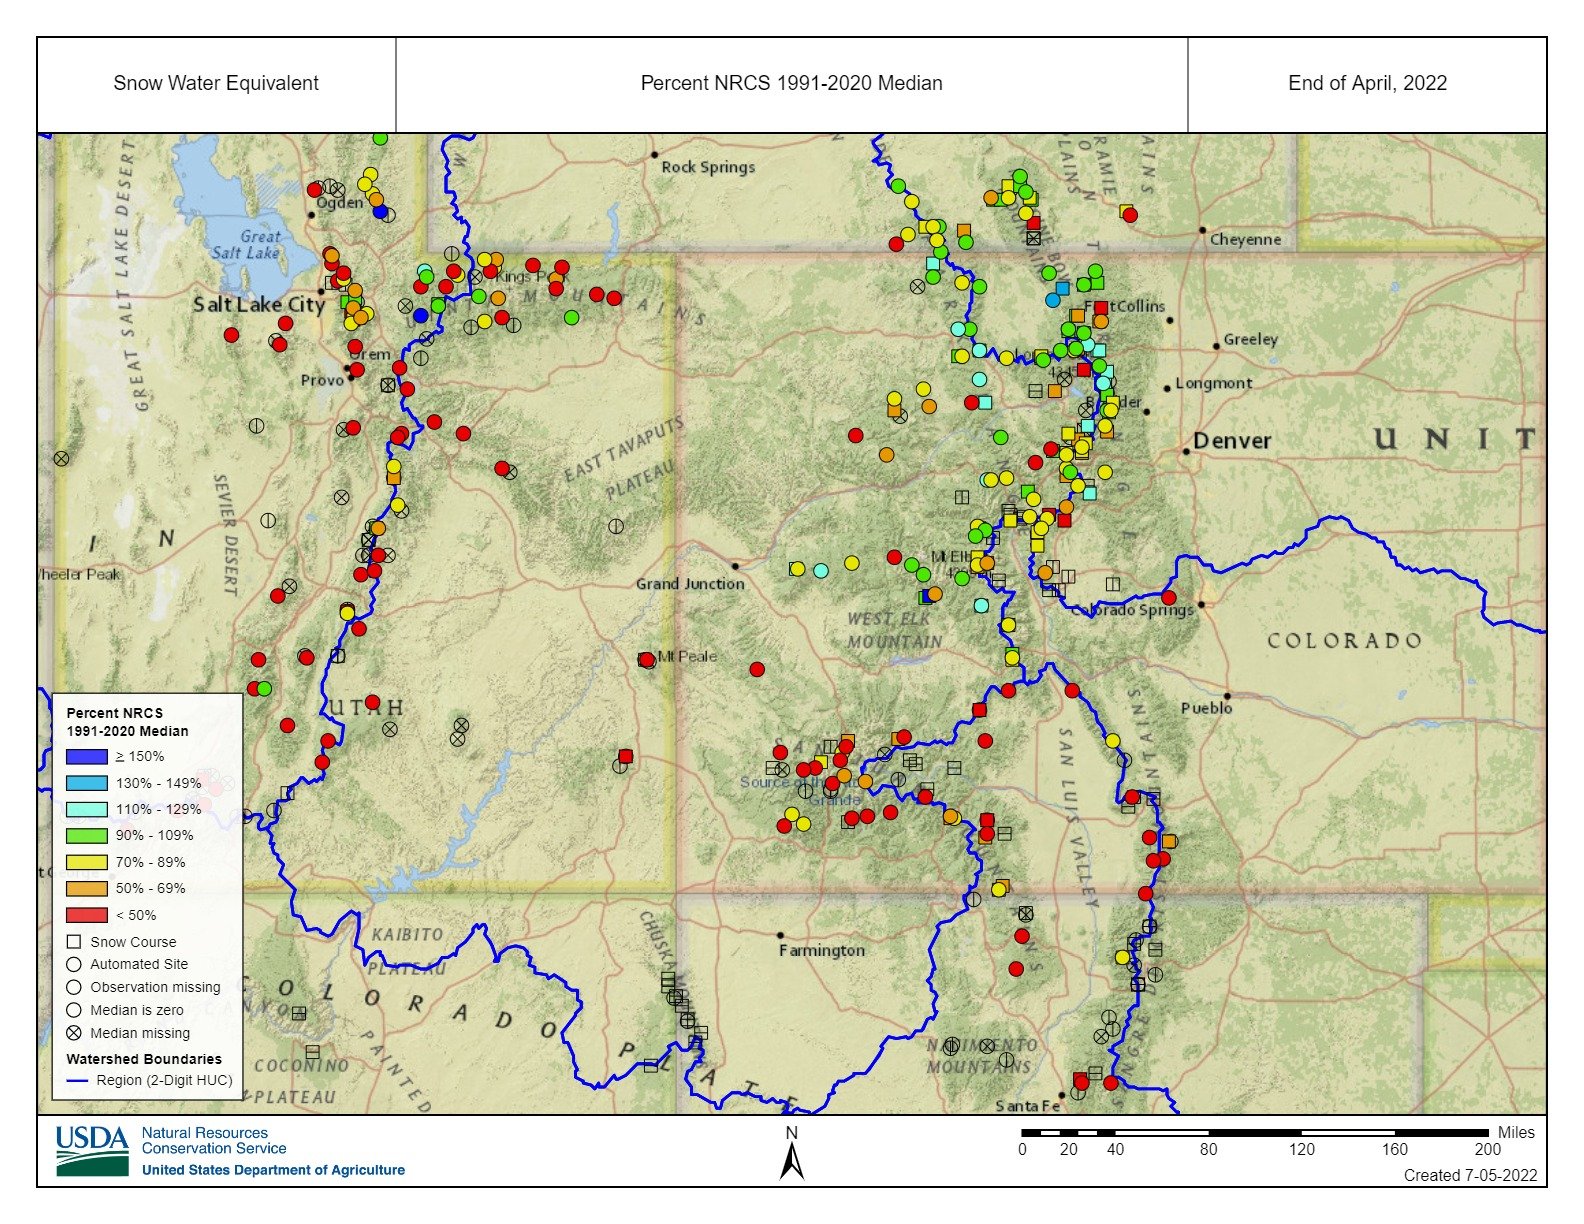
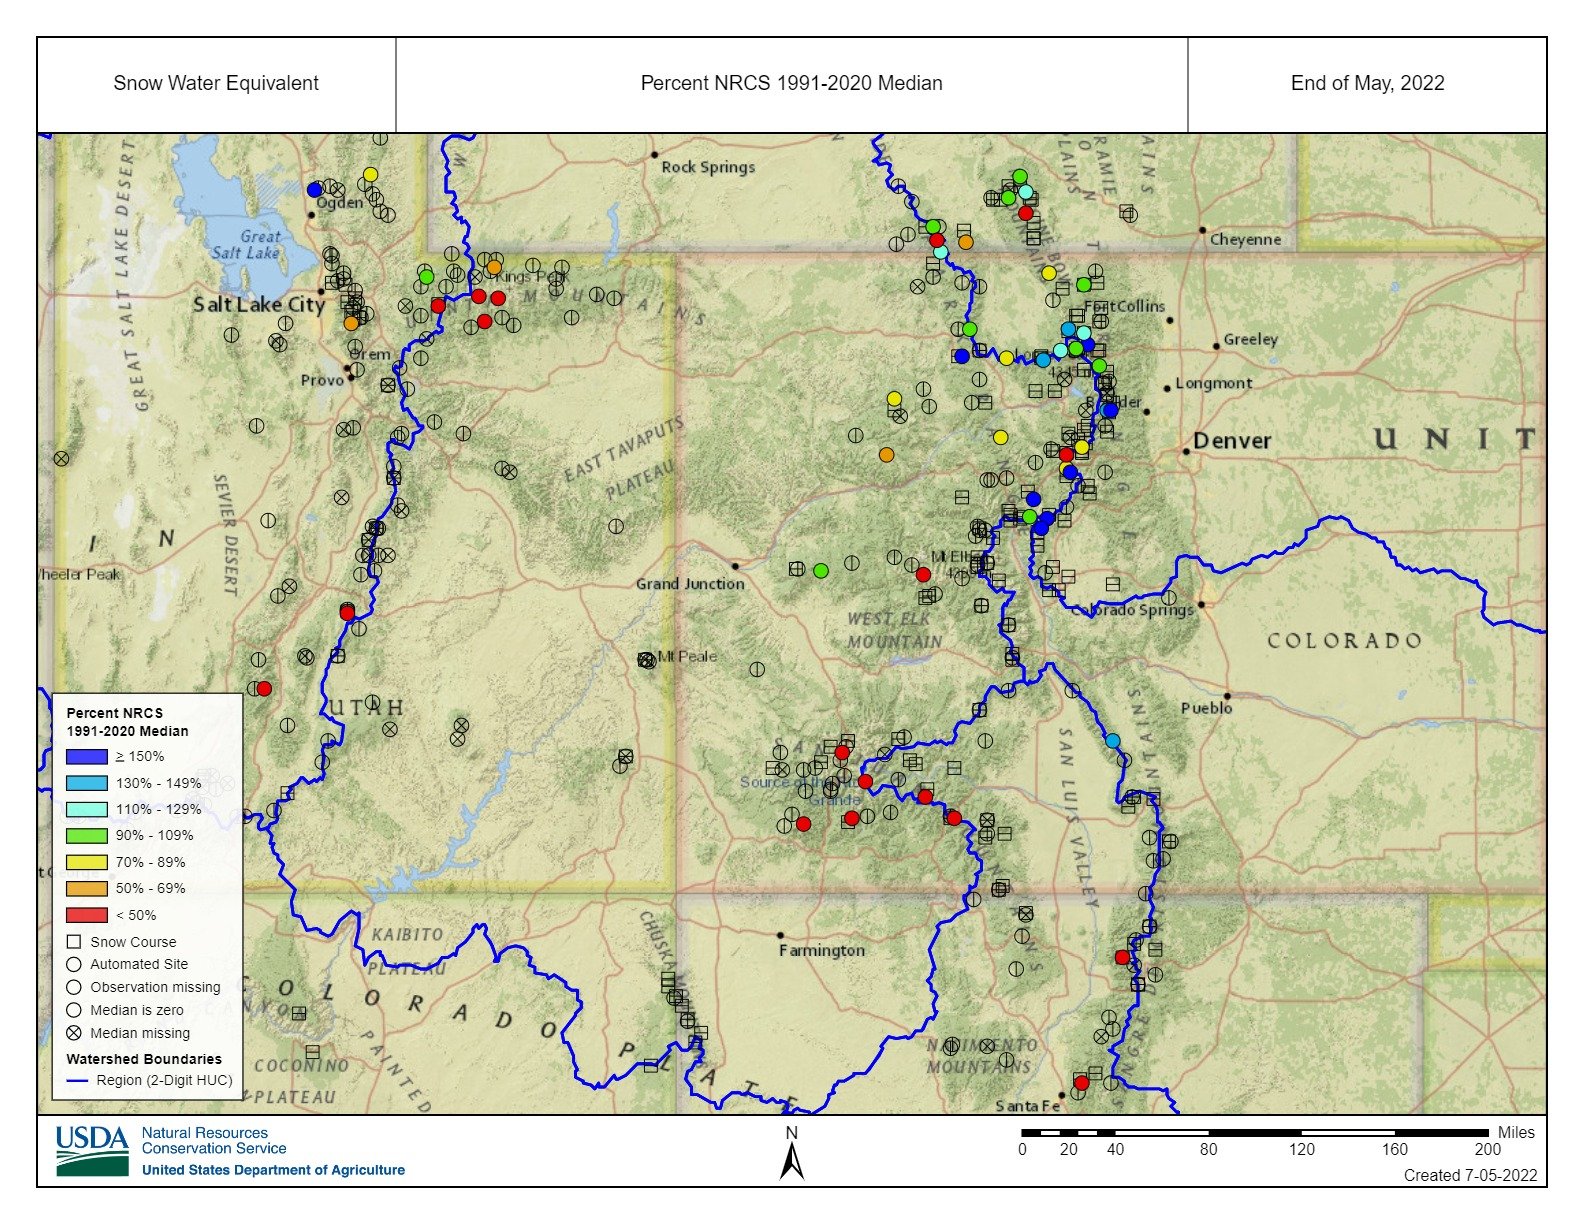
Above: SWE at SNOTEL sites for March, April, May. Some very stark differences (by region and station) of where the snowpack did well and not so well.
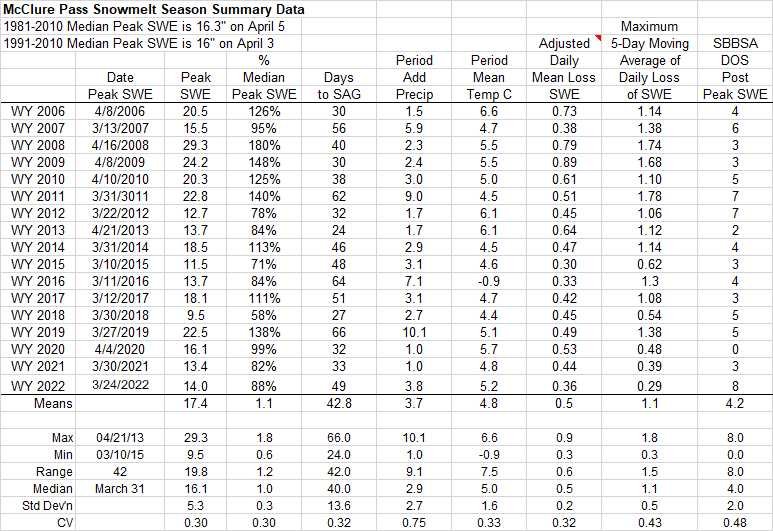
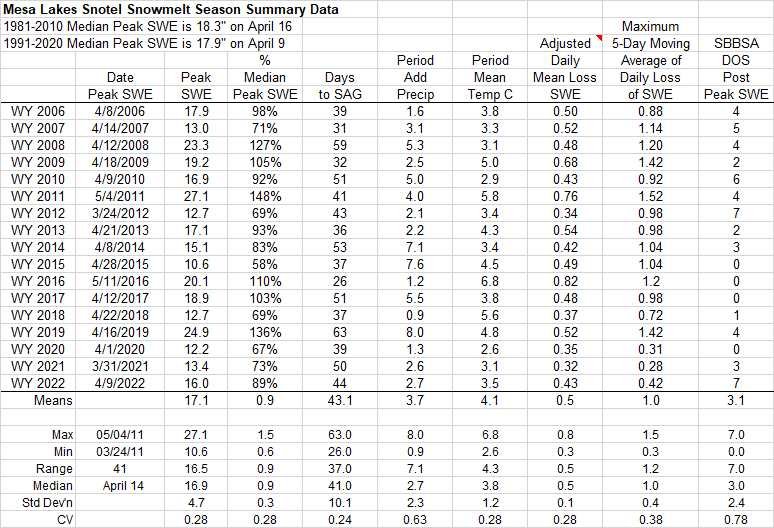
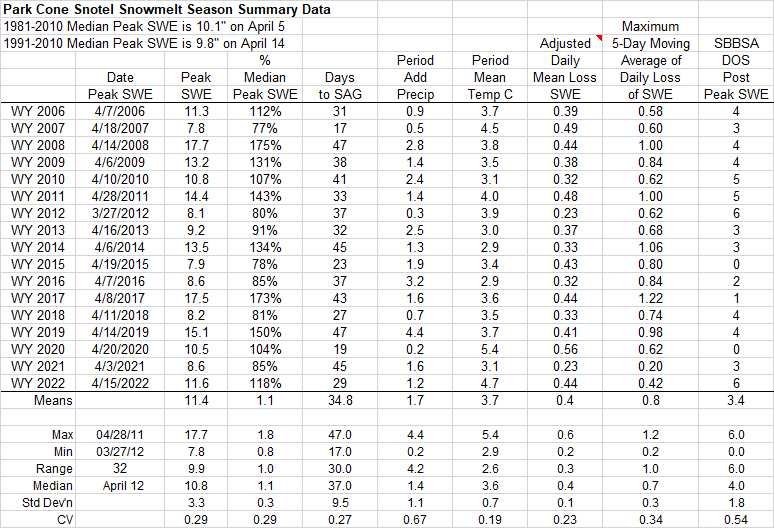
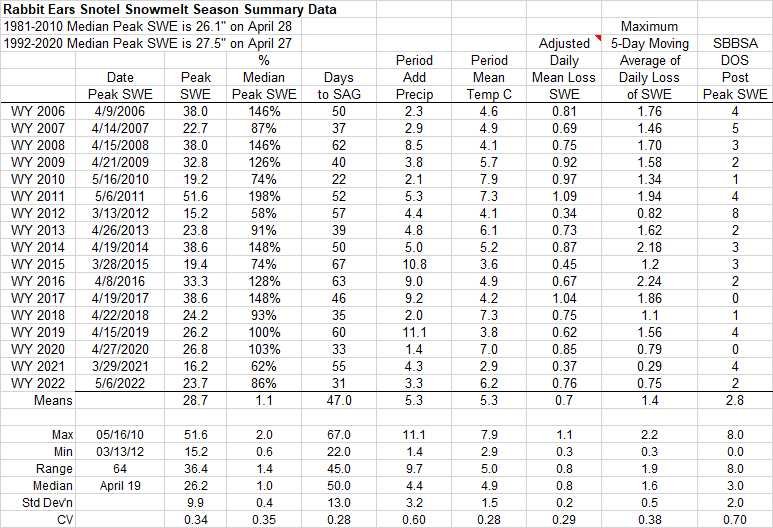
Above: Annual statistics for individual SNOTEL stations tracked by the CODOS Program.
Below: Summary statistics for individual SNOTEL stations.
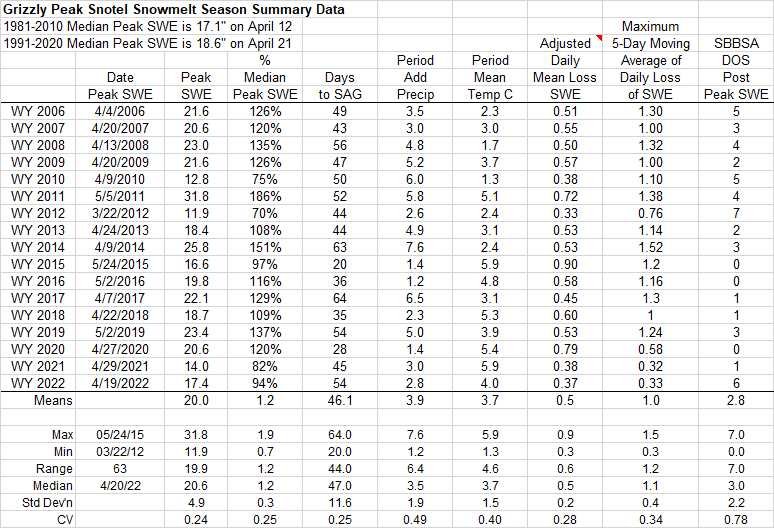
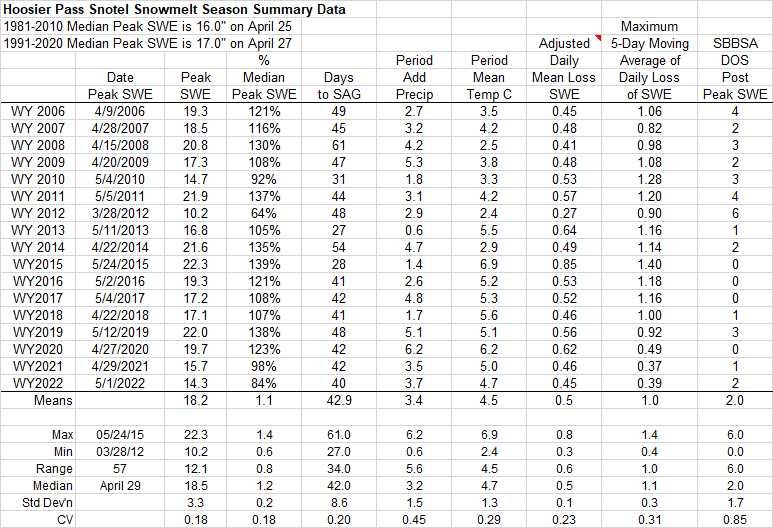
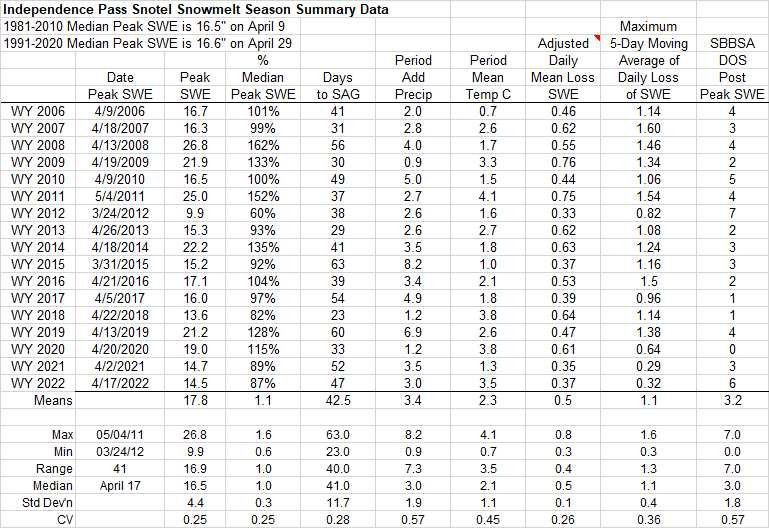
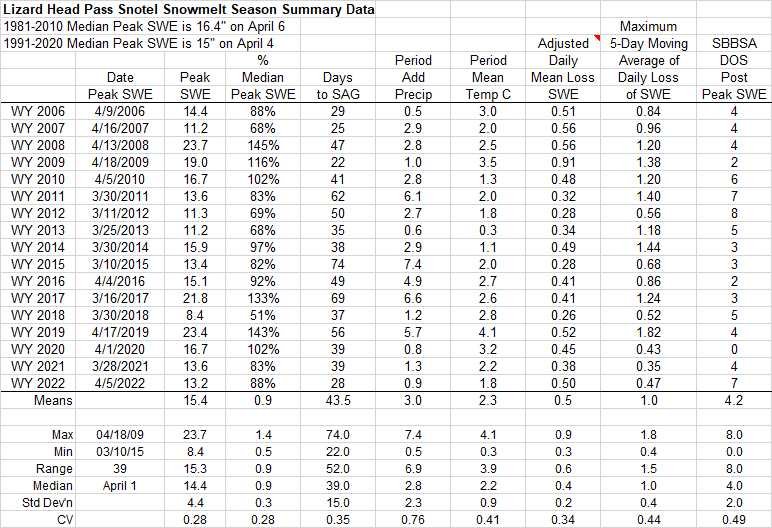
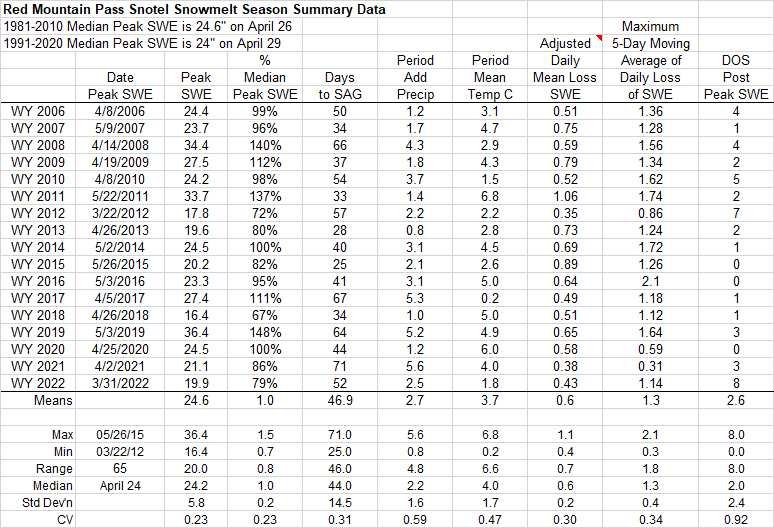
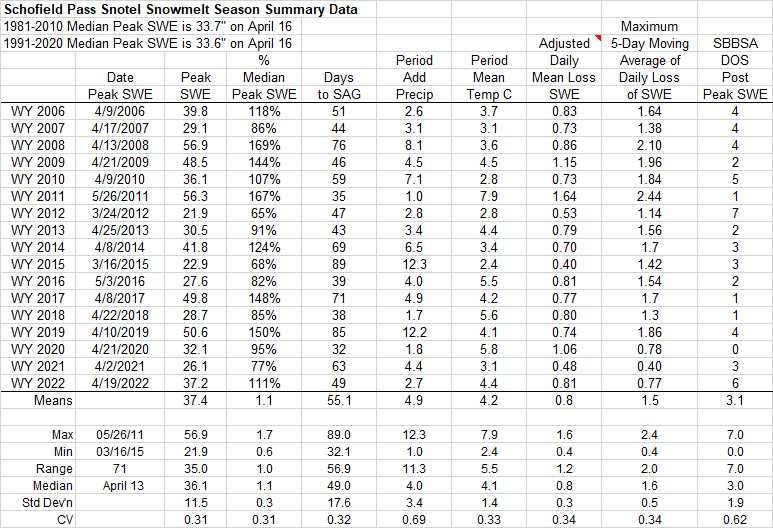
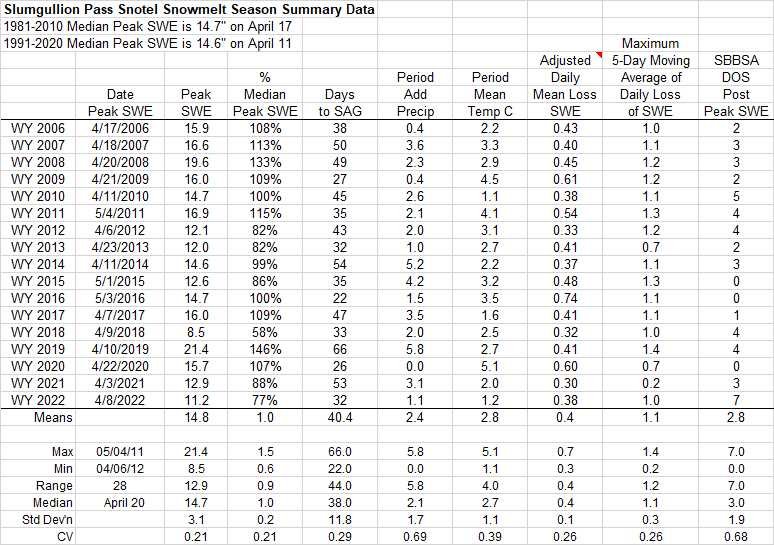
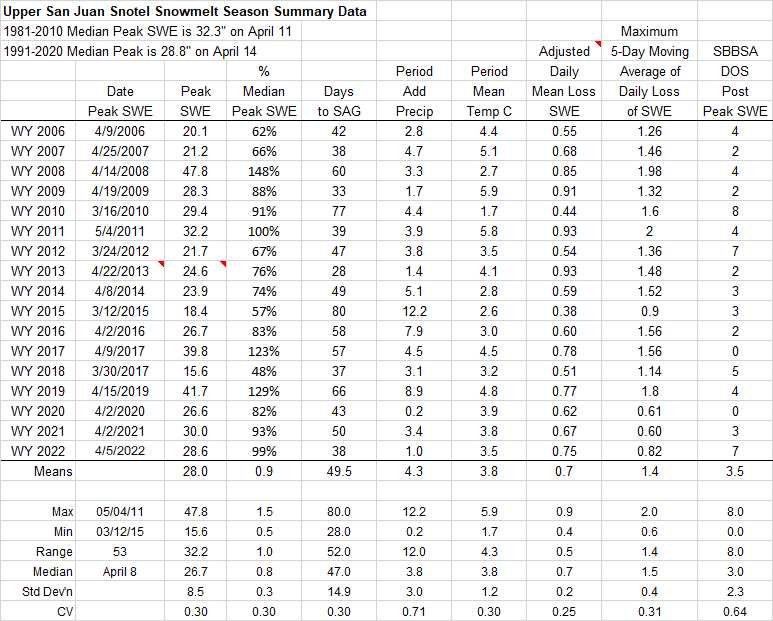
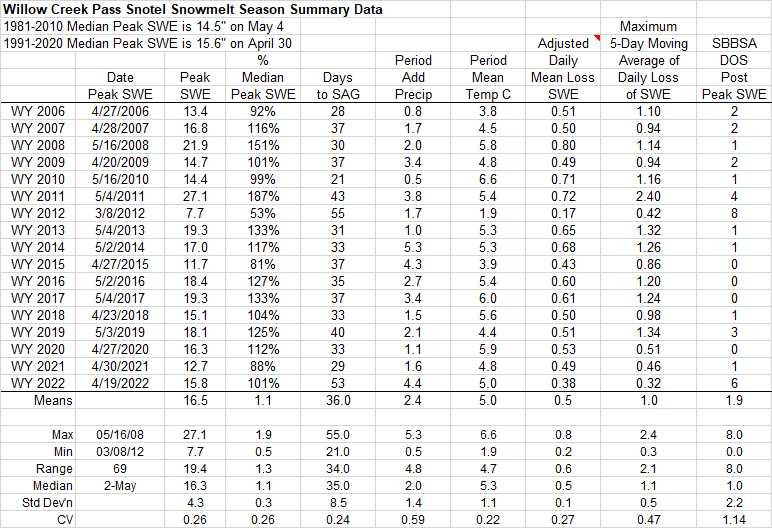
Below: Summary data for WY2022 at the 16 SNOTEL stations that CODOS monitors. The table shows peak SWE, and calculated from the day of peak SWE, melt rates, days to snow-all-gone, and mean temperature. Six sites reached their median peak SWE or better.

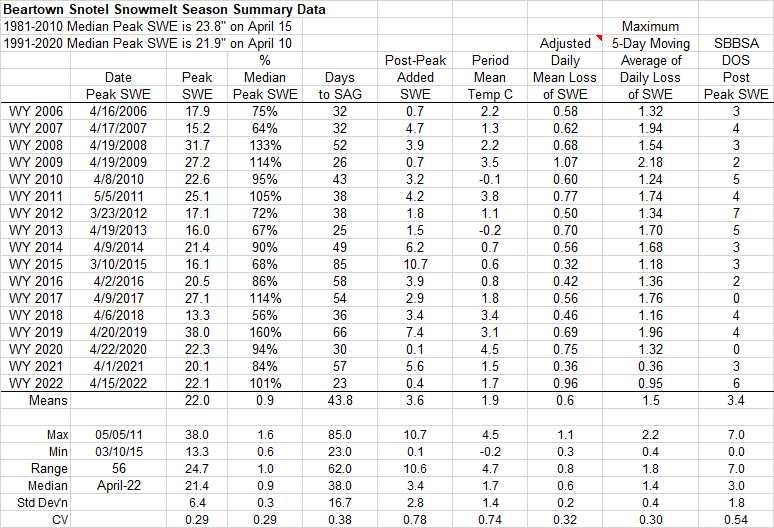
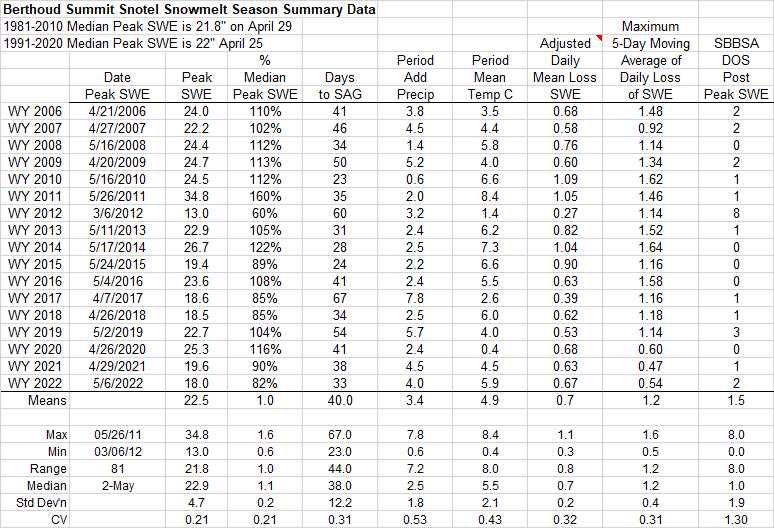
Below: A summary of WY 2006-2022 snowmelt rates and associated conditions at the 16 SNOTEL stations that CODOS routinely monitors. Days to SAG refers to the time between peak SWE and “snow all gone” at the SNOTEL sites. Adjusted Daily Mean Loss calculates the rate of snowmelt following peak SWE, including all precipitation received after peak SWE (assumed to be snow). Melt rate tables are presented for each of the 11 CODOS monitoring sites on their webpages.
The adjusted daily loss of SWE was right in the normal range at 0.55”/day, the 5-day moving average of SWE was rather low at 0.6”/SWE, and average post peak SWE temperatures were in the mid-range at 3.8 degrees C. Many locations began melting earlier than normal and much faster than normal. SNOTELS in the northeast region had a more near normal snowpack, and some sites received some timely storms to prolong snow ablation season (such as the storm benefitting the Arkansas and South Platte on May 18).
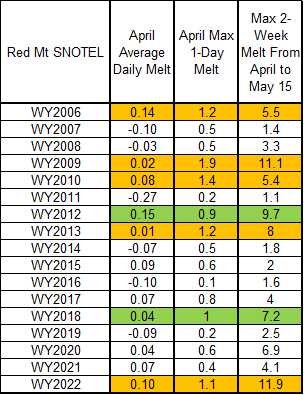
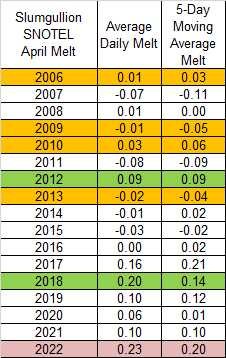
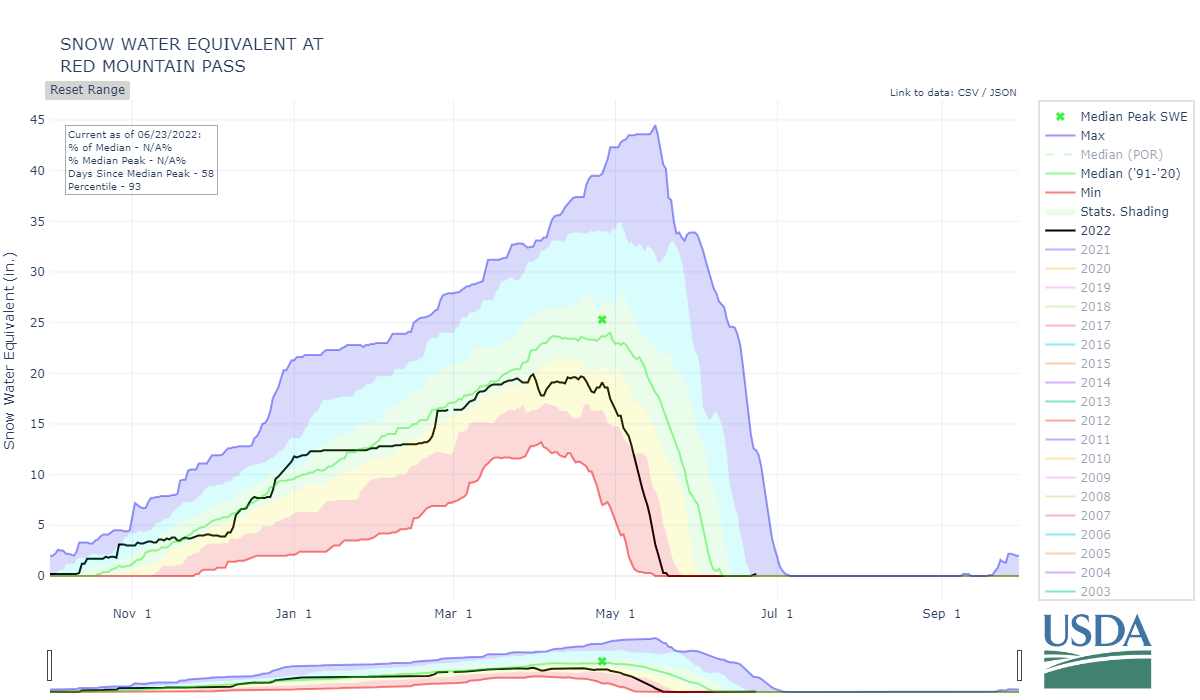
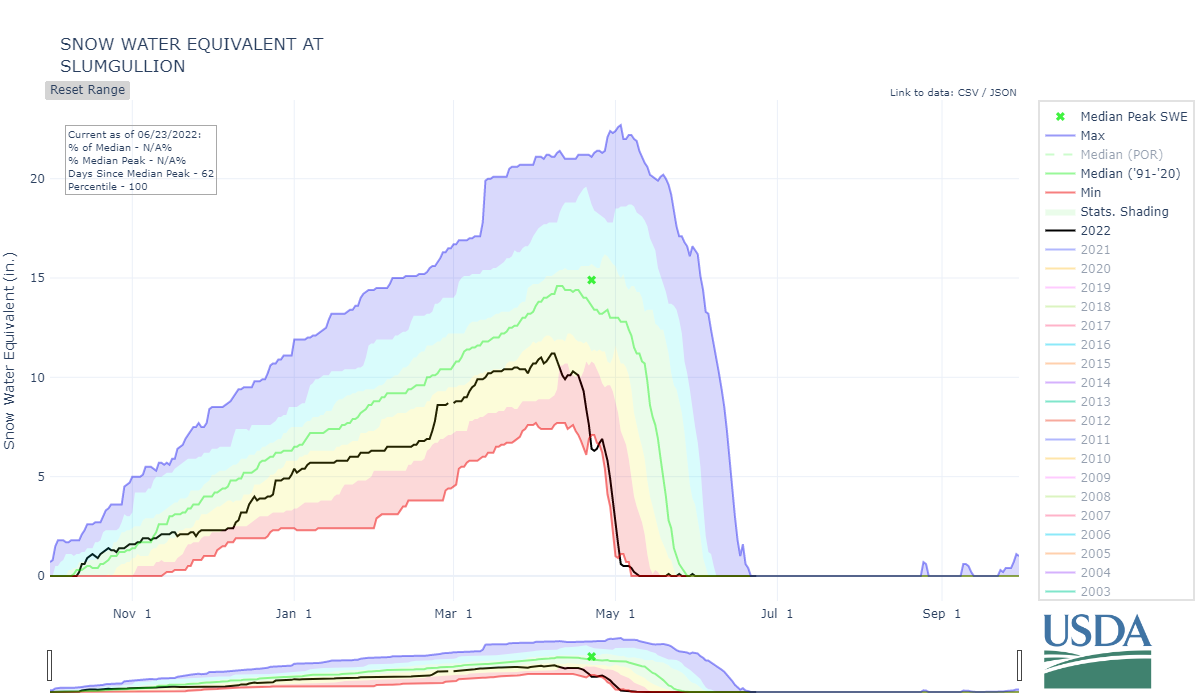
Above: Melt rates for Red Mt Pass and Slumgullion SNOTEL for the month of April as an example of how high melt rates were towards Southern Colorado during the month. Years highlighted in yellow were high dust-on-snow years. The two years highlighted in green were notable shallow snowpack years.

Snow depth at Swamp Angel Study Plot.

Snow depth at Senator Beck Study Plot.

Snow water equivalent at Swamp Angel from snow profiles.

Snow water equivalent at Senator Beck Study Plot from snow profiles.
DUST-ON-SNOW CONDITIONS
DUST ENHANCED RUNOFF CLASSIFICATION:
In Water Year 2015 CODOS introduced a Dust Enhanced Runoff Classification (DERC) approach to linking dust-on-snow, snowpack, and spring weather conditions to patterns in statewide hydrographs within a 3x3x3 Dust Enhanced Runoff Space. The below table presents the final DERC classification of WY2022 parameters at each of the 20 stream gauges monitored by CODOS. Water Years 2006-2022 classifications are contained in Excel workbook Runoff_Space_by_Region_and_WY.xlsx. Another workbook, Runoff_Space_by_Watershed.xlsx, contains individual DERC analyses for WY 2006-2022 for each of the 20 stream gauges.
A conceptual Dust Enhanced Snowmelt Runoff Space integrating the interactions of March 1 SWE, dust intensity, and spring precipitation.
Current and prior seasons snowpack conditions, dust severity, and spring precipitation are mapped for individual DERC space along with the hydrographs. These analyses are presented in PDF format and are available for the watersheds listed below. Referencing these DERC spaces in spring is helpful to get and idea how spring runoff will possibly unfold.
Below: Based on the discussions describing the DERC approach in characterizing the watersheds that CODOS monitors, WY2022 snowmelt season conditions are summarized in the tables below. Essentially, Colorado WY2022 snowmelt runoff behaviors fell into general patterns of “Maximum” dust severity, mostly a combination of “Average” or “High” March 1 SWE, and all but six sites but had a “Dry” spring.

The Senator Beck Basin received 11 dust events this season, occurring on December 26, February 21, March 4, March 31, April 11, April 20, April 22, May 1, May 2, May 7, and May 8. Judging by the severity of the dust events through March it was mostly apparent it was going to be a “max”, or “severe” dust year. Up until WY2022 year we had not classified dust-on-snow as “severe” since WY2013. Details of individual dust events at Senator Beck and observations across the state starting in March are available on the codos website. It is important to remember that spring weather plays an important role on the amount of dust radiative forcing on the snowpack. Wetter (more snow accumulation) conditions like what the northern basins experienced compared to the south, in spring means the dust isn’t exposed on the surface as much, reducing albedo and increasing the absorption of solar radiation. In WY2022 timing of these dust events throughout the season meant that dust was typically at or near the snow surface, thereby constantly exerting an influence on snowpack warming, melt rates, melt timing, and sublimation rates.
As is getting to be a normal occurrence, our Wolf Creek monitoring site showed more severe dust layers than at Senator Beck on Red Mt. Pass. Going towards the northern basins dust-on-snow still evolved to the “severe” category but in relative terms (compared to the San Juan Mountains) dust conditions were not as bad as towards the south.
Above: Total dust-on-snow events by month. March begins the more intensive part of dust-on-snow season. In WY2022, December 26, February 21, March 4, March 31, April 11, April 20, April 22, May 1, May 2, May 7, and May 8.
Above: Total dust-on-snow events by year. Seven dust events in 2021/2022 were “wet” events and four were “dry” events. Eleven events total.
Below: Snow season albedo since 2006. Albedo can vary greatly depending on dust severity and precipitation events, but WY2022 (red line) was exceptionally dusty and April/May was notably warm/dry. The result being albedo hovering at record lows. Also shown is WY2009 - a notoriously bad dust year - for comparison.

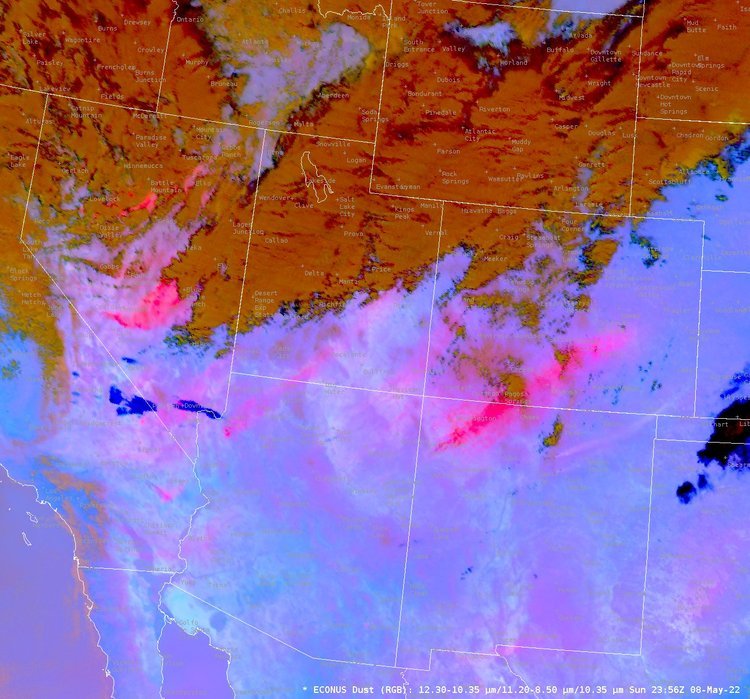
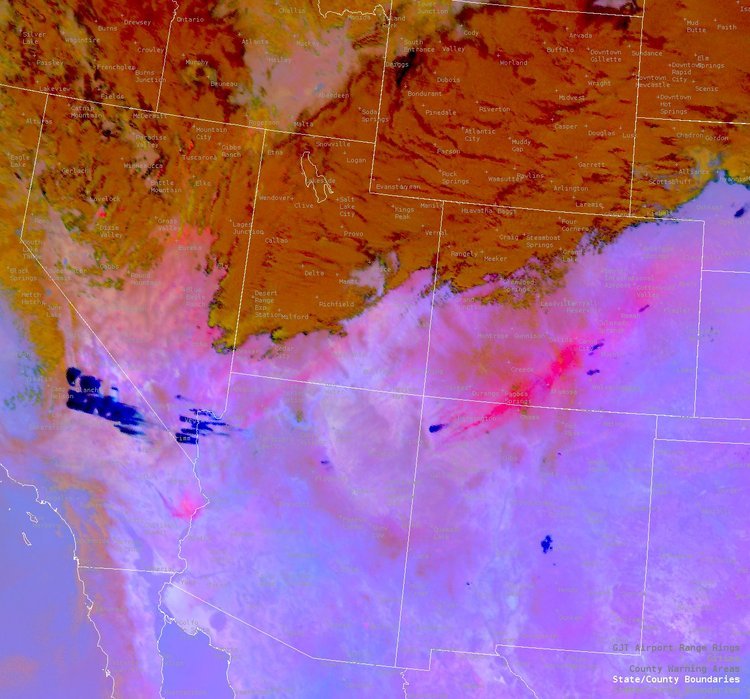
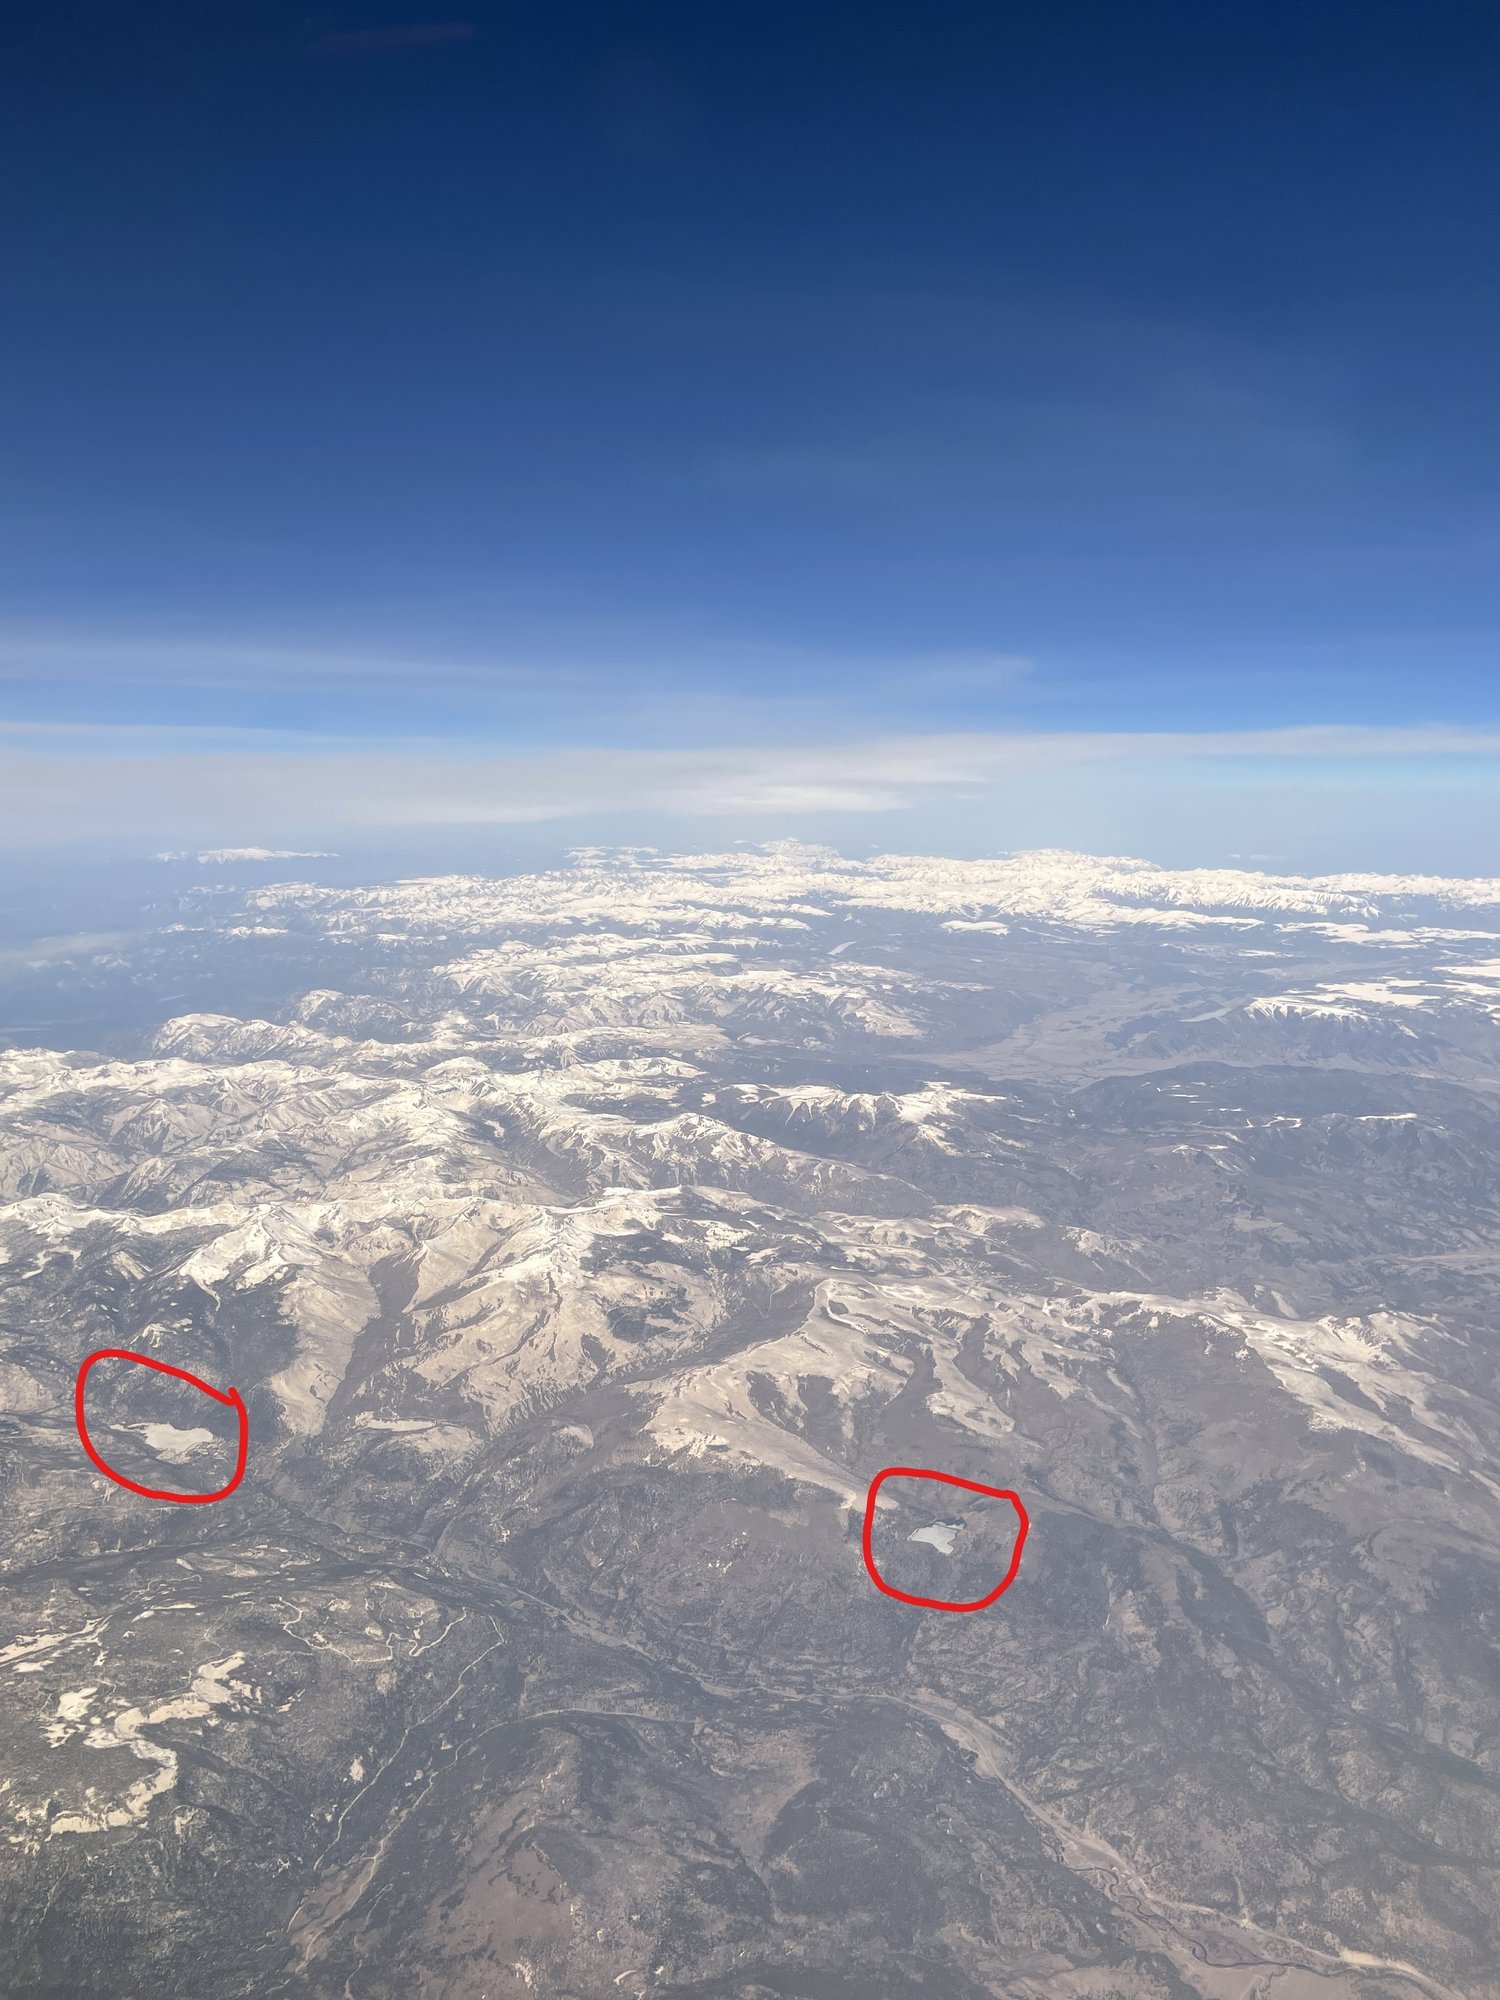
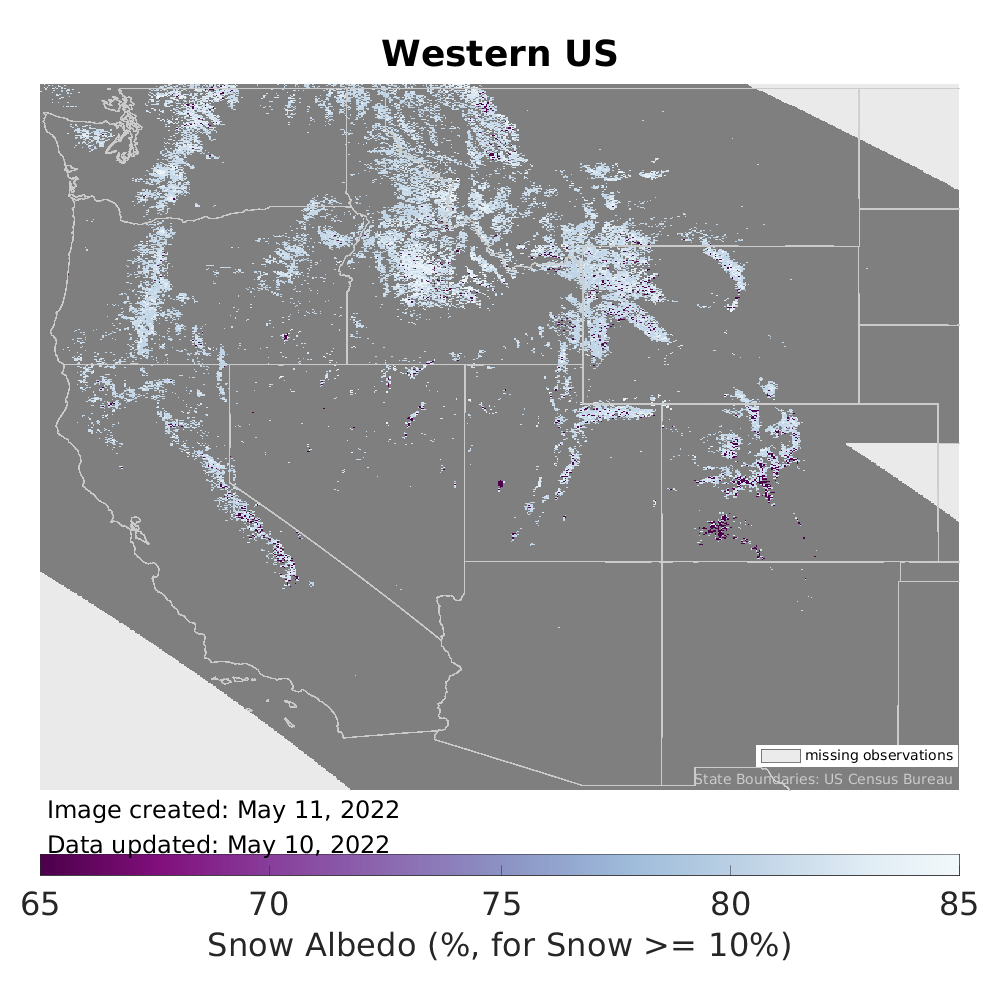
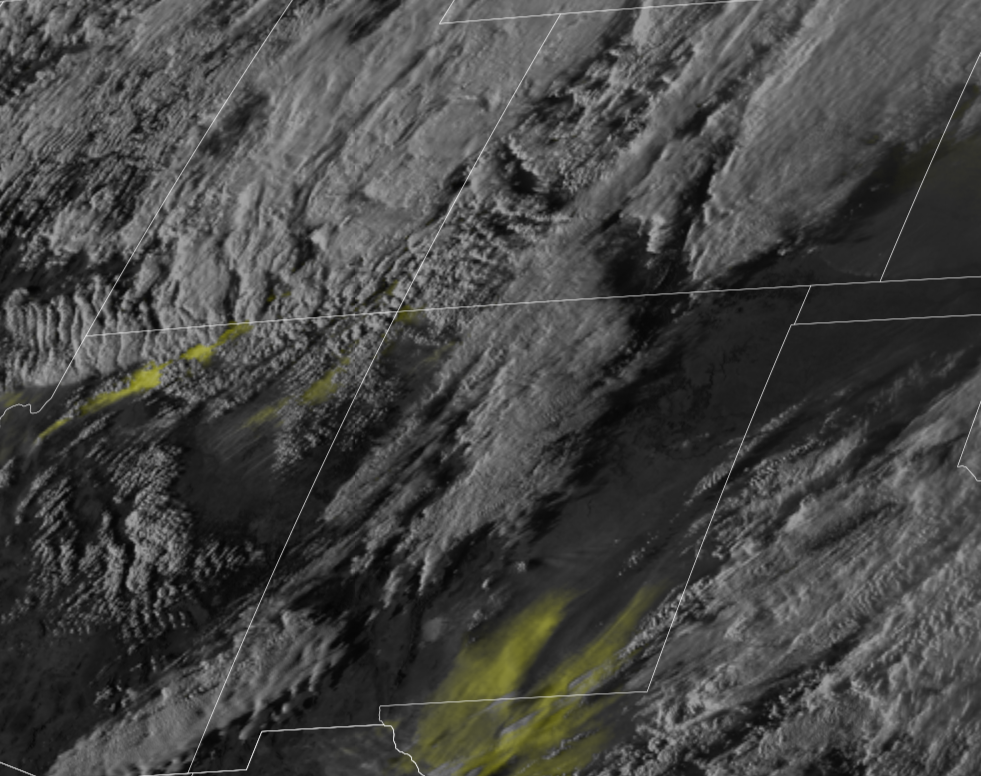
Above: Satellite images showing the initiation of dust mobilization for the May 8 dust event and then the dispersion of dust across Colorado. The third image shows a photo of dust-on-snow taken by Adam Pate in the Rio Grande on April 18 with Big Meadows and Metroz Lake circled. The next slide shows modeled albedo from NSIDC, showing the stark difference between northern and southern Colorado. The last image shows another dust-on-snow event on February 21.
Above: Variance of combined March, April, and May precipitation for the SNOTEL stations adjacent to or near CODOS monitoring sites. This bar graph illustrates one reason why streamflows turned out the way they did. The 6 bars to the right are in the San Juan Mountains, on average, 54% decline in normal precipitation during March/April/May. The Central and Northern Colorado fared better, improving northward.

Above/Below: Our Putney wind monitoring station observed record high winds this spring. This was the case pretty much statewide. This is another large factor explaining the rapid snow ablation.


Below: Considering the severe dust-on-snow, warm/dry air masses pushed around by record high winds, and lack of spring precipitation, it is of little wonder why the snowpack did not stand a chance this year. The combination of these variables mean rapid ablation of the snow, ablation via melt and ablation via sublimation. Colorado lost a lot of snow directly to the atmosphere, it is hard to quantify but the below map for one day in spring provides a good example. Please see ablation maps on the National Operational Hydrologic Remote Sensing Center website.

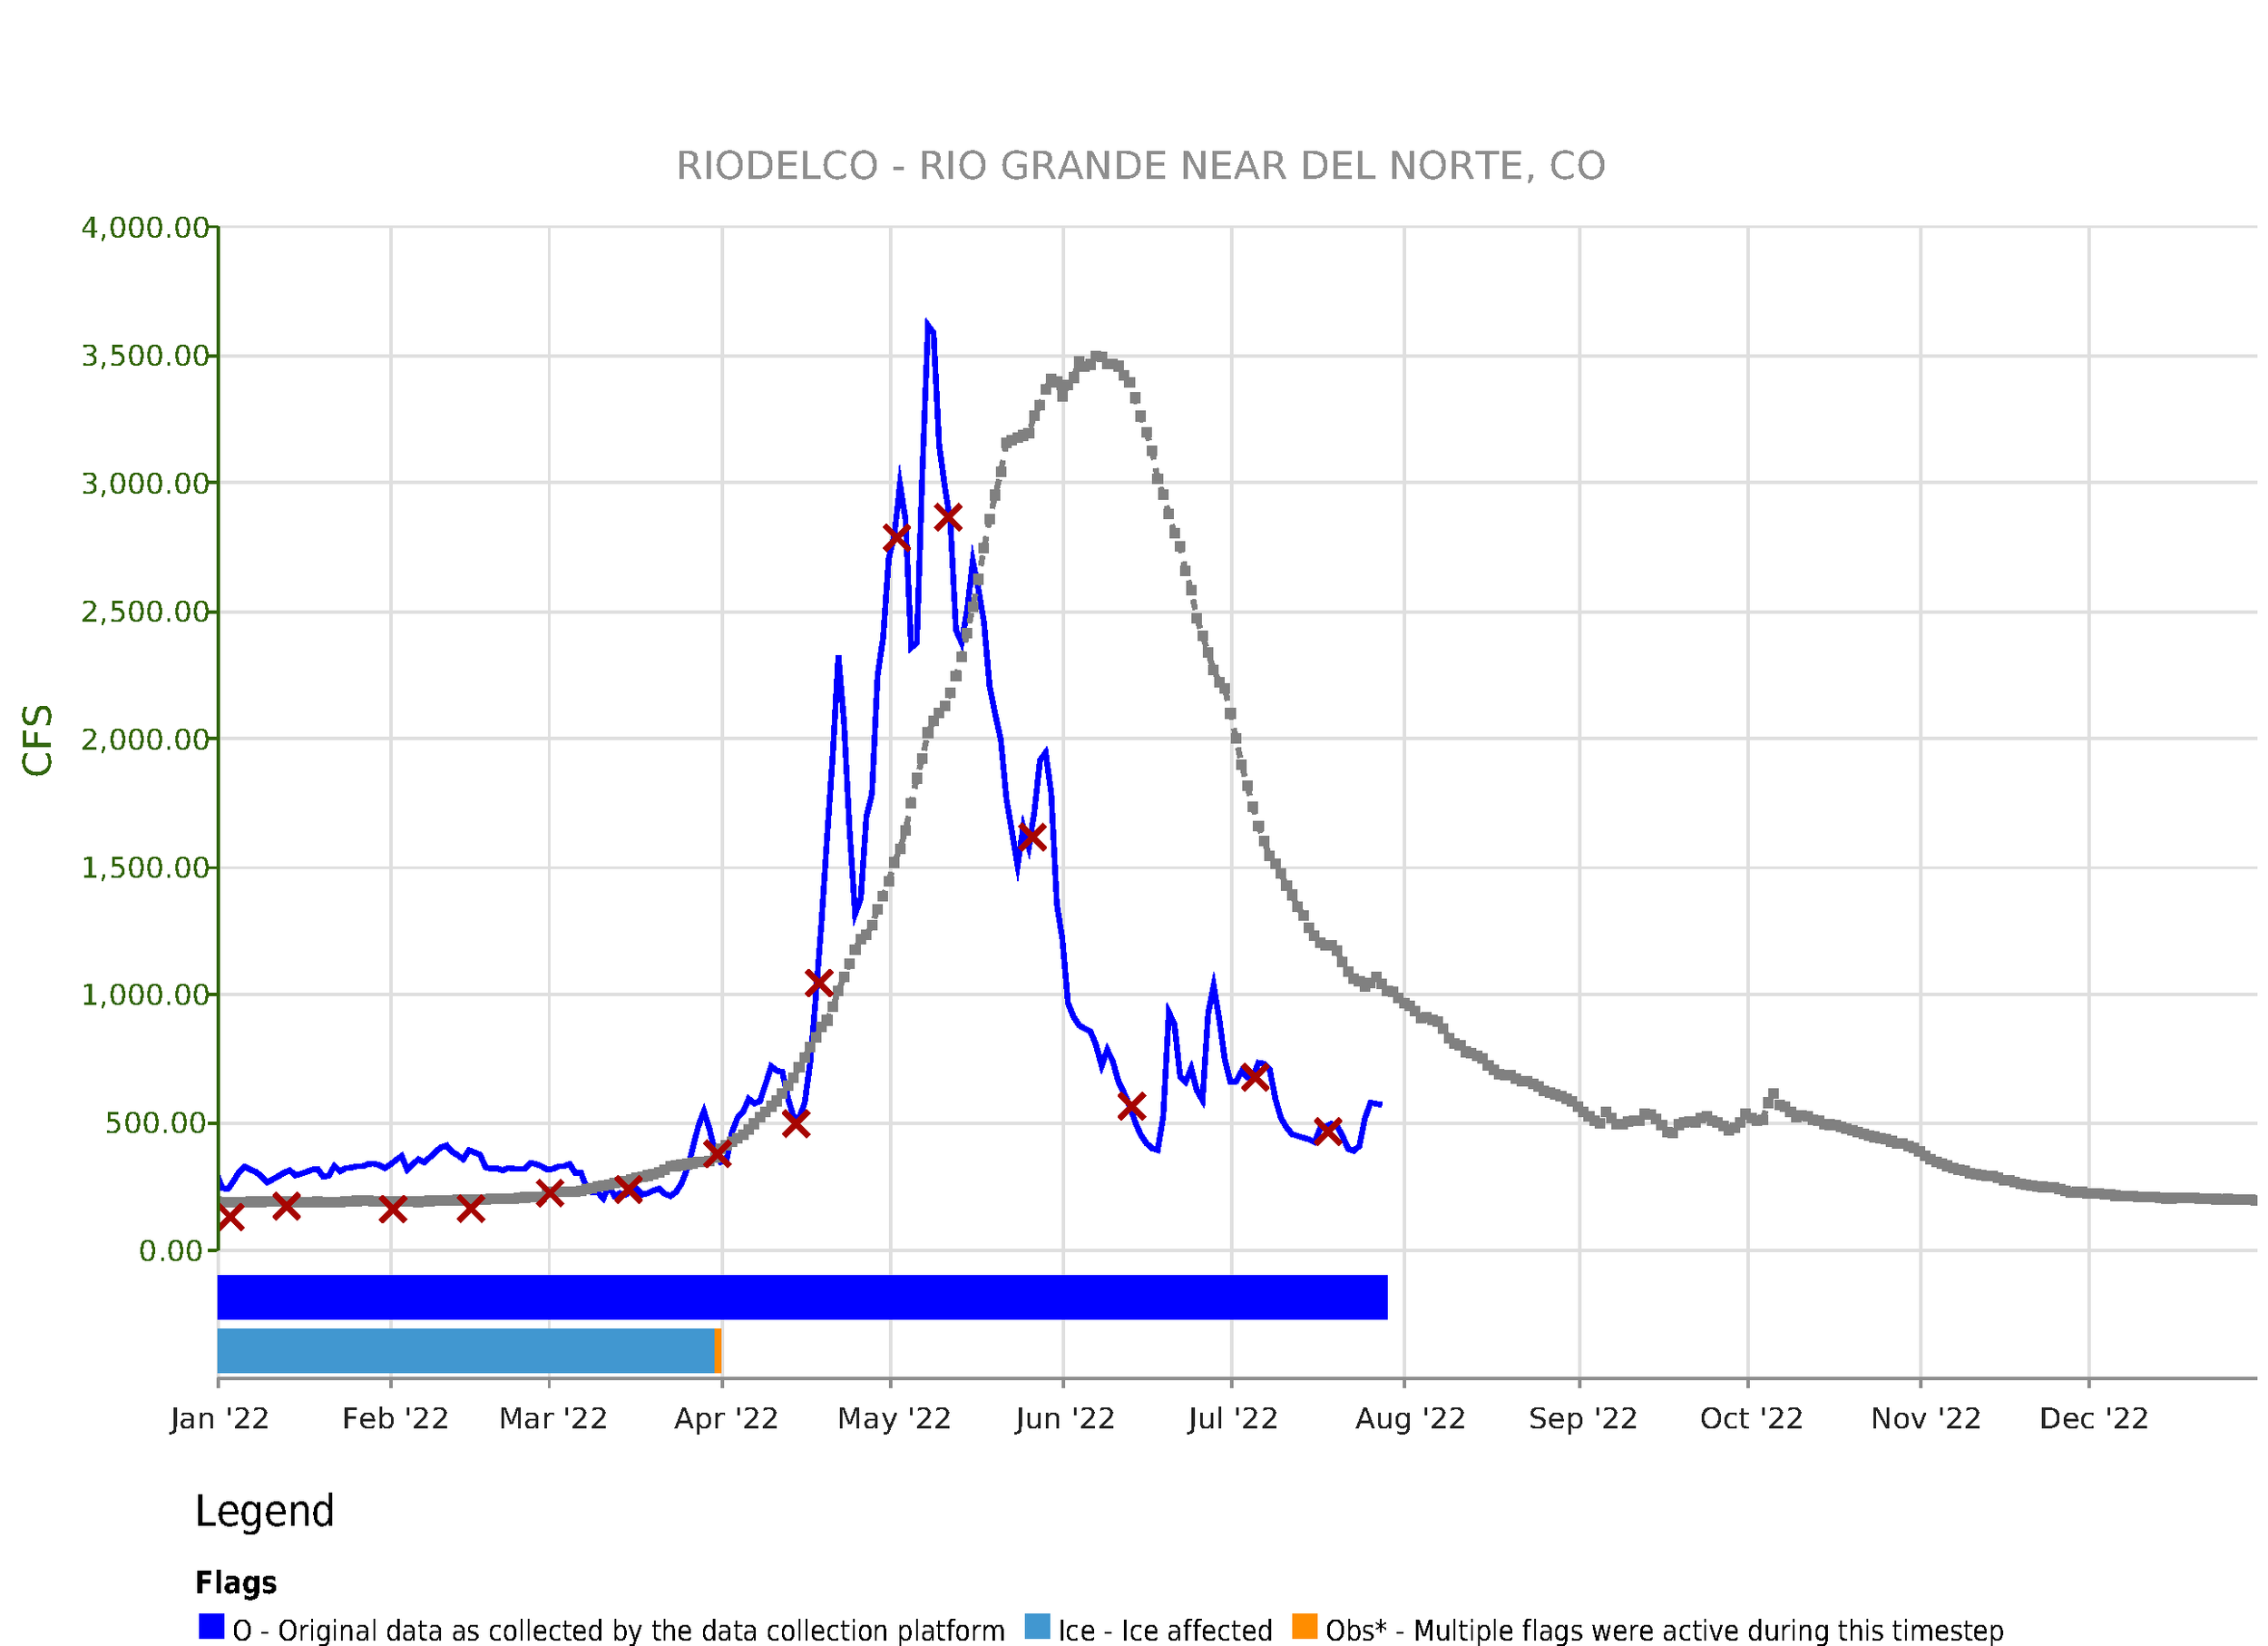
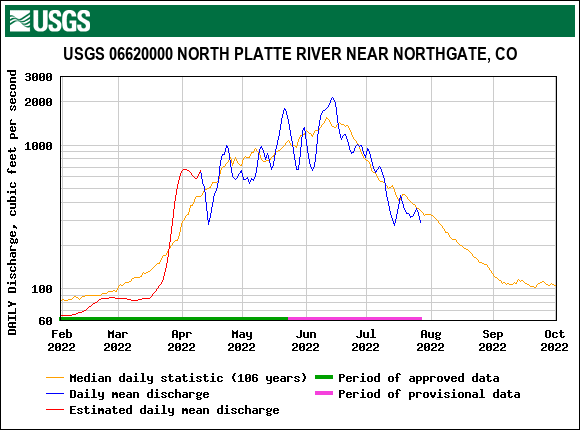
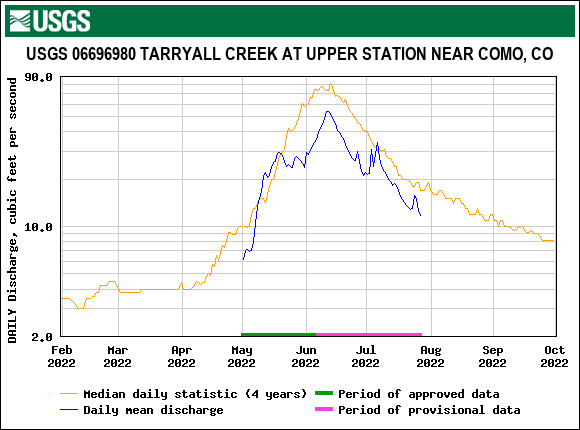
RUNOFF BEHAVIOR
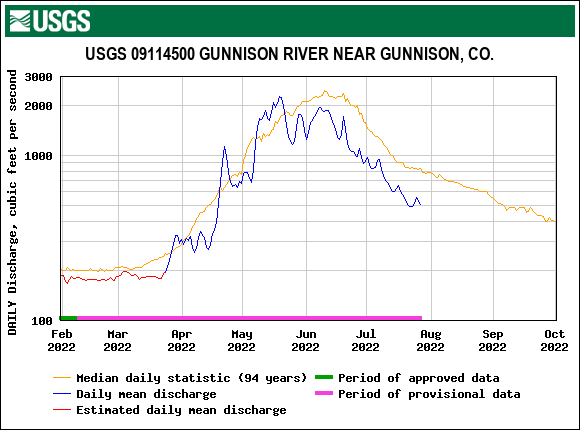
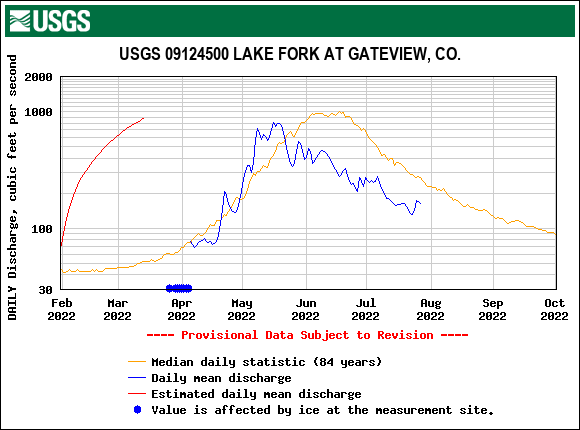
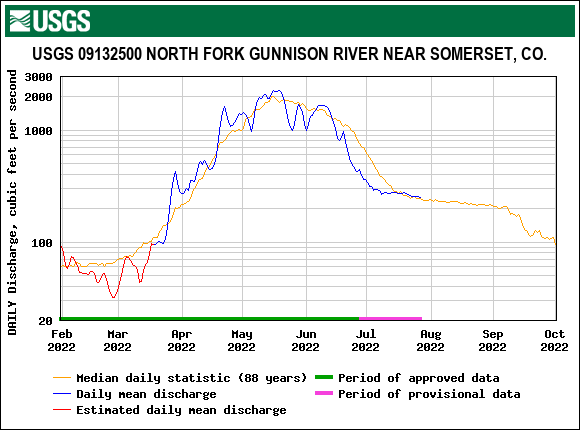
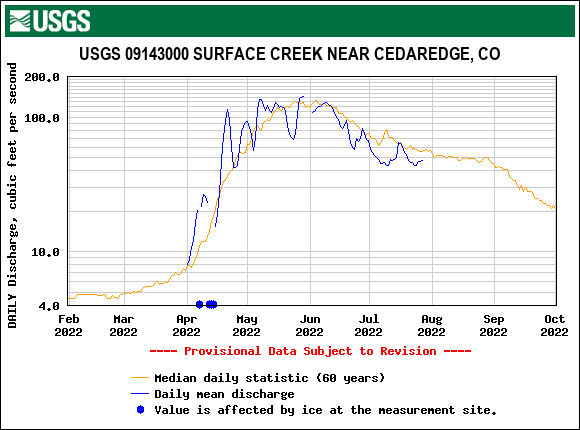
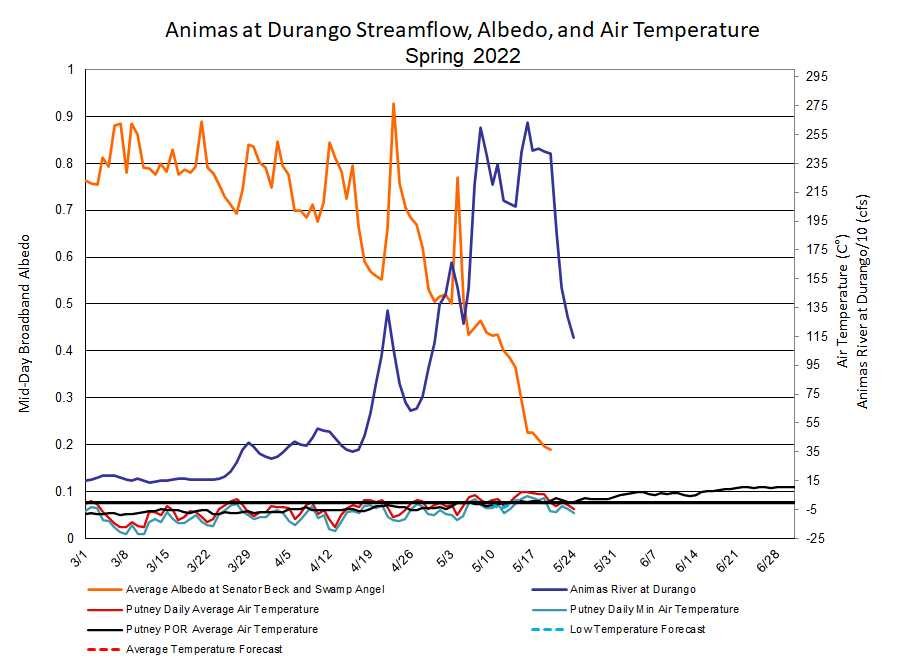
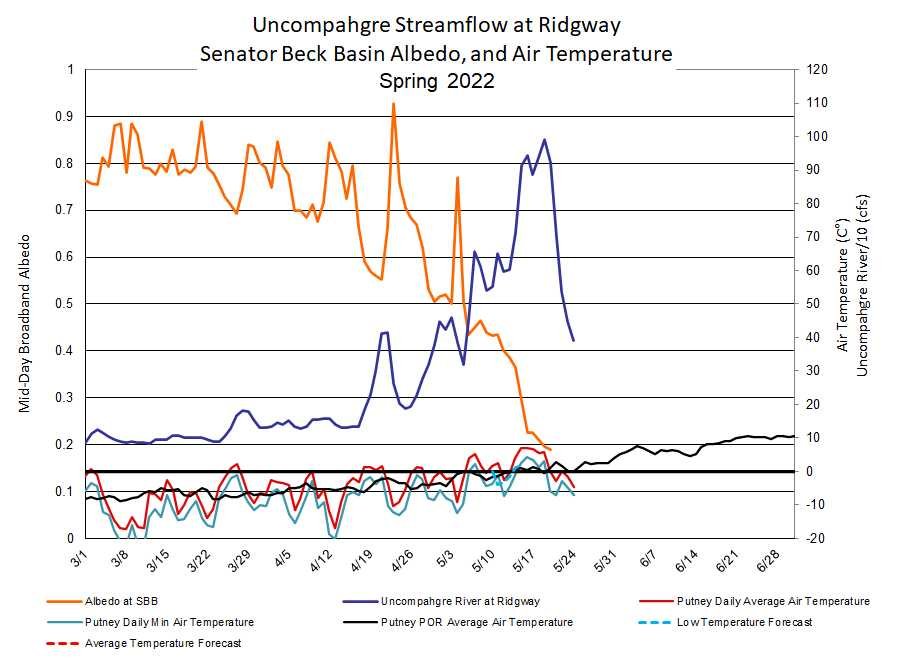
So goes the snowpack, so goes streamflow. With early onset of melt and rapid snowmelt rates many streams peaked upwards to one month earlier than normal. Due to the dust-on-snow, warmer/drier/windier conditions being most severe in southern basins, it was precisely these basins that peaked the earliest and diminished the quickest. In the Gunnison Basin it was a mixed bag where some sub-basins peaked very close to a normal manner while others resembled their southern neighbors. Colorado mainstem and northern basins streams largely experienced some sort of early peak, but their “main” peak was mainly in the normal timeframe and amount.
Rapid ablation not only meant early streamflow peaks but also depleted streamflow volumes due to loss of water directly to the atmosphere (i.e. evaporation/sublimation), and also due to early vegetation exposure kicking in transportation rates earlier in season. To add to the losses, the first bucket to fill is soil moisture and the usual large fraction of snowmelt we have seen the last number of years was consumed by thirsty soils. On a large scale it is hard to measure just how much snowmelt is lost to these factors.
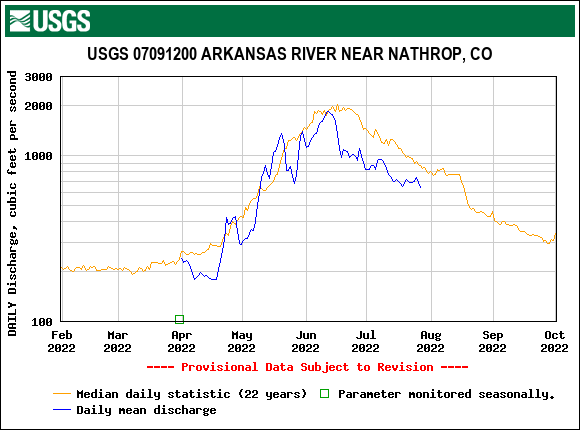
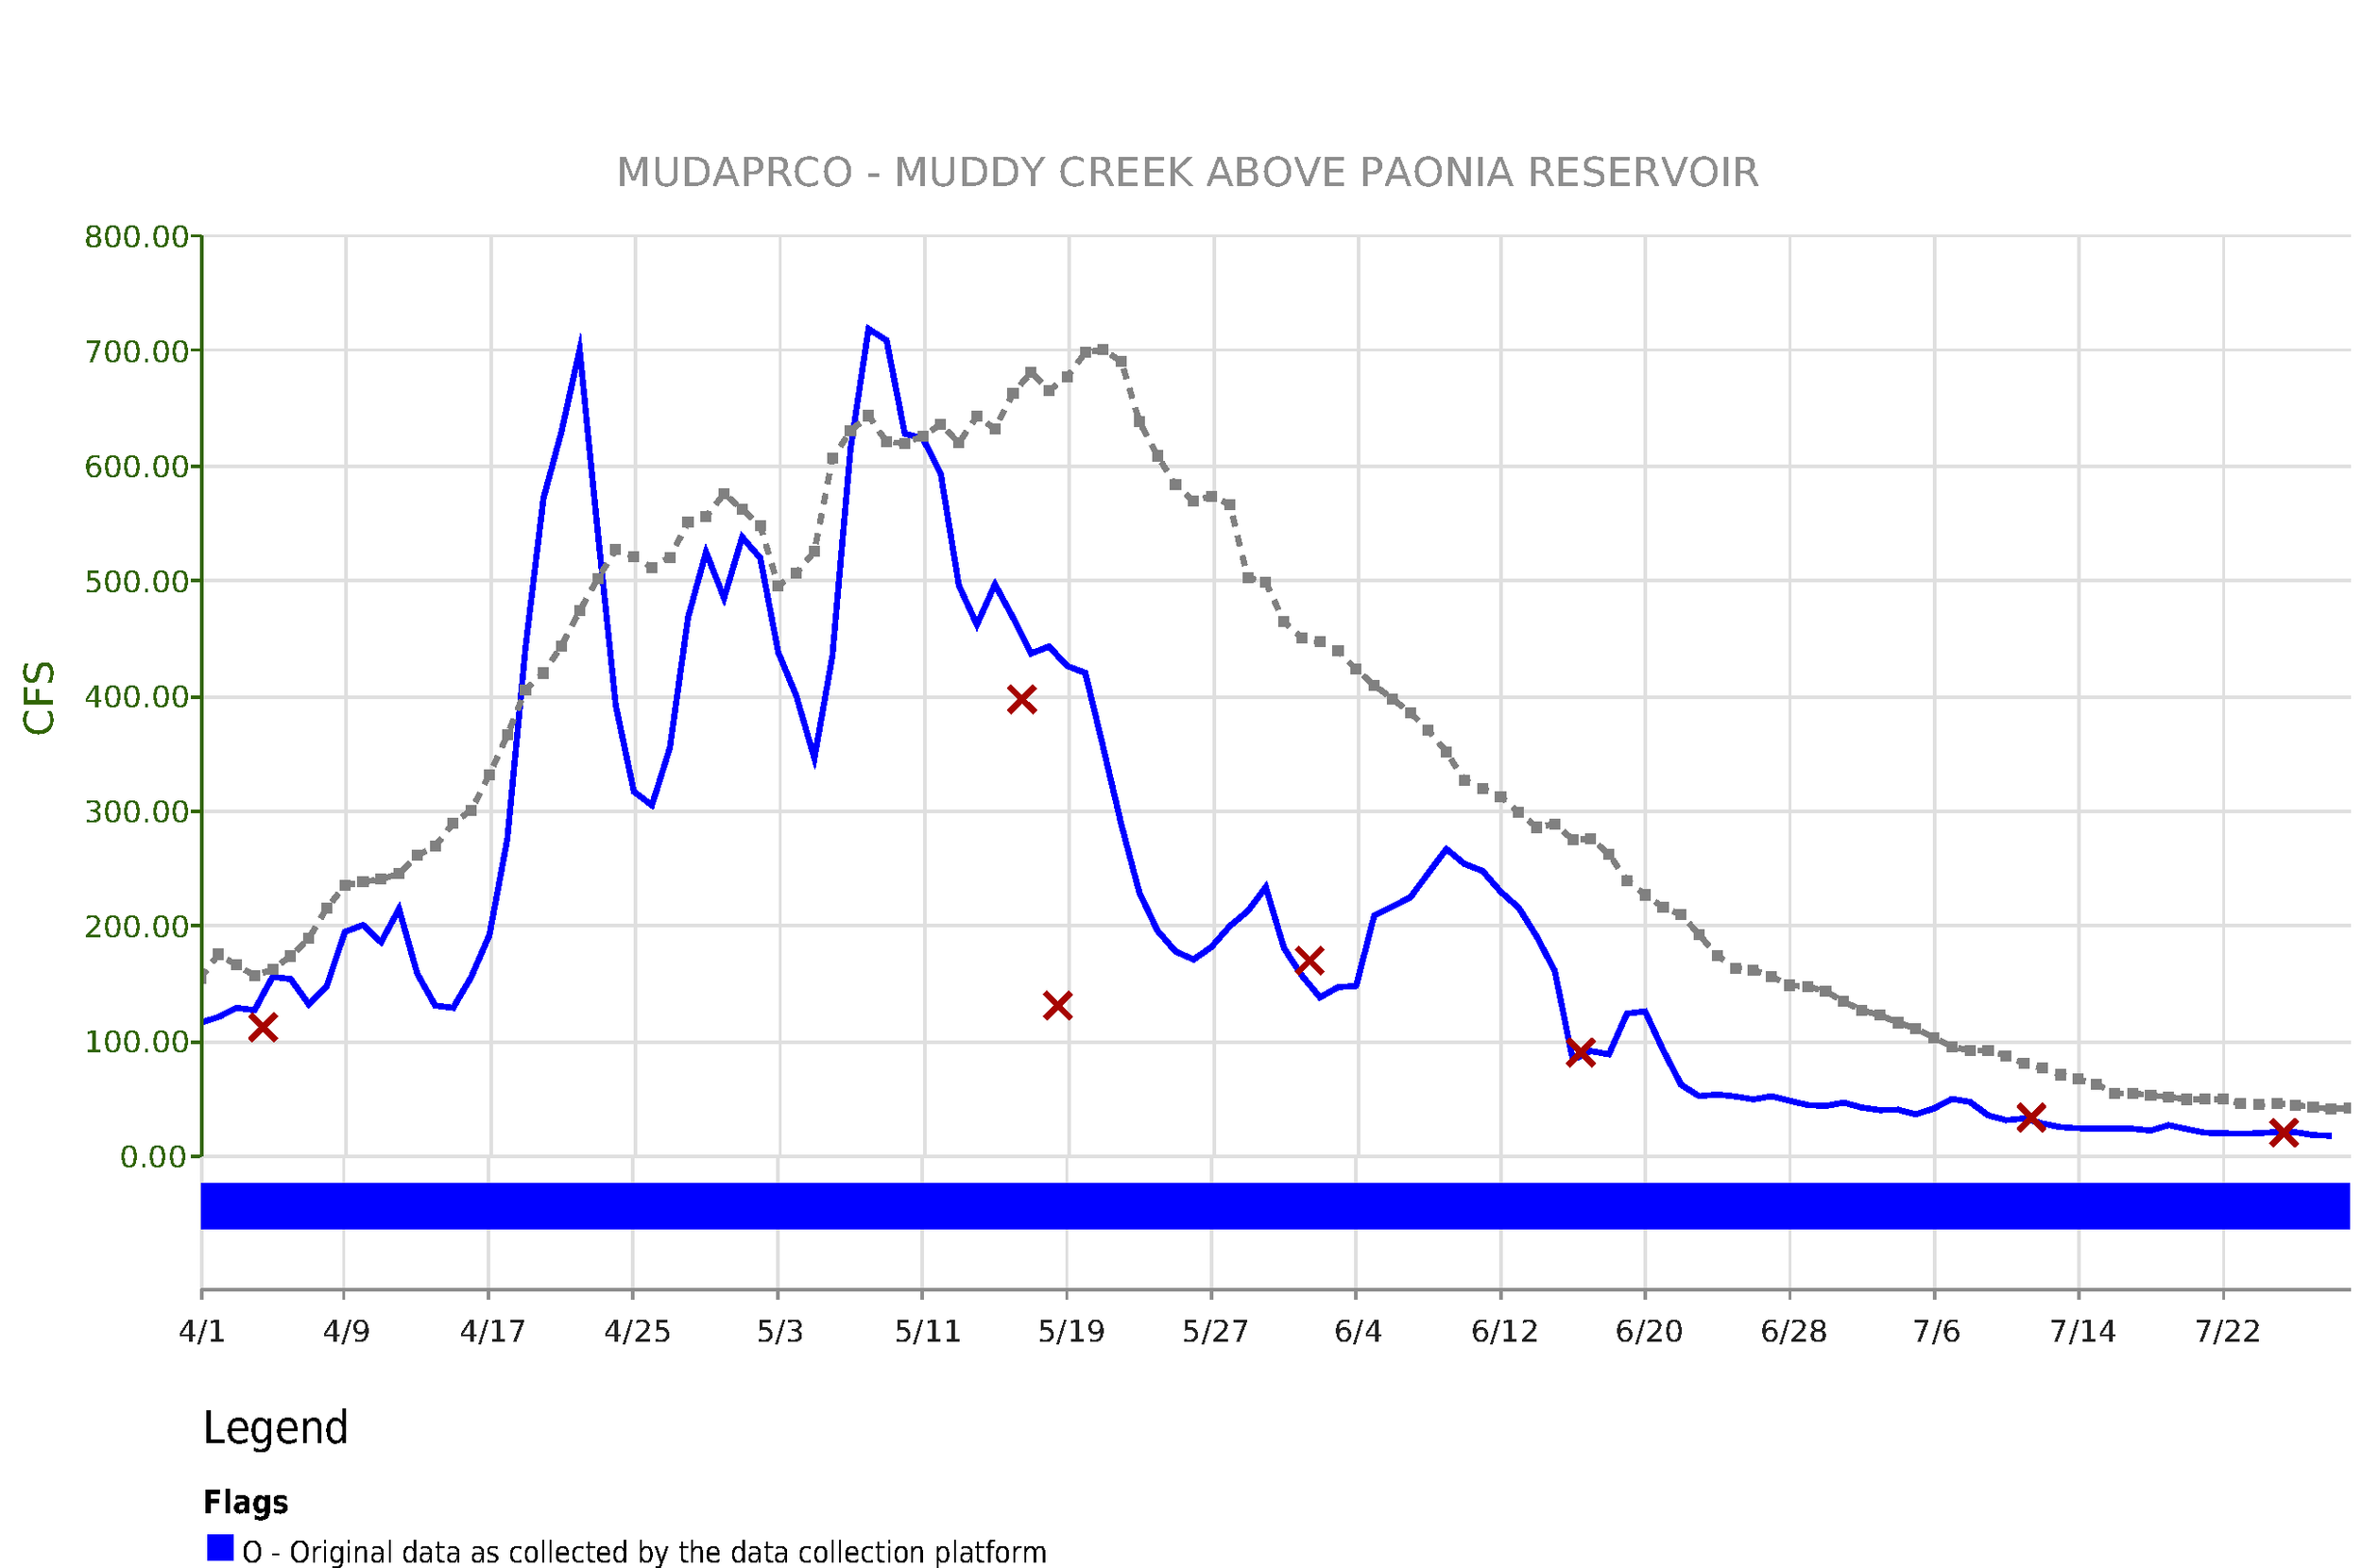
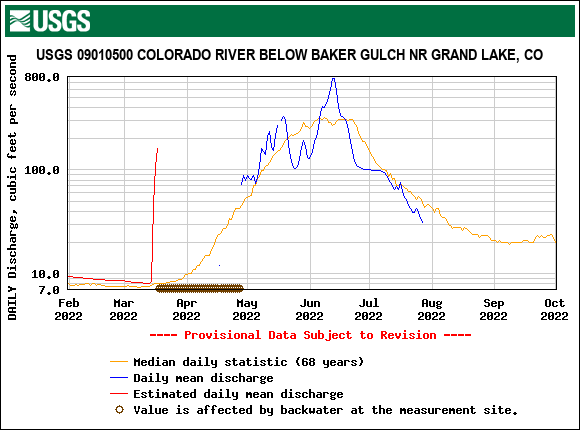
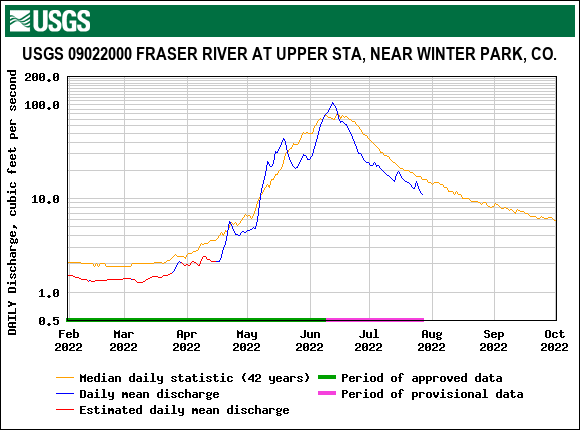
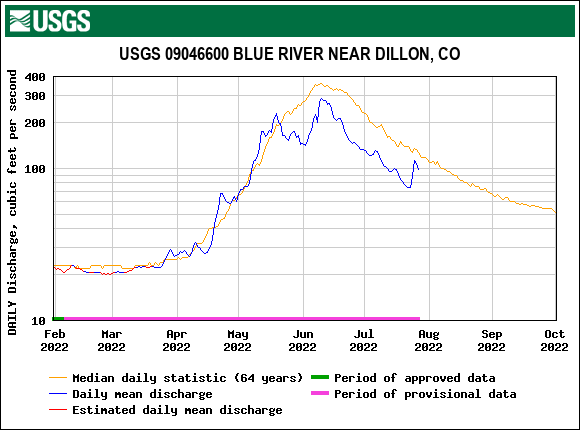
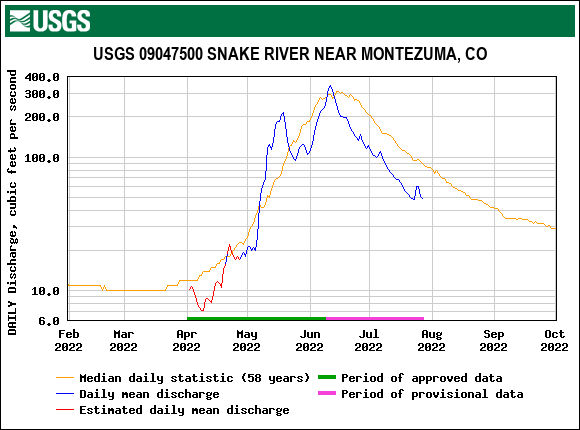
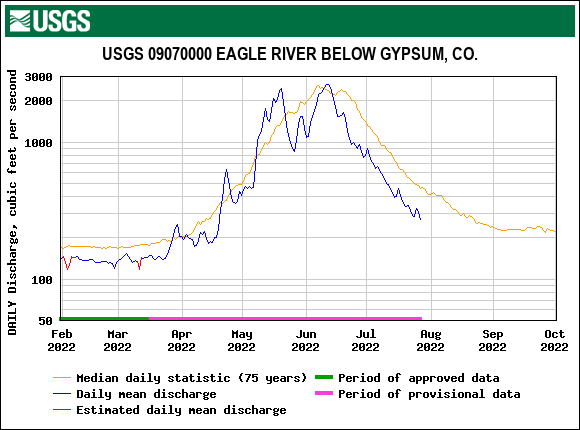
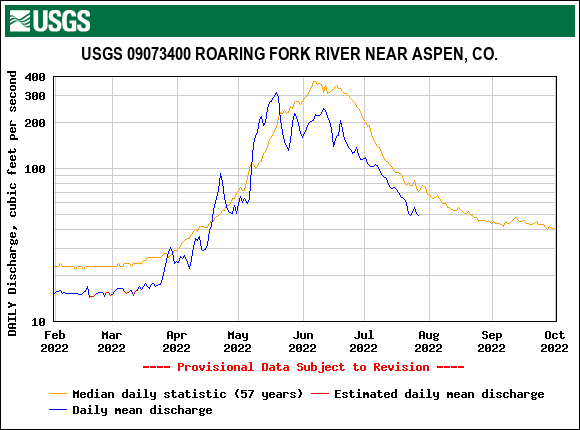
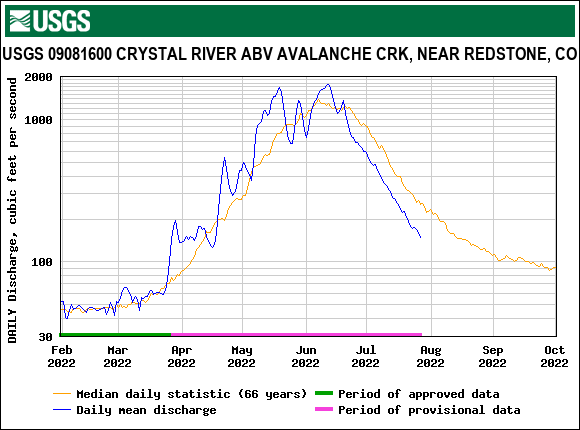
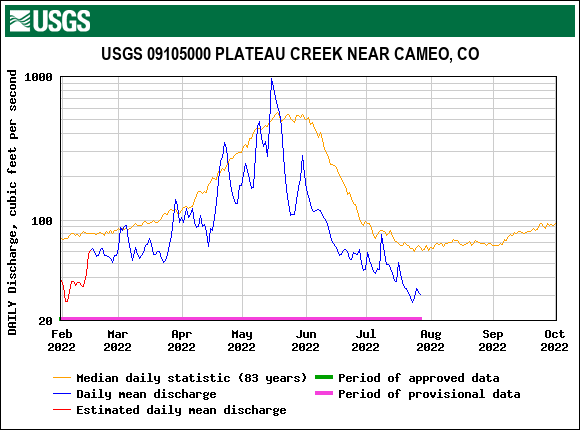
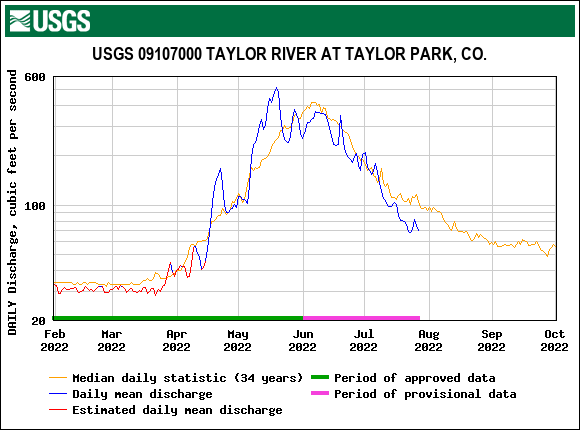
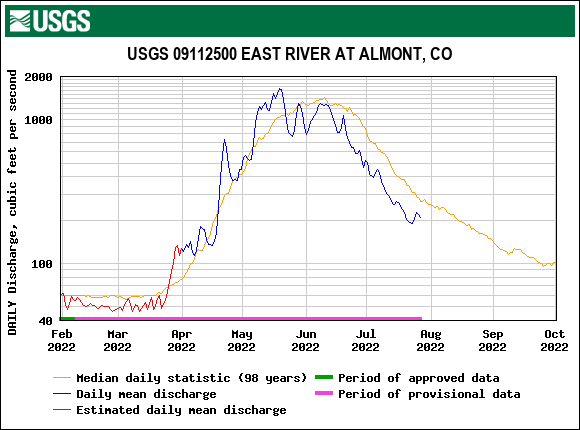
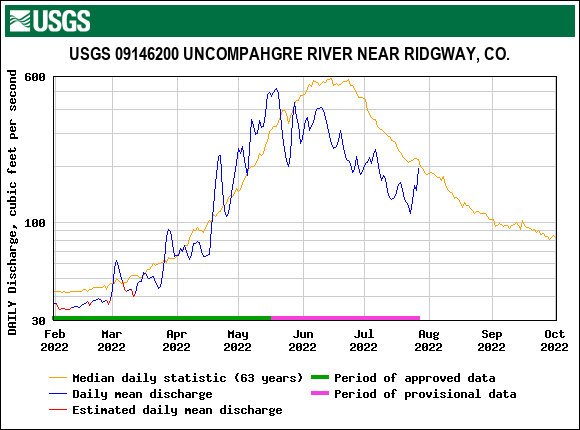
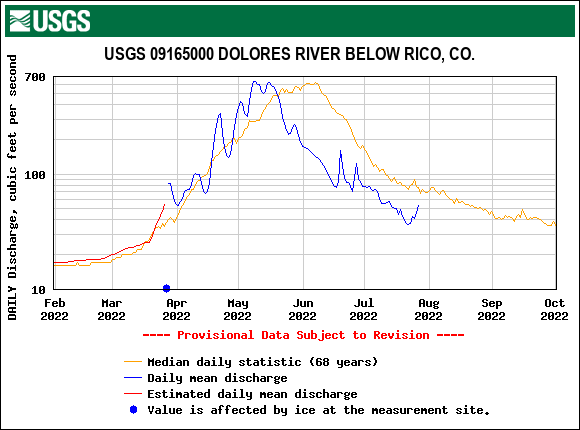
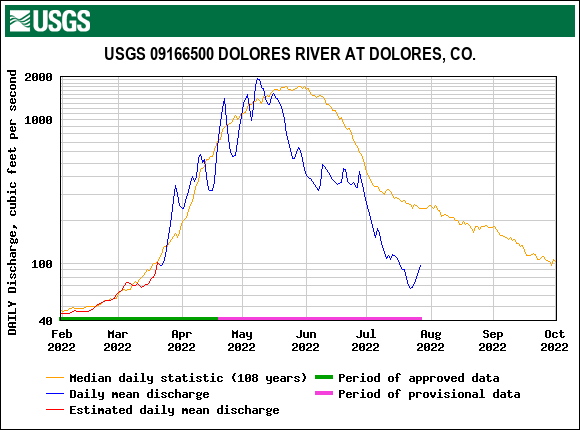
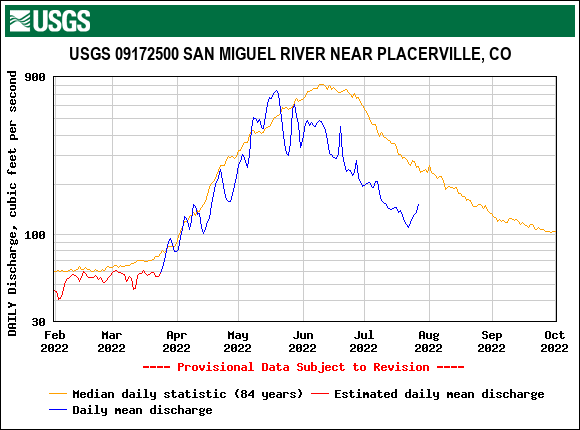
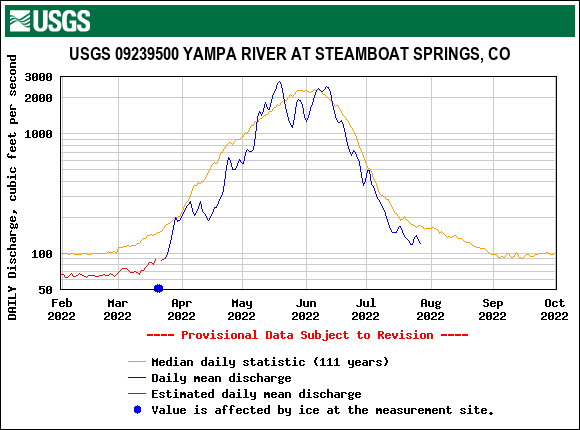
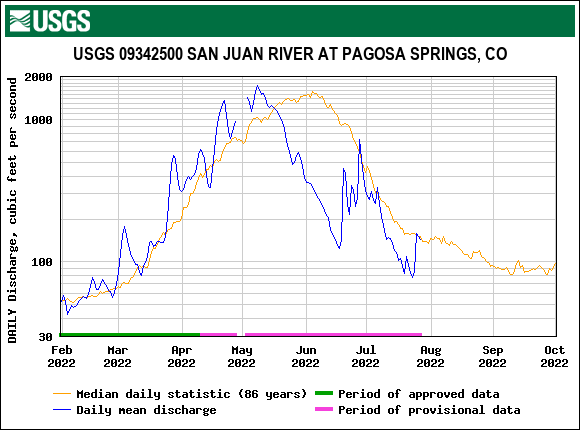
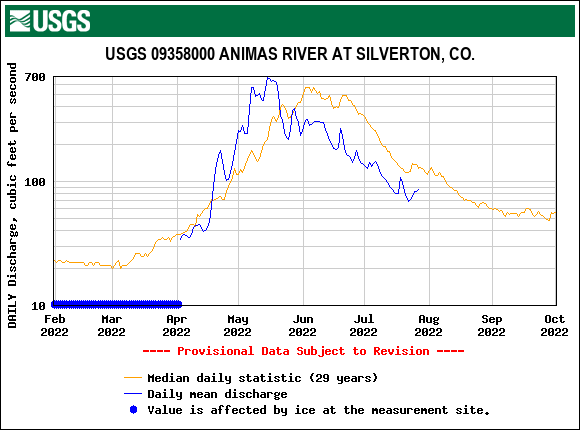
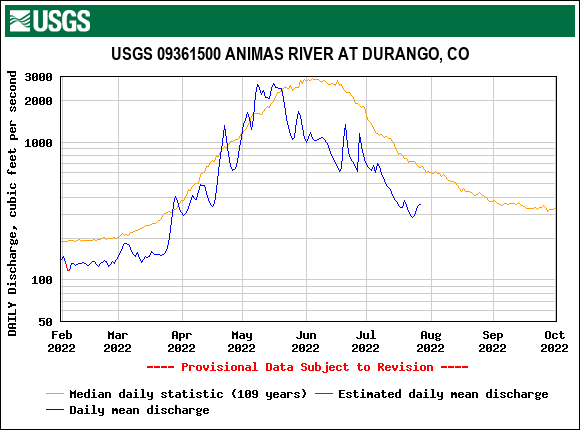
Early streamflow peak means less water available later in summer. As of this writing, even with the bountiful monsoons every hydrograph in the below slideshow show below median streamflow. It varies, with more diminished flows towards the south, but all streams are feeling the effects of how the spring played out along with the larger, overlapping effect of climate change.
Under the current most probable forecast, the total water year 2022 unregulated inflow to Lake Powell is projected to be 5.74 maf (60 percent of average). Colorado rivers and our water supply is crisis. We are in uncharted territory. If you are new to Colorado River issues and want to learn the basics in an entertaining format, watch this piece by John Oliver (warning explicit language).
Above: Peak discharge at Senator Beck stream was May 16, reflecting ~11,000’ elevation melt, and May 18 for the high elevation, above 12,000’ melt. About 19 days earlier than normal. Streams in the region saw a large melt surge around May 11 that for some constituted the actual peak.

Above: Correlation of snow-all-gone at SASP and peak Q at Senator Beck streamgauge. All the severe dust years in red show SAG and peak discharge before June 1. Low dust years are shown in blue and average in green. The two years in green at lower left make sense as this was 2012 and 2018, two notorious low snow years (and dust severity was “upper-end-of average” for 2018).
Below: There is less correlation of peak Q with SAG at Senator Beck Study Plot (12,200’) compared to SASP but still very informative.


Below: Stream forecast issued on June 1. Low for the entire southwest. Northern Colorado better off than southern.


Looking Ahead
Currently the monsoons are back in full force. This summer, with daily chances of precipitation, it feels like summers in the 1980’s when daily monsoon activity was the norm. It is going a long way to replenish soil moisture and a modest boost to streamflow (with increased flash flood potential), but unlikely to significantly alleviate the extreme drought that has has a grip across the Southwest U.S.
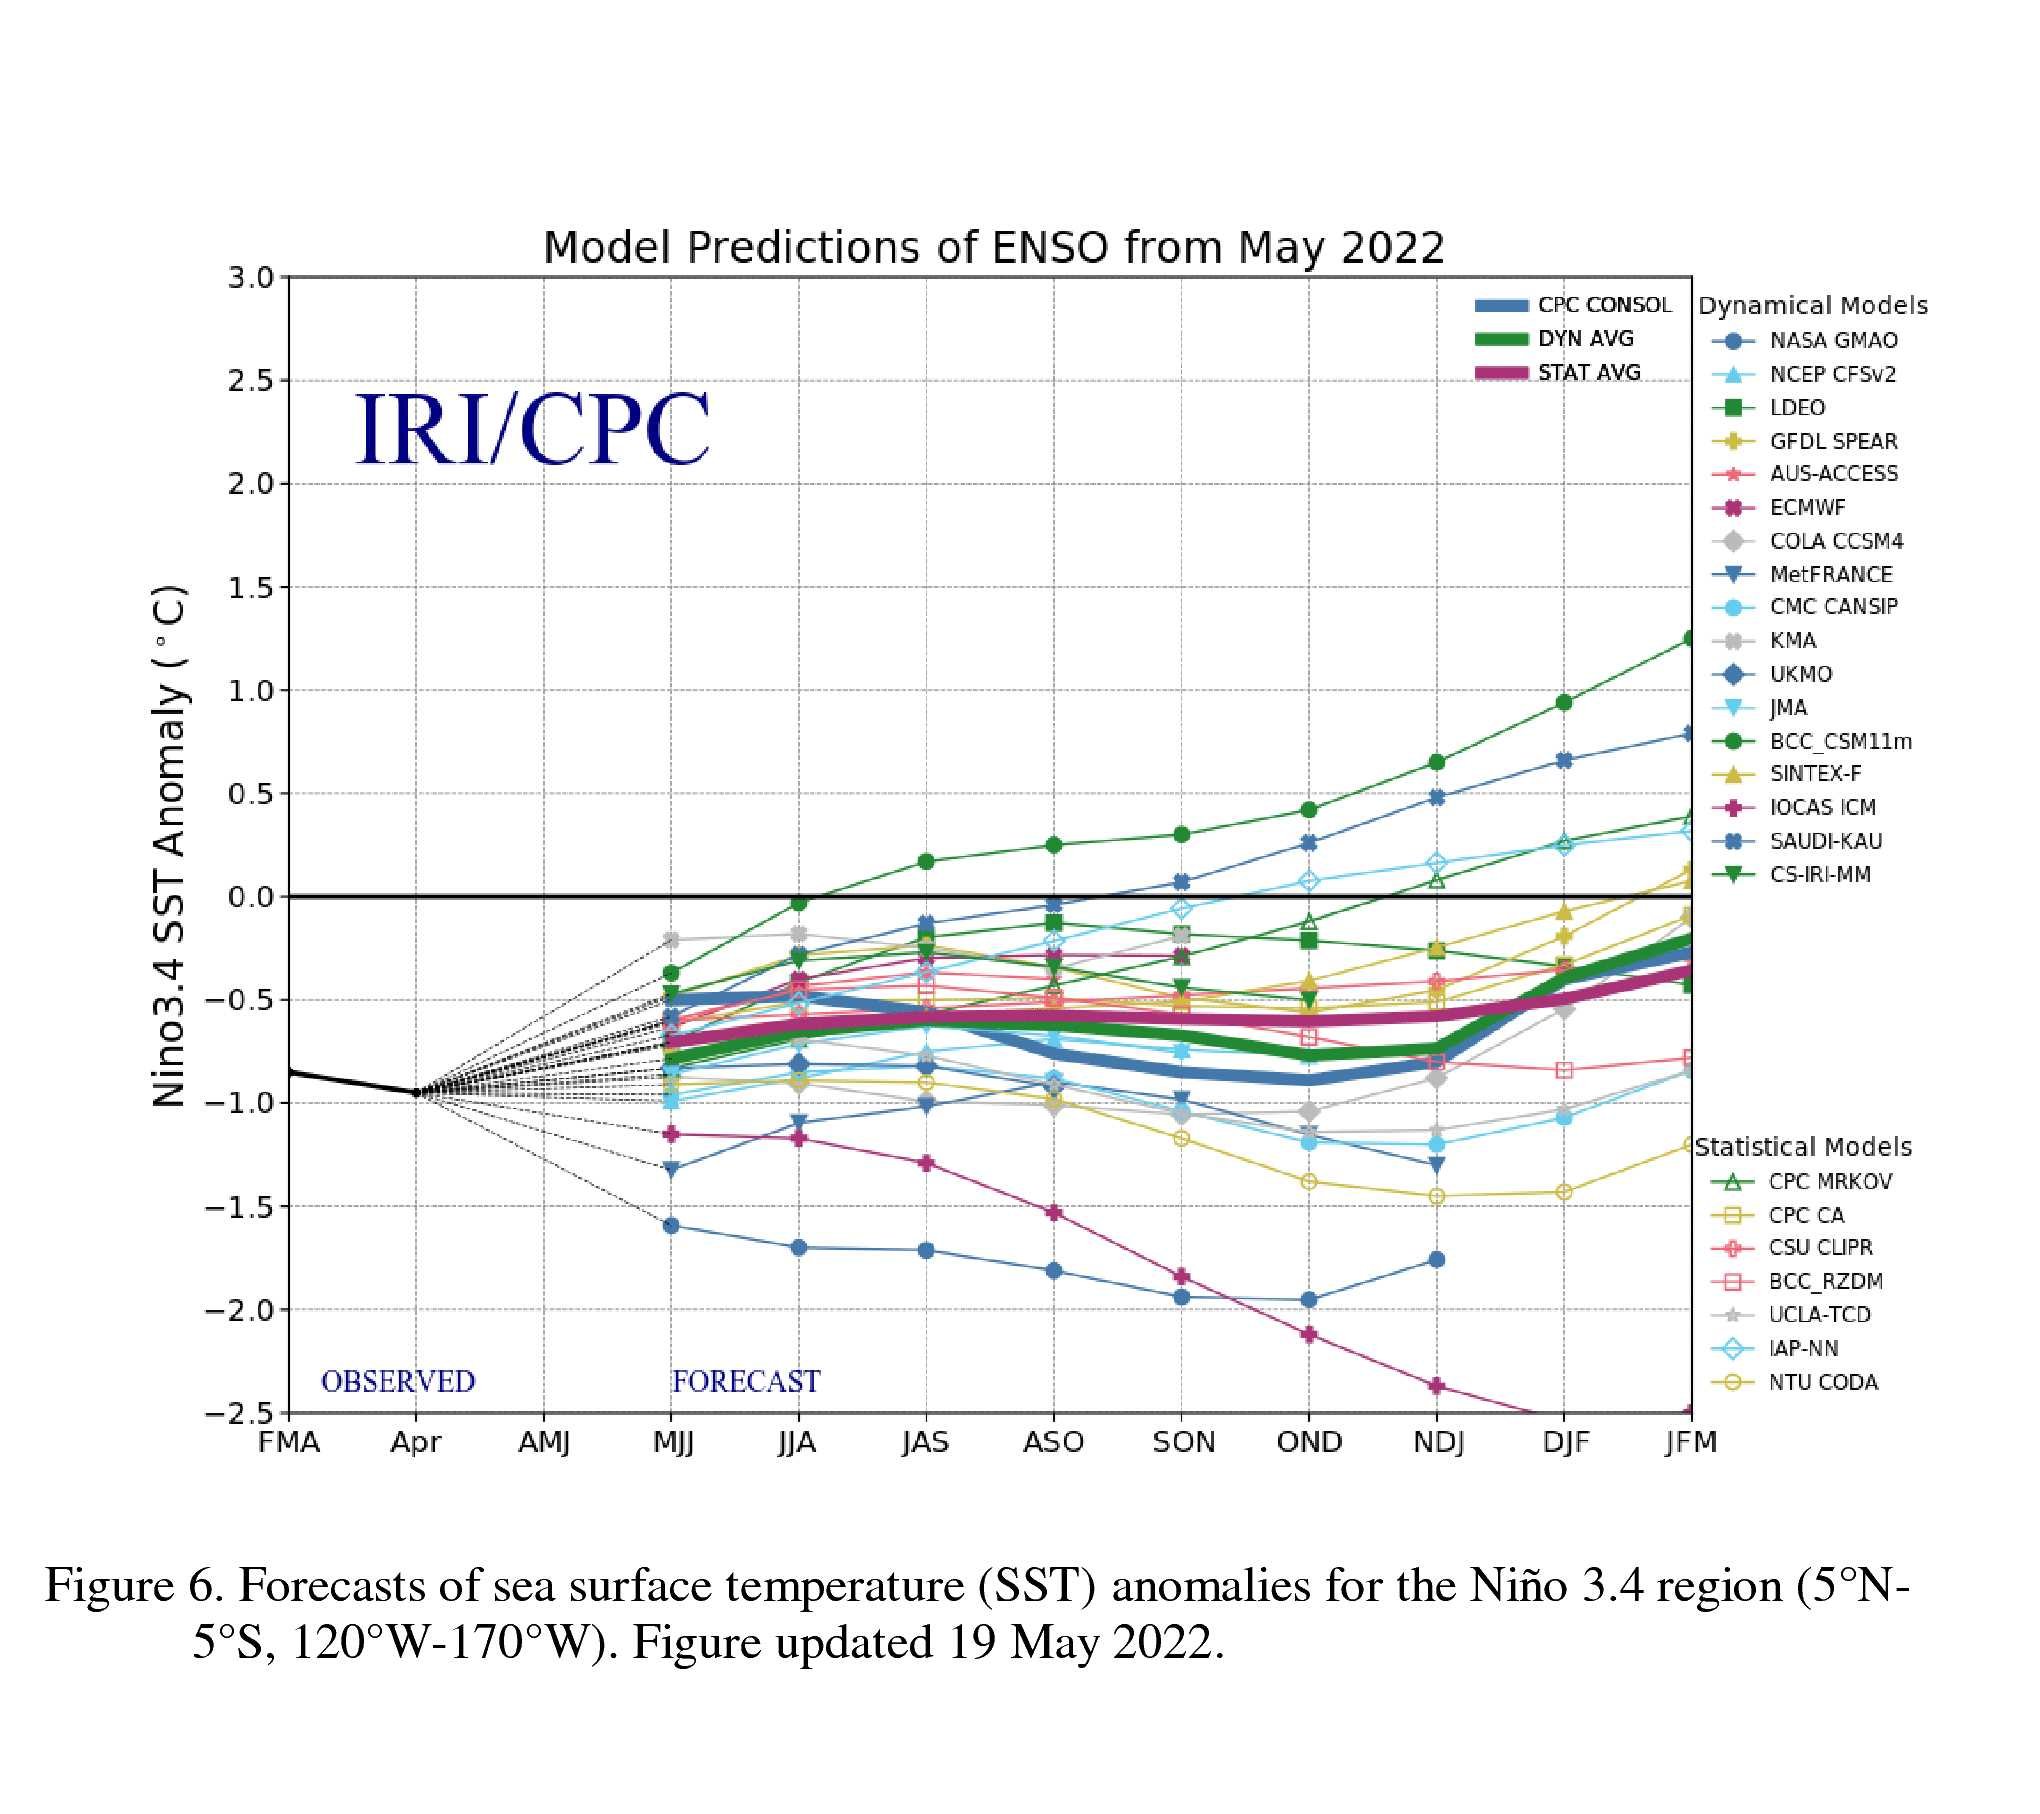
El Niño Southern Oscilation (ENSO) is a periodic fluctuation in sea surface temperature and the air pressure of the overlying atmosphere across the equatorial Pacific Ocean. NOAA reports, “California and the Southwestern U.S. have been very warm and dry over the last two La Niña winter seasons. These past two winters have accelerated the decline in water levels across the region, including Lakes Mead and Powell. And more trouble is on the horizon. NOAA's Climate Prediction Center expects La Niña to continue through the summer and into the fall and early winter. There’s about a 60% chance of La Niña through the summer, ticking up a bit to 62-66% by October–December 2022.” Read more here. With Colorado sitting in the transition zone, La Niña can generally mean wetter and cooler towards Northern Colorado and dryer and warmer towards Southern Colorado.
Current long-term outlooks (below) are suggesting the remaining summer and fall will be warmer than average (surprise) with a decreased chance of precipitation in the long-term but equal chance for the next few weeks.