Greetings from Silverton,
Colorado Dust-on-Snow and Snowpack Conditions
The CSAS team conducted a portion of the April CODOS tour on April 11. Sites visited were the Front Range locations, Hoosier, Grizzly (Loveland Pass), Berthoud, and Willow Creek Pass. With a significant winter storm in the forecast from April 12-14, along with accompanying dust storm warnings in the source region of the desert southwest, we opted to sample remaining sites after this system – very likely to deposit dust – had passed through Colorado. It is fortunate we postponed our trip, a severe dust storm (dust event D5) occurred late afternoon on April 12, immediately followed by snow accumulation of ~9” at Swamp Angel and various amounts throughout Colorado. Due to the spatial extent and severity of D5 the dust observations we collected on April 11 at Hoosier, Grizzly, Berthoud, and Willow Creek is now rendered obsolete; therefore, we are planning on resampling these sites on April 19. Immediately following revisiting these sites we will modify this April CODOS report to include those observations.
We have been holding our breath this season in expectation of major dust events unfolding, waiting for the other shoe to drop, in a sense, on a dismal snowpack in the southern half of the state. The conditions have been ripe for it all winter with the southwest digging deeper into severe drought, making it more likely we would see large quantities of dust mobilization in the source region. This dust event (D5) comes right as the southern part of Colorado has likely reached peak SWE and the northern part of Colorado is very near peak SWE, leaving the dust on (or very near the surface) of the snowpack. Except for when it may be temporarily buried by more snow accumulation this dust will advance snowpack warming, increase melt rates, and enhance sublimation for the duration of spring.
DUST CONDITIONS: At SASP, the dust-on-snow logs so far this season unfold like this, 1) Dust event D1 was deposited on the basal layer of snow likely with a precipitation event arriving on December 21. Located at the very base of the snowpack D1 will have no influence on snowmelt. 2) D2 was deposited February 18-19 and is of moderate intensity. It is still ~20” beneath the surface at SASP and will definitely increase the hydrologic consequences once merged with successive dust events near the surface of the snowpack. 3) D3 was light and deposited March 25 as a dry event, without precipitation, on the surface of the snow. 4) D4 was another dry event deposited directly onto D3 from April 1-3. It is slightly stronger than D3, and the two layers combined are very evident on/in the snowpack at SASP. 5) D5 was a major dry event, arriving with high winds on April 12 and followed by ~9” of snow accumulation at SASP. D5 fell on top of D3/D4 which were mostly on the surface of the snow, combining these three dust layers, which are now just under the snow surface at Swamp Angel (4”) and will be a major control on snowmelt once exposed. As of this writing, D5 is on the surface of the snow at Wolf Creek, Spring Creek, and Park Cone. D5 is ~12” beneath the surface at Grand Mesa and Rabbit Ears…….Now, let’s add D6. 6) D6 occurred yesterday (April 17, from early morning to late afternoon). As the Front Range was getting clobbered with high winds and dust originating out of the San Luis Valley, the Western Slope was also getting dust – not nearly the intensity as the Front Range – from our source region of the Desert Southwest. The morning of April 18, we found D6 is predominantly a light event near Red Mt. Pass. But D6 will increase snowmelt and advance the timing of when D3-D5 will be exposed to the surface. Once this happens D3-D6 will merge into one nasty dust layer that will intensify snowmelt and sublimation rates through the remainder of the season. And……There is currently a dust storm warning in effect until the evening of April 19 in the source region. But……a closed low is also currently making it’s way to Colorado and expected to deliver precipitation starting April 19-April 21, hopefully in the form of snow and not rain as we have seen at many areas the last couple of storms so far this April (please see weather section at bottom of report). Please see notes below of our observations from the CODOS sample sites throughout the state, describing if dust is present, it’s intensity, where it is located in the snowpack.
SNOWPACK AND STREAMFLOW: Hopefully, this year will be a good lesson on how much cumulative SWE matters; meaning, precipitation added to the snowpack after the date of peak SWE to significantly make a difference in cumulative streamflow. The classic example being the “miracle May” in WY2015 where we had a very poor winter season followed by a very wet month of May that turned our water supply outlook around. So far this spring we have had a couple good storms, April 6-8 and April 12-14, that have been the cause of sharp increases in many SNOTEL projection plots throughout most of Central/Northern Colorado, and to a much lesser (if at all) degree in the Southern part of the state. As of this writing, the North Plate and Laramie basins are of average median SWE, the South Platte, Colorado and Yampa basins are of slightly below average median SWE, and the Arkansas, Gunnison, Dolores/San Miguel/Animas/San Juan and Rio Grande are well below average median SWE. As mentioned we have a couple of storms in the forecast that will deliver more snow……….and possibly dust.
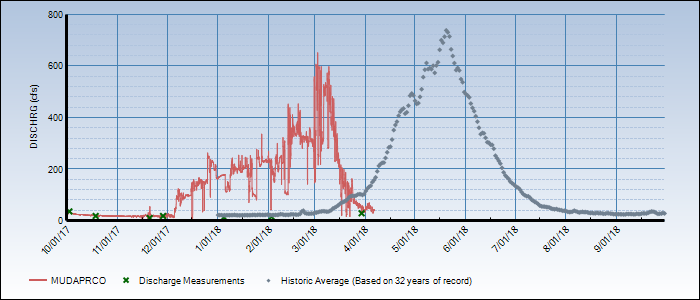
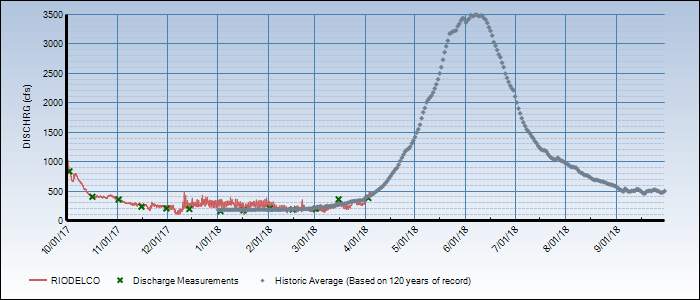
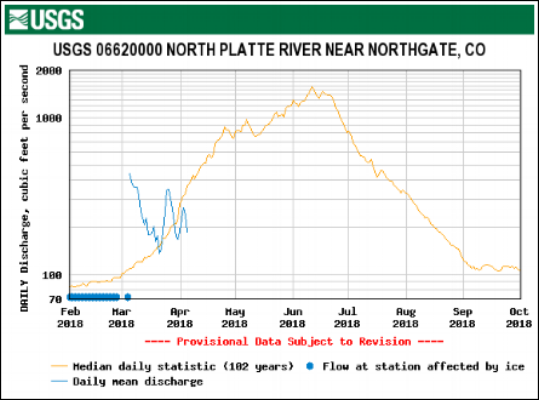
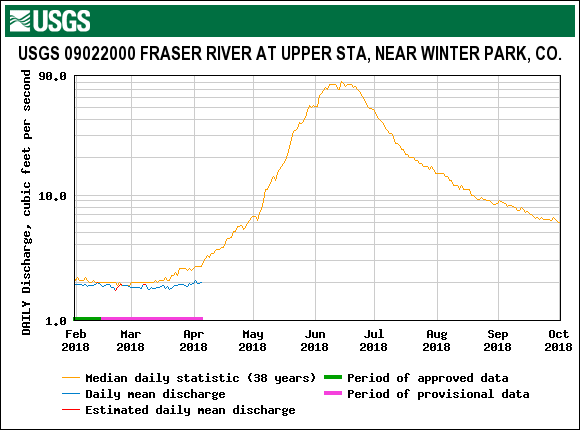
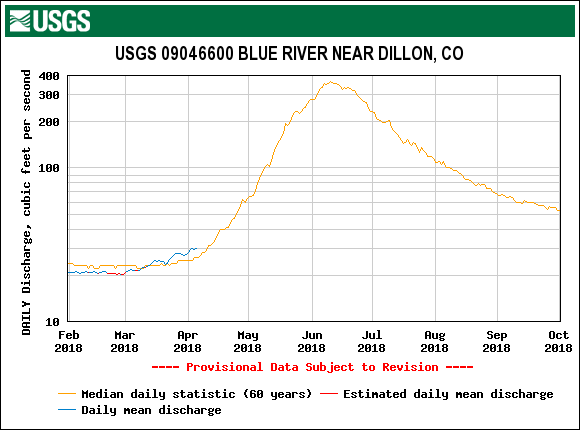
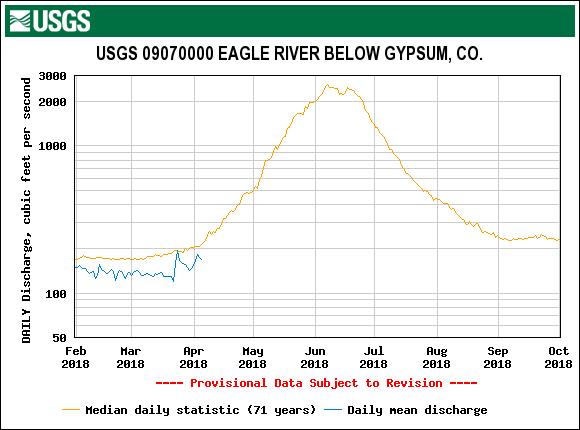
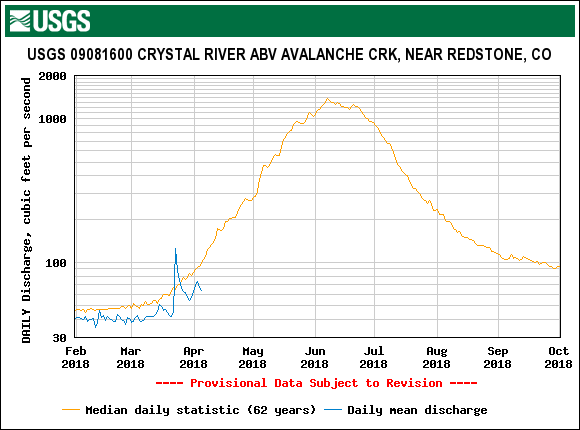
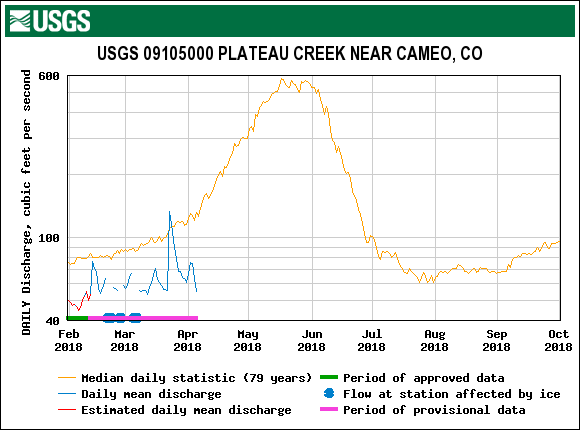
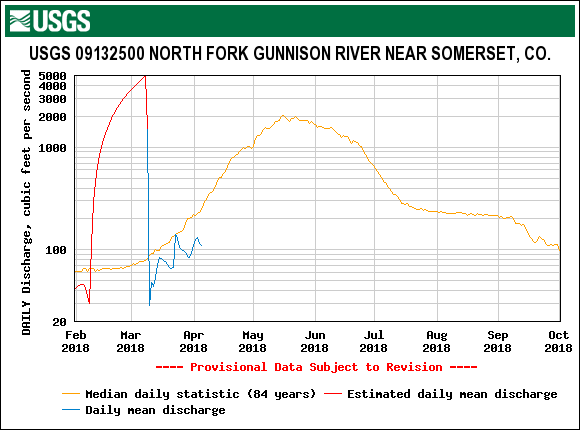
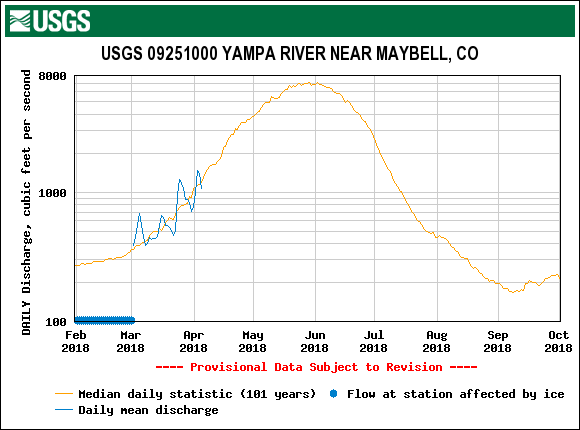
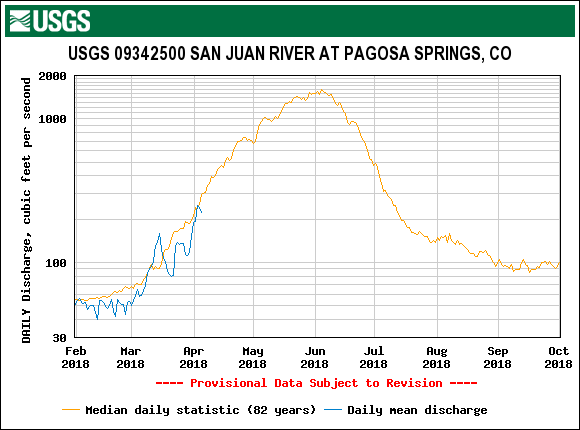
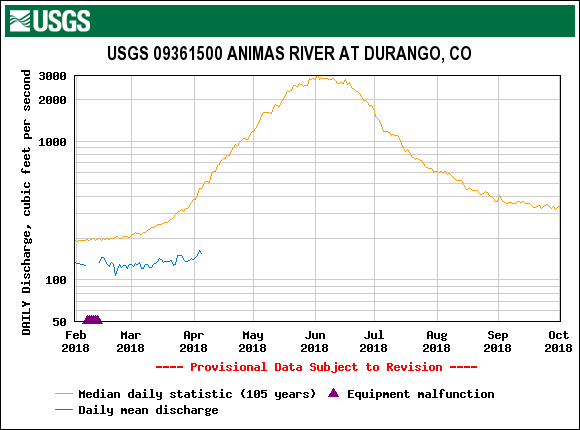
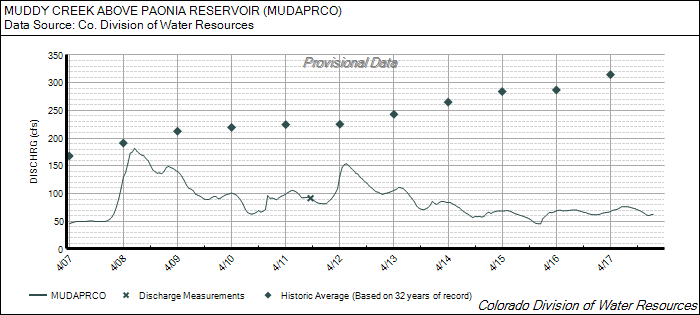
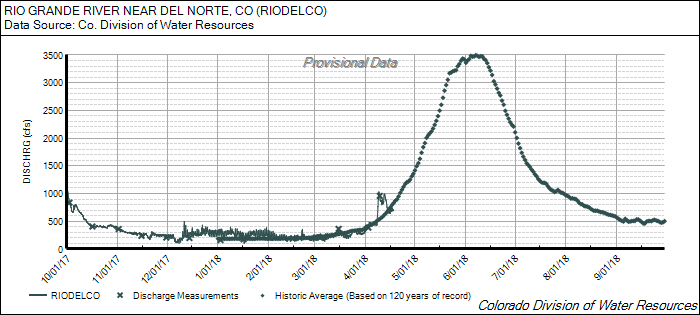
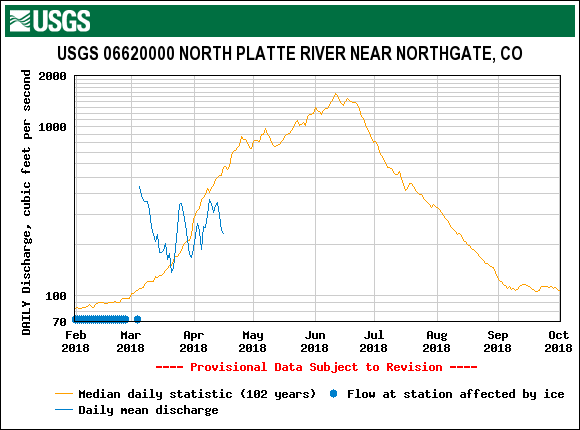
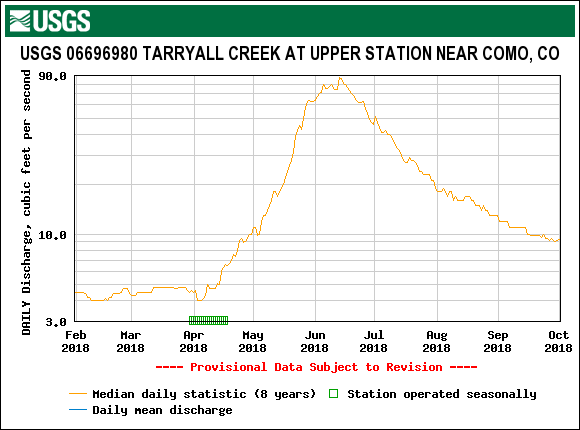
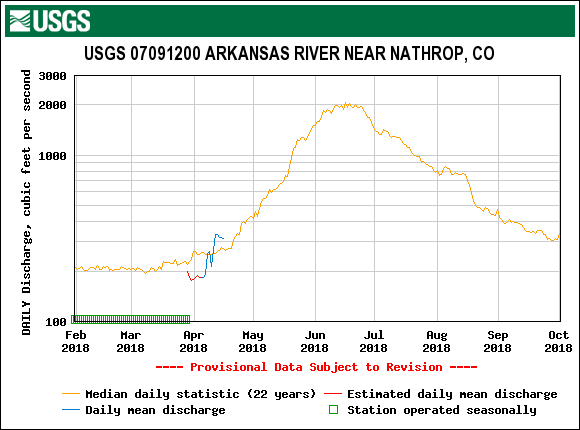
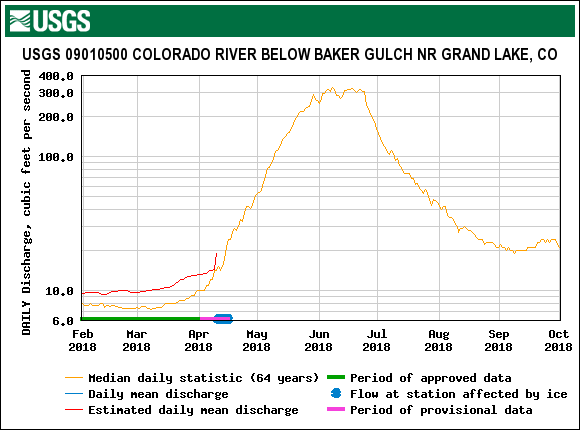
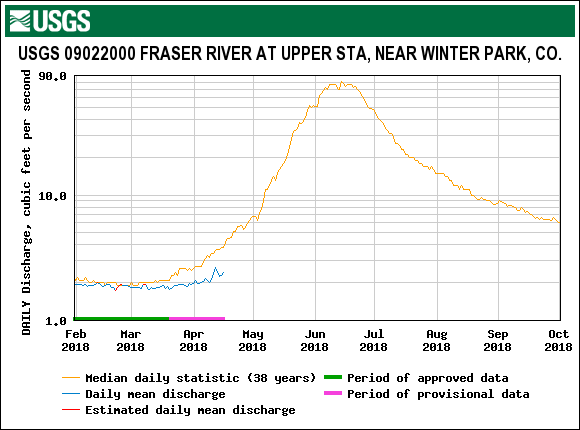
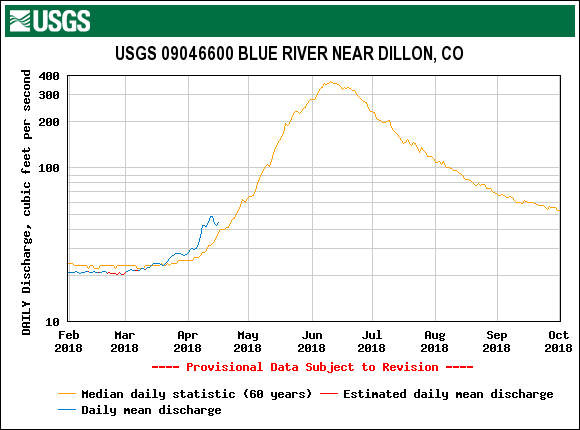
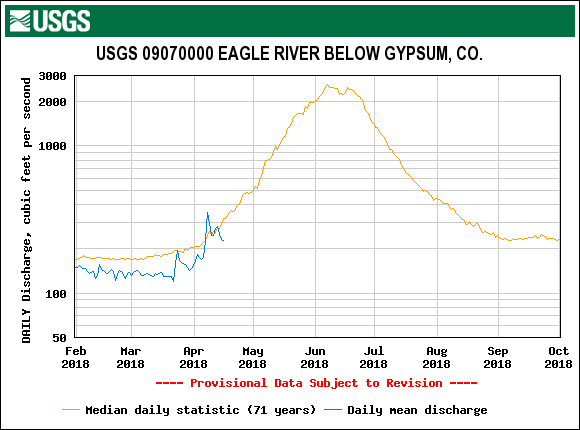
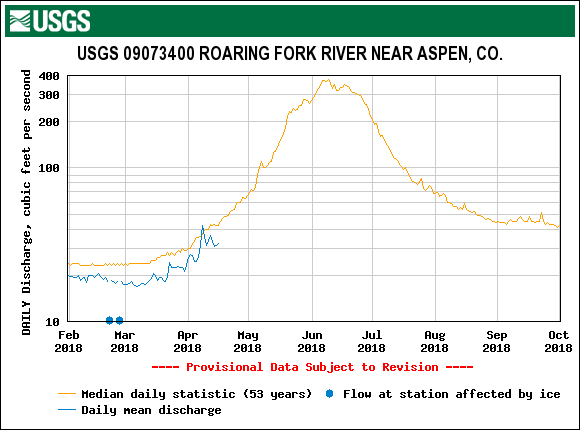
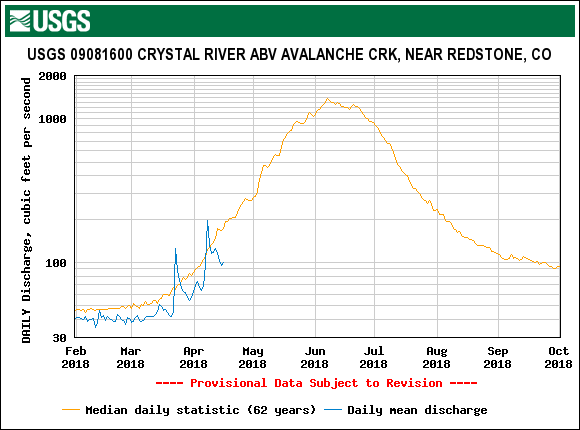
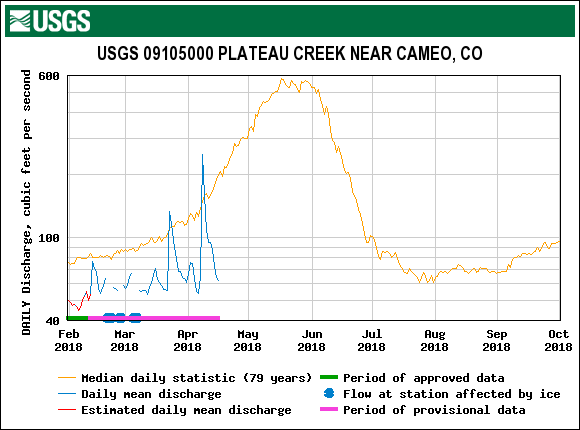
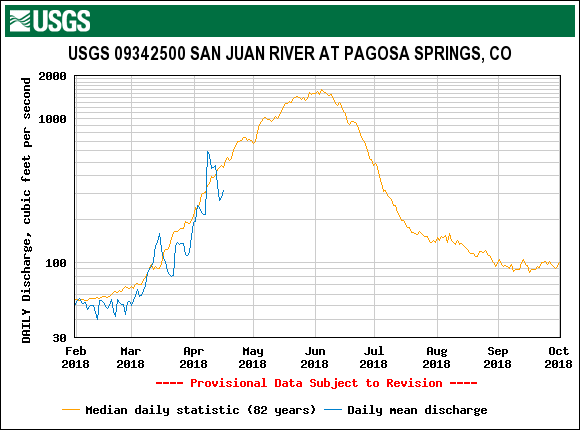
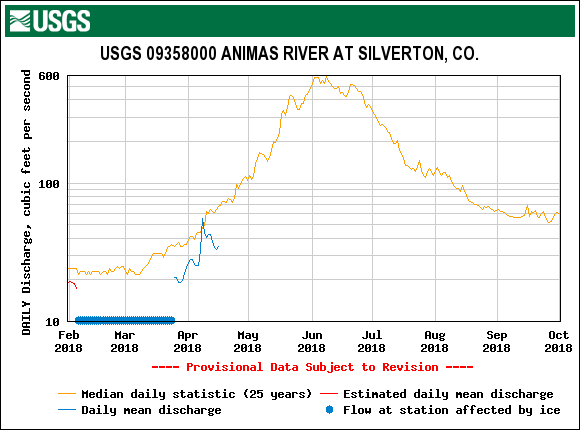
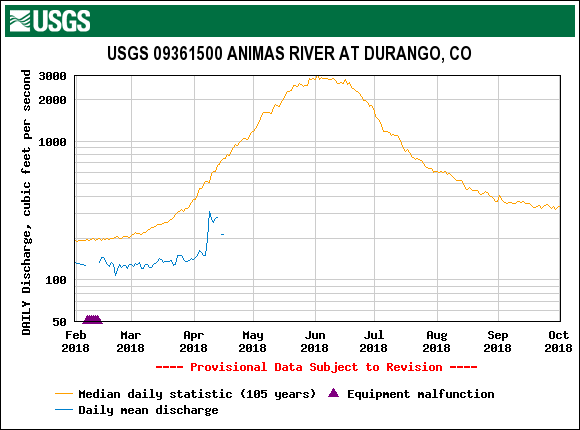
As we noted in the March CODOS tour update, and as USGS gauges are attesting to, snowcover across Colorado (besides Rabbit Ears and nearby mountains) below 10,000’ is lacking. This is likely contributing to the lower stream flow we are seeing statewide. And what snowmelt runoff was present at lower elevations may have been absorbed by the dry soils.
We are posting the snow profiles collected and new photos on each CODOS site’s webpage, as well as hydrographs and SWE graphs. Below you will also find a summary table and brief discussion for each CODOS location. Using the Dust Enhanced Runoff Classification (DERC) approach, links to hydrographs of the CODOS sites from WY2006-2017 are collated and presented to help with ascertaining what this spring runoff scenario might look like. We anticipate at least one additional full circuit of our ten CODOS sites this season as well as intensive monitoring at Senator Beck Basin (SBB).
Table 1. Dust and snowpack conditions as of April 16, and updated on April 20 for Front Range sites, with current DERC categorization. This is the time of year when we try to categorize dust severity throughout Colorado into either “Minimum”, “Average”, or “Maximum”. All locations are now classified as "Average" dust severity, but within that classification there is a bit of variance. Wolf Creek, Swamp Angel, and possibly Grand Mesa are on the upper end of average, while Central and Northern Colorado are more in the middle range of average. Within that categorization, along with pictures, we try to elaborate as to the local characteristics of the dust. The intent is to assess the effects of the dust on snowmelt. The table below summarizes dust events observed during the recent CODOS tour as well as the classification of total severity of dust-on-snow at each location. Considering this information along with March 1 SWE conditions and a current estimation of spring weather conditions, previous water year hydrographs are suggested as possibly meeting similar conditions as WY2018, and what the ensuing spring runoff might look like. “Current DERC Spring Conditions” are characterizations of spring weather to date (March-April 16). If there are no previous water years in the DERC matrix to directly compare with WY2018, then these sites are noted in bold, and alternate water years are presented that may offer an idea of possible runoff scenarios that are close to current conditions. Years in parenthesis are nearest neighbor dust conditions that also may shed light on runoff scenarios. In the pdf links under each CODOS sample site are the hydrographs for viewing.

SWE CONDITIONS
BASIN SWE CONDITIONS
STREAMFLOW


PAIRED PLOTS
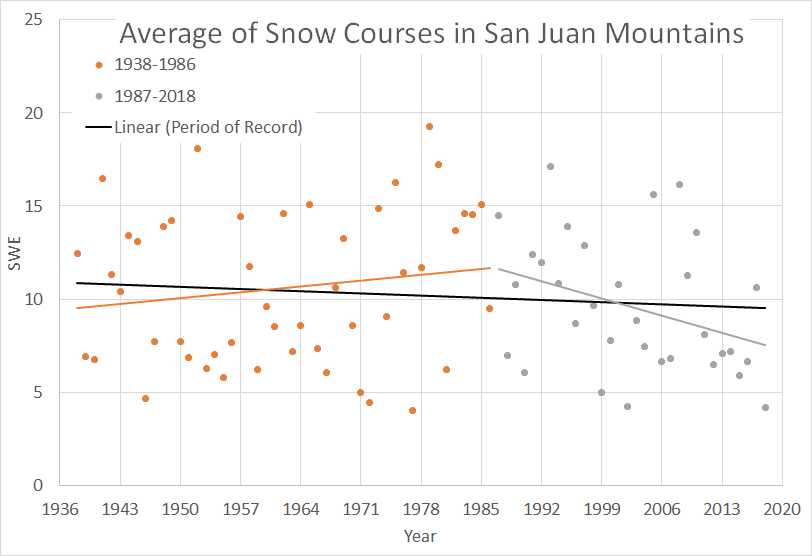
Senator Beck Basin – April 18
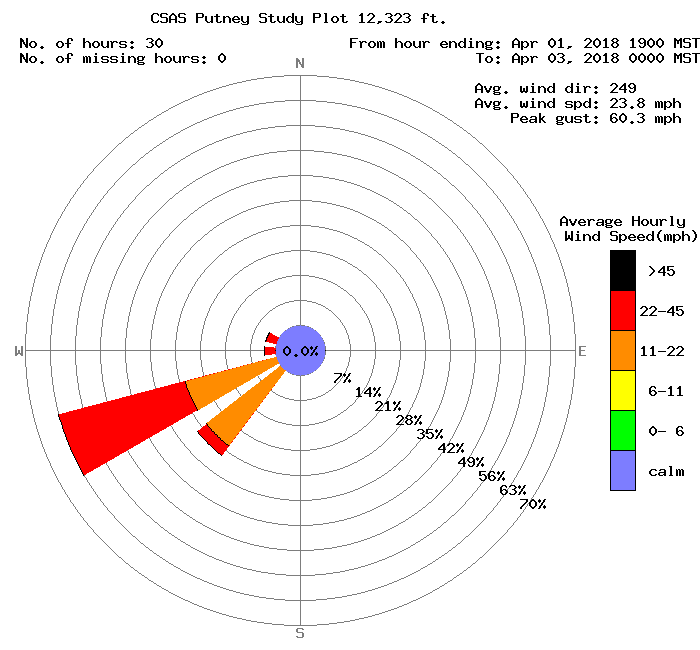
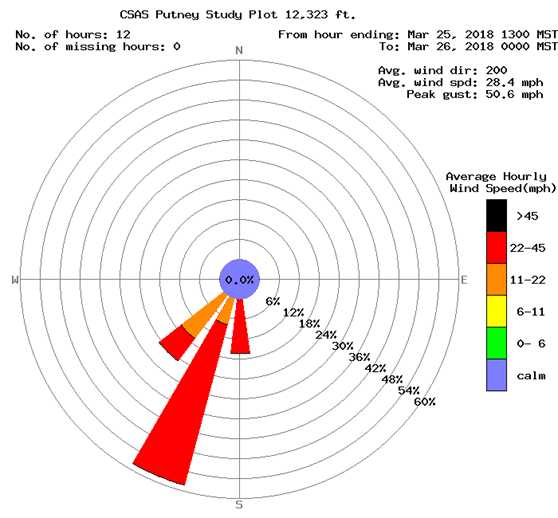
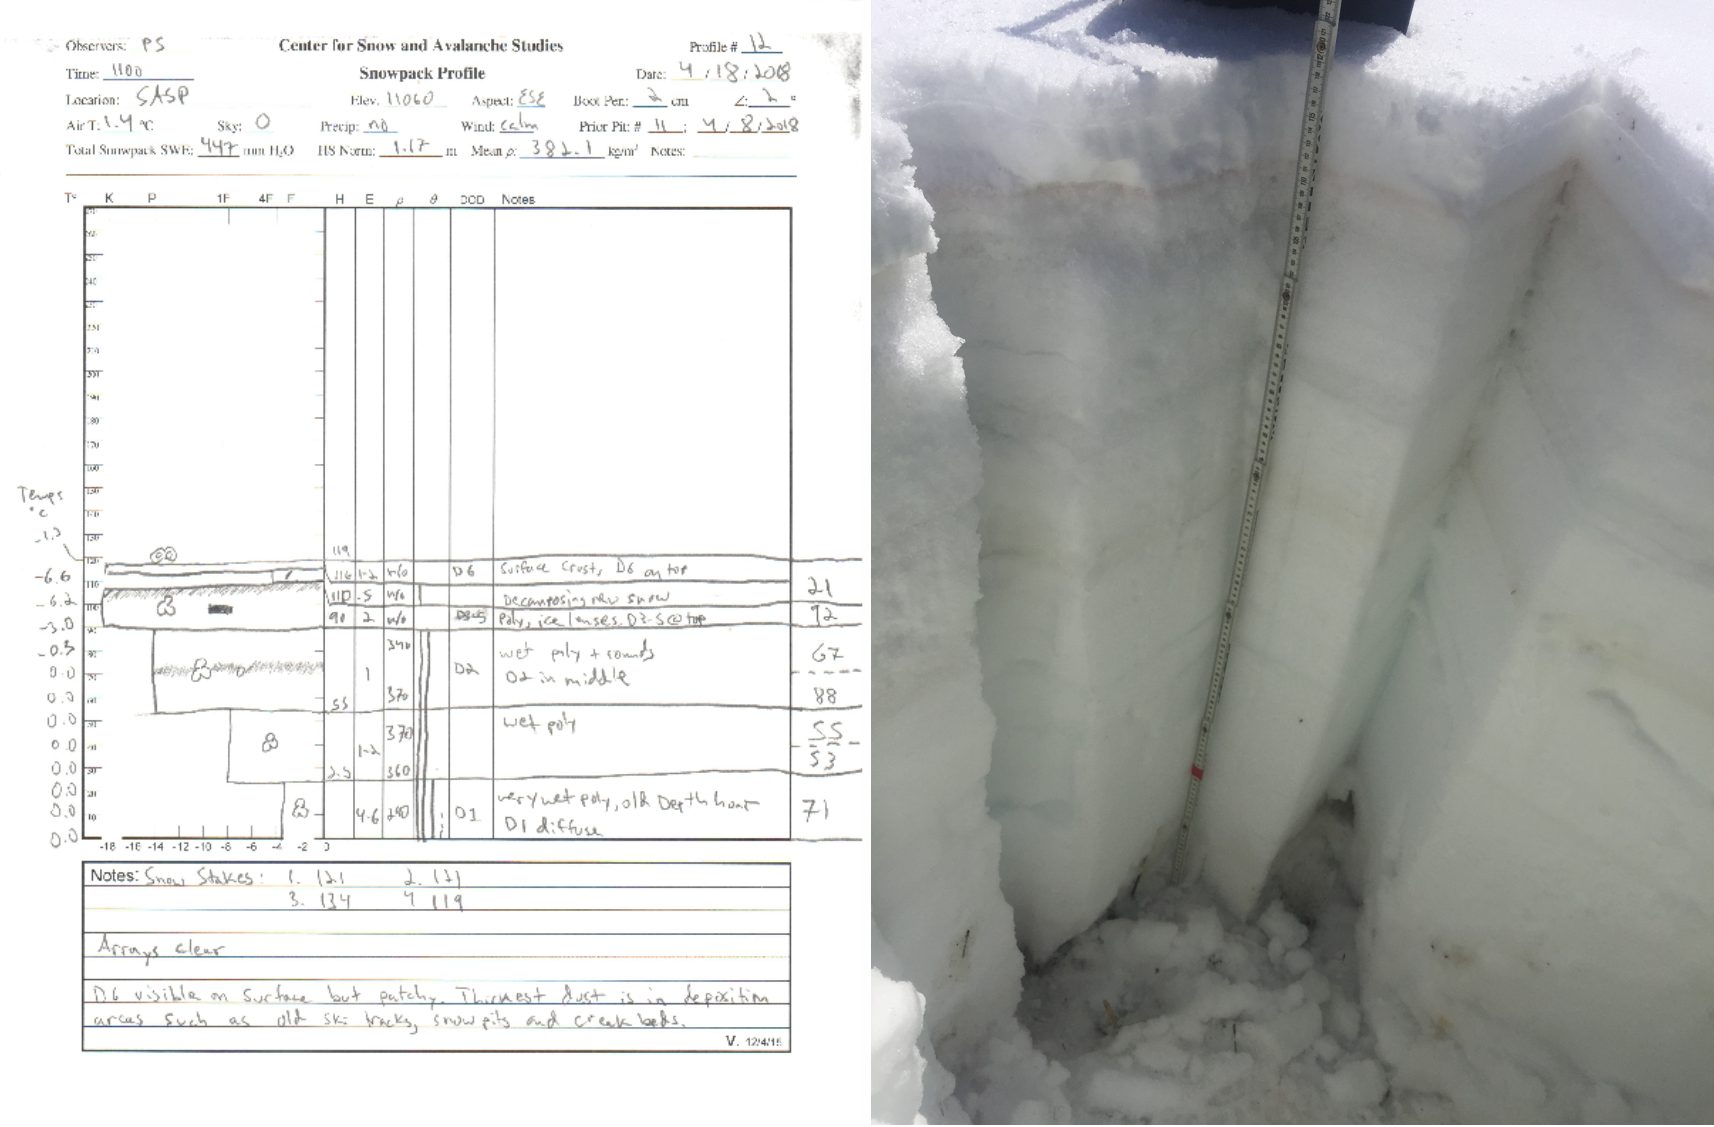
The San Juan Mountains received their sixth recoded dust event of the season on April 17th This dry event was relatively minor, although it was accompanied by extremely high wind speeds (peak of 90 mph at Putney). The new dust is variable across the landscape due to these winds and significant redistribution. Sheltered areas and depressions where blowing snow tends to deposit are exhibiting the darkest dust from this event. Ski tracks, wind pillows and creeks are good spots to observe this new event. The much darker and more worrisome D3-5 layer is about 4 inches (10cm) below the surface at Swamp Angel, and is highly visible in snowpit walls. The layer is exposed on many slopes on the surrounding landscape, especially on solar aspects and wind scoured slopes. The layer has formed a stout crust, and many loose avalanches with dusty bed surfaces have been observed running on this layer. While still on the surface, the presence of D6 may accelerate the emergence of these buried layers. However, we are hopeful that this new event will be buried shortly as a closed low-pressure system moves into the region on Thursday. It is unclear if the new snow will be accompanied by additional dust, but the National Weather Service has a dust storm warning in effect for the dust source region in Northern Arizona.
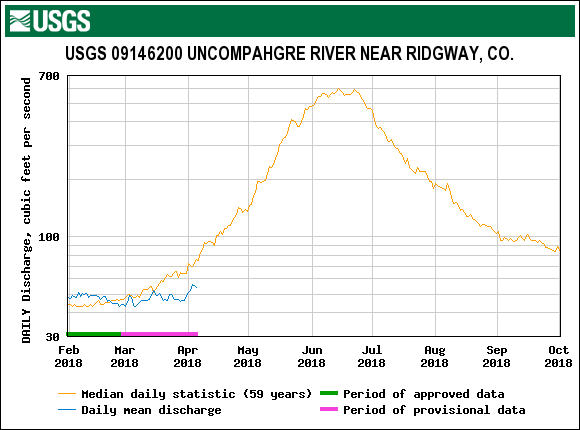
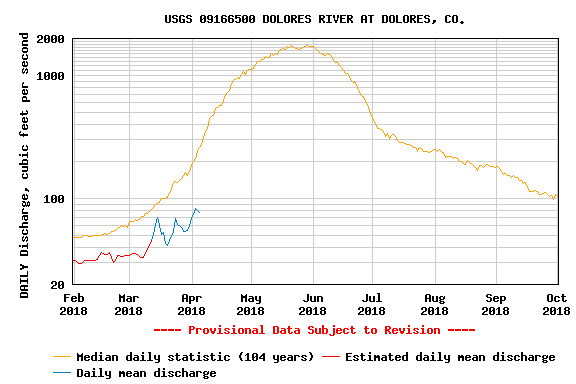
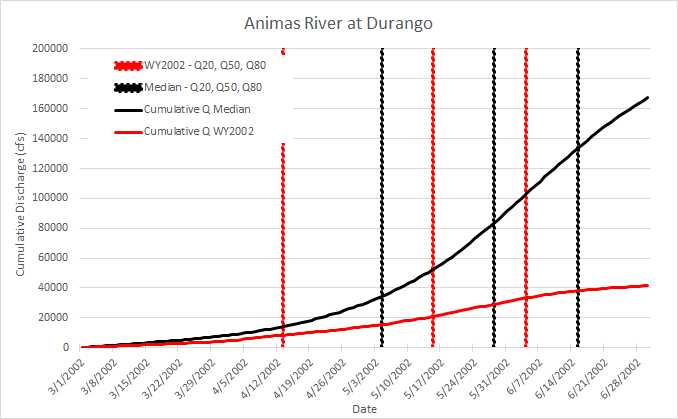
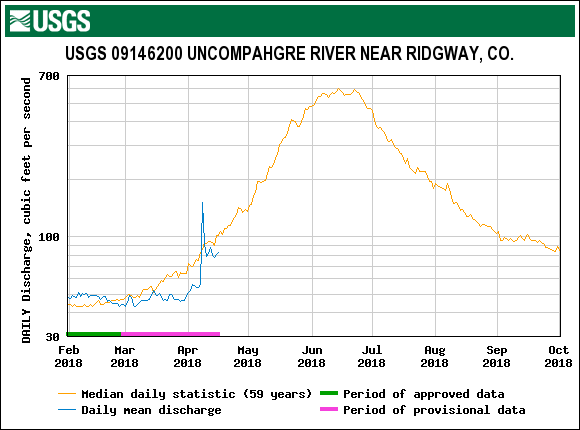
On March 1st, SNOTEL station data in the San Juan region was ranked as “Low”. We are seeing “Dry” current spring precipitation conditions, and “Average” dust conditions currently exist. USGS gauge hydrographs from four watersheds, Animas River, Dolores River, San Miguel River, and Uncompahgre River for the CODOS WY2006-2017 period of record, are collated and presented in the DERC discussion on the SBB webpage. Below are hydrographs that pertain to “Low” March 1 SWE conditions.
Uncompahgre near Ridgway (pdf)
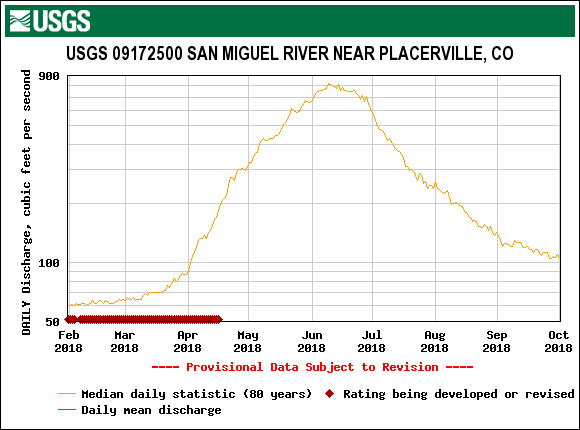
San Miguel near Placerville (pdf)
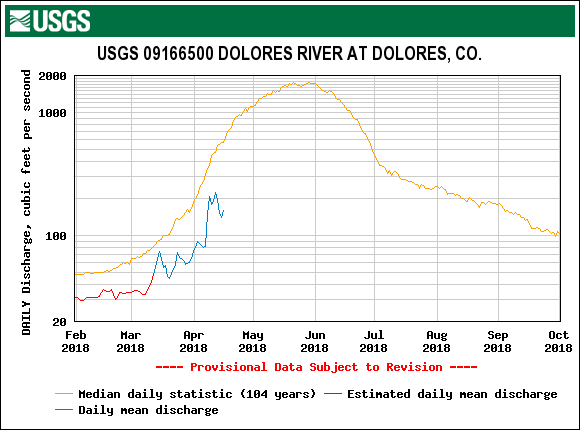
Dolores River at Dolores (pdf)
Animas River at Durango (pdf)

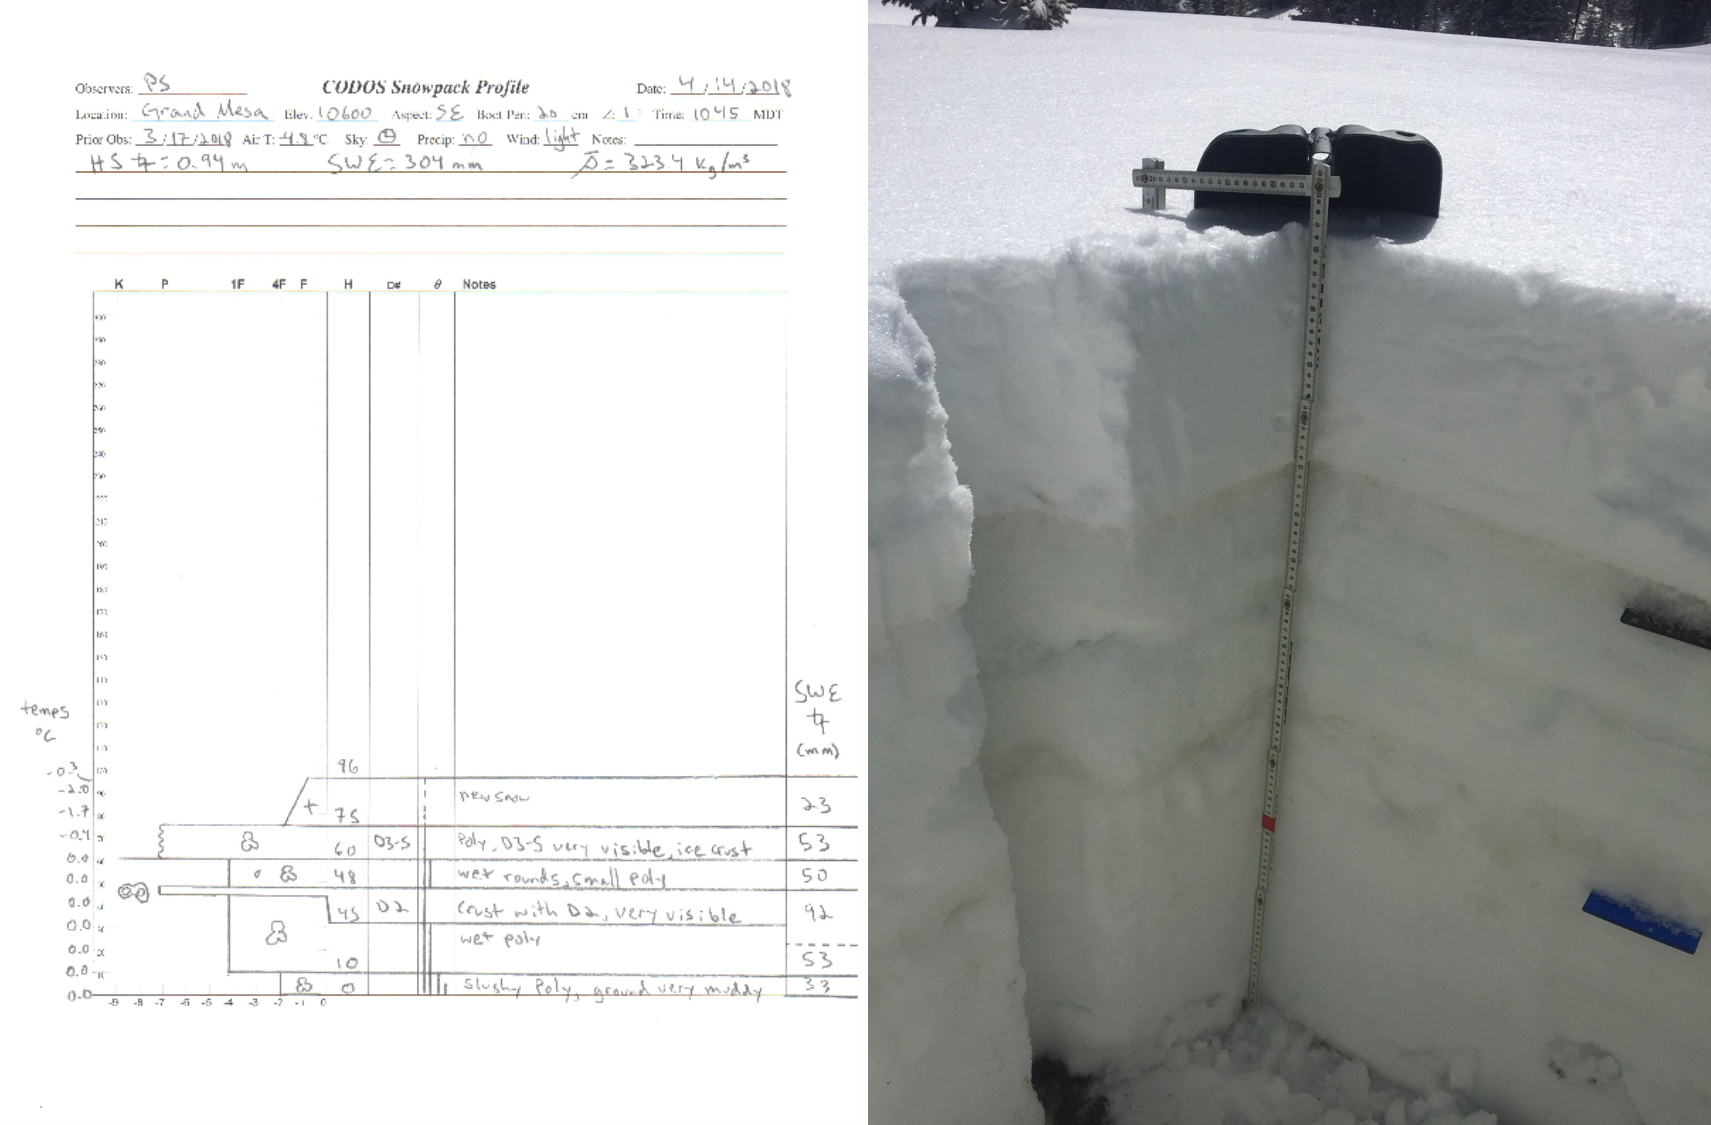
Snow Profile at SASP on April 18, 2018. D6 (light) is on the surface. D3-D5 is ~4" below the surface. D2 is ~19" below the surface.

Common scene near Red Mt Pass, Bare ground showing at all elevations, scant snow in general below 10,000'. D2-D6 merged and at the surface at many locations.

Avalanches are running on dust layers D3-D5. Dust, beneath the snow but close enough to the surface still absorb solar radiation, creates a stout crust layer that provides a smooth, hard bed surface for the overlying snow to run on.

View from Swamp Angel Study Plot. Local debris is on the surface from high winds up to 90 mph were recorded at Putney station. You can barely see D6 on the surface in this photo.

SWE at SASP is now comparable to WY2012 amounts. Hopfully, addition SWE will be added during the forecasted April 19-21 storm.
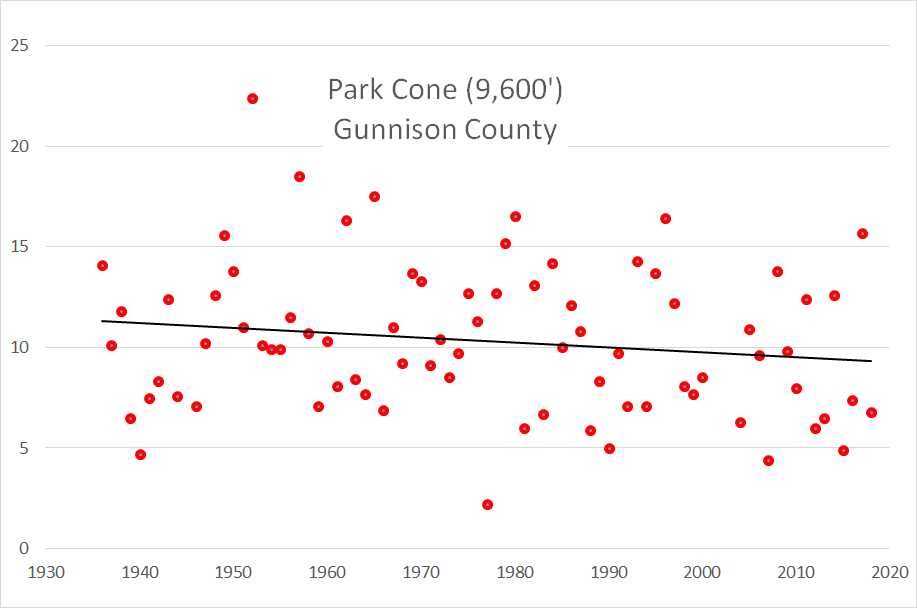
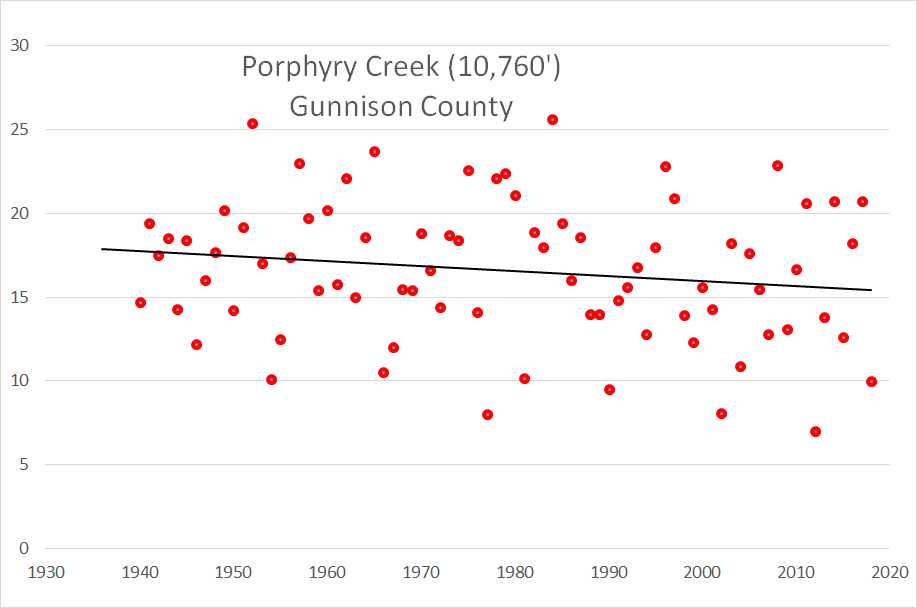
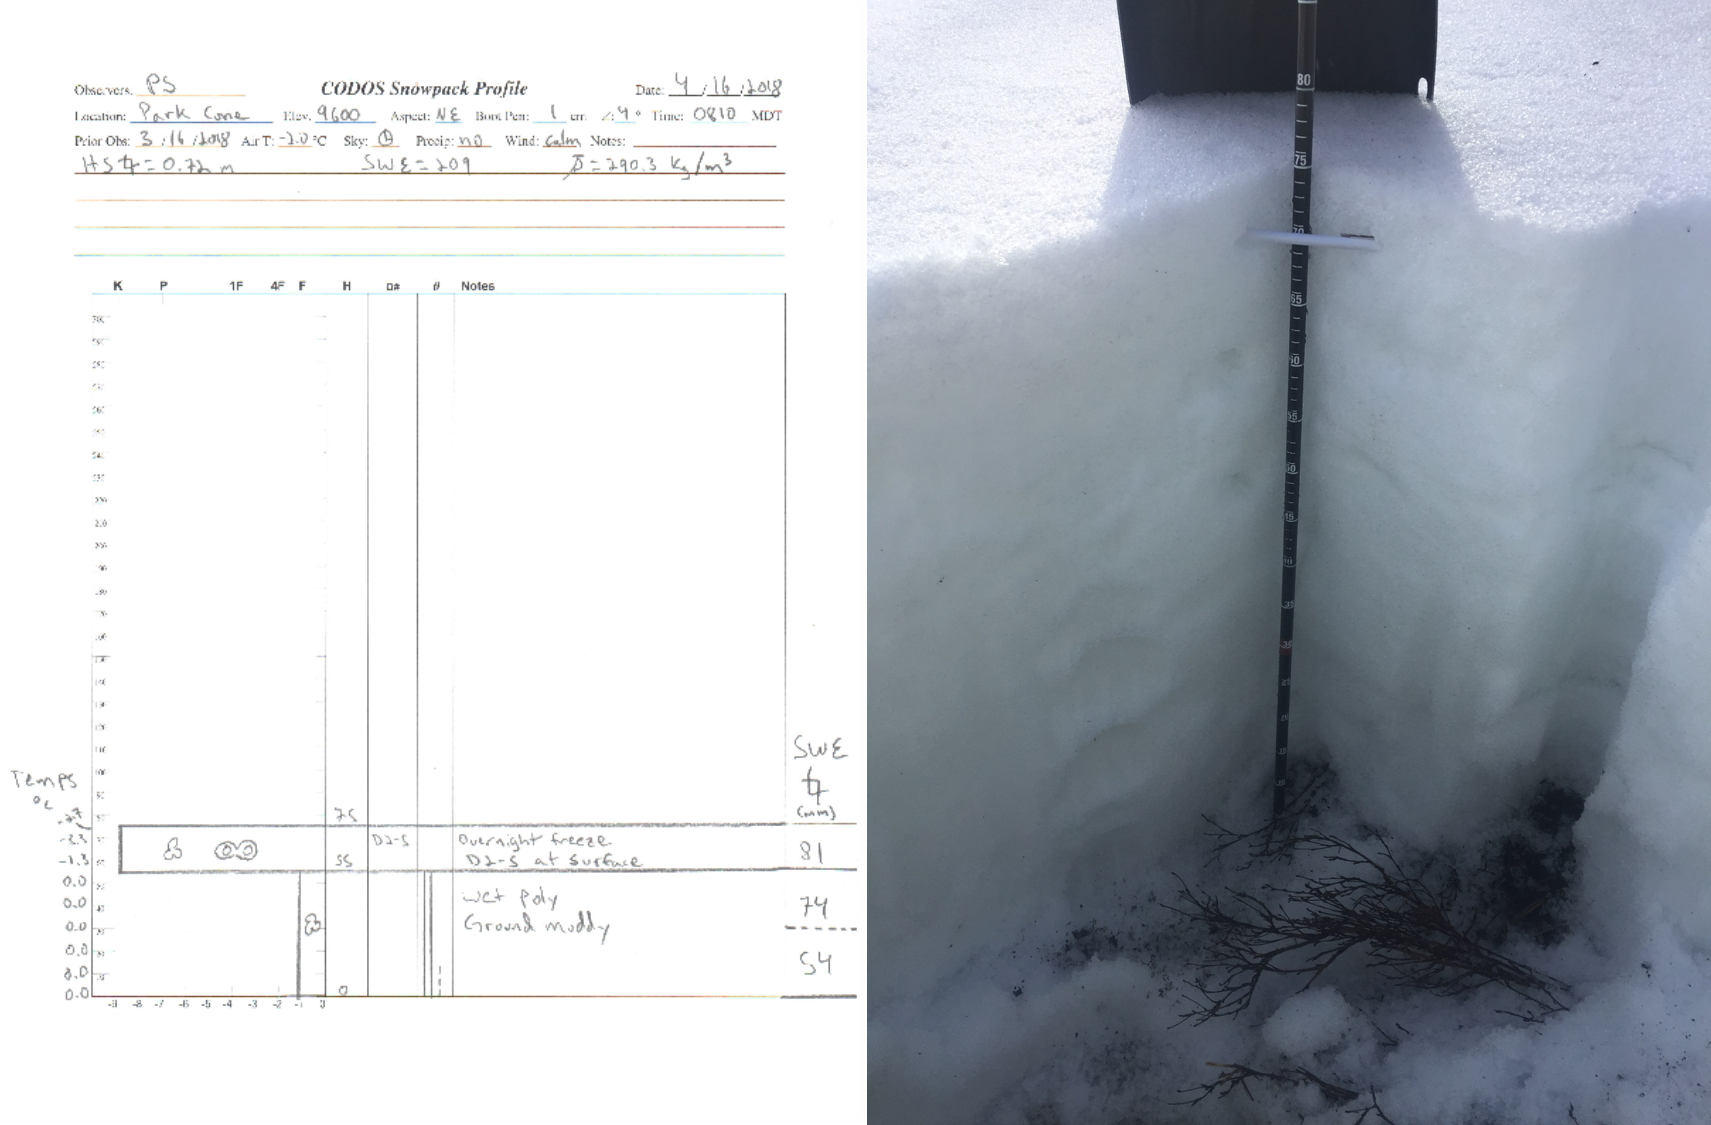
Park Cone – April 16
Layers D2-5 are merged on the surface. Prior to D5, D2 was extremely mild, if present at all, at Park Cone. Given the light nature of D3/D4 at SASP, it is likely not much of these events contributed significantly to the dust seen at Park Cone. Hence, the majority of dust from D2-D5 is primarily from D5. However, this is where we get into the spatial variability of dust deposition in Central Colorado, through very reliable observations D2/D3 was on the surface of the snow in the Crested Butte area on April 1. In addition, D5 was observed in vast quantities as it was being deposited in the Vail area and also after it was deposited in significant quantities in the Aspen area. At the time of observation near Aspen on April 15, D5 was under 6-8” of snow and emerging to the surface quickly. Judging by these and other observations (March CODOS tour etc.) the severity and extent of D2-D5 is of significant severity in the West Elk and Maroon Bells region.
Snowpack is isothermal and rotten at Park Cone. Minor gain in snow height and moderate gain in SWE (3.2”) since the previous CODOS tour on March 16. All-layers-merged samples were taken at the pit location.
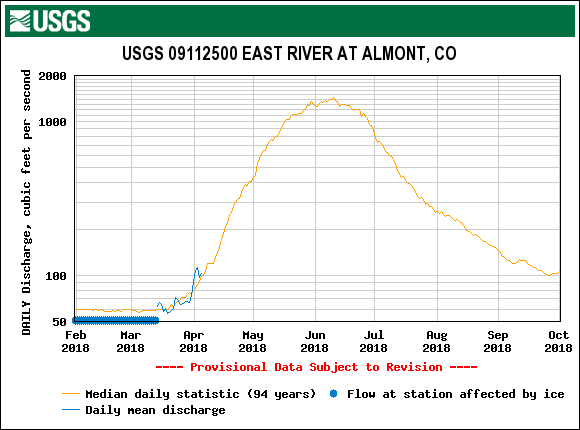
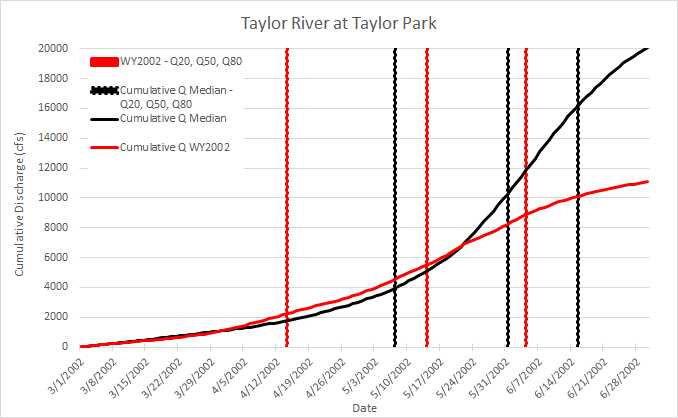
Park Cone is considered to have “Low” March 1st SWE and to be having a “Dry” spring with “Average” dust under our DERC classification. See the below DERC slideshows to find hydrographs from similar years.
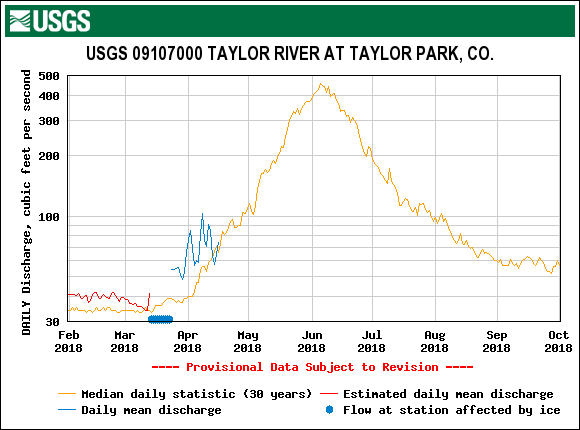
Taylor River at Taylor Park (pdf)
East River at Almont (pdf)
Lake Fork at Gateway (pdf)

Looking north out over Taylor Reservoir, near Park Cone Sample location.

Dust on surface at Park Cone teeters between Min and Average, but considering dust deposition on a regional level pushes it over to the Average category.
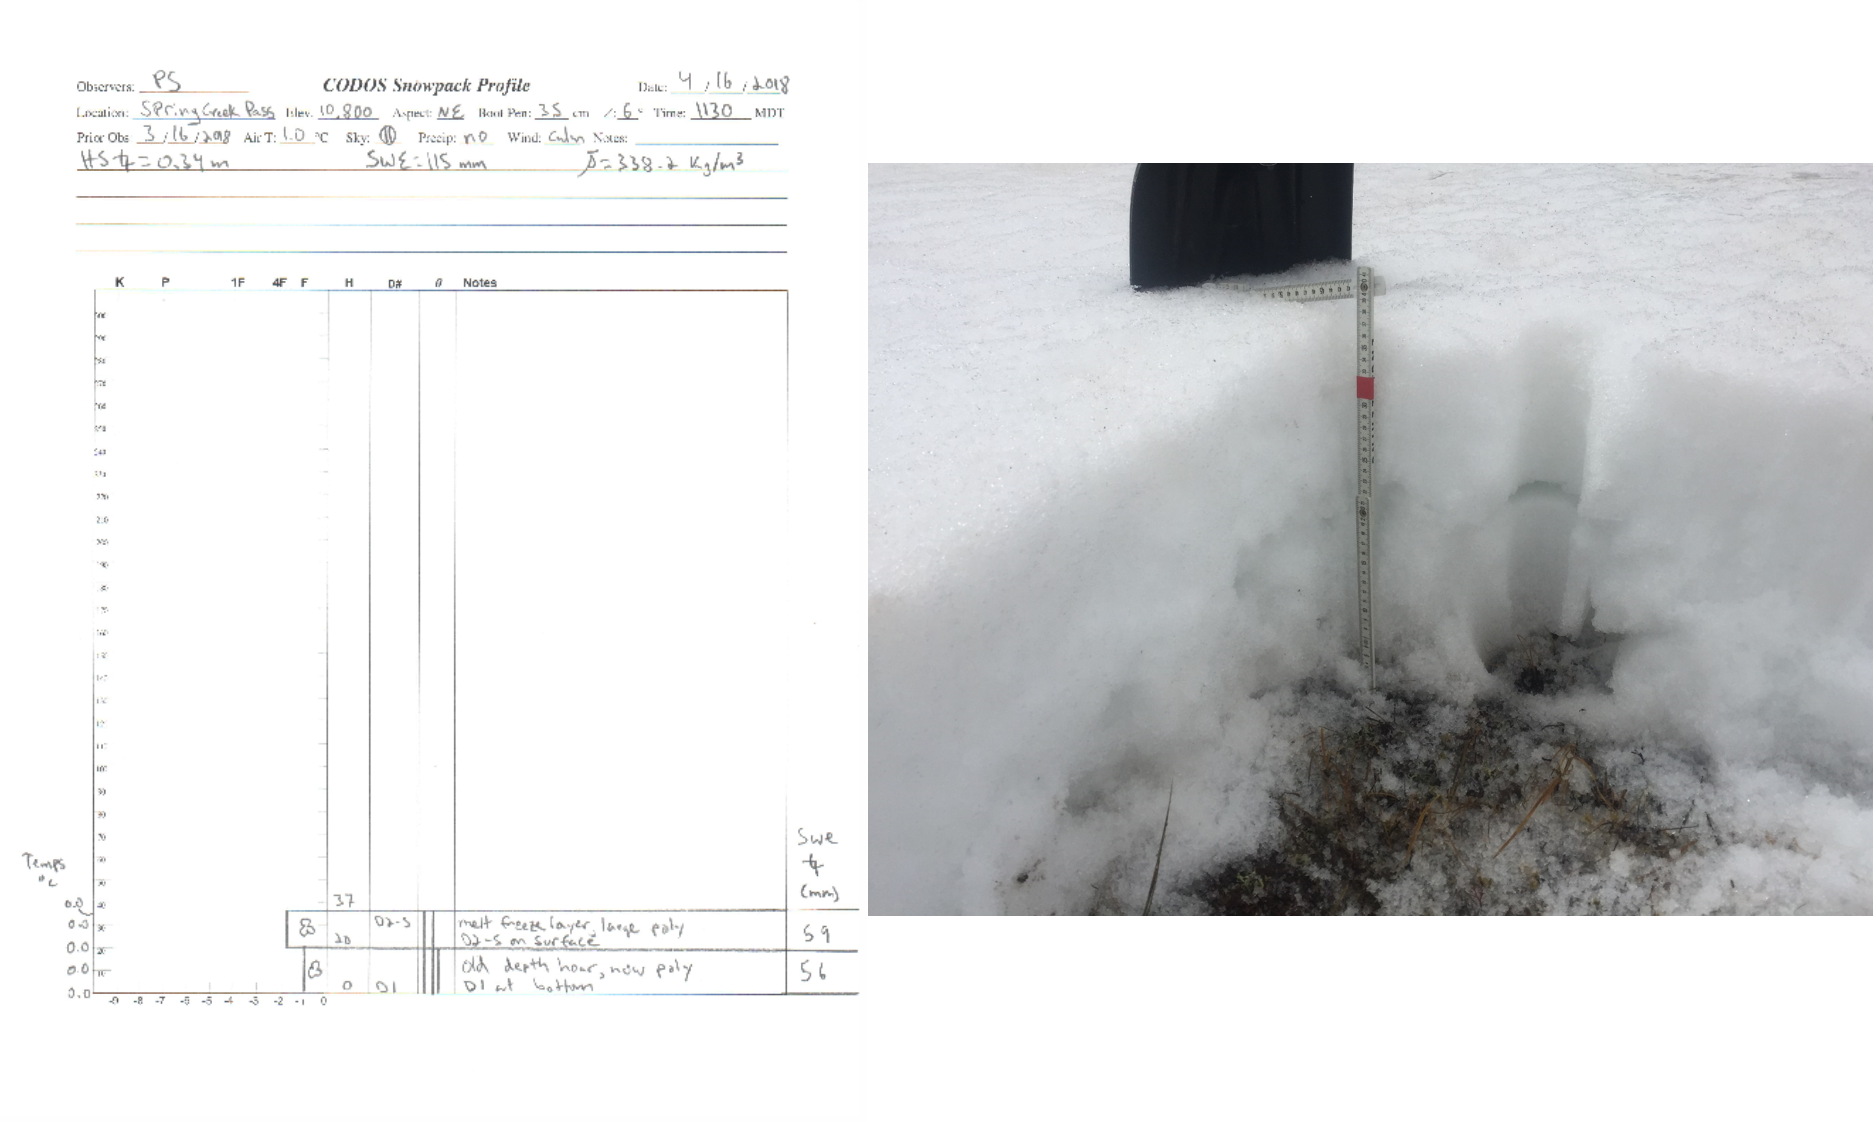
Spring Creek – April 16
Snow is nearly gone in the area surrounding the pit location, which is currently the only patch of snow at this elevation across the landscape. SWE at the actual sample site is the same as March 16. Snowpack is isothermal and rotten. Dust is dark and D2-5 are merged on the surface (but not as severe as Wolf Creek). All-layers-merged samples were taken at the pit location.
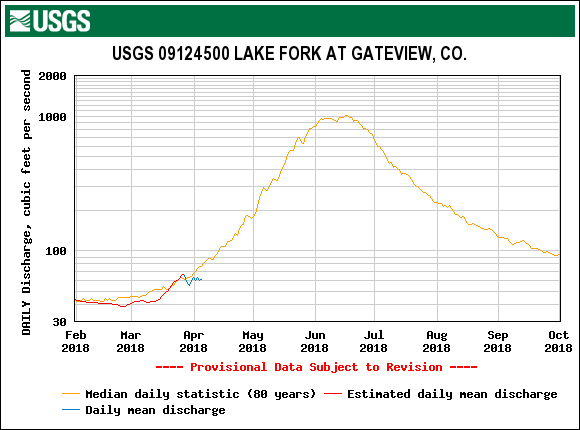
Apart from the forecast showing a likelihood of precipitation April 19, it is reasonable to expect Spring Creek to continue losing it’s remaining snow to runoff soon. Spring Creek is considered to have “Low” March 1st SWE and to be having a “Dry” spring with “Average” dust under our DERC classification. See the below DERC slideshows to find hydrographs from similar years:
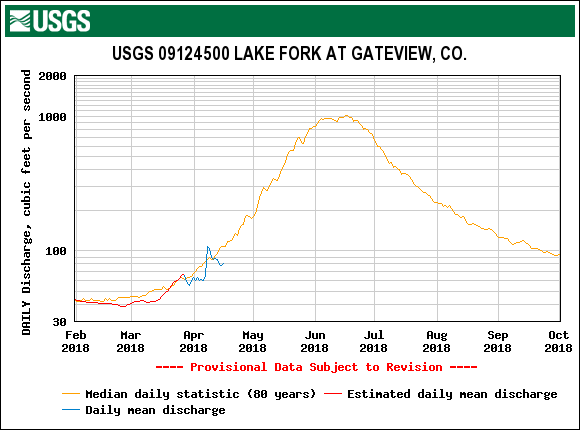
Lake Fork at Gateview (pdf)

Spring Creek CODOS site on April 16. Photo is looking up towards the sample location on the hillslope.

All layer are merged at Spring Creek. Overall not nearly as severe as Swamp Angel or Wolf Creek.

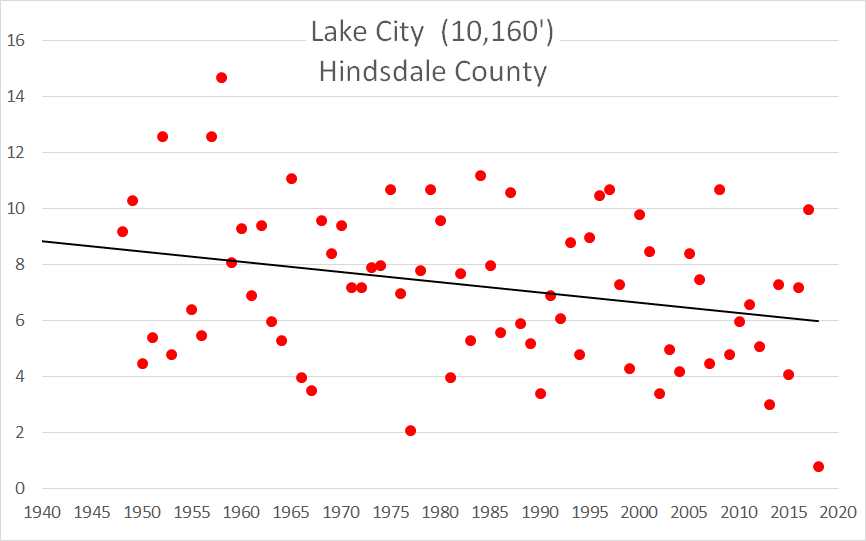
Photo looking at the San Juan Mts toward Lake City.
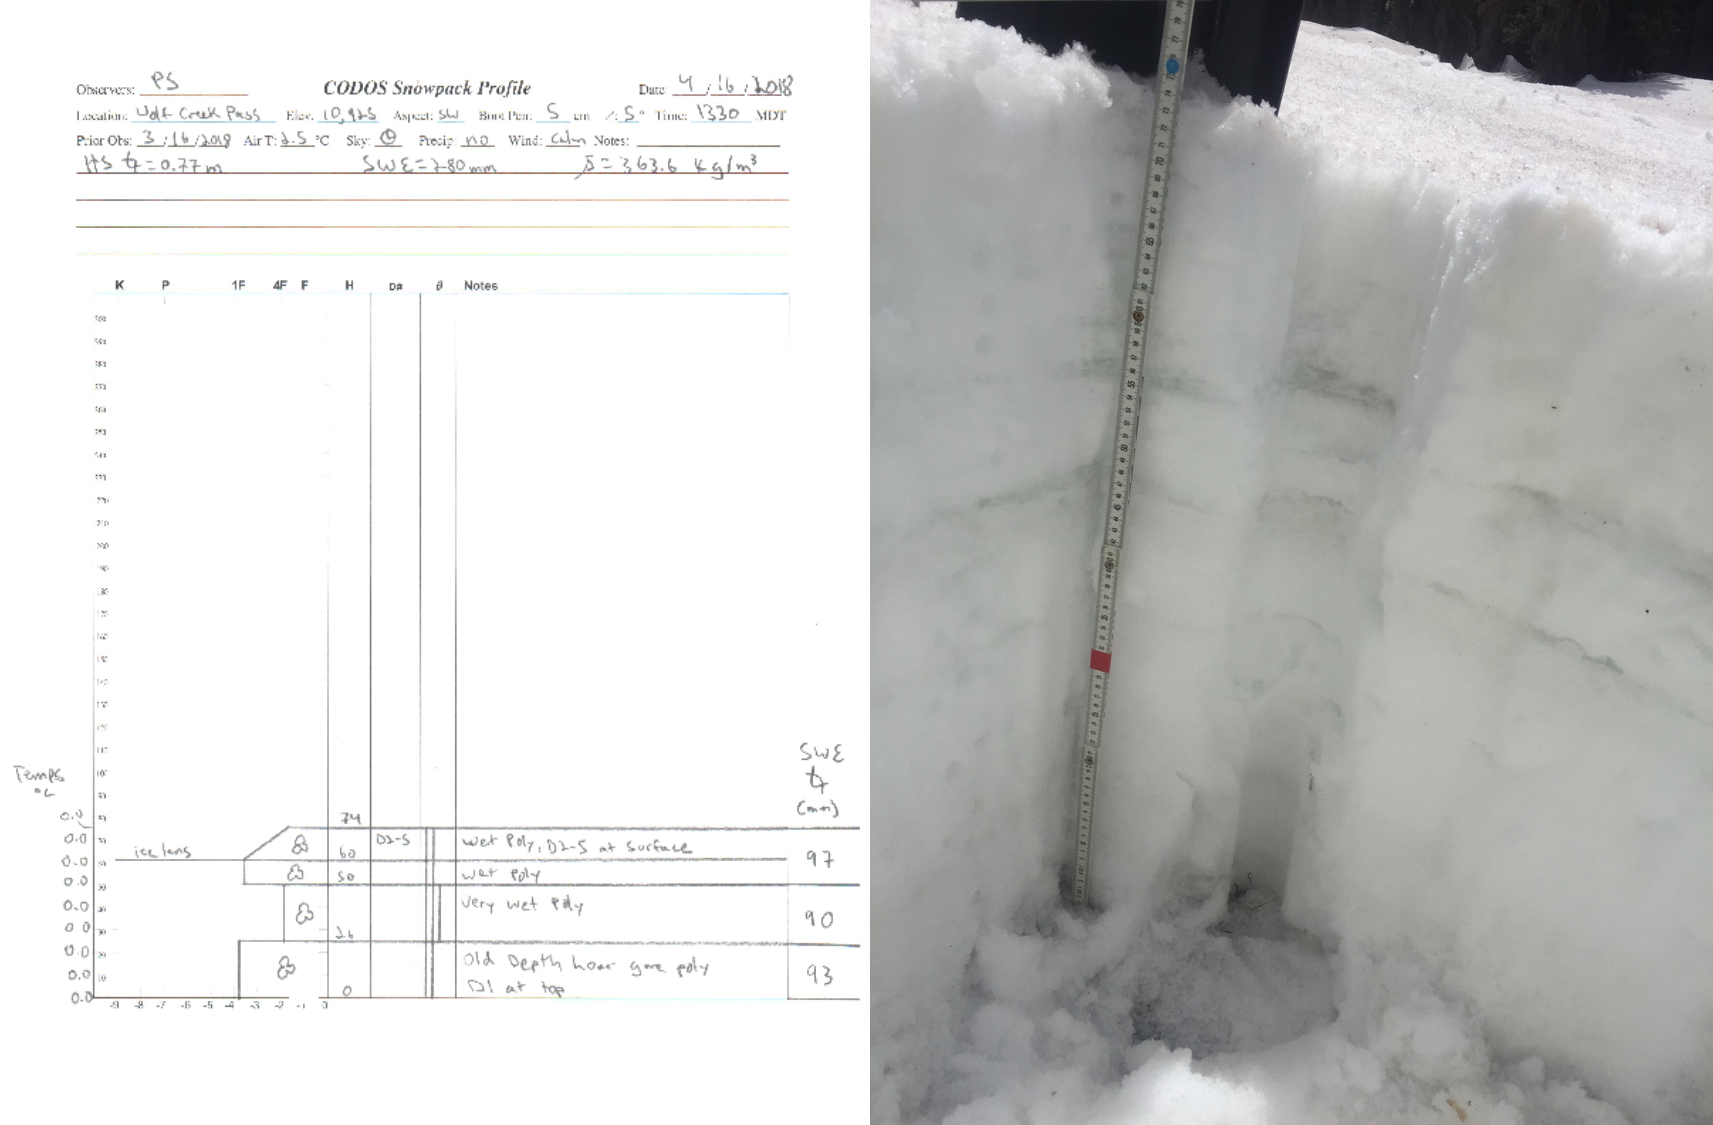
Wolf Creek Summit – April 16
Major losses in snow height and SWE were noted since the last CODOS tour. Oddly, or amazingly, snowdepth decreased by half since our last visit on March 16, from 4.8” to 2.4’. And SWE has decreased from 17” to 11”. Wolf Creek SNOTEL on the other hand, after having reached peak SWE on April 1, is the same on April 16 as it was on March 16 (19.2” of SWE).
Dust is highly visible across landscape and in the pit. Layers D2-5 are merged and on the surface. Dust is worse at this location than any other CODOS site. Snowpack is isothermal and very wet. The ground is extremely saturated and muddy.
The snowpack is shallow for Wolf Creek, considering the warm temperatures this entire season and lack of added precipitation, the melt we have seen so far, we expect snow to continue depleting rapidly. Within our DERC classification, Wolf Creek is classified as having “Low” March 1st SWE, “Average” dust and “Dry” springtime precipitation. Please see the below hydrographs for typical runoff patterns that have transpired in similar previous seasons in our period of record:

Preferential melt at Wolf Creek due to dust.

The landscape is starting to show bare ground at Wolf Creek Pass.

Wolf Creek has the worst dust conditions observed on the CODOS circuit. D2-D5 is at the surface of the snowpack, and unless adequately buried by spring storms will accelerate snowmelt and sublimation rates (further reducing runoff).
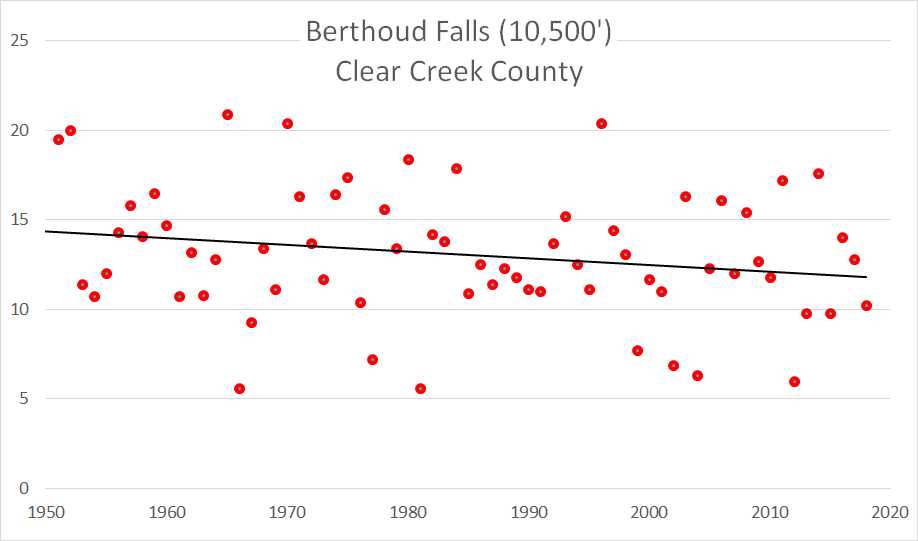
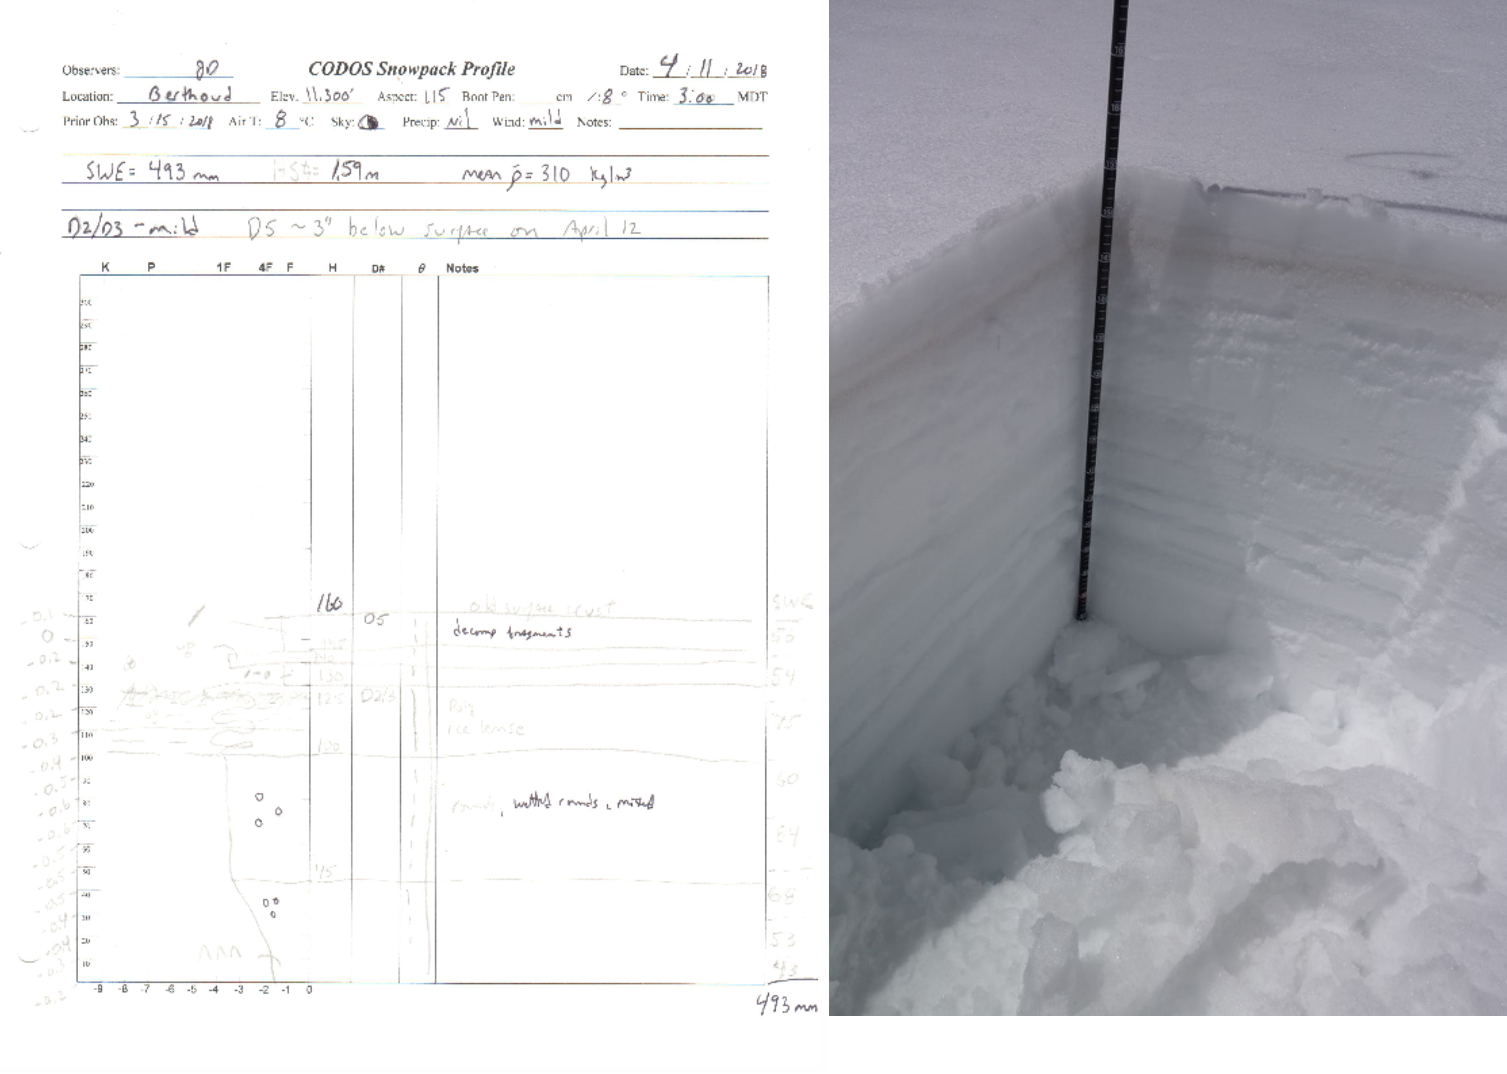
Berthoud Summit – April 11 and April 19
The CODOS snow profiles on April 11 revealed no dust within or on the snow to the naked eye. On April 19 we revisited the site to assess the presence of D5/D6. After revisiting the Front Range sites it is clear that D5 for sure is a statewide event. The dust is slightly underneath the surface or essentially on the surface around the sample area and is of significant severity. "Significant severity", meaning the dust is obvious and pronounced in the snowpack and on the surrounding landscape and will have a controlling influence on timing of snowpack warming, melt rates, and sublimation rates. Like all the other CODOS sites, D5 hits right near peak SWE accumulation, making it a nuisance the duration of snow melt season.
With the presence of D5 we are tweaking our classification of dust from "Min" to "Average". So currently, Berthoud CODOS site is classified as “Low” March 1 SWE, “Average” dust and “Wet” spring conditions. The link below contains plausible runoff scenarios. WY2012 offers a direct comparison to WY2018.

The snow profile at Berthoud looks much different on April 19 than it has all season. D5 is ~ 4" below the surface and is a very obvious and will be a significant influence on snow melt once it is entirely exposed across the landscape, which will be very soon.

At Berthoud Pass dust is very noticeable in depressions and eddies of the landscape.
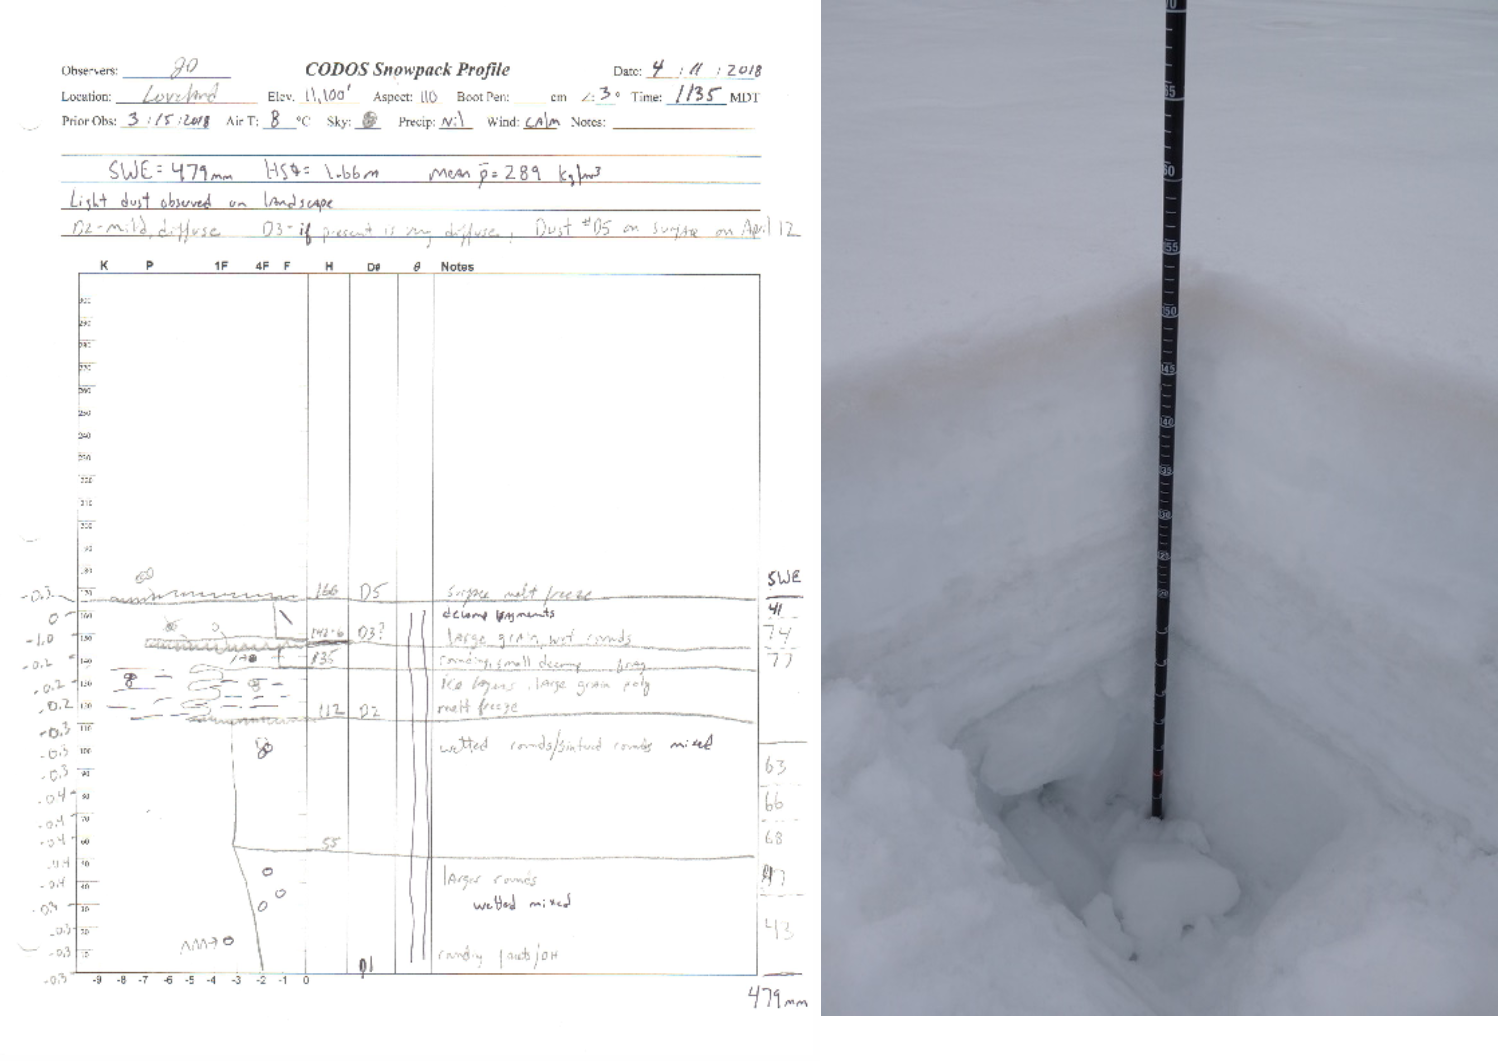
Grizzly Peak/Loveland Pass – April 11 and April 19
On April 11 Grizzly Peak showed very mild dust from D2-D4 and light dust on the surface from possibly local sources. On April 19 D5 was on the surface, very dark and dirty in locations, and largely windswept.
We now have the Grizzly CODOS site classified as “Average” March 1 SWE, “Average” dust and “Average” spring conditions, to date. The link below contains plausible runoff scenarios based on similar hydrographs under similar conditions. There are no direct comparisons from previous years, but ’15 and '16 offers a nearest neighbor comparison.

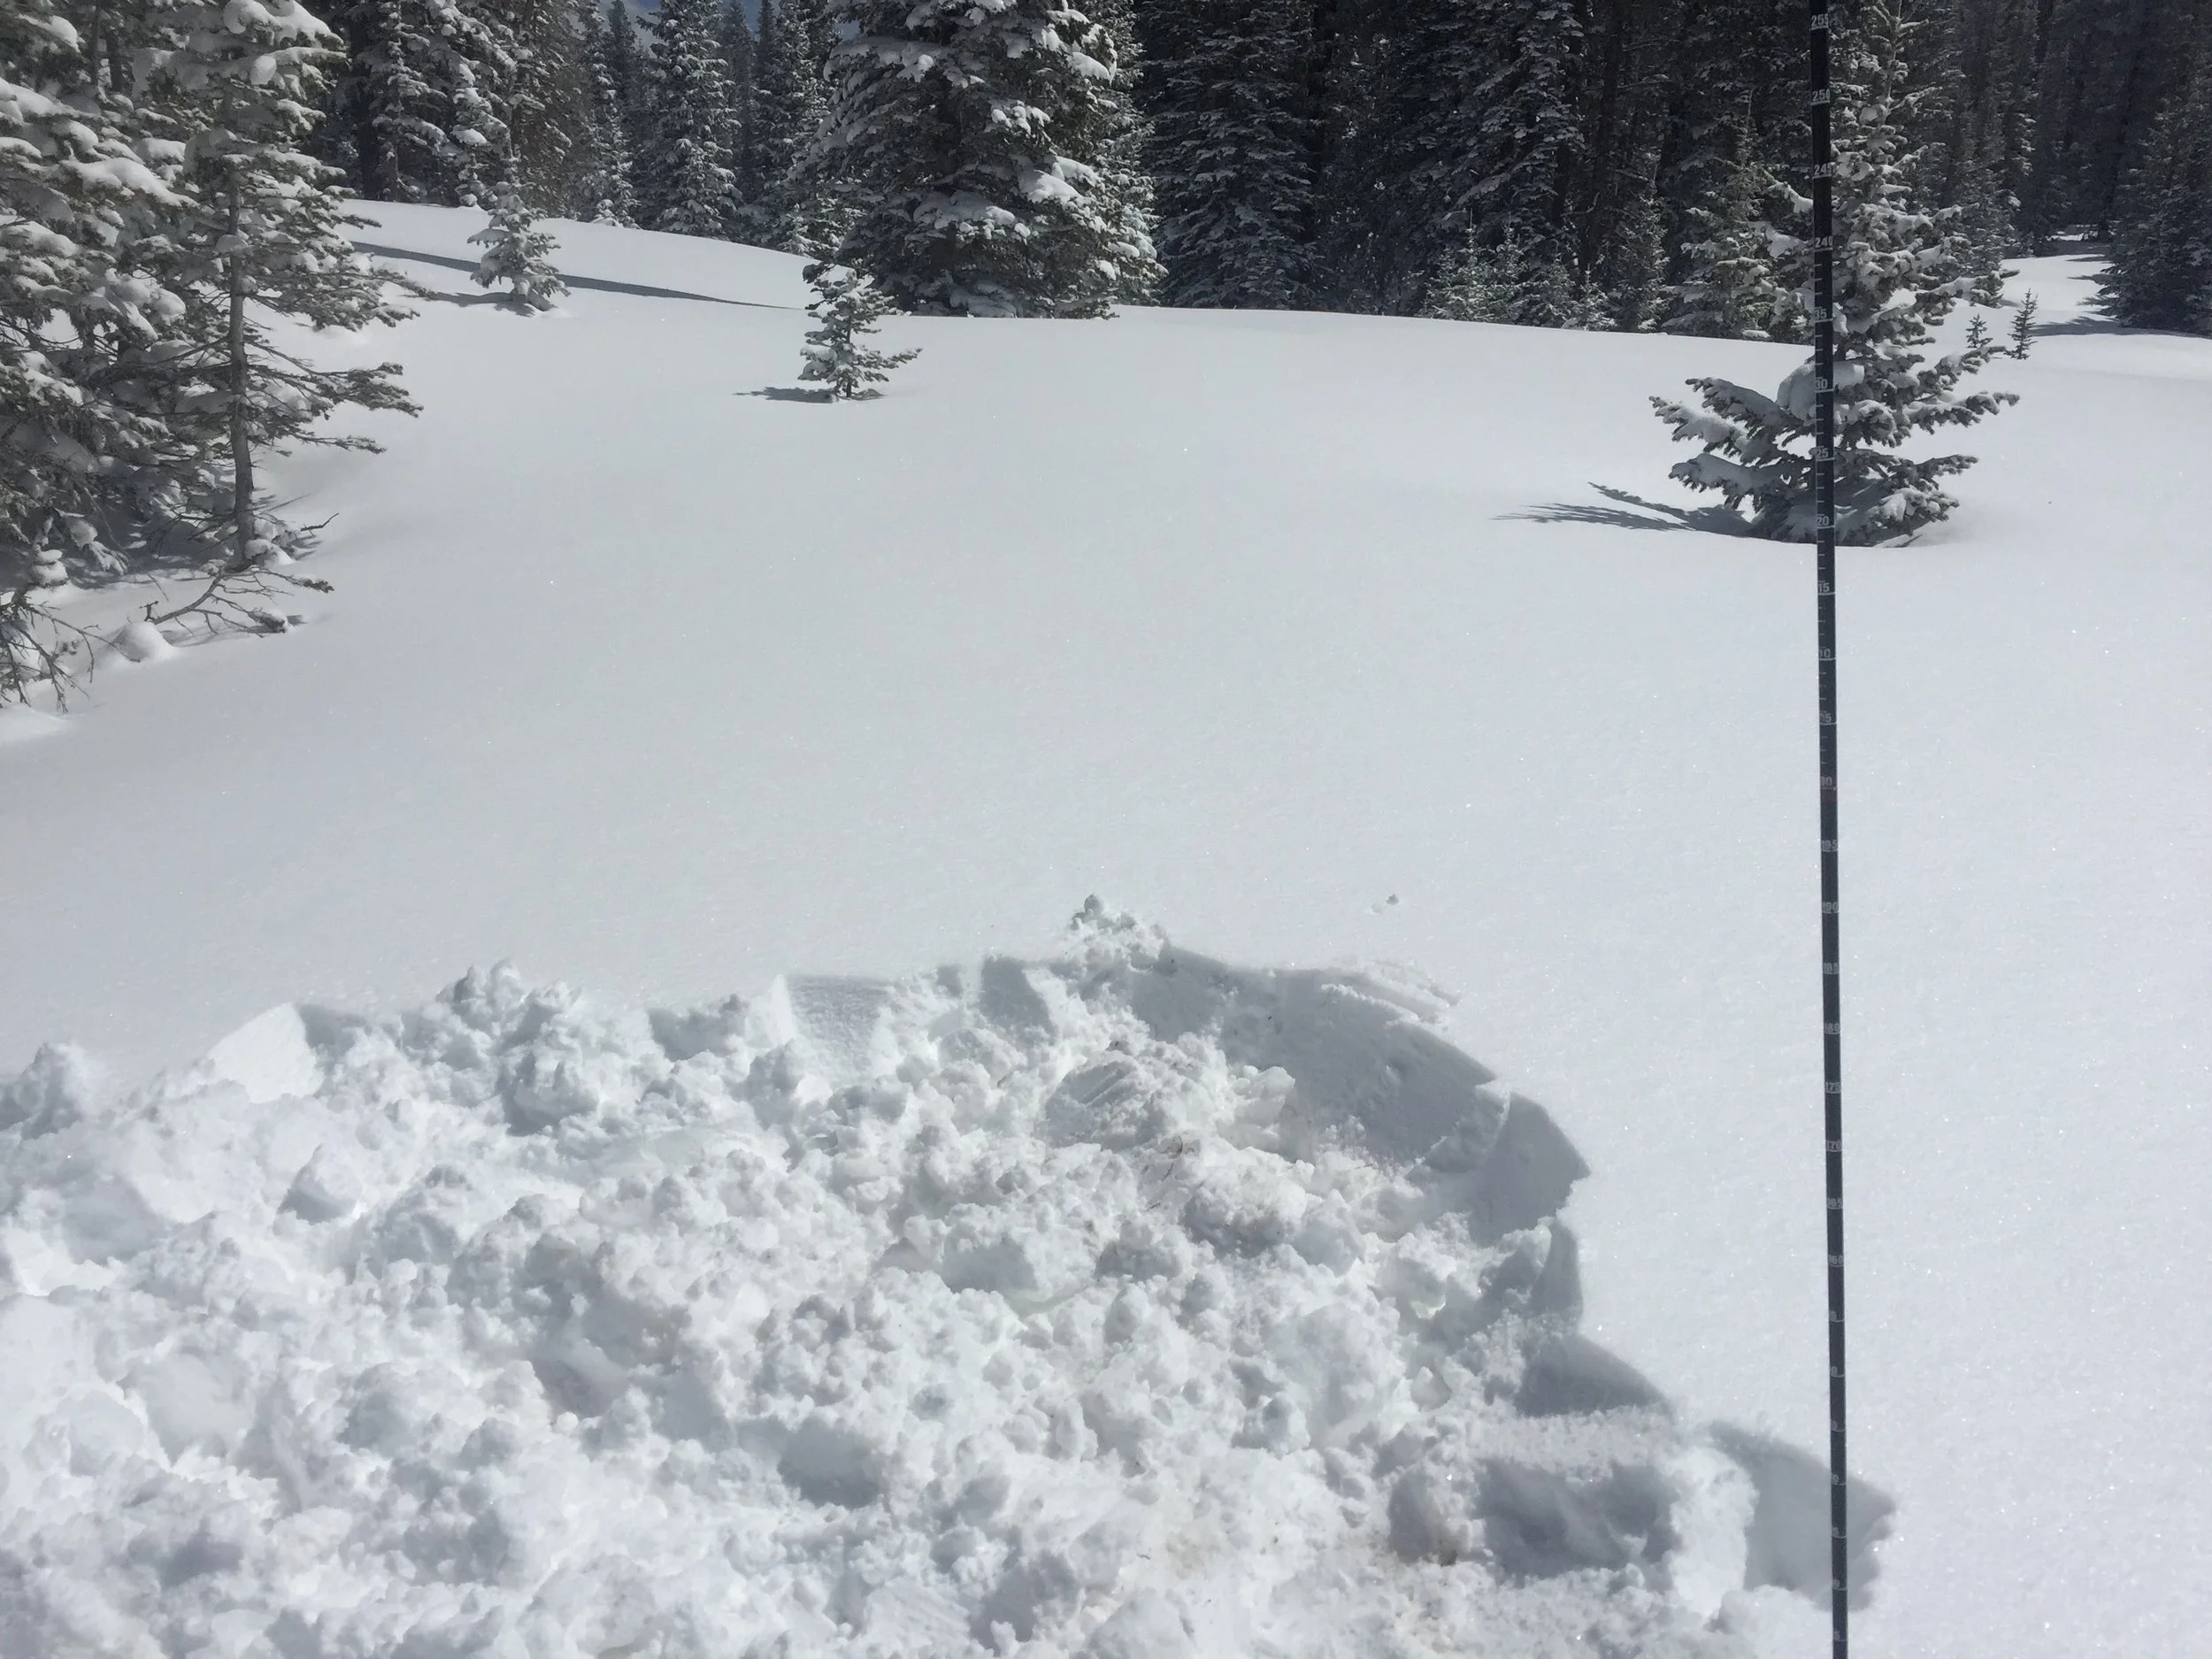
Dust at Loveland Pass is visible in dune-like patterns.

Dust from D5 is essentially on the surface on the profile and surrounding landscape.

D5 under a surface crust at Loveland Pass

Another landscape photo from near CODOS sample site near Loveland Pass.
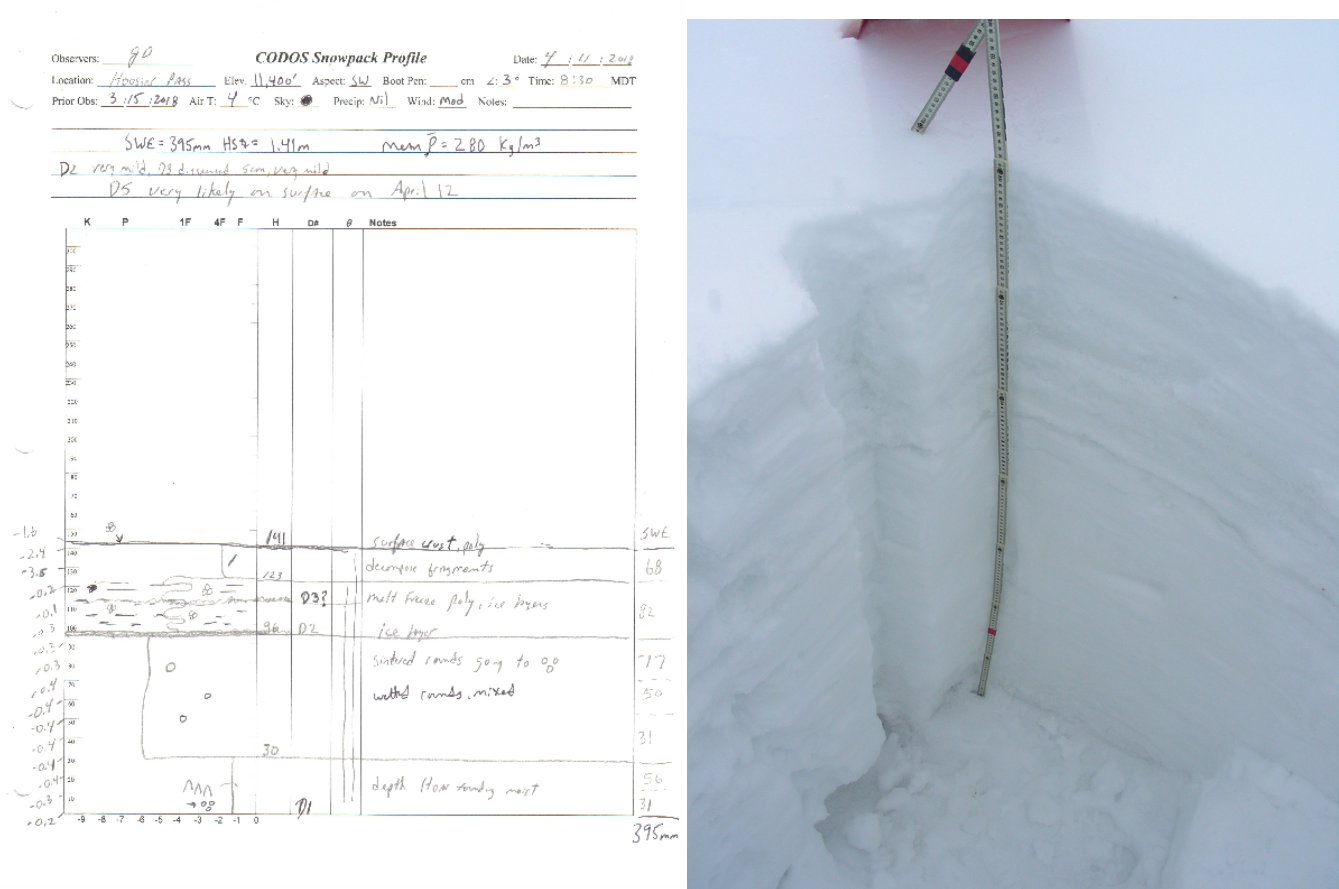
Hoosier Pass – April 11
Snow profile at Hoosier revealed very mild dust from D2-D4. The site was not revisited on April 19 due to lack of daylight and an approaching storm. Given the extent and severity of D5 across the state, including Aspen and Monarch Pass where there is moderate dust on the surface, we are assuming D5 is also present at Hoosier Pass and also of moderate severity.
Using the DERC approach WY2018 at Hoosier Pass has unfolded with “Average” March 1st SWE, “Average” Dust intensity, to date, and overall near “Average” spring precipitation, so far. In our March 1st Update we posted the following analysis of WY2018 that narrowed the DERC possibilities for Hoosier Pass to prior Water Years with “Average” March 1st SWE. 2010, 2012, and 2016 is a close comparison.
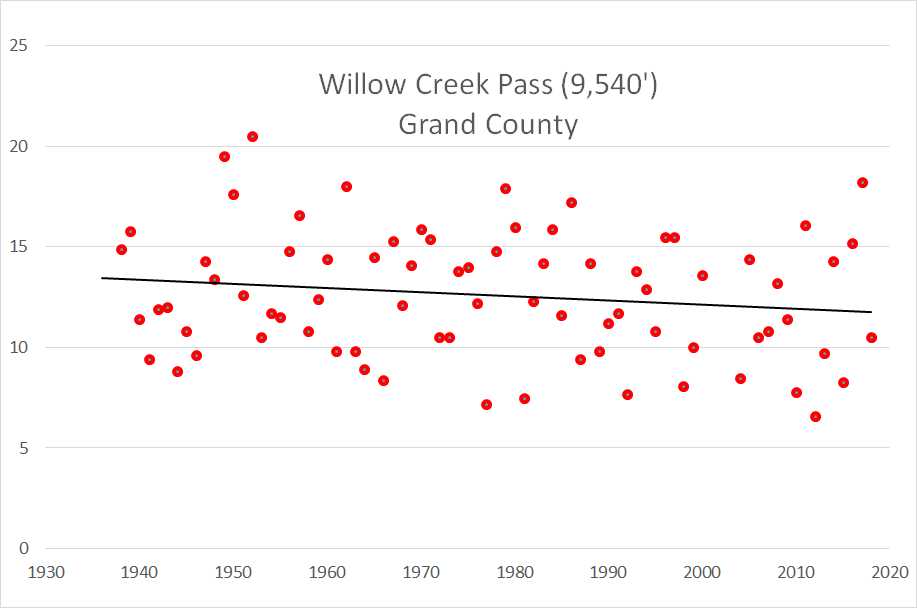
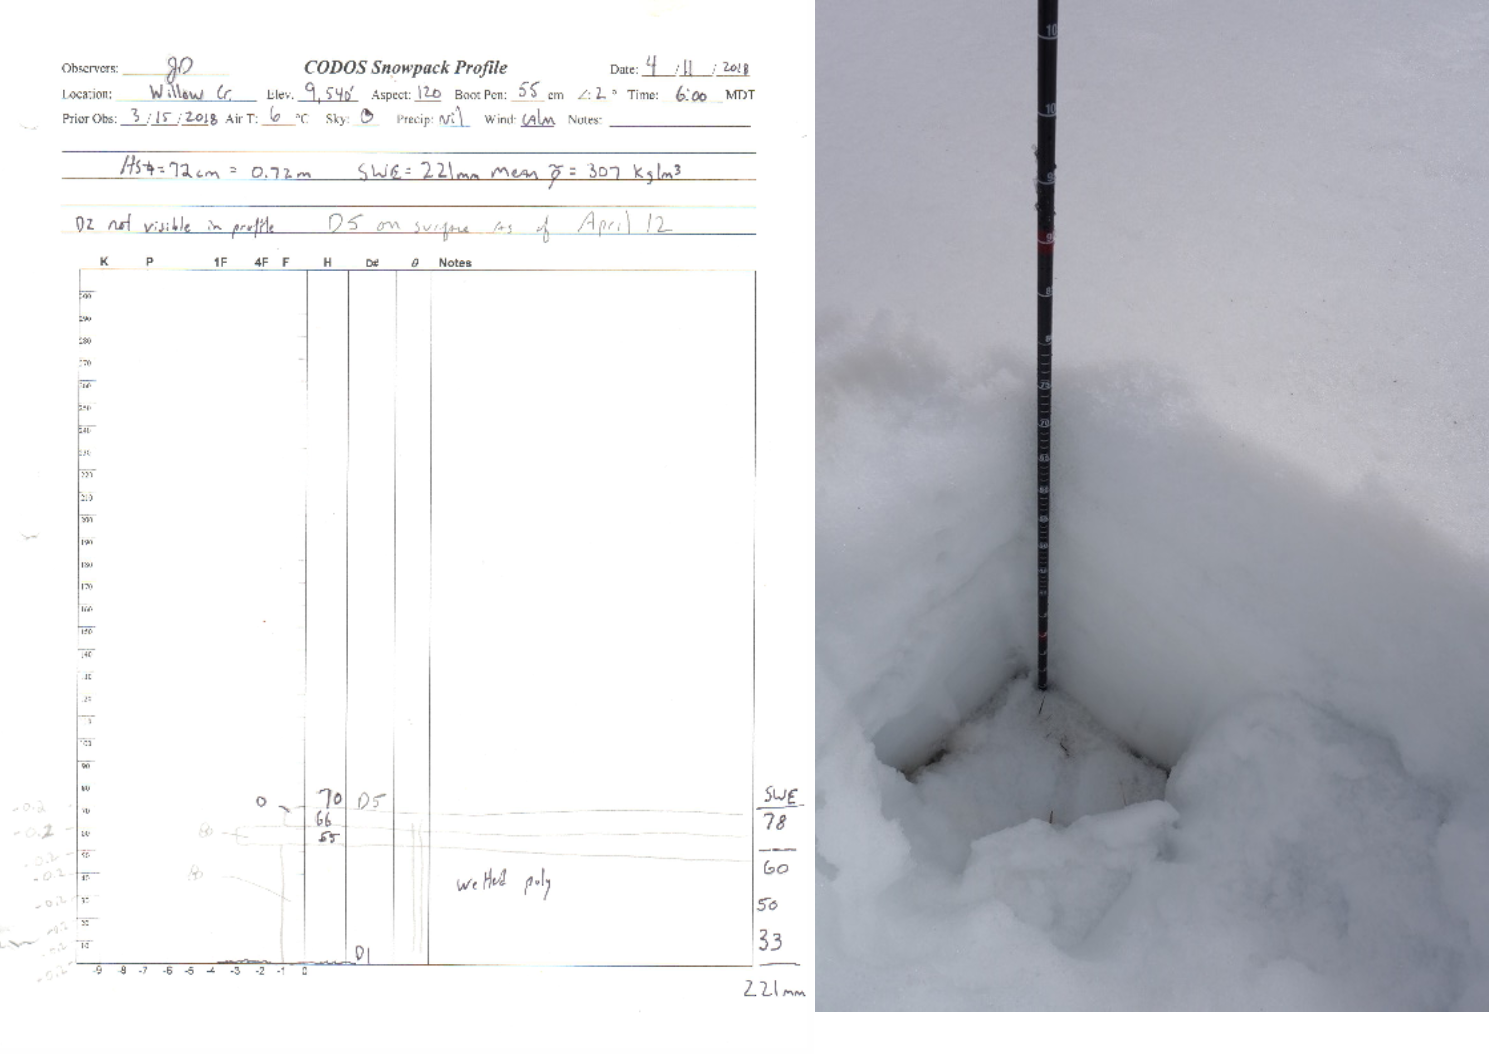
Willow Creek – April 11 and April 19
Willow Creek revealed no observable dust on April 11. On April 19 D5 was very apparant but slightly less intense as Berthoud. A bit of leaching had occurred at the surface as there was no clean snow capping the dust so more melt had occurred over the last week. Willow Creek teetered between "Min" dust and "Average" dust severity, but considering the dust observed on the landscape driving to Willow Creek - which is considerable - pushes the classification to the "Average" category.
Under the DERC approach, WY2018 at Willow Creek Pass has unfolded with “High” March 1st SWE, “Average” Dust intensity and “Wet” spring conditions, to date. In our March 1st Update we posted the following analysis of WY2018 that narrowed the DERC domain for Willow Creek Pass to prior water years with High March 1st SWE, WY2011, WY2014 offer the best comparison:

Dust visible in the foreground of the photo.

Looking at landscape near Willow Creek sample area.
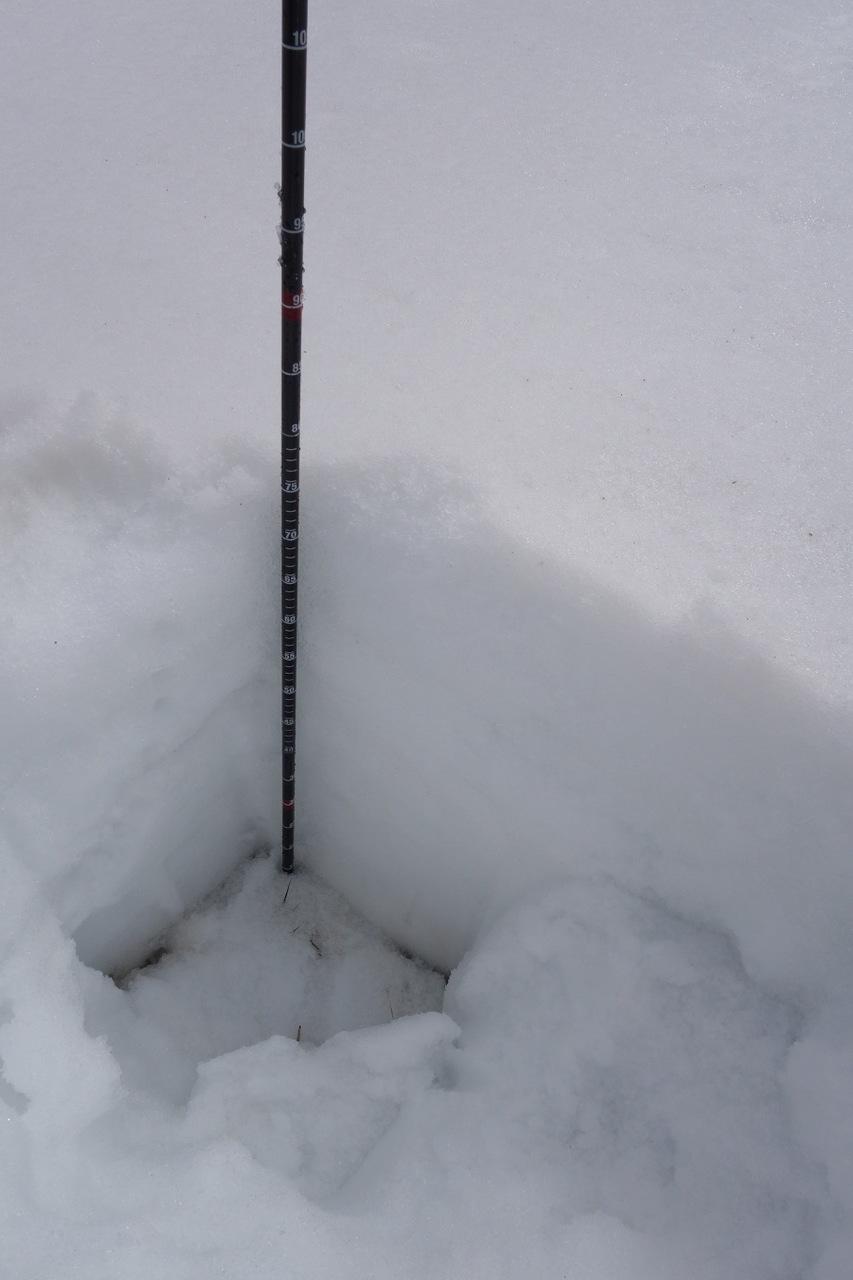
Snow pit at Willow Creek. Dust at the surface. More melt has been occurring at this site and a bit of leaching of dust in the wet snowpack.
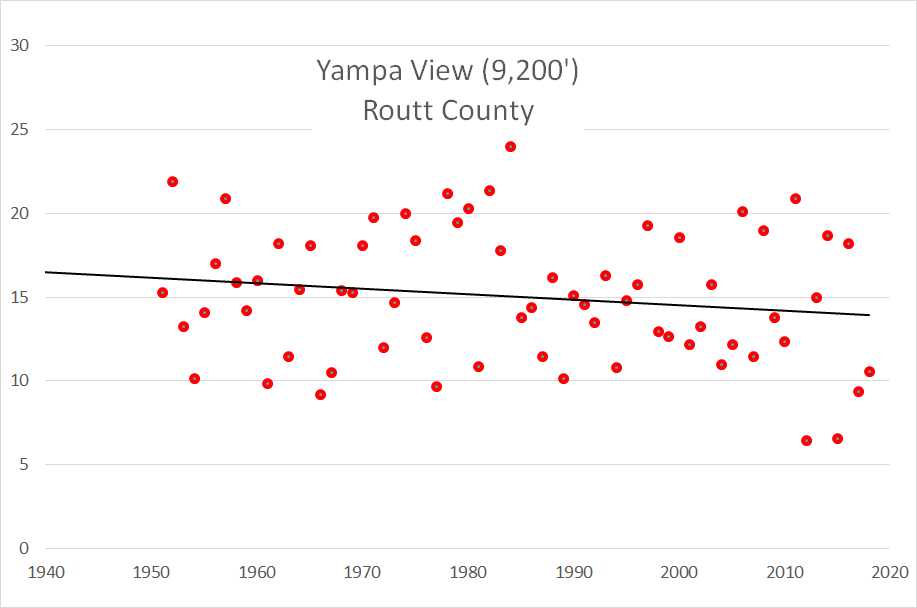
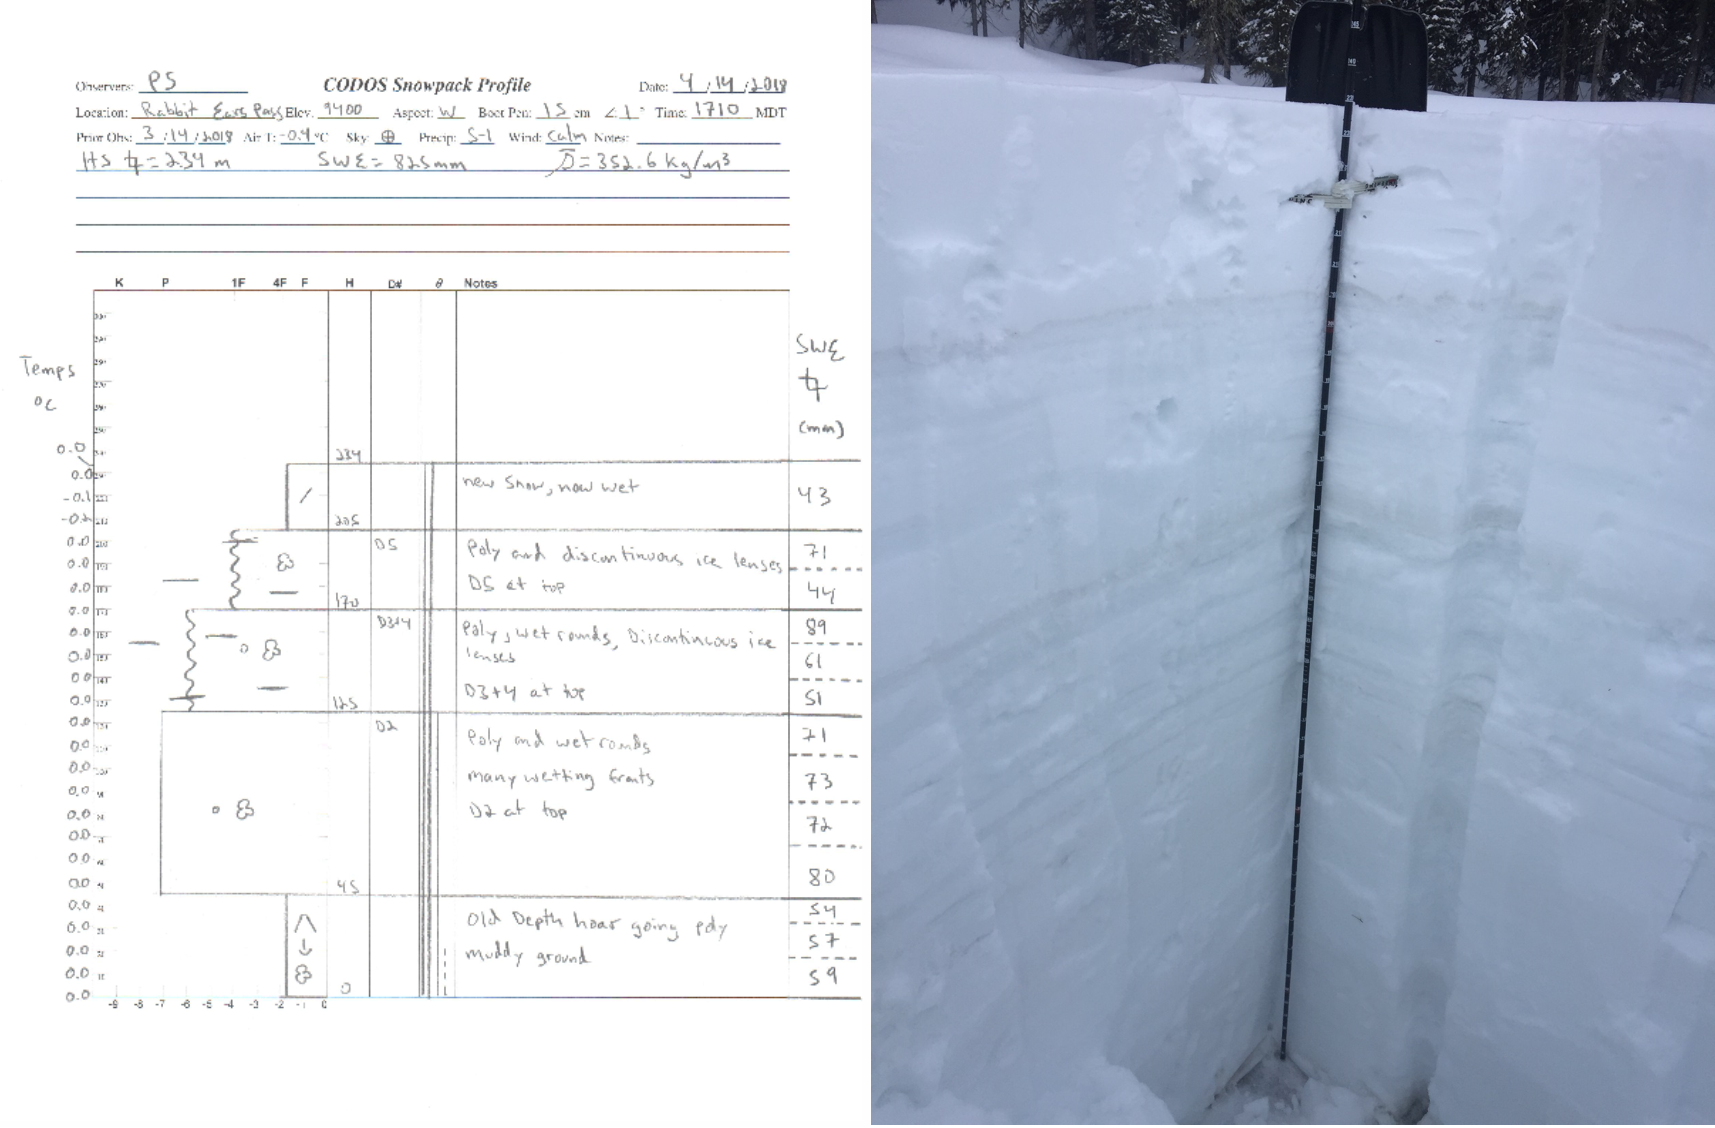
Rabbit Ears Pass – April 14
Rabbit Ears Pass has gained 15” in SWE since our March 14 visit and is also now isothermal. Dust was 7.8” below the surface and not visible on the landscape except at lower elevations. The dust within the snow pack is dark and very visible. D5 is ~12” above D3/D4, and D3/D4 is ~20” above D2 at this site.
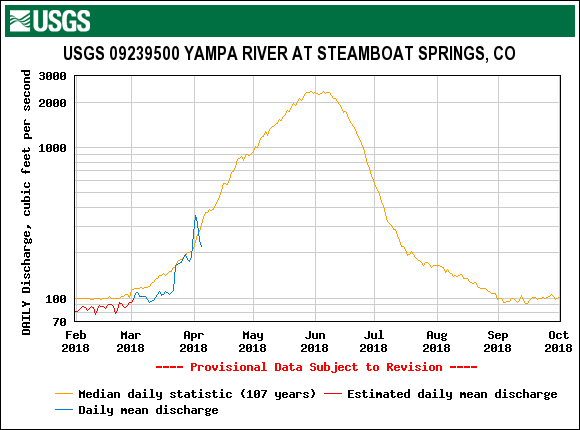
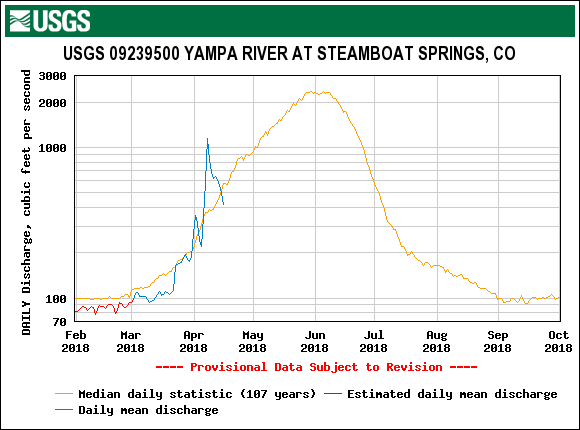
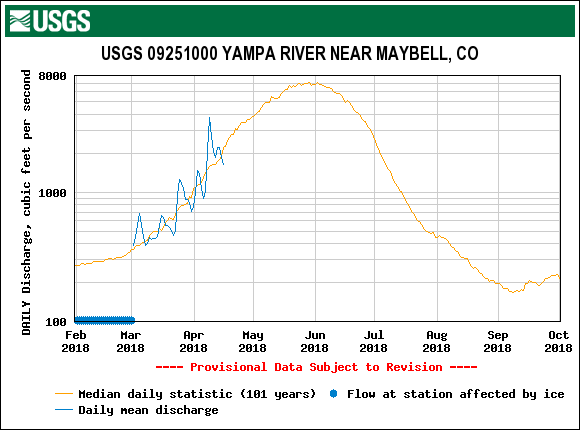
Rabbit Ears and Northern Colorado in general have benefited nicely from recent April storms. This year, the Rabbit Ears SNOTEL was showing “Low” March 1st SWE under our DERC Classification framework and is currently showing “Average” dust. Precipitation wise Rabbit Ears is having a “Wet” spring. Yampa River hydrographs for other years with Low March 1st SWE are in the linked slideshow below:

The Rabbit Ears dust situation taken as a whole is average. It is one of the few areas very near average snowpack for the season.
Grand Mesa – April 14
All five of this seasons dust events have now been observed at Grand Mesa. D3-D5 is 14” below the snow surface, and D2 is 10” below D3-D5. Both dust layers are very evident in the snowpack and on the surface across the landscape where new snow had blown away. Dust is also on the surface at lower elevations. Snowpack deteriorates rapidly below 10,000 ft. Grand Mesa CODOS sample site gained 4.2” SWE since mid-March and the snowpack is isothermal.
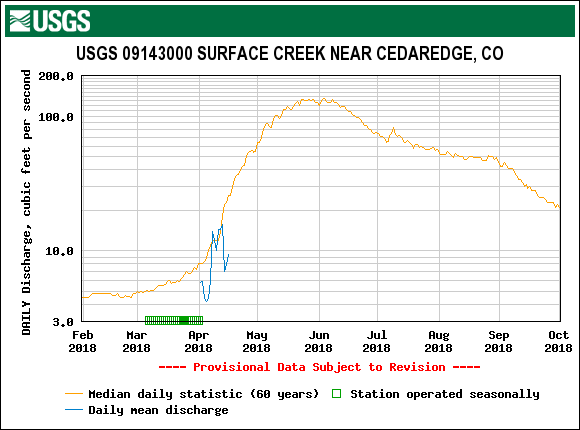
With five observed dust events this site is solidly within our “Average” dust realm in the DERC model. March 1st SWE was classified at “Low” and so far the site is experiencing “Dry” spring precipitation. Links to Plateau and Surface Creek below contain DERC slideshows for downstream runoff in other “Low” March 1st SWE years.

Grand Mesa snow profile on April 14. D3-D5 is ~14" below the new snow accumulation. D2 is ~10" below D3-D5. The cards mark the dust layers
Fresh snow overlays D3-D5 by ~14, but it is on the surface at lower elevations
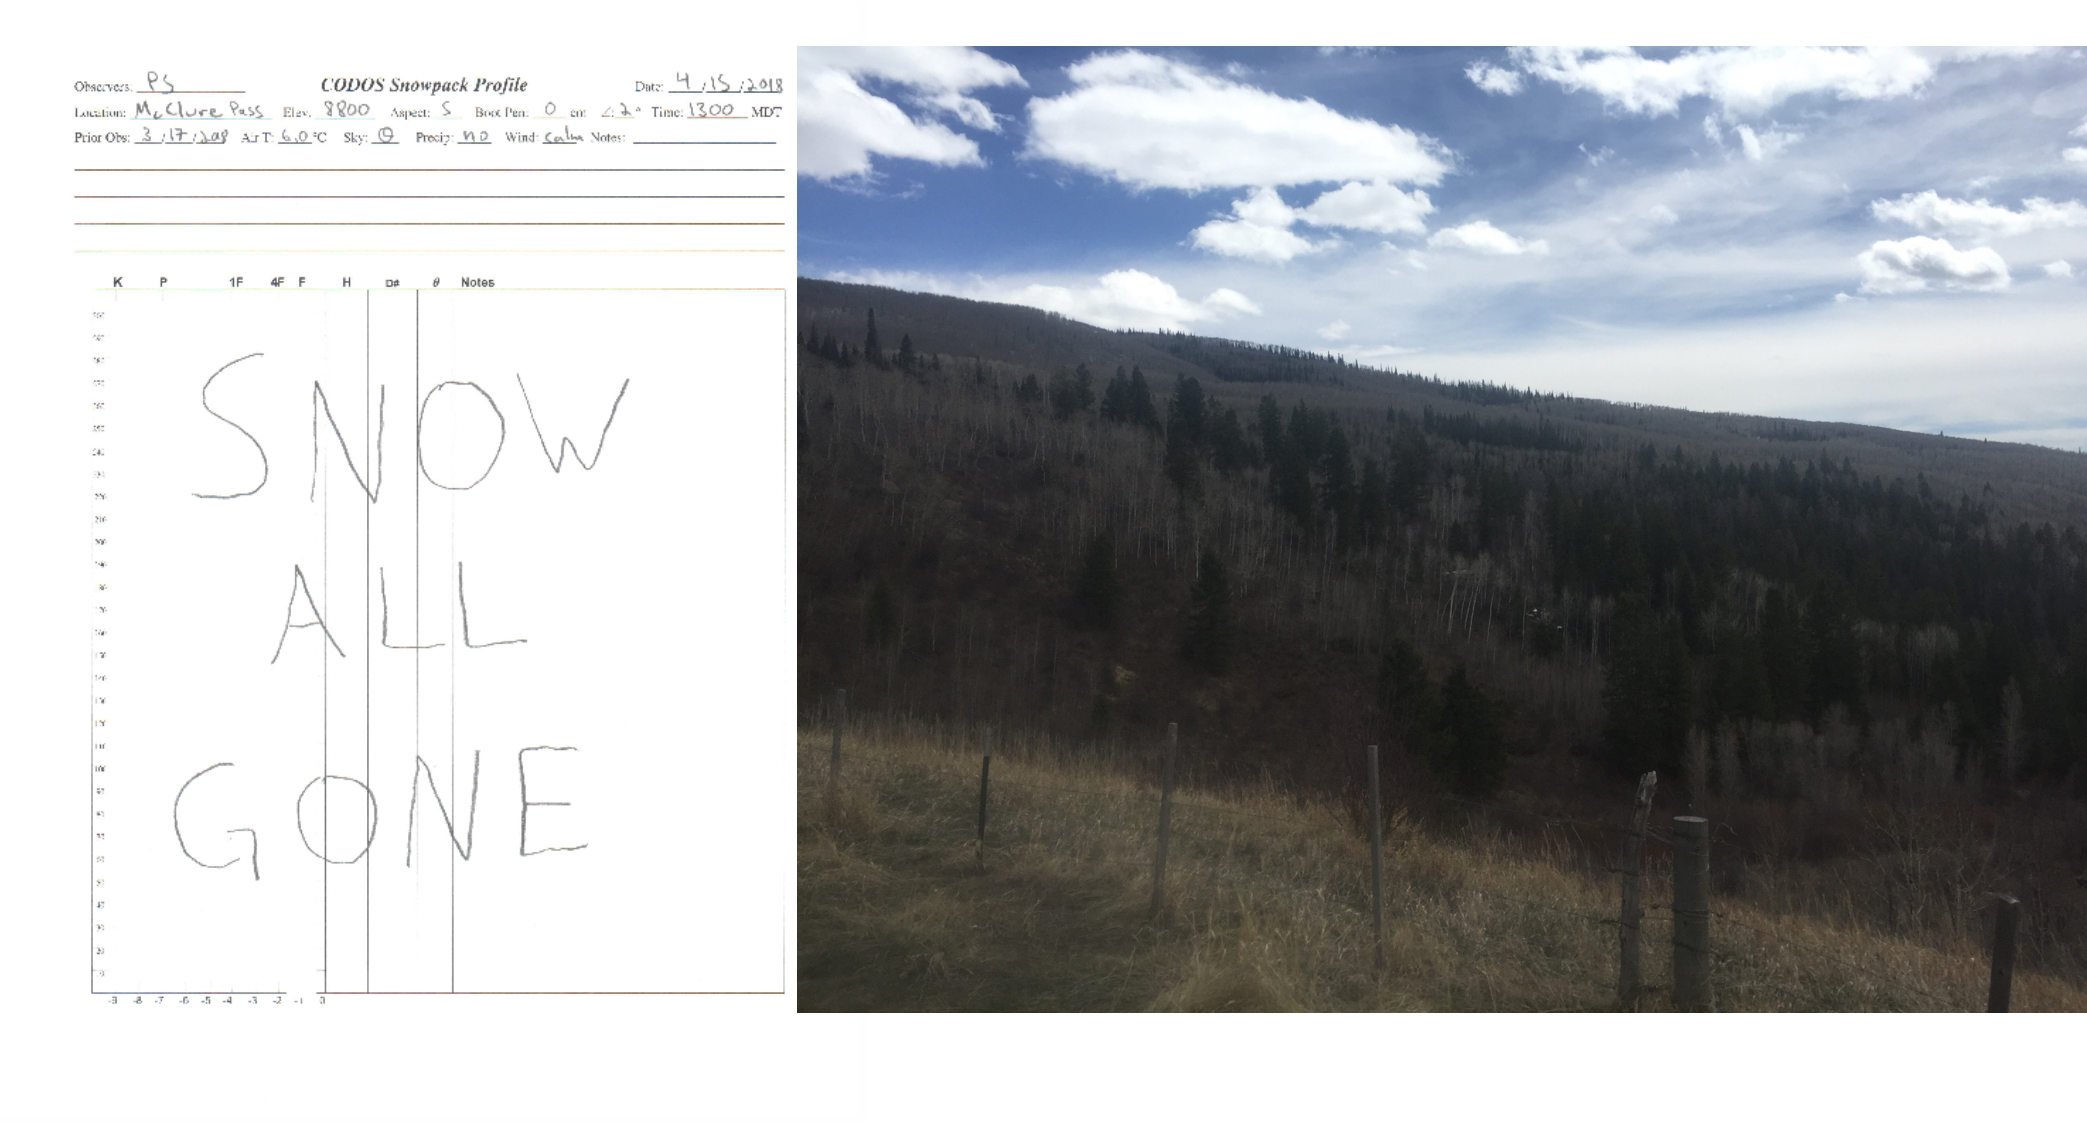
McClure Pass – April 15
Our March CODOS visit to McClure Pass revealed a very dirty D2 layer, springtime conditions and isothermal snowpack. Since then, the snowpack has fully depleted. The landscape surrounding the pass is dry. All-layers-merged samples were taken from isolated patches near the study site. We visited McClure on April 15, one of the few isolated patches remaining in the area was located right on top of the McClure SNOTEL pillow, on that day the SNOTEL was reporting 3.6” of SWE. Unfortunately, the picture we took of the pillow was lost.
McClure Pass was soundly in our “Low” March 1 SWE classification under our DERC framework this year. Dust in the region is “Average” and the site (obviously) is “Dry” spring conditions. The three DERC slideshows linked below are from downstream waterways and contain hydrographs from other years with “Low” March 1st SWE.

Photo looking up the McClure Pass near the CODOS sample locations.

Some snow can still be seen at the very tops of the surrounding mountains near McClure.
Weather & Climatology
The arid dust source regions of the Four Corners have been in an extreme or exceptional drought most of winter with conditions deteriorating incrementally. Staying consistent with the forecast this entire winter, the one month regional predictions are for well-above average temperatures and below median precipitation. As spring moves forward we will be watching both the mountains and the desert for changes in dust and dust available for transport.
On April 19th a closed low pressure system will enter the Four Corners region and if forecasts hold this system will deliver moderate snowfall to the mountains, along with strong winds. Prior to reaching the San Juans the system will track through Northern Arizona, our dust source region. While the desert will see a bit of rain it appears that the precipitation there will be preceded by fierce winds, and a dust storm warning has been issued. This warning will remain active through Thursday evening. Here in the San Juans we are anticipating more dust loading to accompany this storm system, so keep an eye out for potential alerts on this event.