SUMMARY
Colorado has begun March with low SWE conditions dominating most parts of the state. Only the Northern Front Range area and North Eastern Colorado has closer to average SWE conditions. This update summarizes snowpack conditions state-wide and evaluates March 1st snow water equivalent (SWE) data from SNOTEL stations associated with our eleven CODOS sites and places them within the framework of the Dust Enhanced Runoff Classification scheme (DERC) developed by CODOS. A summary is presented by individual Basin, and provides site-specific analyses for each CODOS site (linked at bottom of page).
SNOWPACK CONDITIONS
Snowpack conditions for this time of year are very low in many parts of the state. The average of the major basins’ percentage of median March 1st SWE is 74%. Individual SNOTEL station SWE throughout Colorado ranges from 21% at Grayback in the Rio Grande Basin to 131% at Buffalo Park in the Upper Colorado Basin. This winter’s drought is being felt in most parts of the Western United States, with the only major exception being the Northern Greater Yellowstone Ecosystem region of Montana, Idaho and Wyoming and parts of the Washington Cascades. Much of the Western US is seeing SWE conditions of less than half of median for this point in the year.
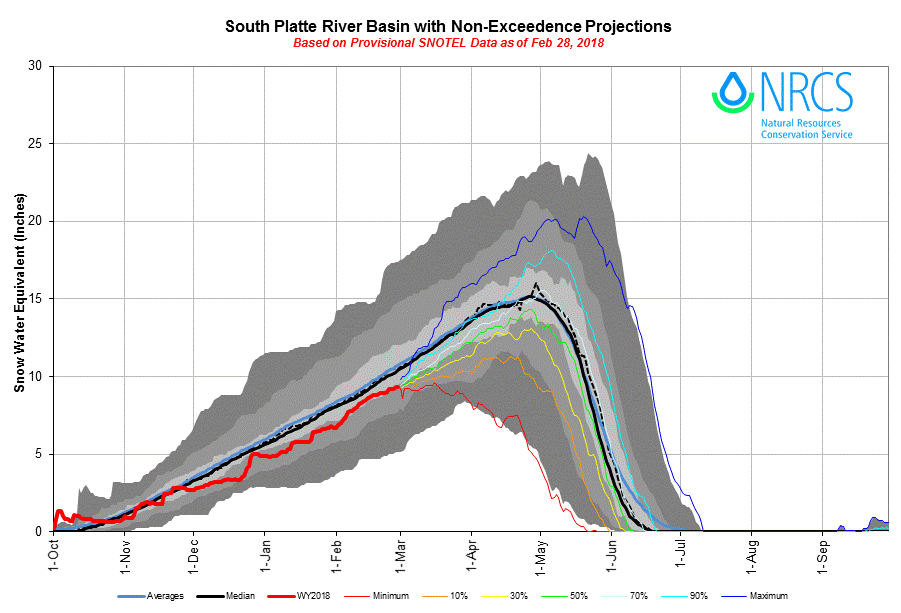
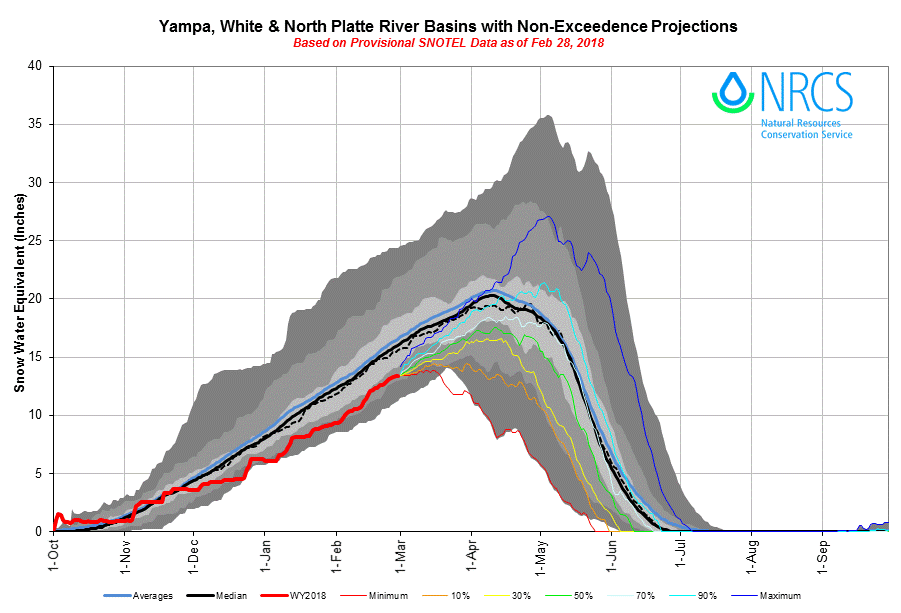
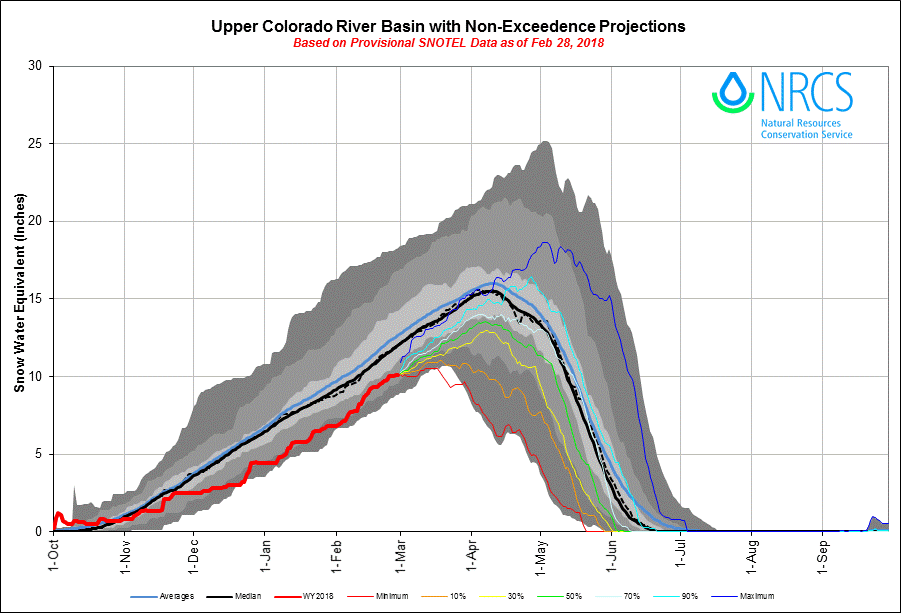
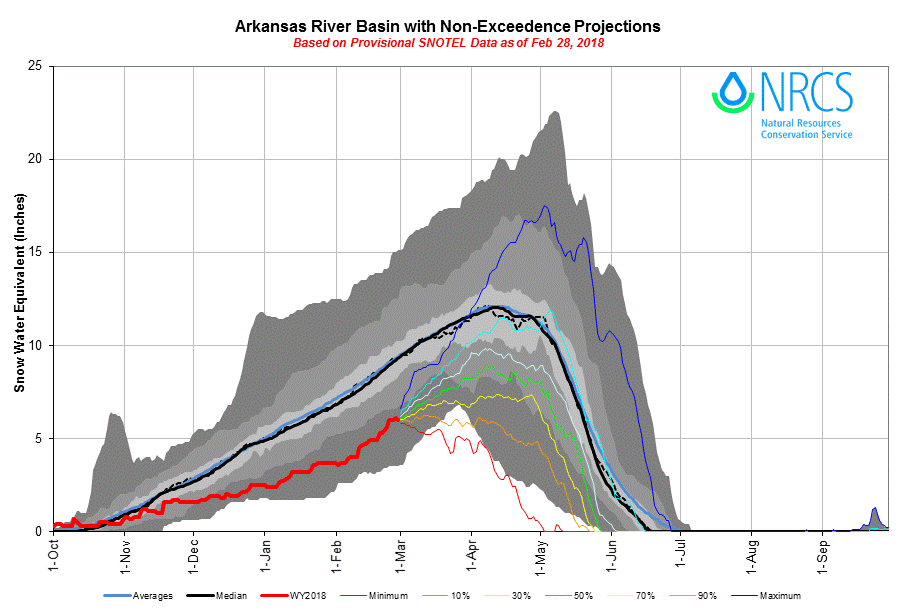
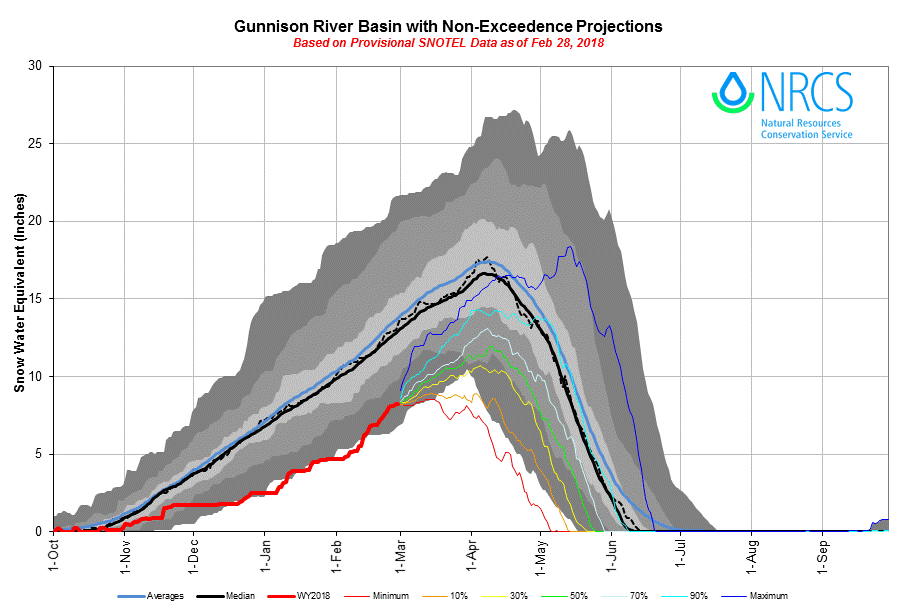
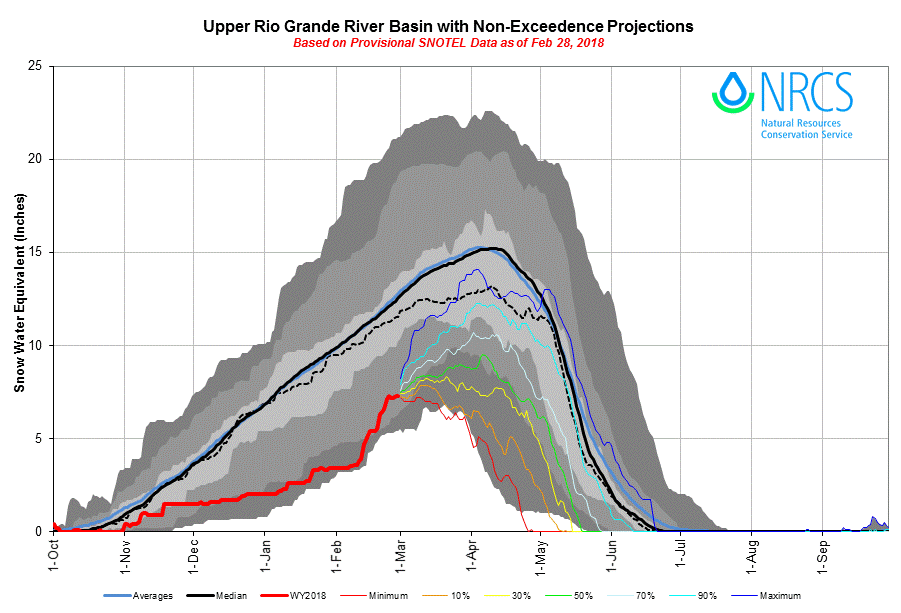
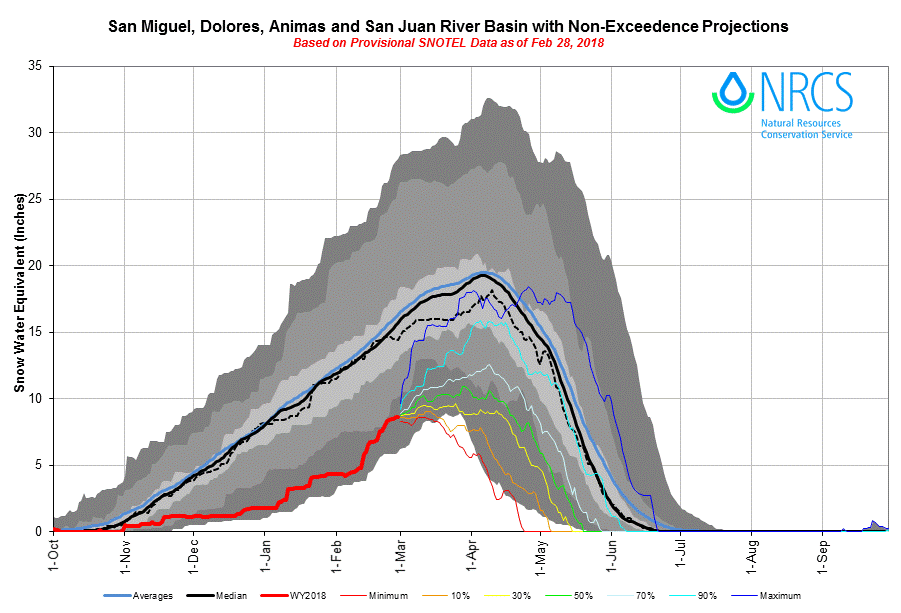
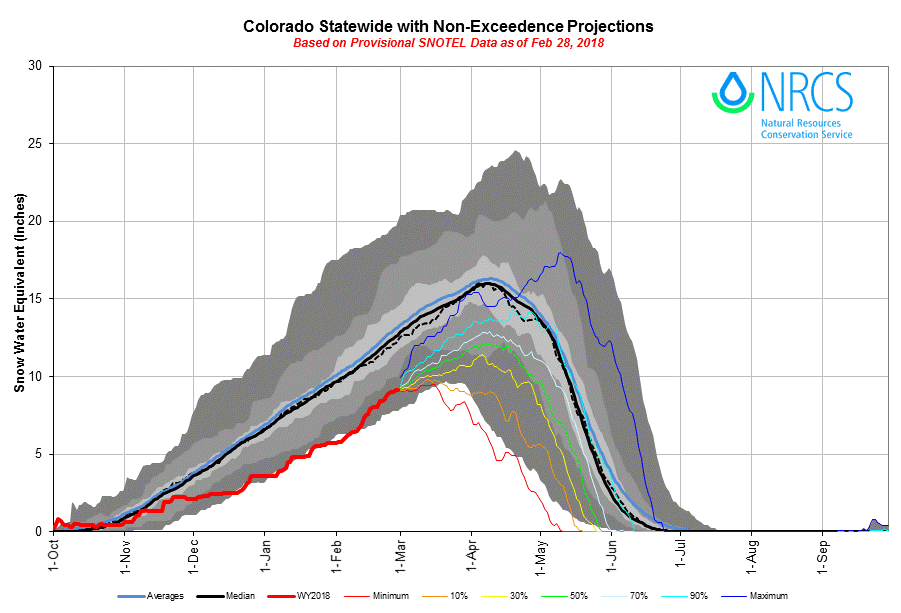
The NRCS basin-scale SWE condition plots below use non-exceedance probabilities to project a range of future snowpack conditions, from the least likely (historical max and min traces) to the most probable (50% trace), based on the historic record. NRCS indicates over a 90% non-exceedance probability of achieving at least a median snowpack, meaning there is less than a 10% chance of achieving median snowpack on a statewide scale this year. Only the South Platte and North Platte Basins are within normal average ranges, and Southwest Colorado is within a historic low SWE bracket. As they become available in early March, similar NRCS site-specific projection plots will be posted to each CODOS site’s web-page.
To augment SNOTEL data and better understand snowpack conditions it is important to consider data collected in Senator Beck Study Basin (SBSB). SBSB is located at, or near, the headwaters of four major watersheds (Animas, Uncompahgre, San Miguel, and Rio Grande) and is the only high alpine study site in the region collecting comprehensive snowpack information. Being a headwater study basin, the elevations that we collect snowpack information and continue meteorological station monitoring is well above the highest of most SNOTEL stations.
Senator Beck Study Basin location near Red Mountain Pass near Silverton, CO. Elevation of the Basin ranges from 11,030’ at the stream gauge to 13,510’ at the crest of the peaks. The blue line delineates watershed boundary. Senator Beck Study Plot and Swamp Angel Study Plot are the locations of highly instrumented meteorological stations and is also where snowpack data is collected
Snowpack at the Swamp Angel Study Plot (SASP) is significantly below average in both snow height and SWE. The same is true for the Senator Beck Study Plot (SBSP), which is more exposed and at a higher elevation than SASP. The Senator Beck Basin has only received 8 winter storms so far this season that delivered more than 12mm of SWE, while the average number of these storms at this time of year is closer to 20. The month of February helped make up for lost ground, we observed 17 days of precipitation (average is 16), 5 winter storms, and 5” (125 mm) of precipitation. Thus far, WY 2018 cumulative precipitation is 12" (306 mm), average is 22" (553 mm).
Plot of SWE at Swamp Angel Study Plot for the last 15 years. WY 2018 is the red line. February 28 observed SWE (12.2”) is the lowest on record.
Plot of snow depth at SASP. Red line is current WY 2018.
Plot of SWE at Senator Beck Study Plot for the last 15 years. WY 2018 is the red line.
Plot of snow depth at SBSP. Red line is current WY 2018
Storm opportunities also mean dust opportunities. In February we received 5 winter storms and one significant dust-on-snow event.
WINTER WEATHER SUMMARY: AN ABNORMAL PATTERN
The consistency of Northwest atmospheric flow during early part of winter lasting though January is responsible for the great disparity in snowfall across the West. For the majority of the winter there has been a stationary atmospheric ridge sitting over the west coast. This pattern is most prominent in the jet stream, a high elevation wind pattern which steers large scale weather systems like storms along it’s path. The resilient shape of the jet stream this winter has deflected and directed the majority of moisture-laden systems into a Northwest flow regime. This pattern heavily favors areas such as Montana while leaving California, Oregon, southern Idaho and Southwest US region high and dry. Here is a link to a great description about this “ridiculously resilient ridge” and it’s relationship to the historic fire season in California, and is very applicable to Colorado’s low snow year as well: http://weatherwest.com/archives/tag/ridiculously-resilient-ridge
El Niño Southern Oscillation (ENSO) has also contributed to this incredibly dry season as well. ENSO is a large-scale pattern in sea surface temperatures which has a major influence on weather in the Western Hemisphere. This coupled ocean-atmosphere phenomenon has been presenting moderate La Niña conditions this year, and some of the weather we have experienced over the winter can be linked to this pattern. La Niña conditions occur when cool sea surface temperatures dominate the equatorial region of the Pacific Ocean. It is typical of a La Niña year to see diminished snowfall and warm temperatures in the Four-Corners states and other regions of the Southwest US. We are now pleased to see ENSO conditions rapidly returning to neutral where they are expected to hover for the remainder of the winter. Hopefully this pattern shift will usher in additional spring precipitation so we can continue to build SWE in our basins through the spring.
Even with this ENSO pattern shift we are still expecting above average temperatures and below average precipitation through at least May. These long-term outlooks are rough estimates, but they are about as accurate as we can be at this point in predicting more long term climatological trends. See the plots below:
2018 ENSO index
Keep in mind that these are very long-term projections, especially the MAM outlook, and act more as guidelines for the most likely average conditions based on historic and current climate data.
DUST-ON-SNOW AND DERC CLASSIFICATION
Over the course of our 2005-2018 period of rigorous observations, March 1st has marked the beginning of the heart of “dust-on-snow season” for the Colorado Mountains (see the CODOS Dust Log chart of dust events by month). So far for WY2018 at Senator Beck Basin, the primary ‘sentry site’ for the CODOS program, we have logged two dust events. The first of these only effected the early season snow and is now diffuse in the basal layers of the snowpack and will not have any hydrologic consequences. Our second event of the season came in on February 18th-19th and is a bit more than a meter off of the ground, meaning that once exposed this layer will impact melt rates in the spring. Currently this dust layer is hard to see due to its diffuse nature, but it may become more visible as settlement occurs, and once it coalesces at the surface it should be very visible. Unless conditions change, the CODOS team will do our first state-wide dust assessment of the season around March 19-23. We try to time our trips to best capture documenting dust in/on snow conditions, if there is plenty of fresh snow accumulation and minimal dust we delay the tour, but if we feel dust layers are near the snowpack surface we hit the road to determine the potential short-term and latter melt season impacts.
As of March 1st, Colorado SWE remains “low” among all major basins. DERC “Average” SWE equals day median +/- 10%, and deviation above and below those limits are assessed as having “high” or “low” SWE. The basins listed below are classified according to the appropriate DERC classification of either Low, Avg, or High March 1st SWE layer domains.
Basin scale WY 2017 March 1 SWE conditions (NRCS data) classified using the Dust Enhanced Runoff Classification Scheme described CODOS main webpage
As described on the CODOS website, the DERC framework is utilized to identify prior years with similar patterns of dust-on-snow intensity, March 1st SWE, and spring precipitation conditions, and their associated hydrographs. March 1st SWE analyses have been performed for each CODOS site. From this, hydrographs from 2006-2017 with associated March 1st SWE conditions have been identified and included in the analyses.
An ‘exploded view’ of the Dust Enhanced Runoff Space, separated by March 1 SWE classifications.
Precipitation in the dust source region (Southern Colorado Plateau) has been slim this winter, leaving us worried about the potential for a heavy dust season. The image below shows soil moisture ranking percentiles for areas including the Southern Colorado Plateau. It now remains to be seen how WY 2018 dust conditions and spring precipitation evolve, and to further define the set of plausible hydrographs using prior season examples.
Estimated soil moisture ranking percentiles as of February 28th, 2018.
CODOS SITE-SPECIFIC ANALYSES
For individual SNOTEL stations associated with our eleven CODOS sites, March 1st SWE ranges from 48%-112% of median levels. March 1st SWE conditions were classified for the SNOTEL station directly associated with each CODOS site, and also for select nearby SNOTEL stations. Prior seasons with similar March 1st conditions were identified and placed within the appropriate dust enhanced March 1st SWE space. Local watershed hydrographs (from 2006-2017) associated with those March 1st SWE conditions are presented as plausible examples of runoff behavior in spring 2018, with the understanding that these prior years exhibit a limited variety of 2006-2017 dust and spring precipitation conditions for each CODOS site. Water forecasting in extreme years is particularly difficult. In this extreme dry year in most of Colorado many SNOTEL stations are reporting in the single digit percentile for their POR, the hydrographs included in the DERC classifications are worth reviewing to get an idea of what we could potentially be in for in terms of runoff behaviour. Many hydrographs in the DERC classification under low March 1 and dry spring conditions show peak streamflow upwards to a month earlier than the median for many watersheds.
These analyses are presented in PDF format and are available for the watersheds listed below (in alphabetic order):


