

SUMMARY
After a worrisome October and November when Colorado received very little precipitation and experienced very warm temperatures, winter finally kicked into action and Colorado started receiving abundant snowfall, building the snowpack rapidly during the months of December, January, and into February. One of the big stories this winter season is the atmospheric rivers that fueled these productive storms, which were record breaking in some locations. On the other end of the spectrum, one of the other big stories this winter is the observed warmest March on record. The effects of this hot month (preceded by a very warm February) was a rapid warming of the snowpack and snowmelt at lower elevations and valleys, resulting in most stream gauges observed a 2-3 week bump in stream flow in mid-March thru the first part of April. However, Colorado recovered from the hot/dry spell with a long stretch of regular precipitation beginning around March 23 – April 4. A dry spell was again repeated April 5-19. And, starting the latter part of April regular precipitation (however sparse) was observed steadily but intermittently until June 1.
At the Center for Snow and Avalanche Studies’ (CSAS) Senator Beck Basin Study Area (SBB) at Red Mountain Pass, the primary Colorado Dust-on-Snow Program (CODOS) monitoring site, WY2017 produced a total of four separate dust-on-snow events, on the light side of a typical dust loading season based on observations going back to WY2005. Dust season began relatively late in the season. With the abundant moisture in the dust source area, the Southern Colorado Plateau, dust mobilization was kept in check until March when soils started drying out. Dust-on-snow events March 5, 23, 31 and on April 9 were documented. Surprisingly no dust events were observed the rest of April and May, although a couple haze events were noted. On June 12 a big dust storm in the desert southwest was observed with the USGS dust cameras, additional dust on any remaining snow in the Colorado Mountains was not observed at lower elevations, but it is possible some higher elevation snow cover could have received additional dust from this event. Of the four documented dust events, two of these events were pretty heavy in their severity. The end result, even though total mass loading of dust was light, with the location of the dust in the snowpack (i.e. upper portion) and its consequential role in snowmelt, we classified dust severity as “Average”, albeit the lighter side of average at SBB. Northern and some Central CODOS sample sites in Colorado were classified as “Minimum” dust severity. The transition from “Average” to “Minimum” severity took place in Central Colorado, thus some Central and all Southern CODOS sites were classified as “Average”.
This Season Summary will often reference or link to snowpack, streamflow, weather, and climate products generated by the NRCS SNOTEL program, USGS National Water Information System, and NOAA National Weather Service and Climate Prediction Center respectively, as presented and archived on CODOS monitoring site webpages.
MONTHLY WEATHER CONDITIONS
October:
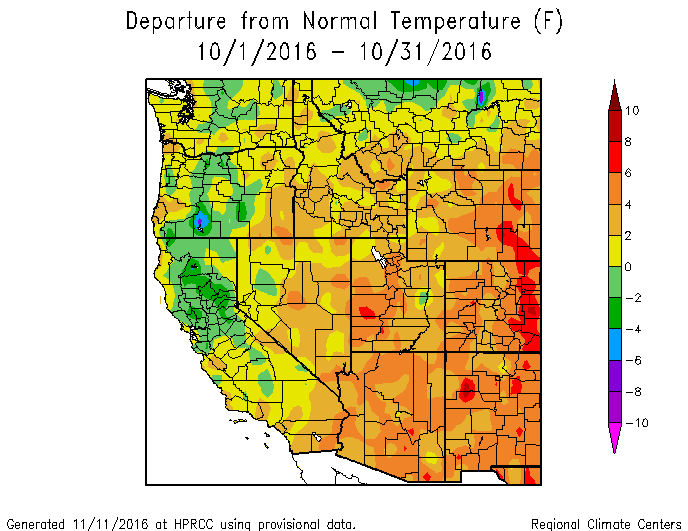
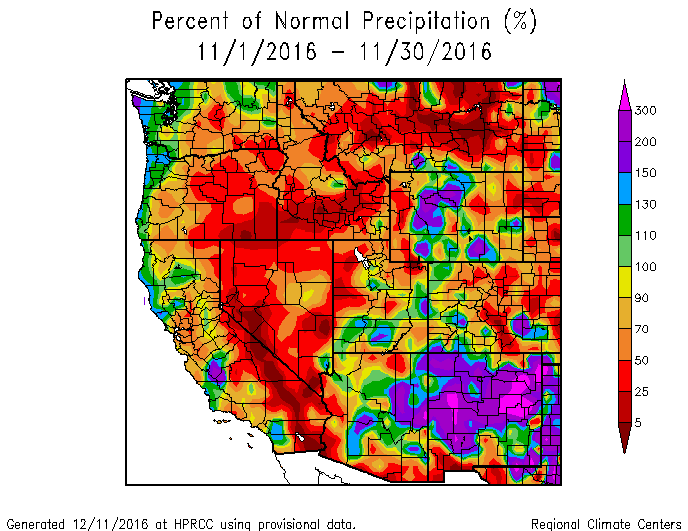
October was a very dry month, with no winter storms and only 0.8” of precipitation. This is about one fifth of average precipitation for the month. Only 0.4” of precipitation came in as snow and warm temperatures characterized the majority of the month. October’s precipitation did not contribute to our season snowpack in SBB. For our period of record, 9 winter seasons out of 13 we have seen winter snow accumulation begin in October at Swamp Angel Study Plot (SASP).
November:
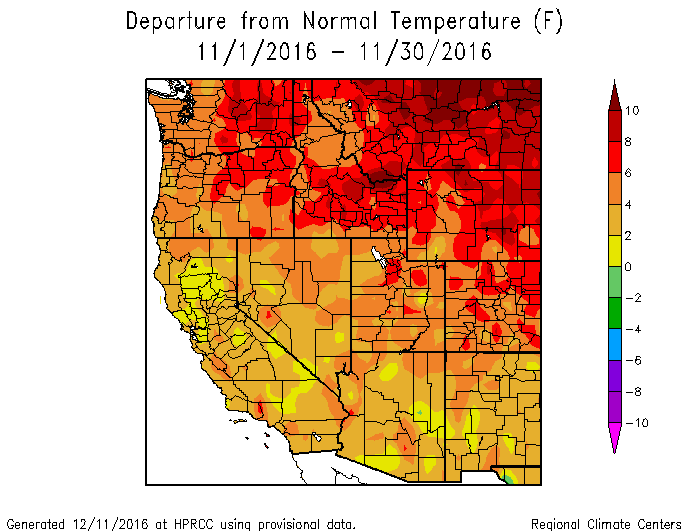
November started warm and dry, but about halfway through the month we began to build our season’s snowpack in the San Juan Mountains. This was the latest that snow accumulation began at SBB for our period of record (the last 13 years). Our first winter storm of the season was on November 17 and although it was a relatively minor event, this storm laid down our basal layer for the season. The second half of November was cold, with two additional winter storms and notable snow accumulation. Total precipitation for the month was 4.5”, all as snow, this is above average precipitation for the month. Latter November signaled the beginning of a very snowy early to mid-winter to follow.
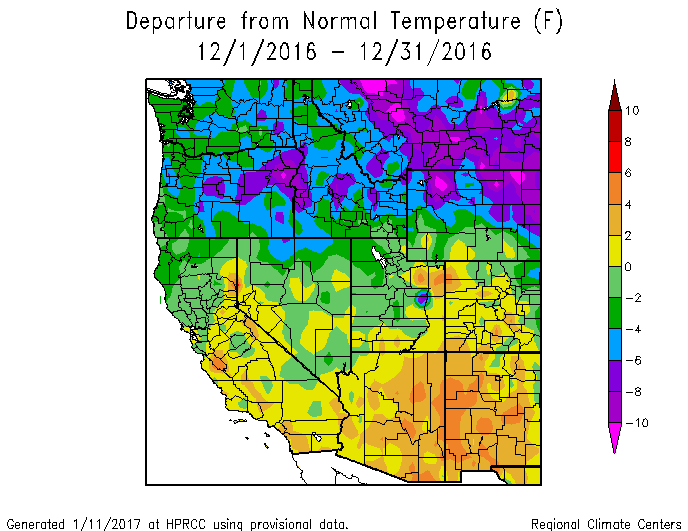
December:
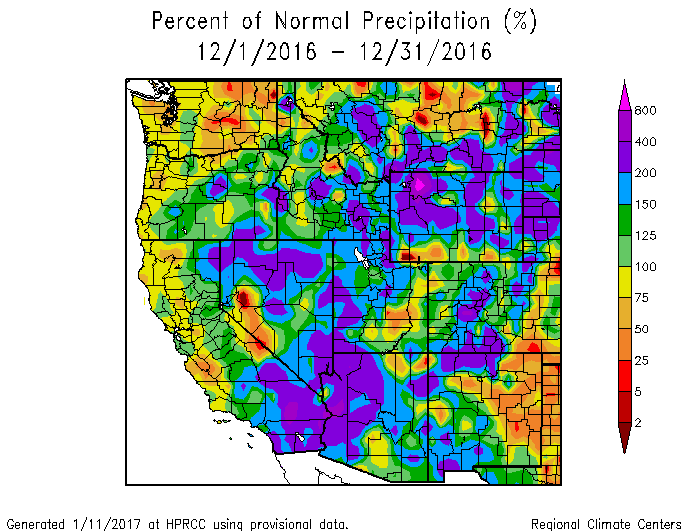
December was a generally cold and snowy month. Temperatures were consistently below average in the San Juan Mountains and precipitation all came in as snow. Precipitation was average at 5.3”, but December is historically our biggest month for winter precipitation. During the period snowpack in the SBB grew rapidly, with snow height at SASP at over a 3’ (1 meter) by the end of the calendar year. Because the month was relatively cold, there was less snowpack settlement, so the snowpack gained significant height for the amount of precipitation received. This set us up well for the exciting month to come.
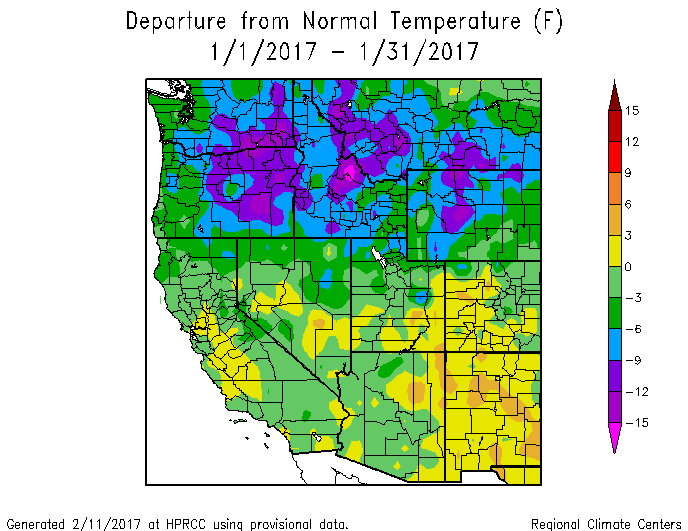
January:
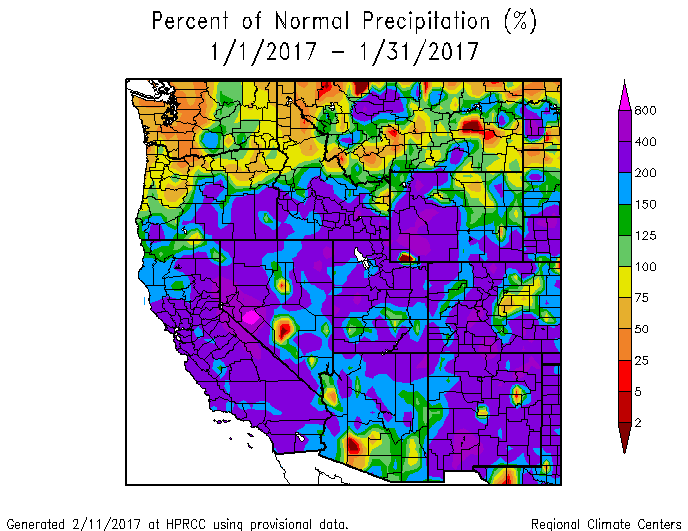
January was a month of historic snowfall and major increases in snowpack in SBB and state-wide. As a whole, temperatures were average throughout the month, although there were several swings between exceptionally warm and cold periods. With an incredible 8” of water over the course of 5 storms, precipitation for the month was 173% of average. This is the most precipitation recorded for any January in SBB since CSAS started monitoring 13 years ago, and it is also the fourth snowiest month overall during that same period. Snow height at SASP increased by about 3’ (1 meter) over the course of January, bringing our snowpack into the 7 foot (2 meter) range by the end of the month. Adding to the excitement, a large majority of this January snowfall can be attributed to atmospheric river events. Common to the Sierra, Cascades and other Maritime ranges in North America, atmospheric rivers are narrow bands of moisture which carry the majority of precipitable water in a given storm system. This warm water vapor, originating near the tropics, are essentially a firehose for precipitation, and in the San Juan Mountains we were right on track to get pummeled by several of these events. This is unusual. Atmospheric river features rarely make it this far inland and this year we received around five events in January and February! Please see links below related to atmospheric rivers in the “Looking Ahead” section.
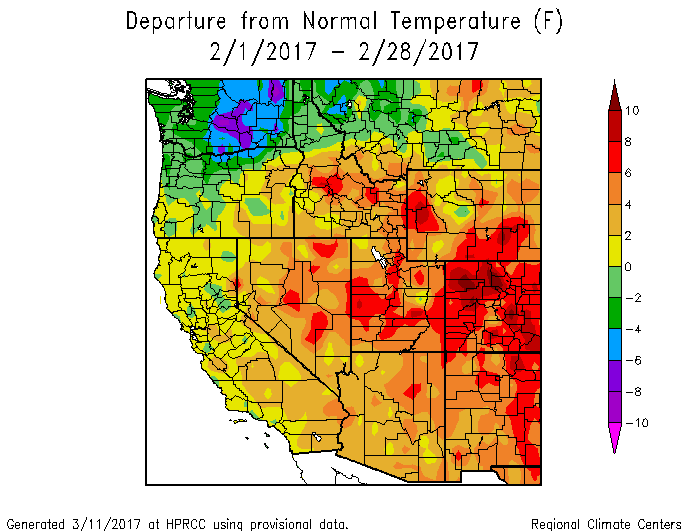
February:
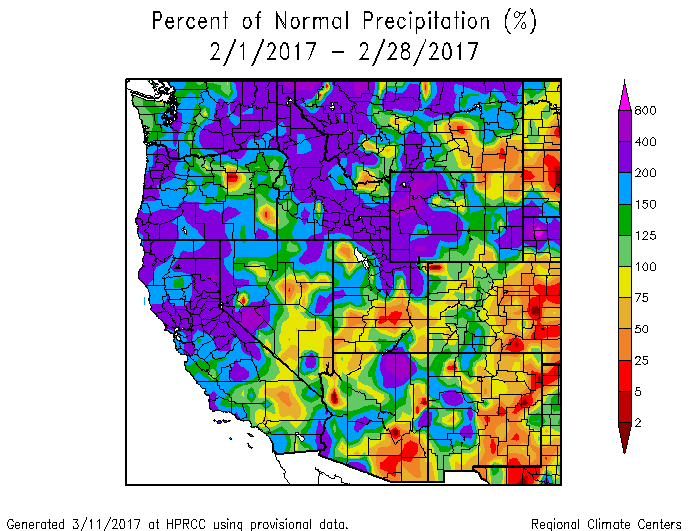
February saw significant declines in precipitation for the basin and well above average temperatures. Although February matched January for number of winter storms, the precipitation for the month was about half of the prior month with only 4”, which is slightly below average. Statewide temperatures were well above average, with many days setting significant record highs which made national news. These very warm temperatures, especially toward the beginning and end of the month kept snow height relatively level, with almost no net gains throughout the month. Height of our snowpack normally continues to build through February and March in the San Juans, but this year we saw a leveling off in snow height following an early February atmospheric river event, the last of the season. At this point, low to moderate snowfall and warmer temperatures played a game of accumulation versus settlement, and it essentially ended in a tie. SASP maintained about a 7-foot (2-meter) snowpack for the month. However, remember that even without gains in snow height, we still had input in SWE during the month and our snowpack remained above average from a total water standpoint.
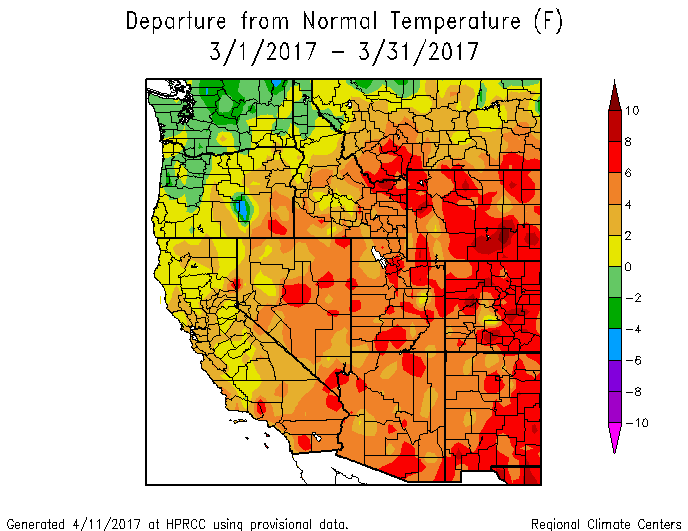
March:
One of the big stories this winter season was that Colorado had it’s warmest March on record. Despite the warm March snowfall remained about average thanks to an active period in the latter part of the month. With 4.6” of precipitation in SBB over 5 storms snowfall only made moderate contributions to the snowpack. Additionally, March was the beginning of our dust season, with three of our four dust events of the season occurring during the month. Dust event #1 (D1) and D2 were minor events and difficult to discern in the snowpack, although they still, when concentrated at the surface, contributed to the overall impact on snow surface albedo. Our third event (D3) was a significant wet event which drastically lowered snow albedo when exposed. In addition to dust increasing the absorption of solar radiation, very warm temperatures contributed to significant snowpack warming. SASP reached isothermal snowpack conditions on March 22, which is by far the earliest date for this condition on CSAS record. This warming of the snowpack resulted in the first spike in streamflow out of SBB for the season. Just as with February, March began and ended with about a 7-foot (2-meter) snowpack.
April:
April was yet another warm month, and precipitation was well below average. Only 3.3” of precipitation was recorded at SASP, which is about 68% of the CSAS 13-year average. SBB saw an additional dust event (D4) on April 9, the last recorded event for the season. This dry event was patchy in its accumulation, favoring lee slopes and north through east aspects, but was highly visible across the landscape. Peak SWE at SASP was observed on April 26, with 30” of water. During April there were also several periods of increased runoff, which were associated with warming events and the emergence of dust layers. See the section on the CSAS Dust Enhanced Runoff Classification (DERC) approach below for more information on these spikes associated with dust emergence.
May:
May, overall, was cooler than normal and, largely in mountain regions and Eastern Colorado, was wetter than normal. More specifically at SBB, a sunny and warm beginning and end to May was divided by a notably cold and stormy period. Precipitation was exactly average with 3” recorded at SASP. There were only two winter storms during the month, which is near average, and one was a significant event, delivering over a foot of snow to SBB. This buried our dust layers, all of which were merged on the surface at the time. Although this “albedo reset” was welcome, it was relatively short lived. Following this storm the temperatures soared and the dust was back on the surface in only a few days. Dust remained at or near the surface the remainder of the season thereafter. Many long-range forecasts suggested above average precipitation for May, and while there was notable precipitation this ended up falling a bit flat in some areas compared to the very optimistic precipitation outlooks. However, the month of May we observed precipitation 14 out of 31 days, and these minor precipitation events brought temporary cloud cover and reduced air temperatures, and dustings of new snow, which tapped the brakes on the rate of snowmelt. Although these periods were generally brief, they certainly had notable influence on delaying snowmelt at the end of what was an otherwise warm spring. Towards the end of May dusty conditions and decreasing albedo began to gradually dominate as streamflows climbed back to average and progressed towards their peak snowmelt discharge of the year. This general trend has occurred the past few winters where the San Juan Mountains (and Colorado in general) have seen cooler than average temperatures and at least average snowfall in May, consistently burying and re-burying exposed dust layers.
June:
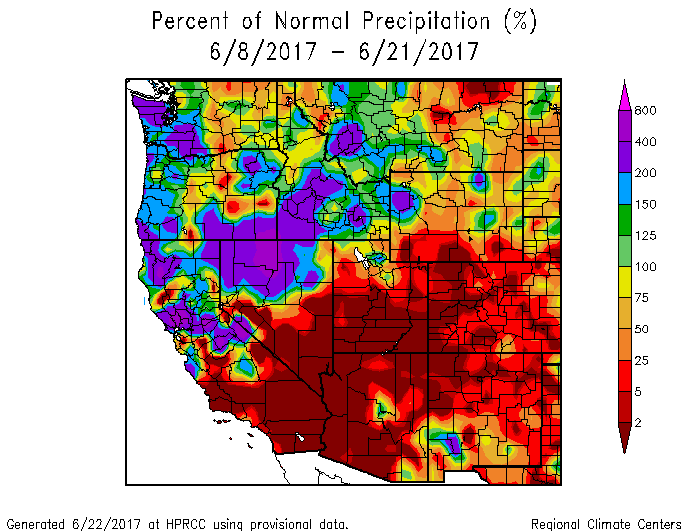
We observed 1 winter storm in June and it just barely broke the threshold. The San Juan Mountains were warm, sunny and dry. Temperatures held around average to above average for the majority of the month, and the weather was characteristic of summertime. Only 0.63” of precipitation were recorded at SBB, with 0.47” of that coming in on June 1 and no precipitation after June 7 meaning that although June is historically a dry month for the area, this year we saw a significant dry spell of 23 days. Average June precipitation is around 1.2”, so barely half of the average precipitation came to the San Juan Mountains. All of this dry, clear weather took it's toll on the snowpack. Although low June precipitation meant very little rain-on-snow, which can rapidly diminish the snowpack, it also meant consistent sunny weather. With the sun's arc passing as high as it does all year, all aspects of slopes consistently received their annual maximum sunlight. This means that dust on the snow surface had ample opportunity to absorb radiation, in turn warming the snow surface and accelerating snowmelt. Snow all gone was recorded at SASP on June 13, and while snow lingered at higher elevations (and continues to in isolated areas) melt occurred rapidly at all elevations during June
SENATOR BECK STUDY BASIN DATA
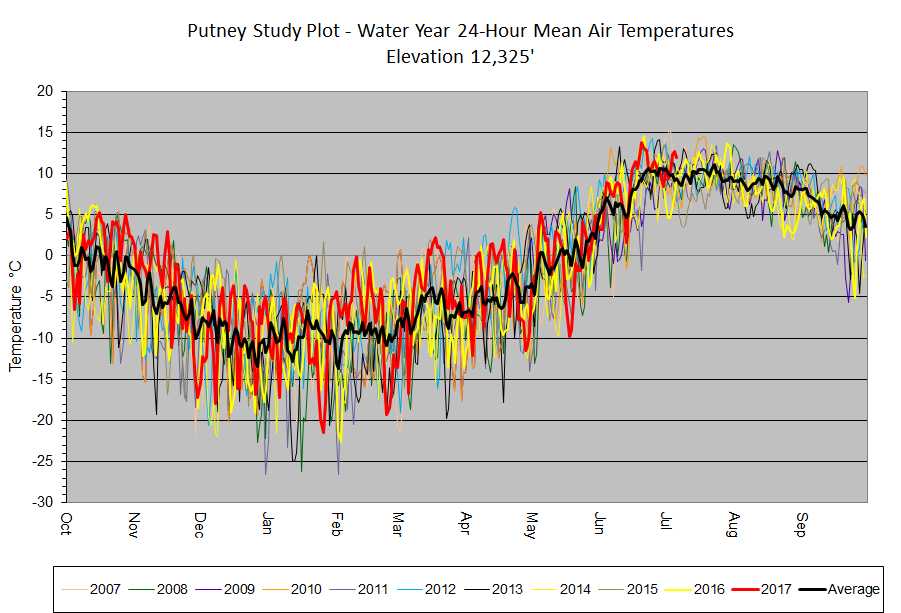
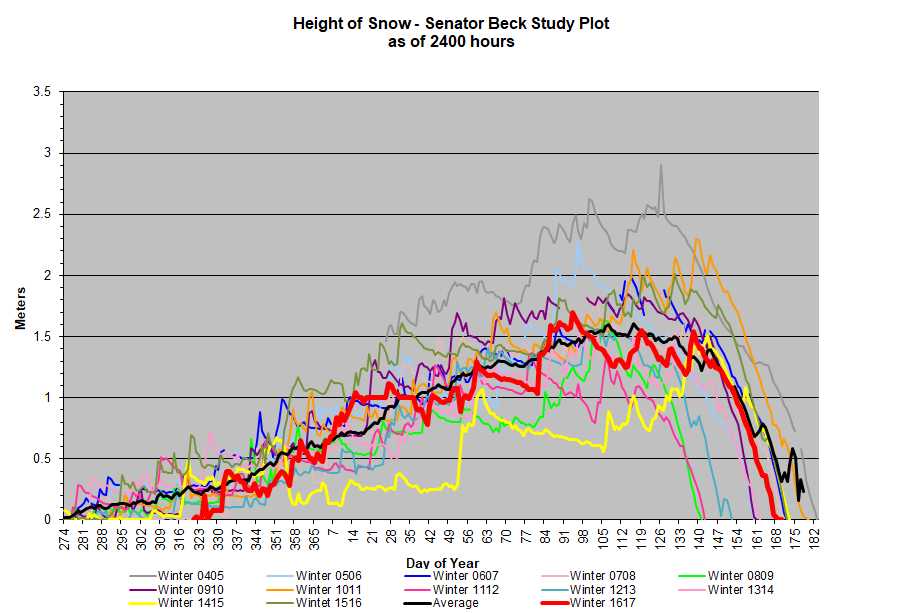
This section describes conditions and data collected by the Center for Snow and Avalanche Studies at our Senator Beck Basin Study Area (SBB) at Red Mountain Pass under our Mountain System Monitoring program, which includes the CODOS program. At SBB, snowpack, weather, soils, and radiation conditions are monitored and measured at the well-sheltered subalpine Swamp Angel Study Plot (SASP, 11,060’) and at the more exposed, alpine Senator Beck Study Plot (SBSP, 12,180’). Nearby, wind speed, wind direction, air temperature, and humidity data are collected at the Putney Study Plot (PTSP, 12,323’), located to minimize the influence of local terrain on those measurements. Finally, SBB streamflow discharge is continuously measured at the SBB pour point at the Senator Beck Stream Gauge (SBSG, 11,030’), in a broad-crested, notched weir.
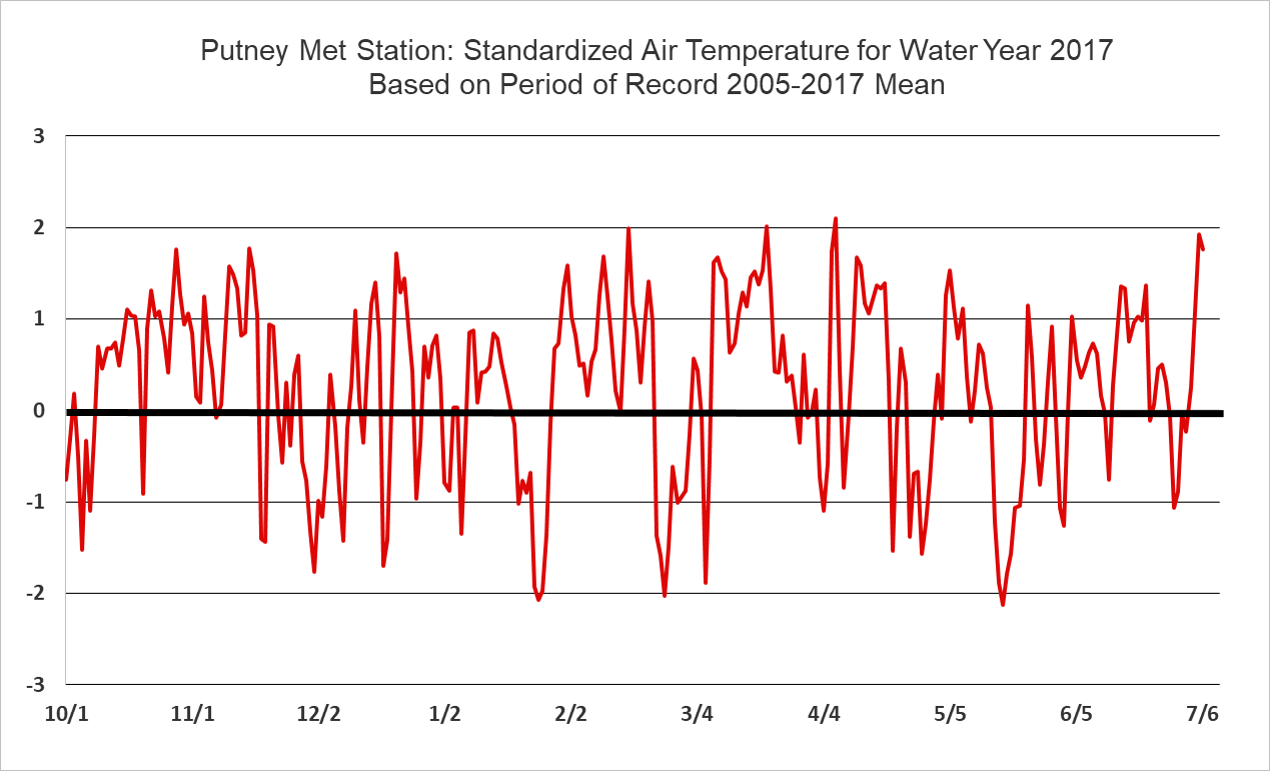
In many ways observations at SBB mirrored general Colorado conditions over the winter but in other respects the data show some uniqueness. The warm/dry October and November is very apparent in the SBB data, as is the warm February and March. What is notable about air temperatures this season was the extended periods of warmer than average temperatures, while colder than average temperatures tended to be more short lived (please see standardized air temperature graph below).
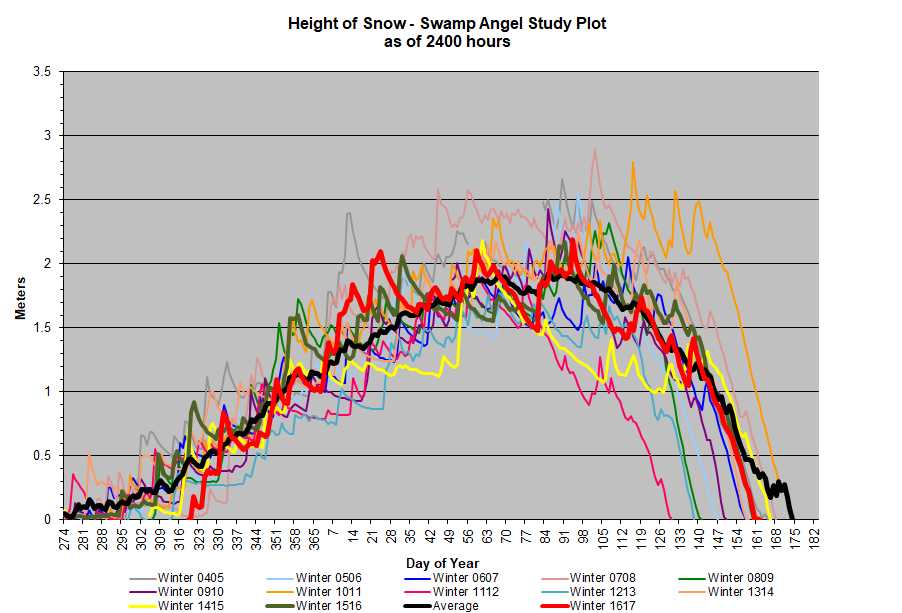
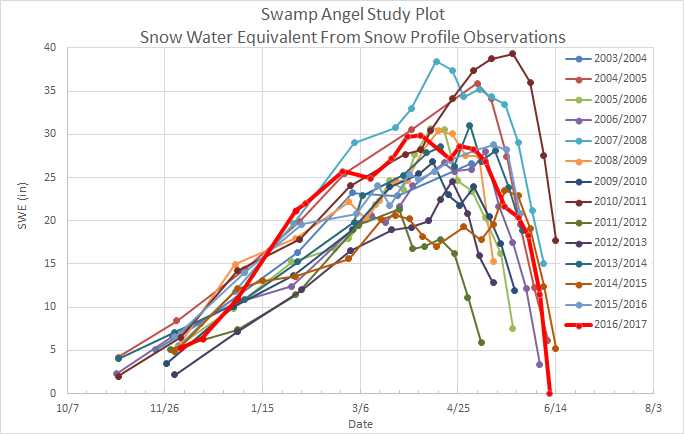
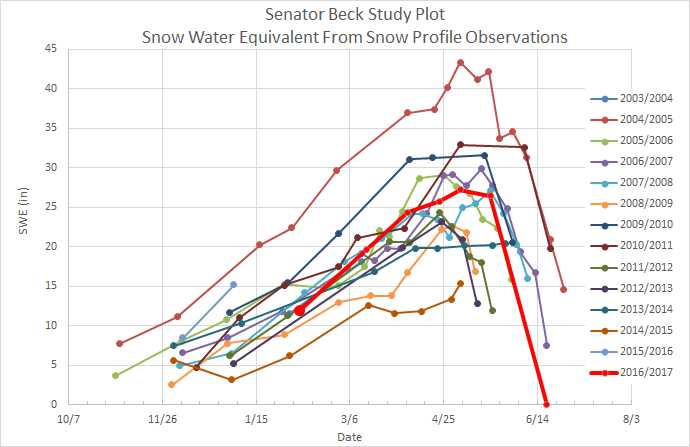
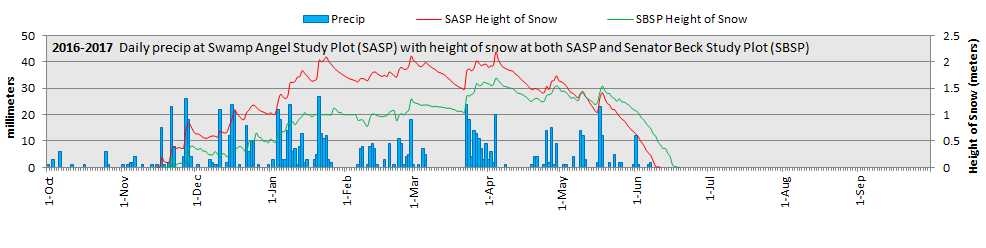
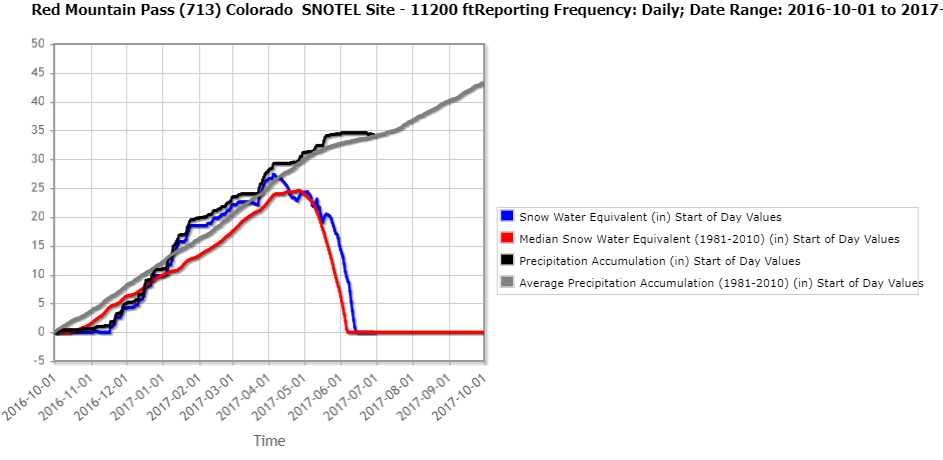
In terms of snowpack, snow profiles (where we collect SWE, grain type/size, density, layers, and dust information) are conducted every 7-10 days at SASP and as often as possible at SBSP. In addition, both SASP and SBSP stations are equipped with an automated SR50 snow depth sensor. SWE observations started out well above normal during the Jan/Feb timeframe at SASP. During the month of February the SnowEx field campaign collected SWE measurements throughout SBB (see Update http://www.codos.org/codosupdates/mar12017), with average SWE observations generally comparing well with Red Mountain SNOTEL at certain elevations. Starting around the end of February the rapid snow accumulation tapered off with peak SWE at SASP reaching near average at 30” (average and median peak SWE at SASP is 29”). While at nearby Red Mt. Pass SNOTEL, peak SWE was 27.4” (median peak SWE of 24.6”), 2.8” greater than median. At higher elevations, SBSP fell right in the middle of the mix as well, with SWE amounts tending above the average for our period of record (WY2004-WY2017) the first part of winter, but with peak SWE ending near the median.
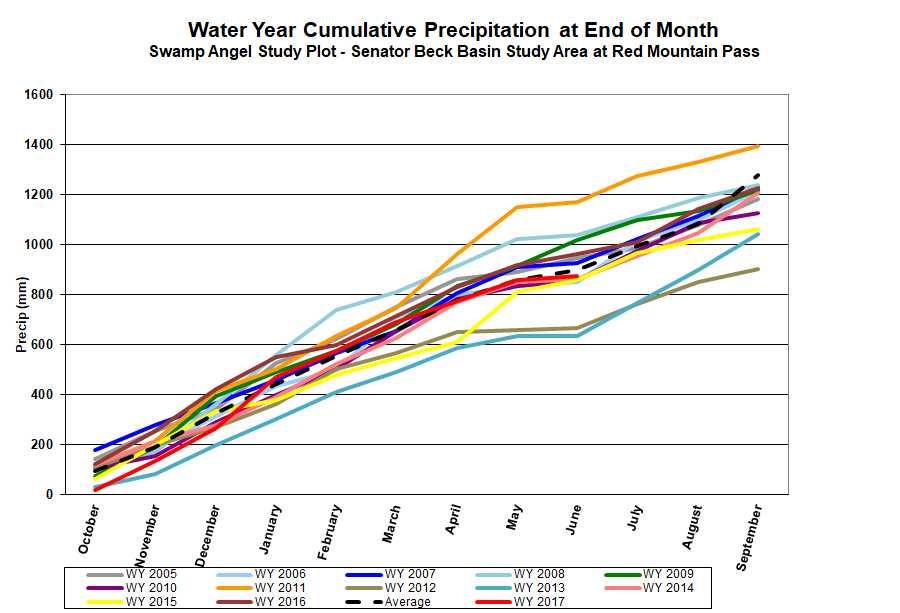
Cumulative precipitation at SASP stayed very near the period of record average. Once the winter season actually started during the latter part of November, the month of December played a little bit of catch up with a pretty steep accumulation rate, and then another sharp increase is noted in January. Red Mountain SNOTEL shows a similar trend although starting in January cumulative precipitation stayed above the median for the majority of the rest of the season. Data compare well considering spatial variability and gauge undercatch are common realities when trying to measure precipitation in mountain environments
SNOWPACK CONDITIONS
After the wonderfully plentiful snow accumulation we saw the first part of the winter season the snowpack started seeing occasional setbacks from temporary periods of heat and drought. Looking back, around the first week of March most SNOTEL SWE data was showing a peak, following the mid-March drought and beginning the latter part of March snowfall resumed, with another secondary peak occurring around the first week of April at most sites. The first part of April turned dry again, but the latter portion saw a series of storms which gave our snowpack – as seen in the SWE data - a third hump.
As a result of the warm but mostly normal mountain precipitation in February followed by the warmest March on record, the snowpack warmed rapidly and reached isothermal conditions by March 22 at SASP. With this rapid warming and melt at lower elevations – as seen in the hydrographs in the March – it was a concern just how earlier than normal snowmelt might occur. But, with the stormy periods mentioned above, and another cooler/wetter May (the last four years the mountains have seen a cooler/wetter May), that provided additional snow accumulation and temporary albedo resets, cooler temperatures, and overcast conditions that attenuated the amount of solar radiation available going towards warming the snowpack, all of which served to slow snowmelt. In addition, at many locations, there was simply more snow to warm and melt than usual; just considering the SNOTEL stations that CODOS tracks, on average peak SWE was 122% of normal (see table below). Please see MODIS images below showing snowcover depletion between March 2 and March 29.
Snow cover in Colorado on March 2, 2017. Snow cover is widespread following a productive Dec/Jan/Feb.
Snow cover in Colorado on March 29, 2017. Following a dry/hot mid-March, lower elevations and valleys experienced a fair bit of snow ablation.
Summary data for WY2017 at the 16 SNOTEL stations that CODOS monitors. The table shows peak SWE, and calculated from the day of peak SWE, melt rates, days to snow-all-gone, and mean temperature.
A summary of WY 2006-2017 snowmelt rates and associated conditions at the 16 SNOTEL stations that CODOS routinely monitors, statewide. Days to SAG refers to the time between peak SWE and “snow all gone” at the SNOTEL sites. Adjusted Daily Mean Loss calculates the rate of snowmelt following peak SWE, including all precipitation received after peak SWE (assumed to be snow). Melt rate tables are presented for each of the 11 CODOS monitoring sites on their webpages.
DUST-ON-SNOW CONDITIONS
DUST ENHANCED RUNOFF CLASSIFICATION:
In Water Year 2015 CODOS introduced a Dust Enhanced Runoff Classification (DERC) approach to linking dust-on-snow, snowpack, and spring weather conditions to patterns in statewide hydrographs within a 3x3x3 Dust Enhanced Runoff Space. The below table presents the final DERC classification of WY2017 parameters at each of the 20 stream gauges monitored by CODOS. Water Years 2006-2017 classifications are contained in Excel workbook Runoff_Space_by_Region_and_WY.xlsx. Another workbook, Runoff_Space_by_Watershed.xlsx, contains individual DERC analyses for WY 2006-2017 for each of the 20 stream gauges.
A conceptual Dust Enhanced Snowmelt Runoff Space integrating the interactions of March 1 SWE, dust intensity, and spring precipitation.
Based on the discussions describing the DERC approach in characterizing the watersheds that CODOS monitors, WY2017 snowmelt season conditions are summarized in the tables below. In broad terms, with local variations, Colorado WY2017 snowmelt runoff behaviors fell into general patterns of “Average Dust” or “Min Dust”, mostly “High" March 1 SWE, and mostly “Dry” spring.
WY2017 DERC matrix classification of factors influencing snowmelt runoff behavior at 20 stream gauges located in watersheds monitored by CODOS.
Table above indicates placement of individual CODOS sites for WY2017 within the DERC framework and suggests years with comparable local hydrographs, where applicable.
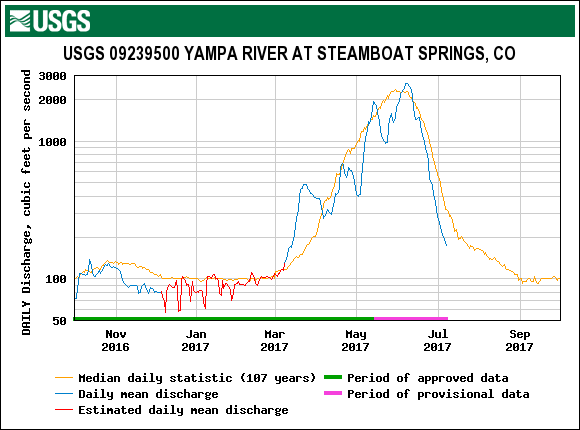
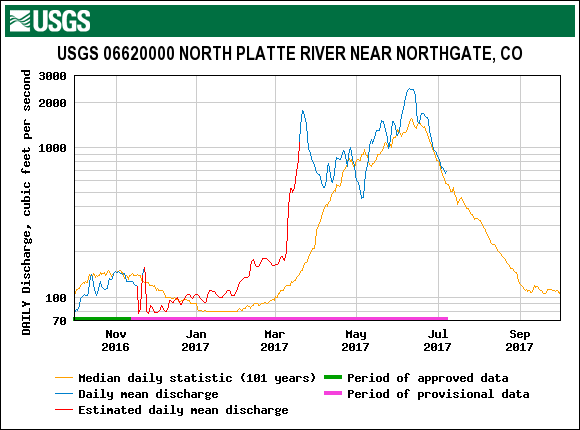
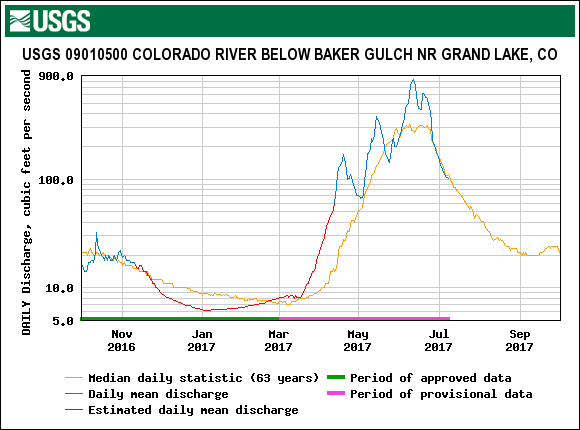
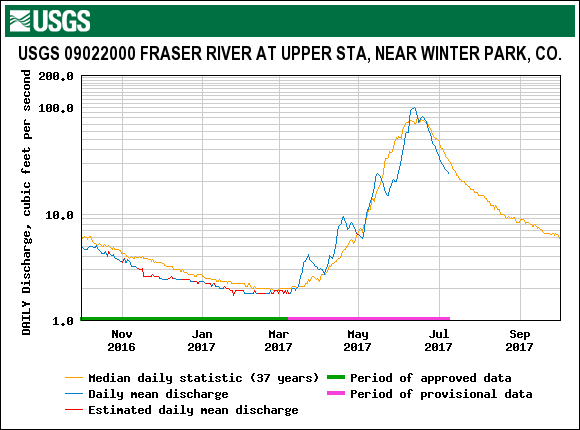
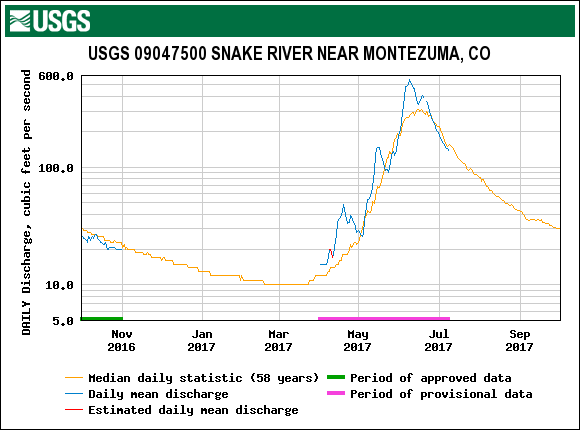
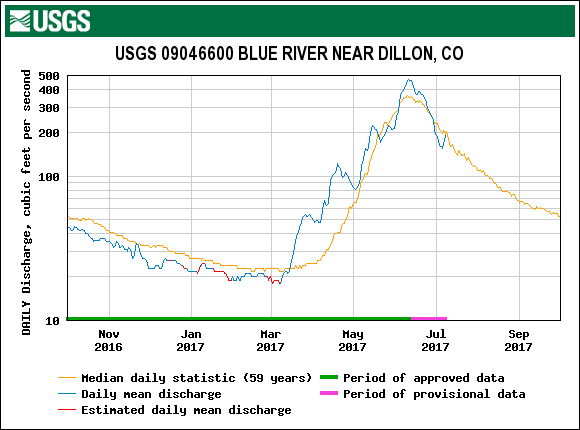
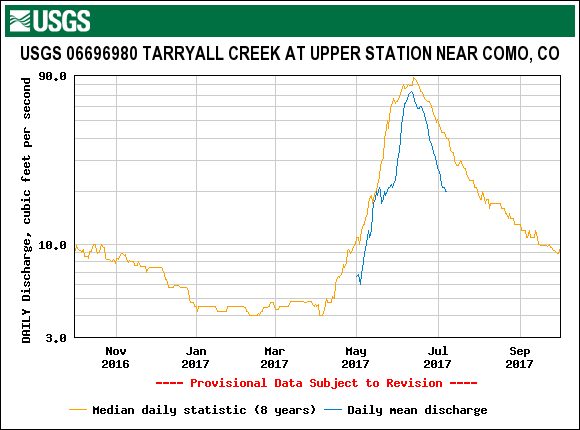
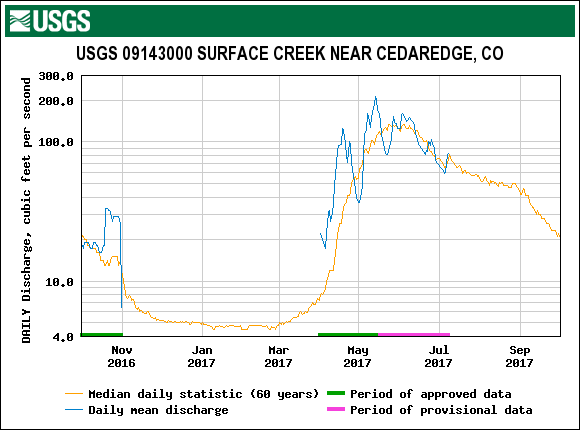
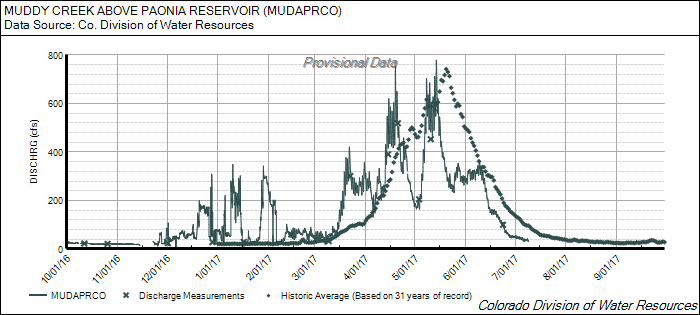
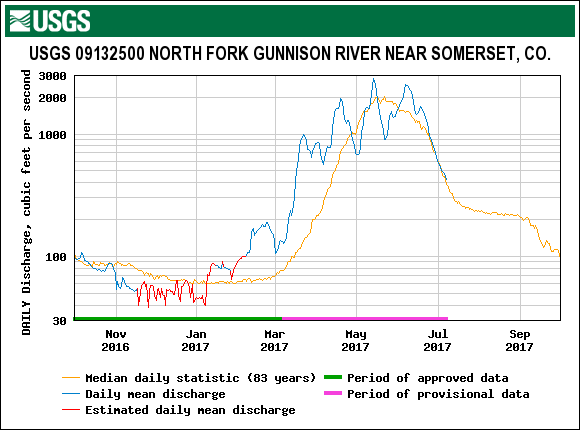
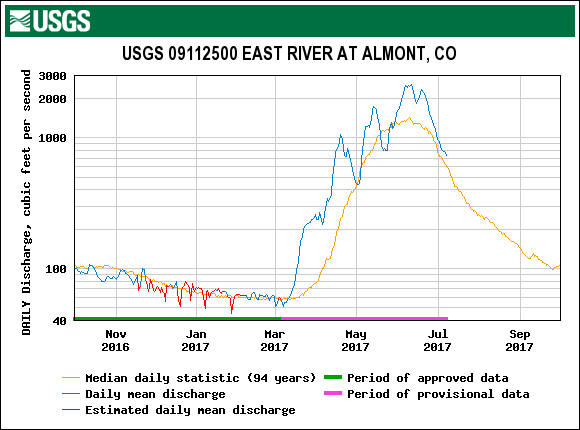
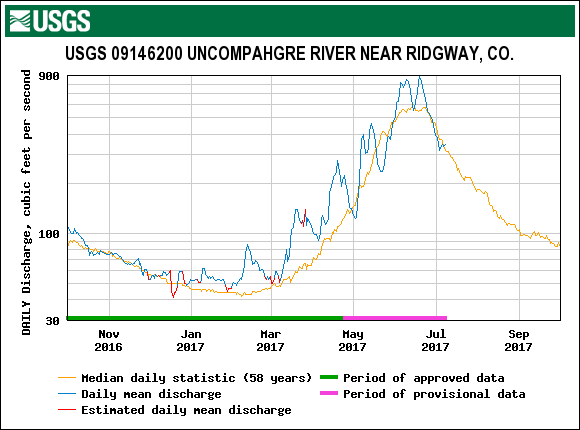
Although SBB only received four dust events, the impacts of the dust on snow albedo and melt rates was more characteristic of an "Average" dust year. Normally, with only four events we would qualify this amount of annual dust as "Minimum." However, with two notable and very visible events (D3 and D4), and measurable decrease in albedo along with significant spikes in streamflow observed when dust emerged on the surface in many areas, we believe that this qualifies as an "Average" year at many locations within the DERC framework, albeit perhaps on the lower side of Average. Areas in the Northern and Eastern mountains saw less dust this year and are classified as having "Minimum" dust severity in WY2017. Rivers such as the Yampa, Fraser, Upper Colorado, Snake, Blue and Tarryall have all seen less significant spikes in streamflow during the melt season, and the surges in melt that have been observed can be closely tied to rapid warming events. While the rest of the state’s rivers have seen increases in discharge during or following significant warming periods, surface dust has driven an acceleration of the melt rates and the presence of dust on the surface is evident in many hydrographs. Below is a hydrograph from the Uncompahgre River near Ridgeway from March 1 through mid-June, indicating occasions when dust was observed at the surface of the snowpack in the Senator Beck Basin. Also, please see the albedo and streamflow plot in “Runoff Behavior” section.
Total dust-on-snow events by month. March begins the more intensive part of dust-on-snow season. In WY2017 all four dust events occurred after March 1st, placing those dust layers within the upper portion of the snowpack.
Total dust-on-snow events by year. Three dust events in 2016/2017 were “wet” events, accompanied with precipitation. One event was “dry”, occurring just prior to precipitation.
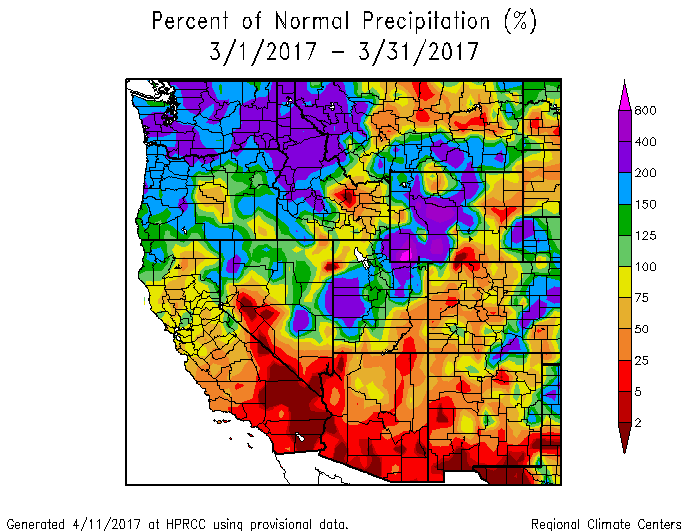
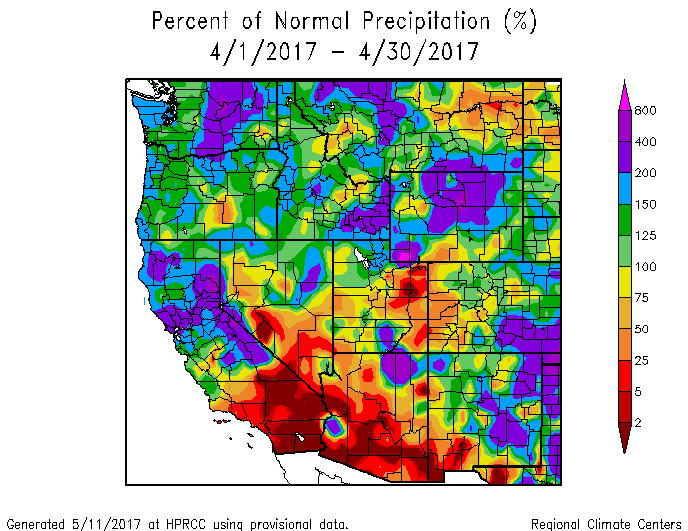
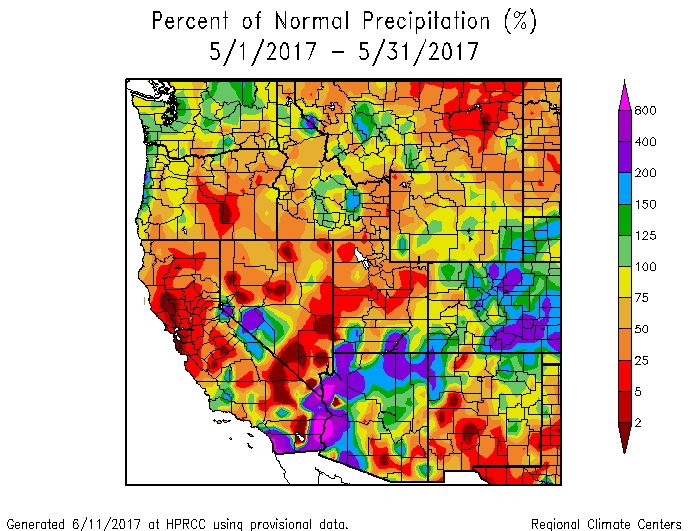
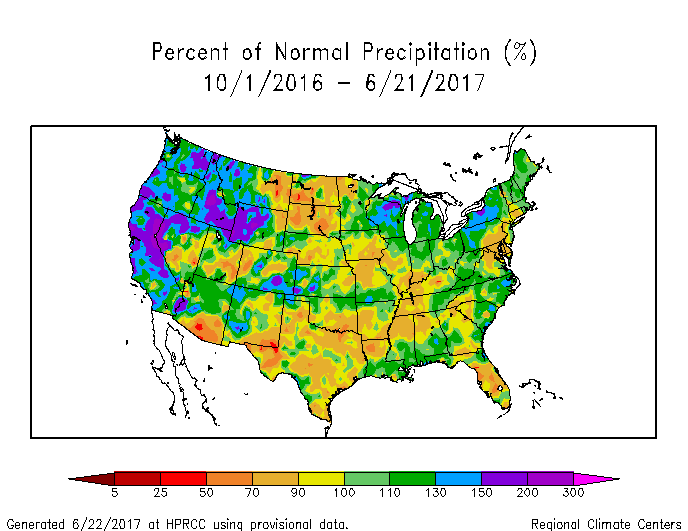
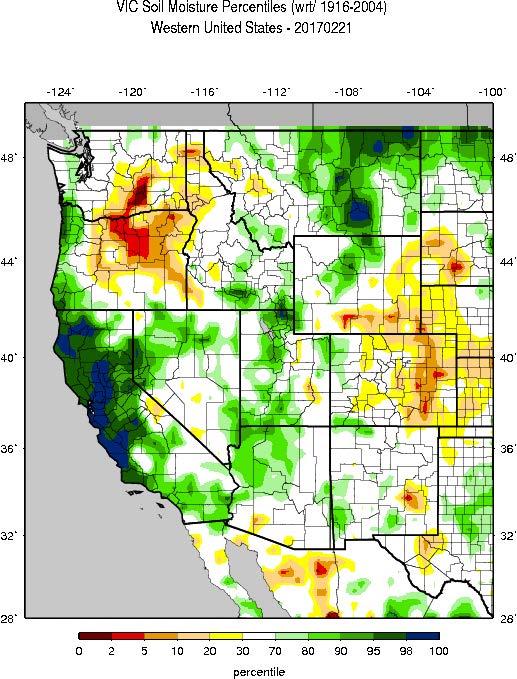
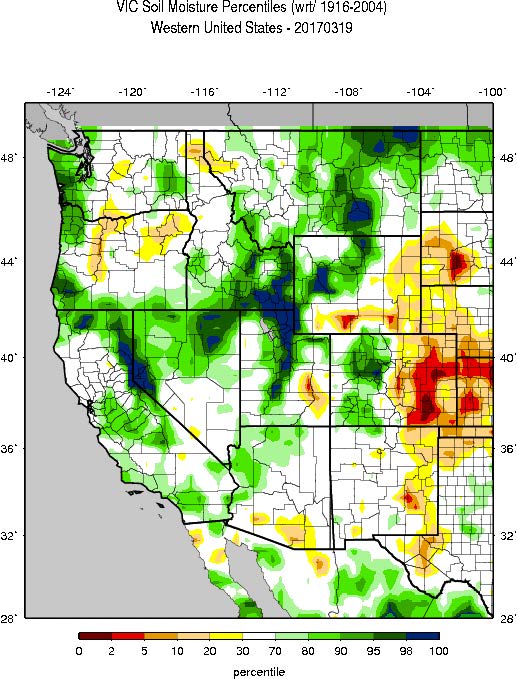
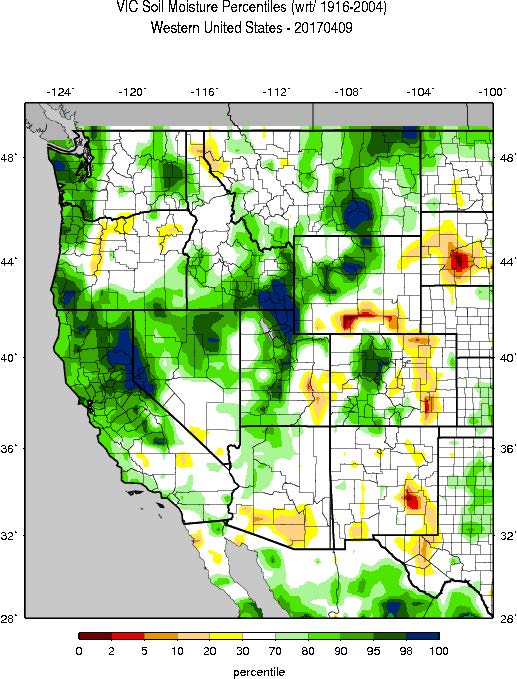
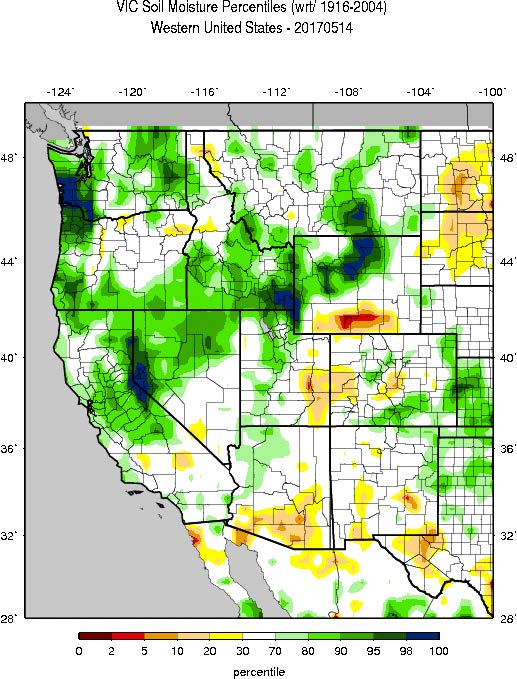
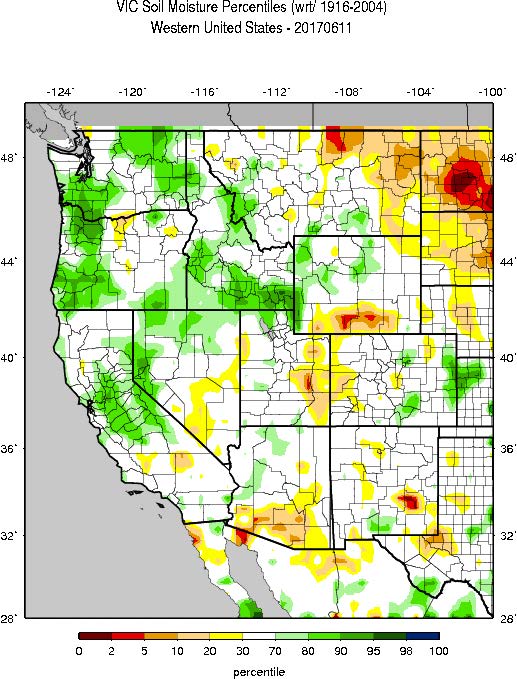
Variance of combined March, April, and May precipitation as of June 1, 2017, for the SNOTEL stations adjacent to or near CODOS monitoring sites.
Hydrograph from the Uncompahgre River near Ridgeway from March 1 through mid-June, WY2017. Periods when dust was exposed on the surface and associated surges in discharge are indicated. Dust exposure was determined by visual observation and albedo measurements from SASP and SBSP.
MMost of the mountainous parts of the state experienced a dry spring, with many areas receiving less than 70% of their median March-May precipitation. Areas experiencing average years were all below median values as well. The only exception was Hoosier Pass, which received 122% of median springtime precipitation. Additionally, almost every site monitored by CODOS met our "high" March 1 SWE requirement of 110% of median March 1 SWE or above. Only Rabbit Ears Pass fell into our "Average" category, with 109% of median March 1 SWE. The take home here is that while Colorado went into the spring with a healthy snowpack, a mostly dry spring combined with, in many places, significant dust driven snowmelt occurred periodically when clear/sunny conditions existed, resulting in periodic rapid snowpack loss seen at a number of stream gauges throughout the state. Peak discharge and snow all gone dates occurred mostly near median timeframes, but earlier than our March 1 snowpack would have suggested in and of itself.
RUNOFF BEHAVIOR
At SBB the beginning of peak discharge began squarely within the median timeframe, towards the end of May, a month that saw cooler/wetter periods. Streamflow appeared to have also peaked nearly within the median timeframe and very similarly to WY2016 as well. However, unlike WY2016 and the typical median scenario, it was the second surge in streamflow that resulted in the snowmelt peak discharge for WY2017. This is likely due to the remaining mid-elevation snow and the abundance of higher elevation snowpack noted in a June 6 CODOS update. While station data at SBSP indicated near average snow height during this period, the landscape as a whole appeared to have a plentiful amount of snow, especially at higher elevations.
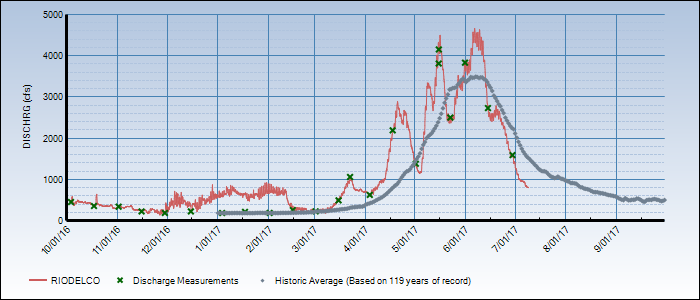
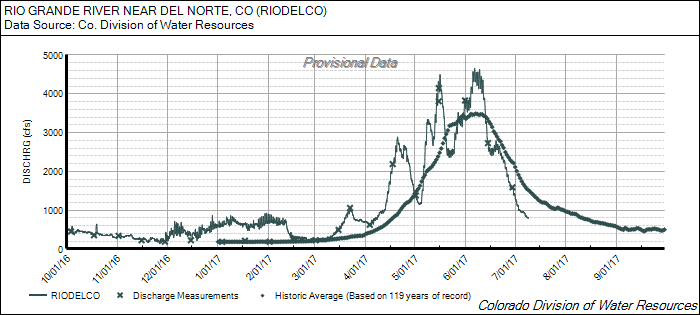
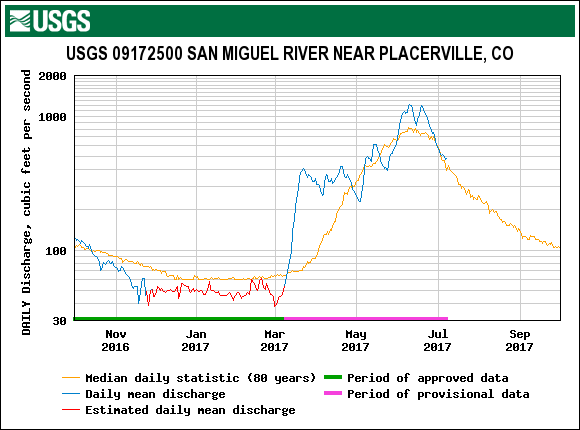
With SBB stream gauge being in the headwaters of the Uncompaghre watershed, it is common for the two stream gauges to track each other closely. Note the bump in streamflow in March due to the hot conditions.
This year at SBB we observed a peak discharge of 18.59 cfs on June 19, this is second to the record peak discharge of 20.07 cfs on June 5, 2016. Peak SWE in WY2017 was 1” greater than in WY2016.
As of early summer cumulative streamflows are greater than previous years.

SBB stream discharge as it relates to albedo (or reflectance) of the snowpack. Much like last year, a series of albedo “resets” occurred throughout May due to precipitation (snow) temporarily covering dust layers, decreasing absorption of solar radiation and slowing snowmelt. These storms bringing precipitation also bring cloud cover and cooler temperatures, slowing energy going towards snow warming and melt. With all dust layers at the surface of the snowpack, along with a stretch of very warm/sunny days, snowmelt kicked into full gear and streamflow rapidly spiked.
LOOKING AHEAD
Much snow is now gone in the San Juan Mountains, and although rivers are still showing some signs of a diurnal snowmelt cycle (running higher in the evenings after a day of melt and lower in the morning after the cooler night) the big spring peak in runoff has come and gone. Currently, essentially all major stream gauges are in the normal range. The mountains are experiencing summertime conditions, with temperatures consistently well above freezing day and night, even at the highest elevations statewide. Streamflow will continue to slowly taper off, with additional spikes during and after big rain events, especially during monsoon season which usually impacts the Southwestern US between mid-August and late September.
There was the usual hype about El Niño Southern Oscilation (ENSO) this past winter and what it would mean for the snowpack. In the end, our ENSO conditions returned to neutral by the height of winter, so impacts were little to none on the seasonal scale. These ENSO neutral conditions are forecasted to remain into the fall, after which the onset of El Niño conditions are expected. While it appears that any El Niño will be weak, we will be closely following these conditions as a strong El Niño often means more precipitation for Colorado. It does appear that we benefited from the lesser-understood and –discussed Pacific Decadal Oscillation (PDO) which is in a positive phase and is thought to have contributed to the significant number of atmospheric river events this year. PDO is a longer term condition, and looking forward there is some hope for a repeat of this winters' isolated drought-busting storms, although in continental (farther inland) areas like CO it is harder to predict these impacts. Despite these conditions, current long-term outlooks are suggesting a warm winter with average precipitation. Forecasting for a winter during the summer before is tricky business, so while we can make some entertaining guesses, in the end we will just have to wait and so how things pan out.