
CODOS Update May 1, 2021: Snowpack Status, Get to Know the Unc and Other Watersheds
Greetings from Silverton,
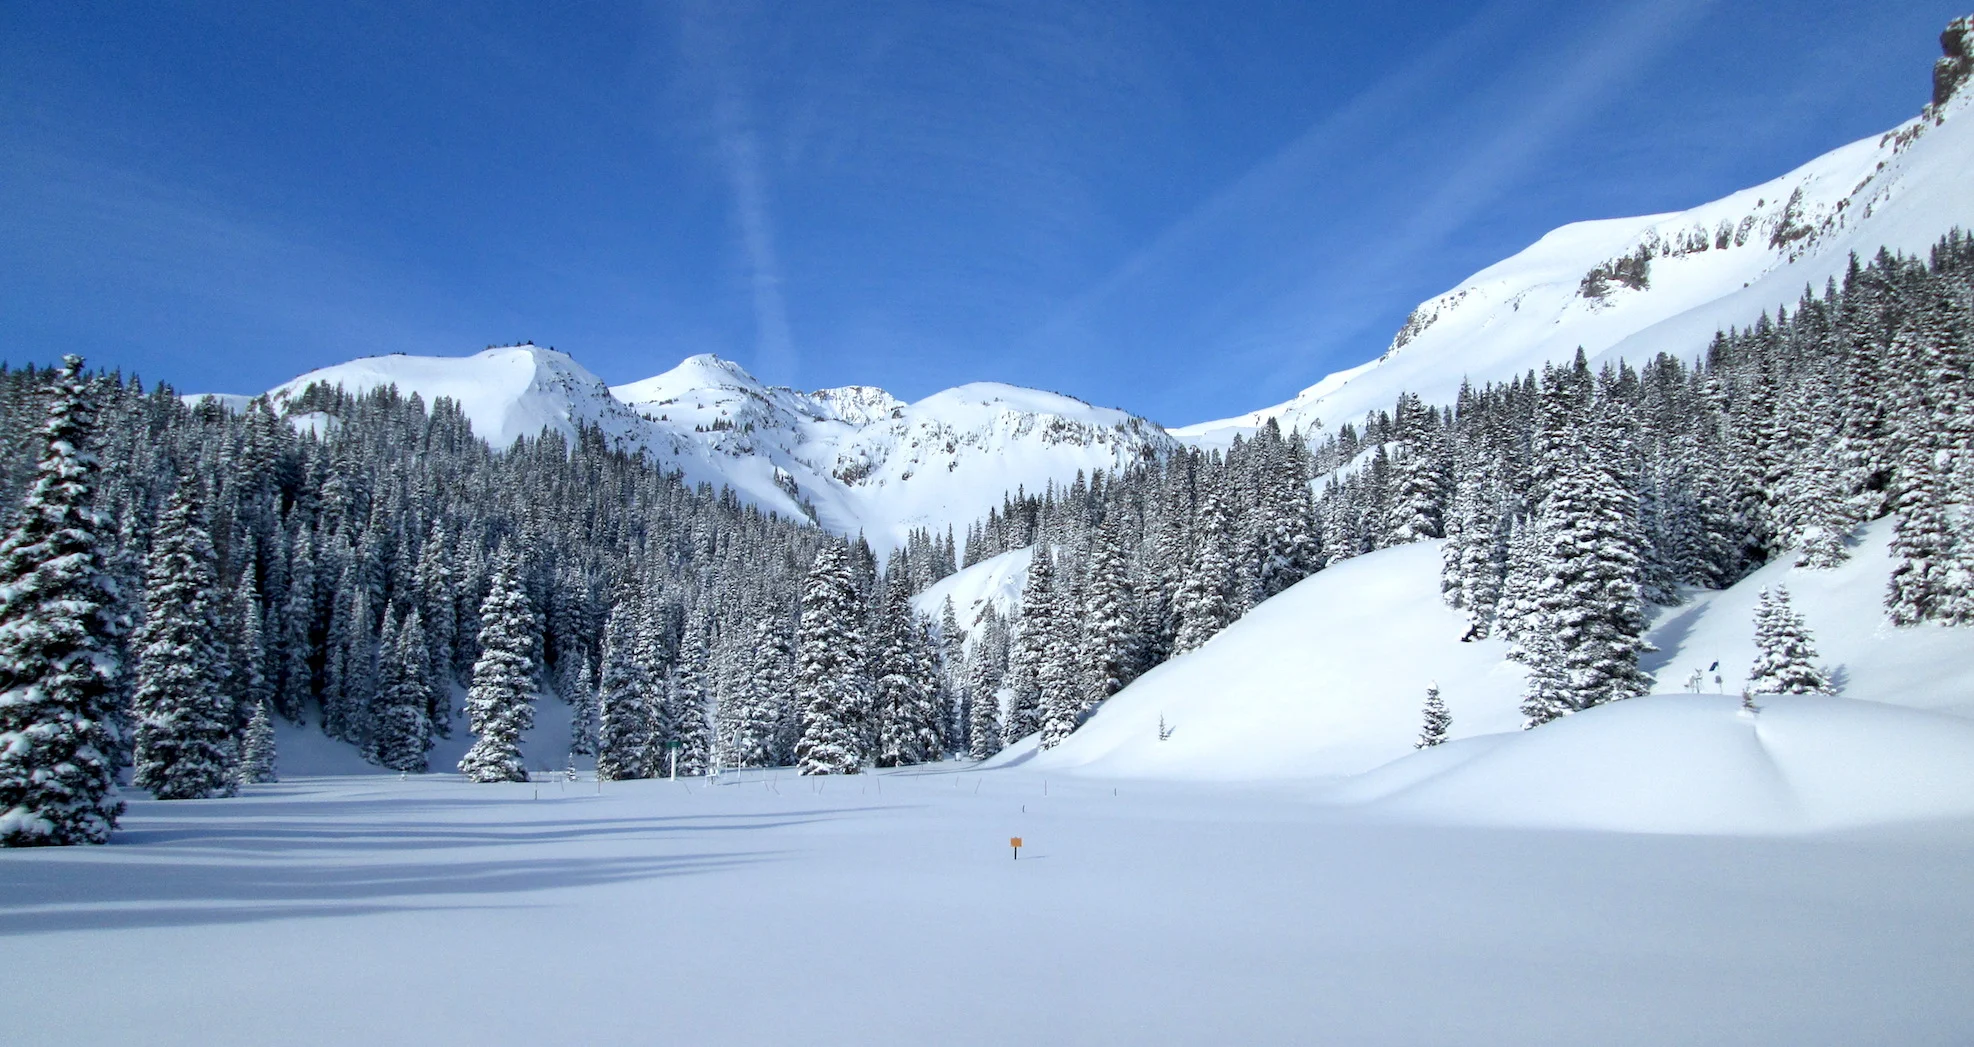
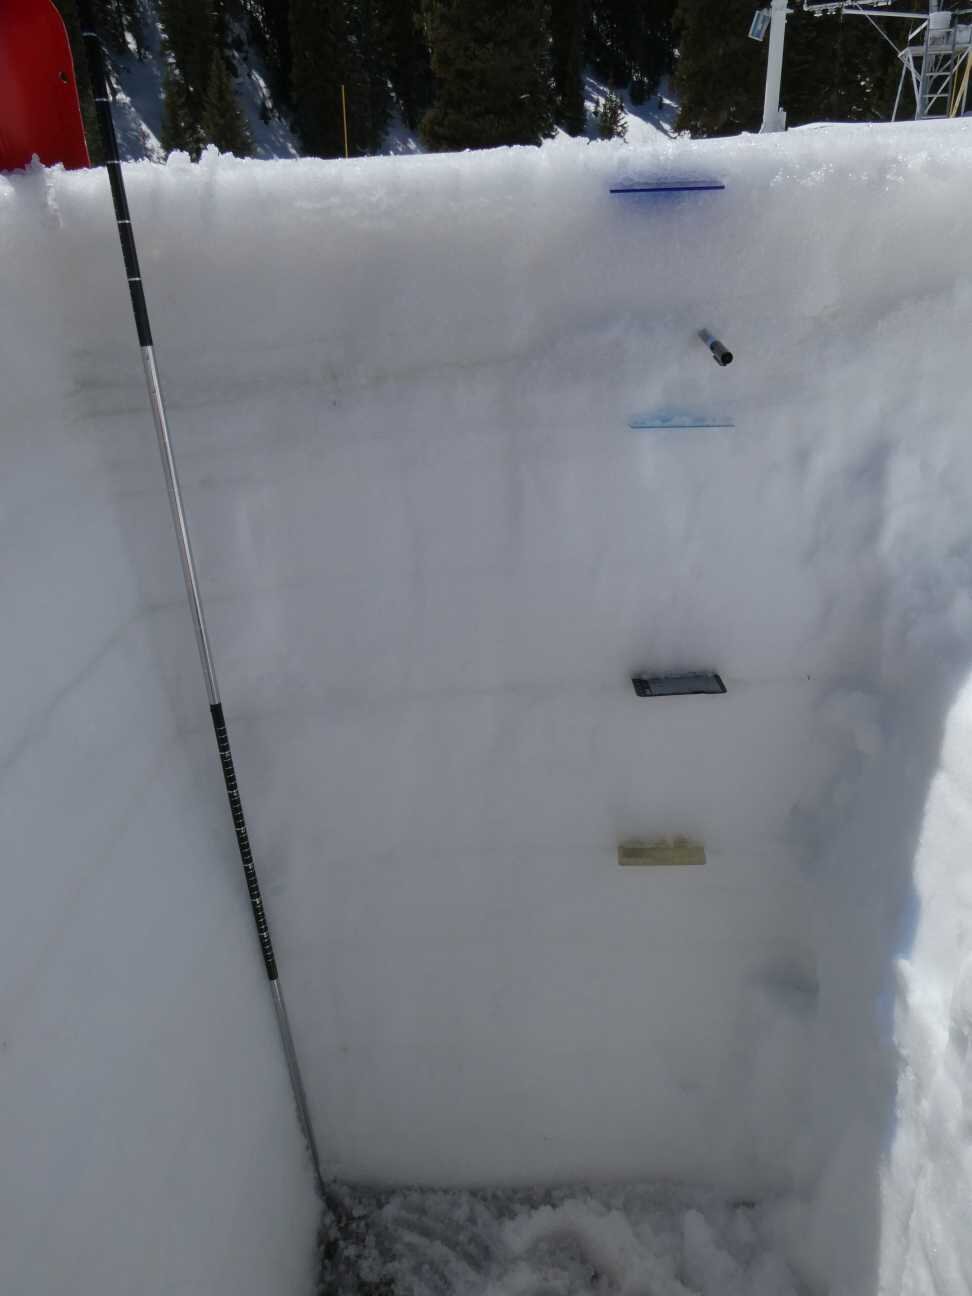
The storm that brought 0.6” this past Tuesday, April 27, had very little staying power. On Thursday we did a snow profile at Swamp Angel. Dust is on the surface and a band of dust comprising the last few dust events comprises the top ~10” of the snowpack and will be emerging at the surface as snowmelt continues and ramps up. About mid-pack there is a notable dust layer that will darken the surface further.
The snowpack depth is decreasing and the density is increasing (see plots below). More and more water is being held in the pore space and soon will start coming out of the bottom of the snowpack, going into the soils and eventually the streams.
Sunday into first of the week are chances of precipitation (90% chance on Monday) but nothing it appears that will cover the snow surface much, slowing melt for very long, or adding much water to the snowpack. The cooler, overcast weather will be welcome.
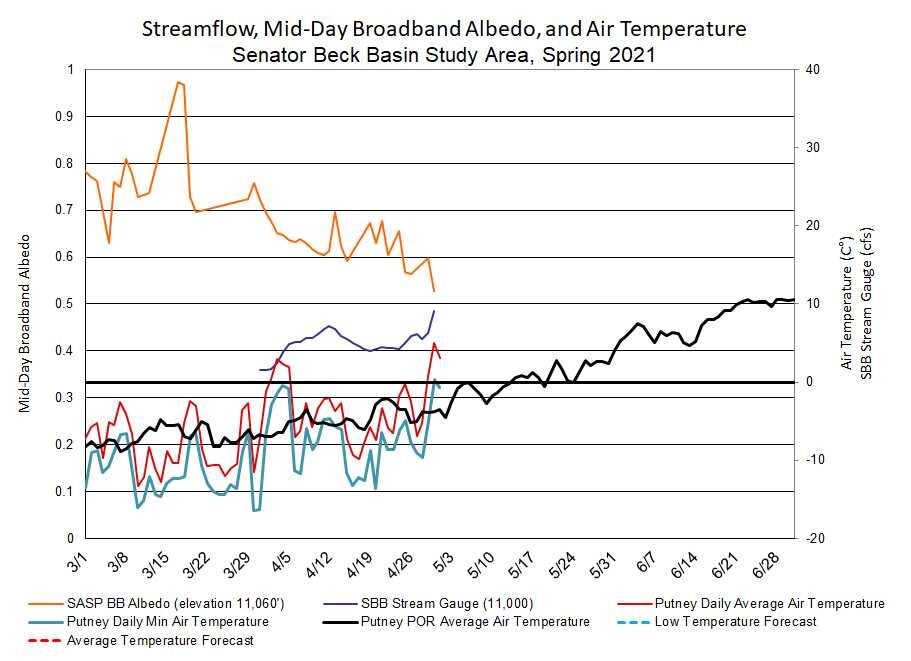
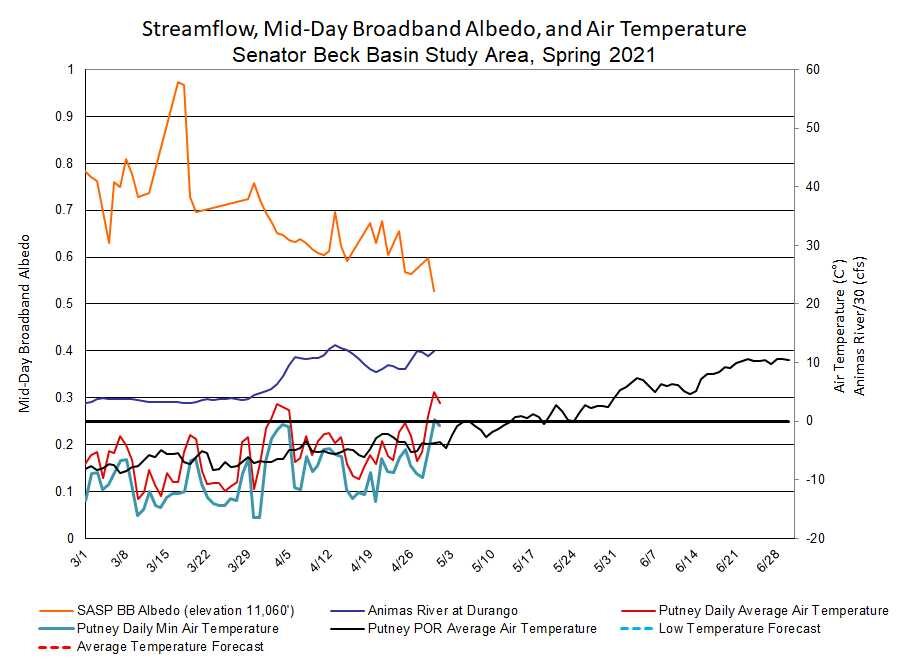
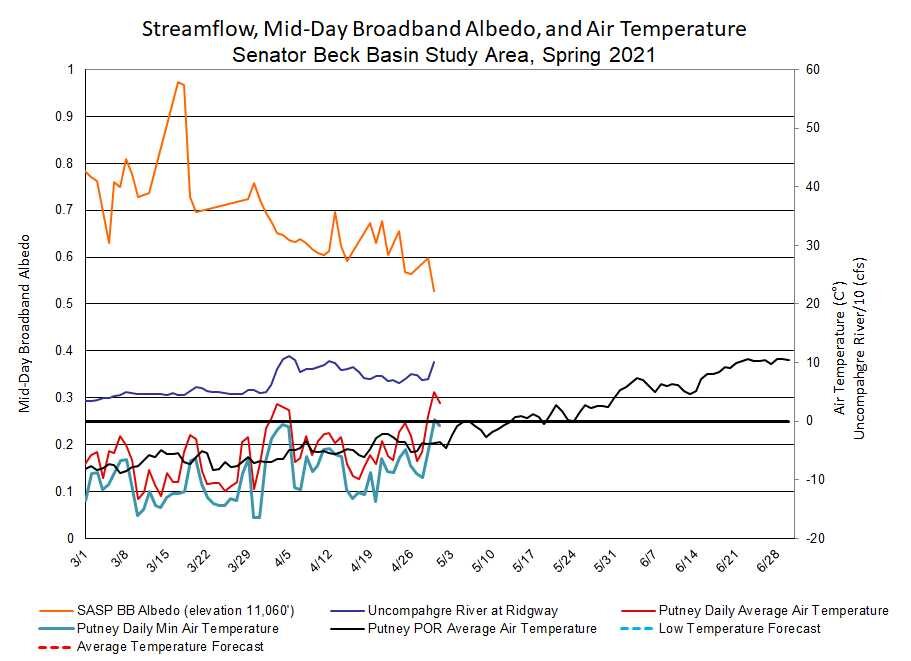
Below: Here we go, with minimal new snow accumulation and sizable amount of dust at/near surface, albedo is dropping, the dirty surface is absorbing more and more solar radiation, resulting in increased streamflow. Recall a clean snow surface has an albedo upwards of 90%. Compared to other years, this is a low albedo so early in the snowmelt season. The forecasted wet conditions first of the week may offer a day or two pause, but then back at it later in the week.
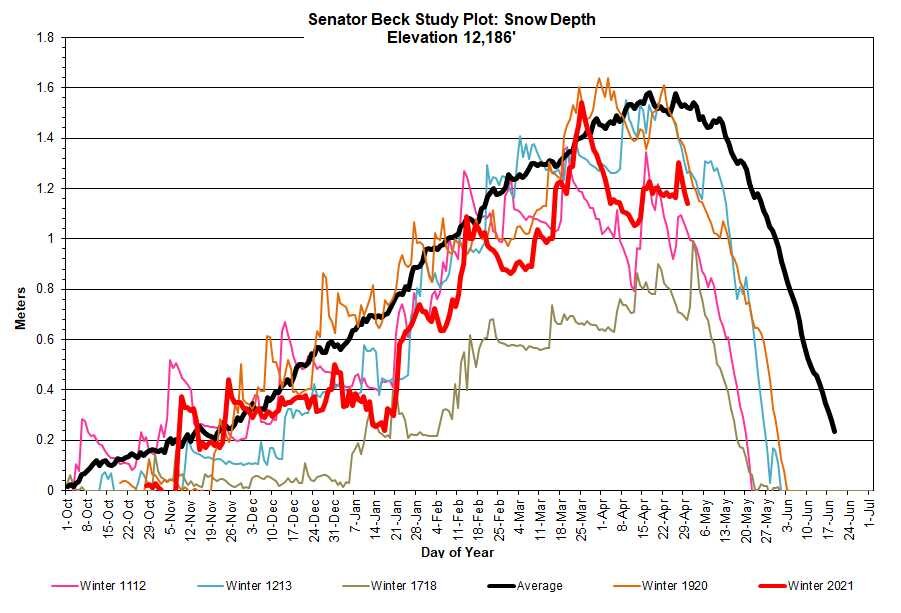
Below: Snow depth is decreasing as densification increases, the snowpack is wet and preparing to melt at SASP. Ablation of similar years as WY2021 are shown in snow depth plots. At Swamp Angel WY2013 resembles this year at this point in time. WY2013 was a dry winter, dry spring, and heavy dust season. There is a lot of variability, but Red Mt SNOTEL (being in a treed area) melts out ~6 days after Swampy on average. For the SWE plots all the data is shown. Red dots/lines are WY2021. Only a handful of years did CSAS observe less SWE than this year.


Below: Another dry and hot April, similar to last year when we saw rapid ablation of the snowpack.


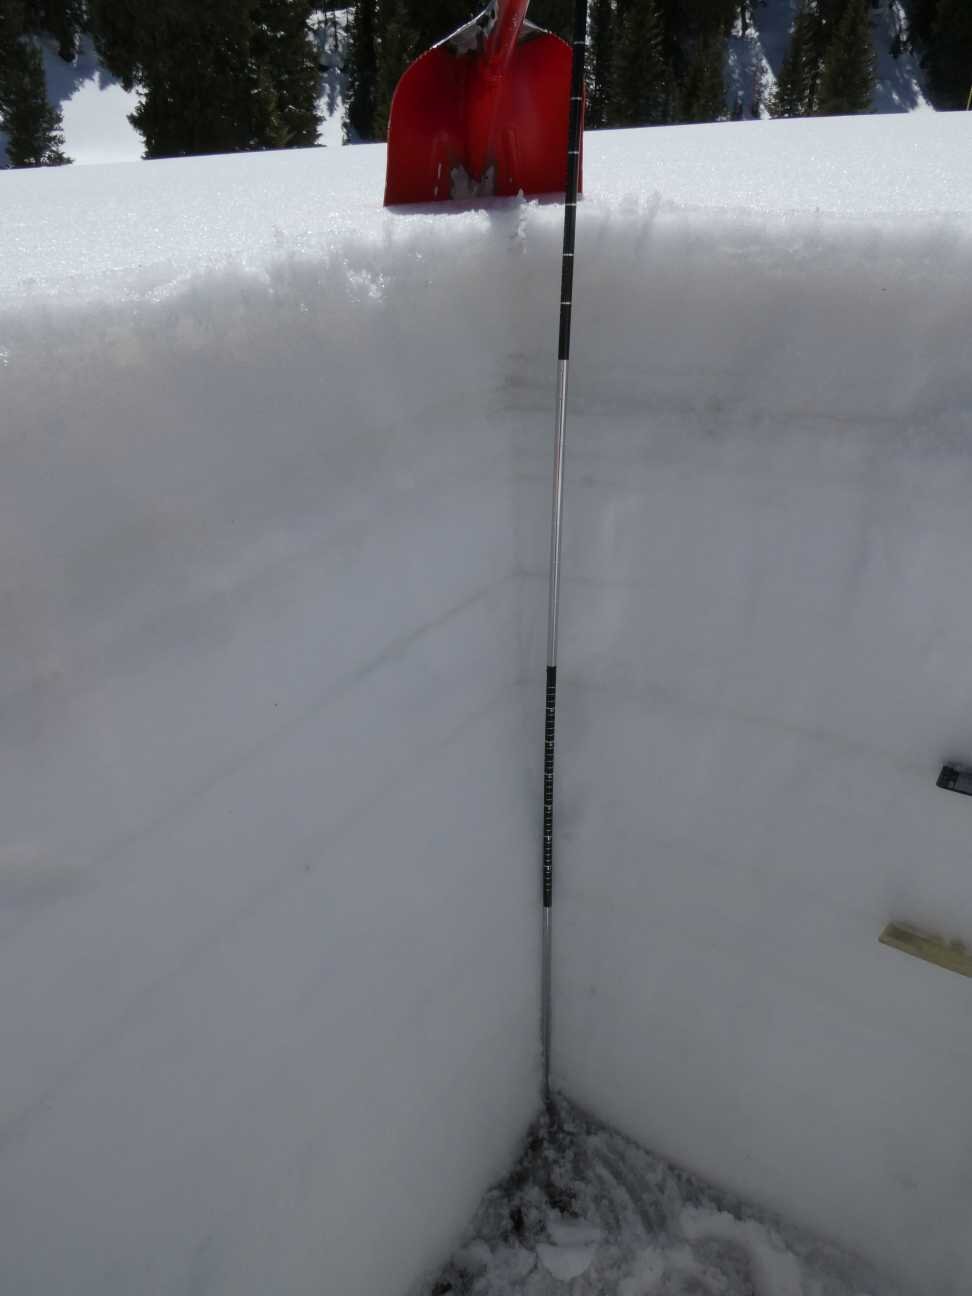
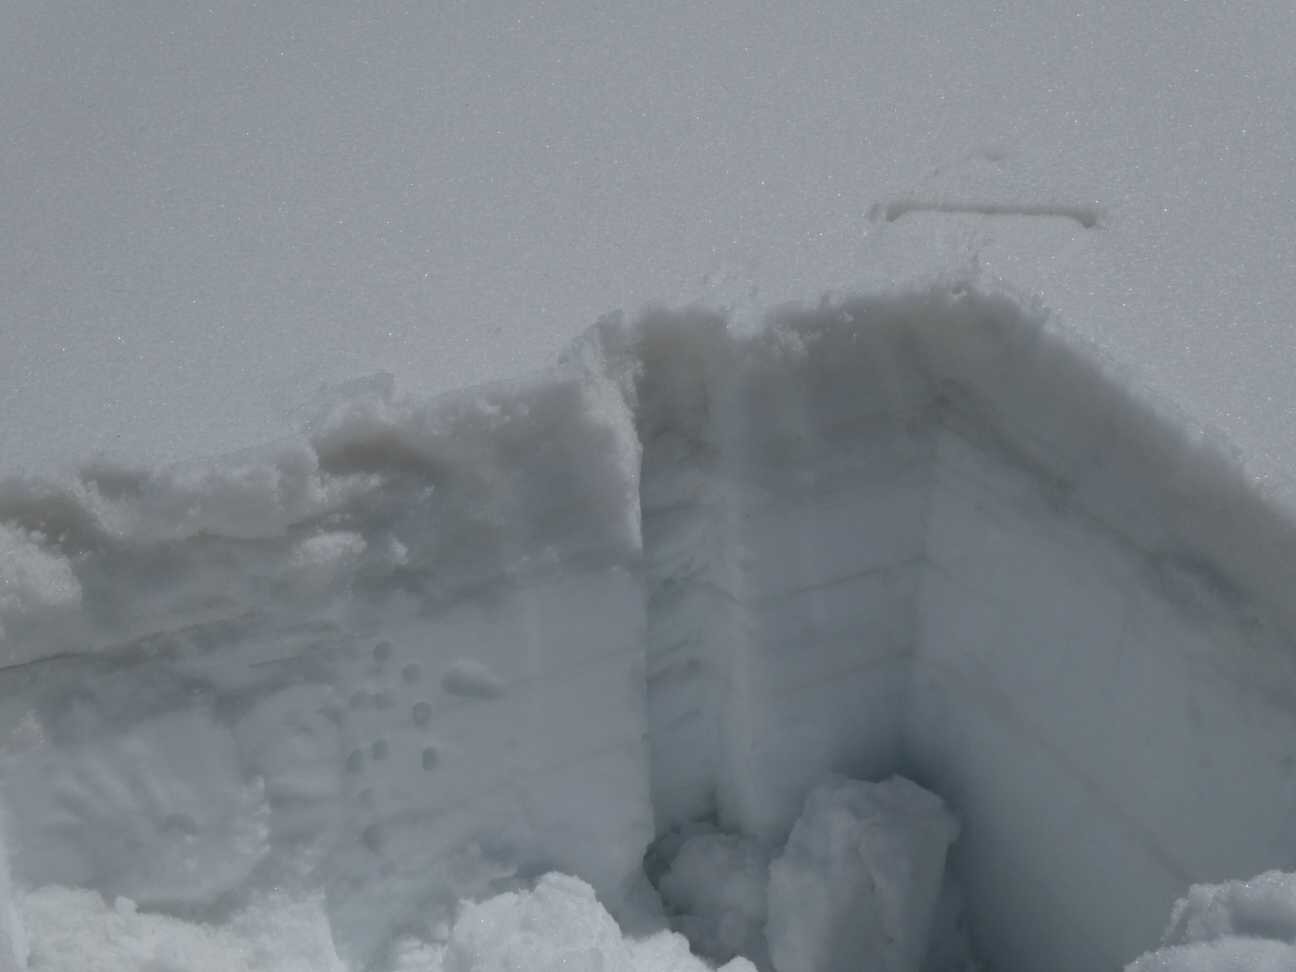
Below: Snow profile and pictures of Swamp Angel on April 29.

Get to Know the Uncompahgre, and Other Watersheds
The Uncompahgre Watershed Partnership is holding a contest of who can predict peak discharge this spring, the grand prize has a $1,228 value. I thought it would be fun and informative to discuss how you can go about making an educated estimate of day of peak and in doing so learn more about the Uncompahgre watershed, CSAS’s data, and how to access data and do basic analysis to understand any watershed in Colorado.
First, check out streamflow at the USGS website and get a feel for the median values and dates of peak. Consider previous years when we have seen similar conditions, you can do that by looking at the Dust Enhanced Runoff Classification matrix for a select watershed on our codos.org website, you can also read our updates to get a sense of what we are seeing in Senator Beck Study Area in the headwaters of the Uncompahgre basin as well as view all kinds of graphics. What are the current dust-on-snow conditions and how do they compare to other years conditions and hydrographs? What were the melt rates for similar years? You can determine that by seeing our melt rate data sheets. Consider looking at our historical data to see how events unfolded in the last 18 years of our history of collecting data.
Looking at current weather and streamflow data at our website, and looking at SNOTEL data from such stations as Red Mountain Pass, or SNOTEL groups that pertain to a watershed, you can see the current state of the snowpack and apply these dust and spring conditions melt rates to estimate snowmelt timing and rates.
Snowmelt and discharge in streams is not a one-to-one relationship. The ratio is getting more and more worrisome with climate change as this year experts estimate 80% of snowpack will turn into 30% of runoff at Powell inflows. SNOTEL stations are intended as index stations to establish relationships of SWE at a SNOTEL vs discharge downstream. A neat way to visualize when snow melts and when rivers peak can be explored here.
It is hard to tell by looking at the median values, but the Uncompahgre is typically a double peak river, we see a peak when the ~11,000’ band of snow melts and we see a peak when the high alpine snow melts. So which of these will be the actual peak? To answer this consider how much snow is on the ground, what is spring weather doing (this year is similar to last year, hot and dry) and how is it affecting dust exposure and melting of the snowpack? What were the soil moisture conditions going into winter? Soil moisture is the first bucket to get filled when the snow melts so this can affect the magnitude of flows. See how extremely dry soils were going into this winter at the CBRFC website.
The Senator Beck stream gauge mirrors the Uncompahgre in terms of timing very closely so estimating flows at this gauge – using our station data - will assist with downstream estimations.
You can also see the CBRFC forecast for peak flow, but early season forecasts (if you are going to get you submission in early) mainly show general percentiles.
How to put it all together? Below are a few plots showing relationships of snowmelt and peak streamflow for the first and second peaks. When CSAS notices something interesting in the research basin, from the contribution of wetlands to streamflow in autumn or snowpack/streamflow relationships, we work with university professors to engage students to research the topic as part of a thesis project. Included below are results from such a project done by Lenka Doskocil at CSU.
All of this is just scratching the surface, but hopefully a seed to follow your curiosity about your watershed. Hurry, you have only 10 days left to submit your educated guesses for the Uncompahgre contest. Don’t worry about your day/time already being chosen because tie breakers are decided by who gets closest to estimating the amount of peak flow (we’ll save estimating that for another update).
Take Care


Below: Undergrad thesis work by CSU student Lenka Doskocil. The paper with images and discussion can be found here.

Lenka’s findings for relating snow gone at Senator Beck Plot (12,200’) and second peak Q date.

Estimating first peak Q using 50% of max SWE at Red Mt SNOTEL.