

Overview
Every March 1 the Colorado Dust-on-Snow Program (CODOS) summarizes snowpack conditions statewide and evaluates snow water equivalent (SWE) data from SNOTEL stations associated with our eleven CODOS sample sites and places them within the framework of the Dust Enhanced Runoff Classification scheme (DERC) developed by CODOS. The intent is to offer a glimpse of plausible WY2021 hydrograph characteristics based on current snowpack and dust conditions compared to similar conditions in our period of record.
SNOWPACK CONDITIONS
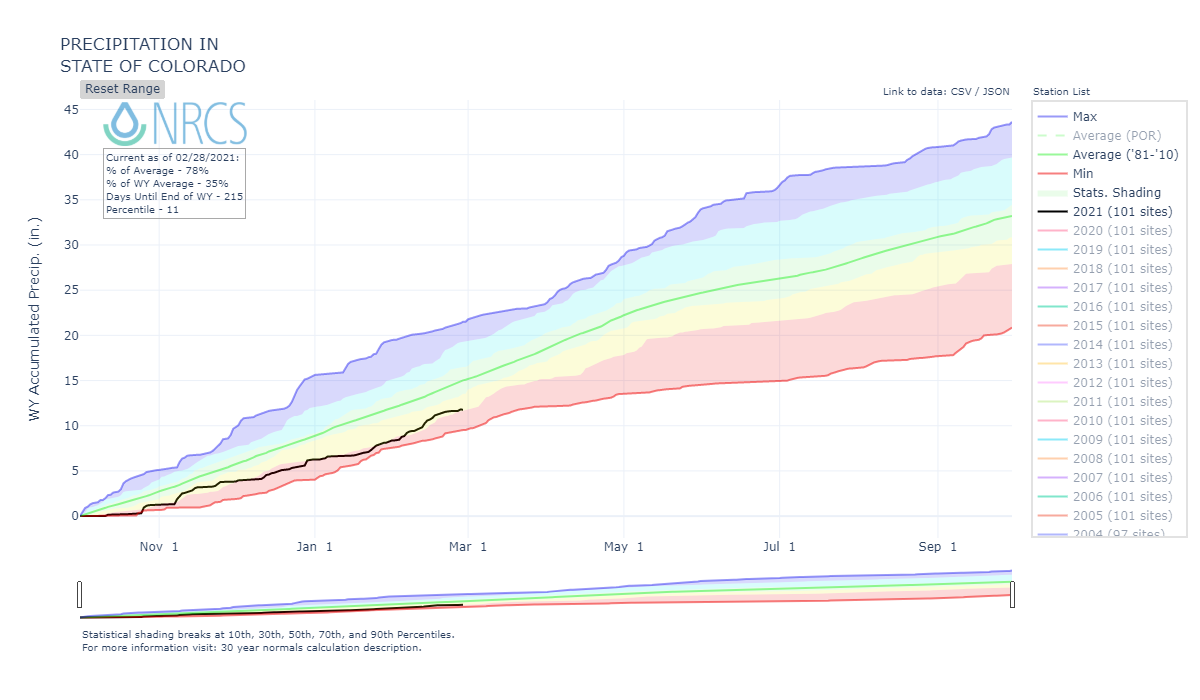
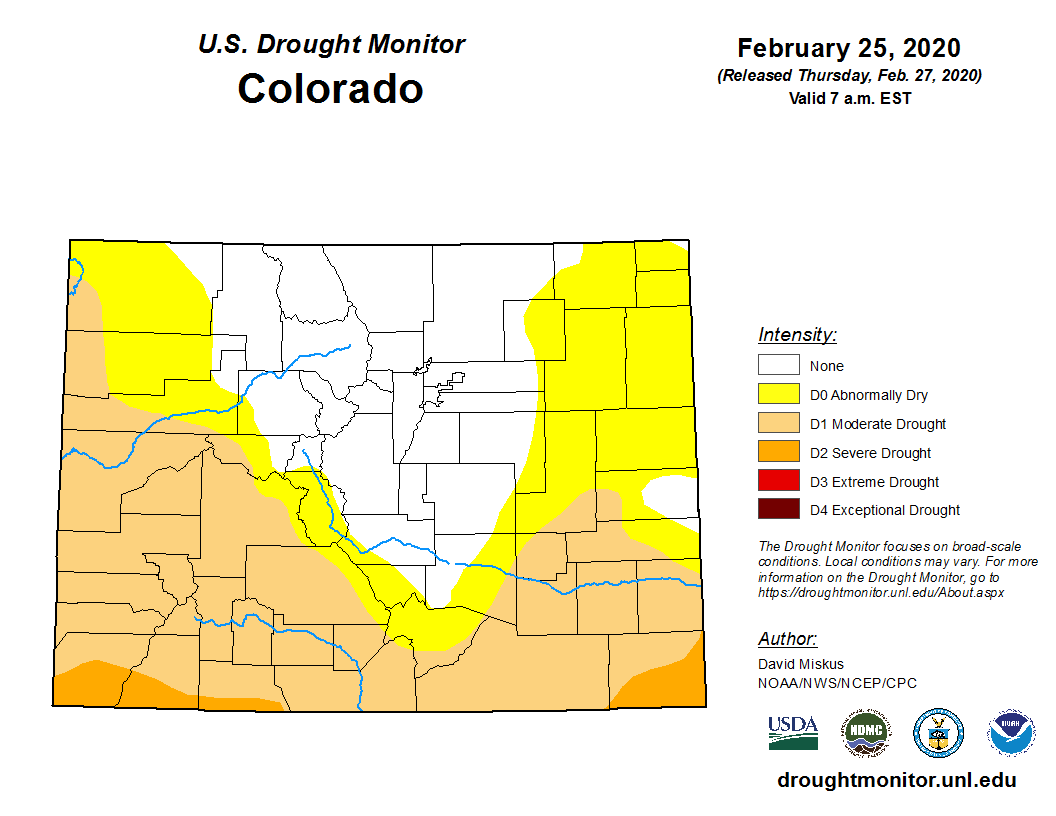
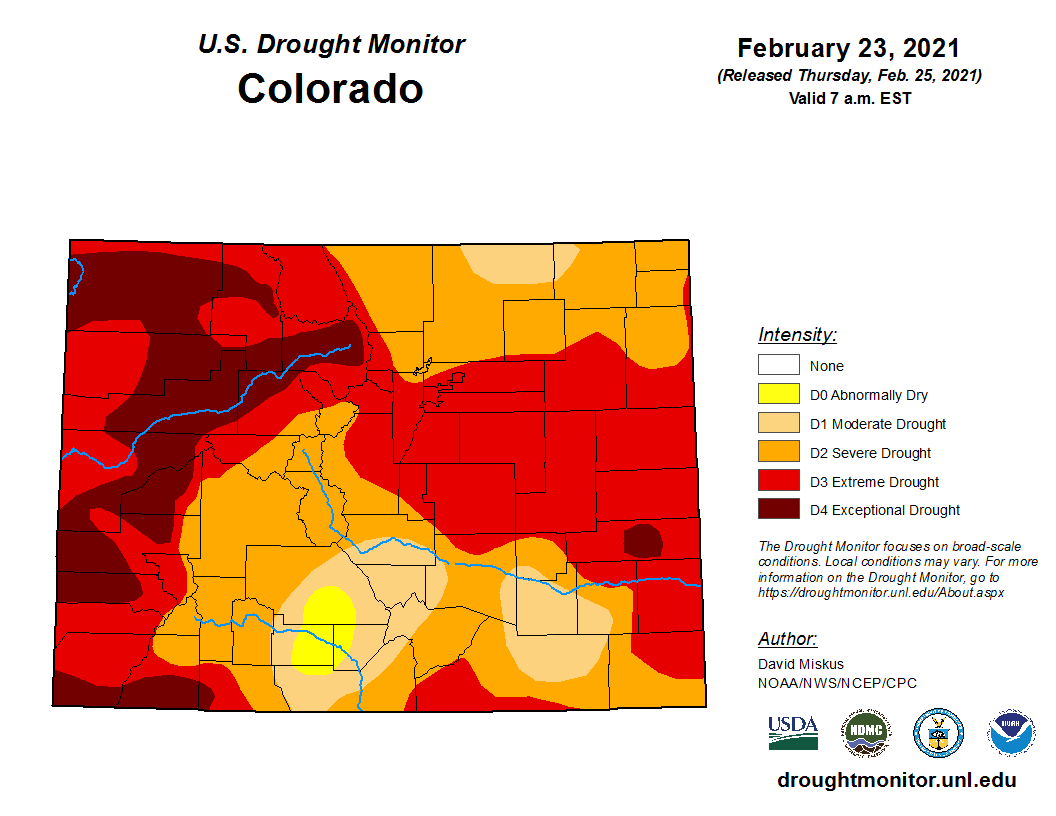
In some ways WY2021 is similar to WY2020 in that we went into both water years very dry with very dry soils due to a failed monsoon season. Once we started seeing precipitation it was cold enough for it to stick around as snow and begin building the snowpack – so if you were looking just at SWE conditions and not precipitation it would be easy to miss the entire severity of our precipitation deficit. A couple of stark differences from last year as we head into spring, as of March 1, basin snowpack averages are 20% less of what they were last year at this time, and the severity of drought conditions last year were mostly drought free or moderate, whereas this year we are in severe to exceptional drought.
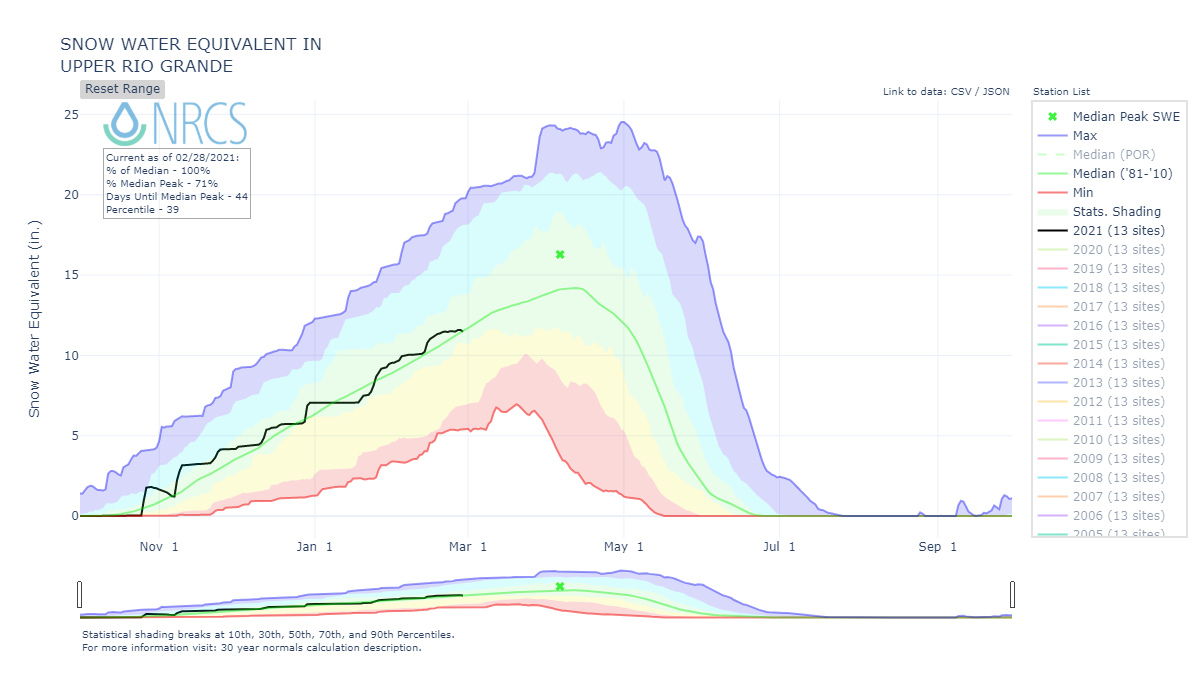
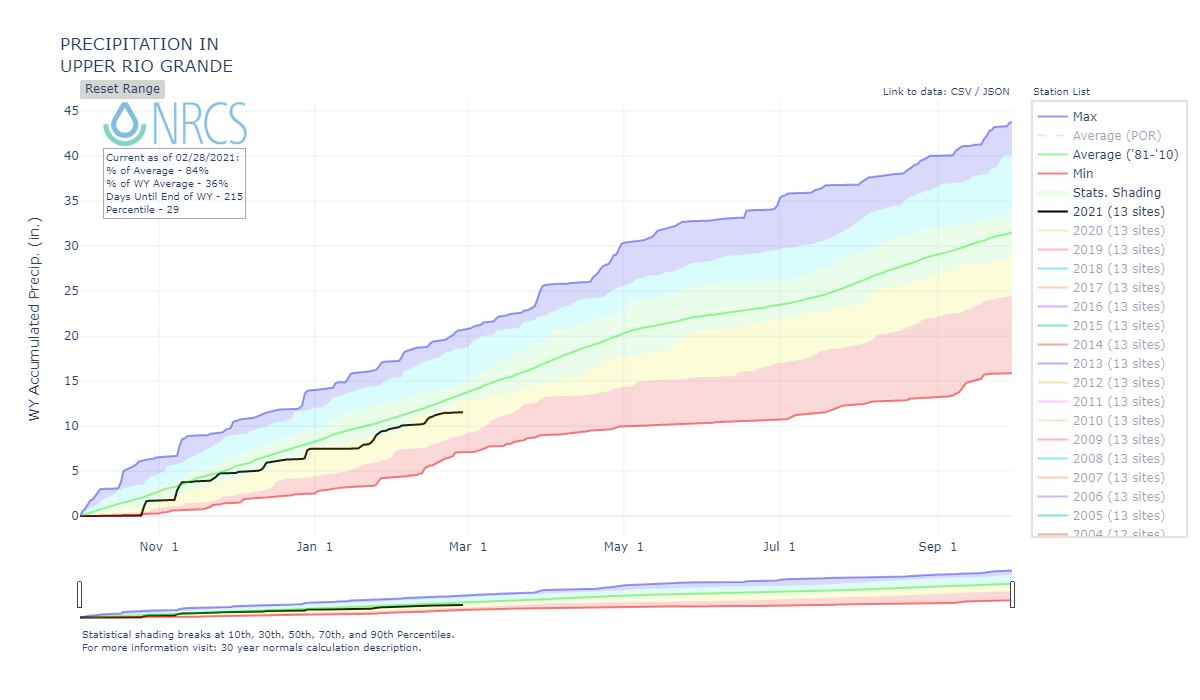
It seems any accumulation to the snowpack this year has been hard won as there were no productive storms that provided a bountiful boost of SWE. However mid-February did bring a string of productive storms, nonetheless major Colorado basins sit near 89% on average. One exception throughout these winter months thus far is the Rio Grande Basin which has been slightly favored when the storm tracks rolled through. This is the only basin that has held onto a median snowpack the majority of the winter season.
A Brief Monthly Summary
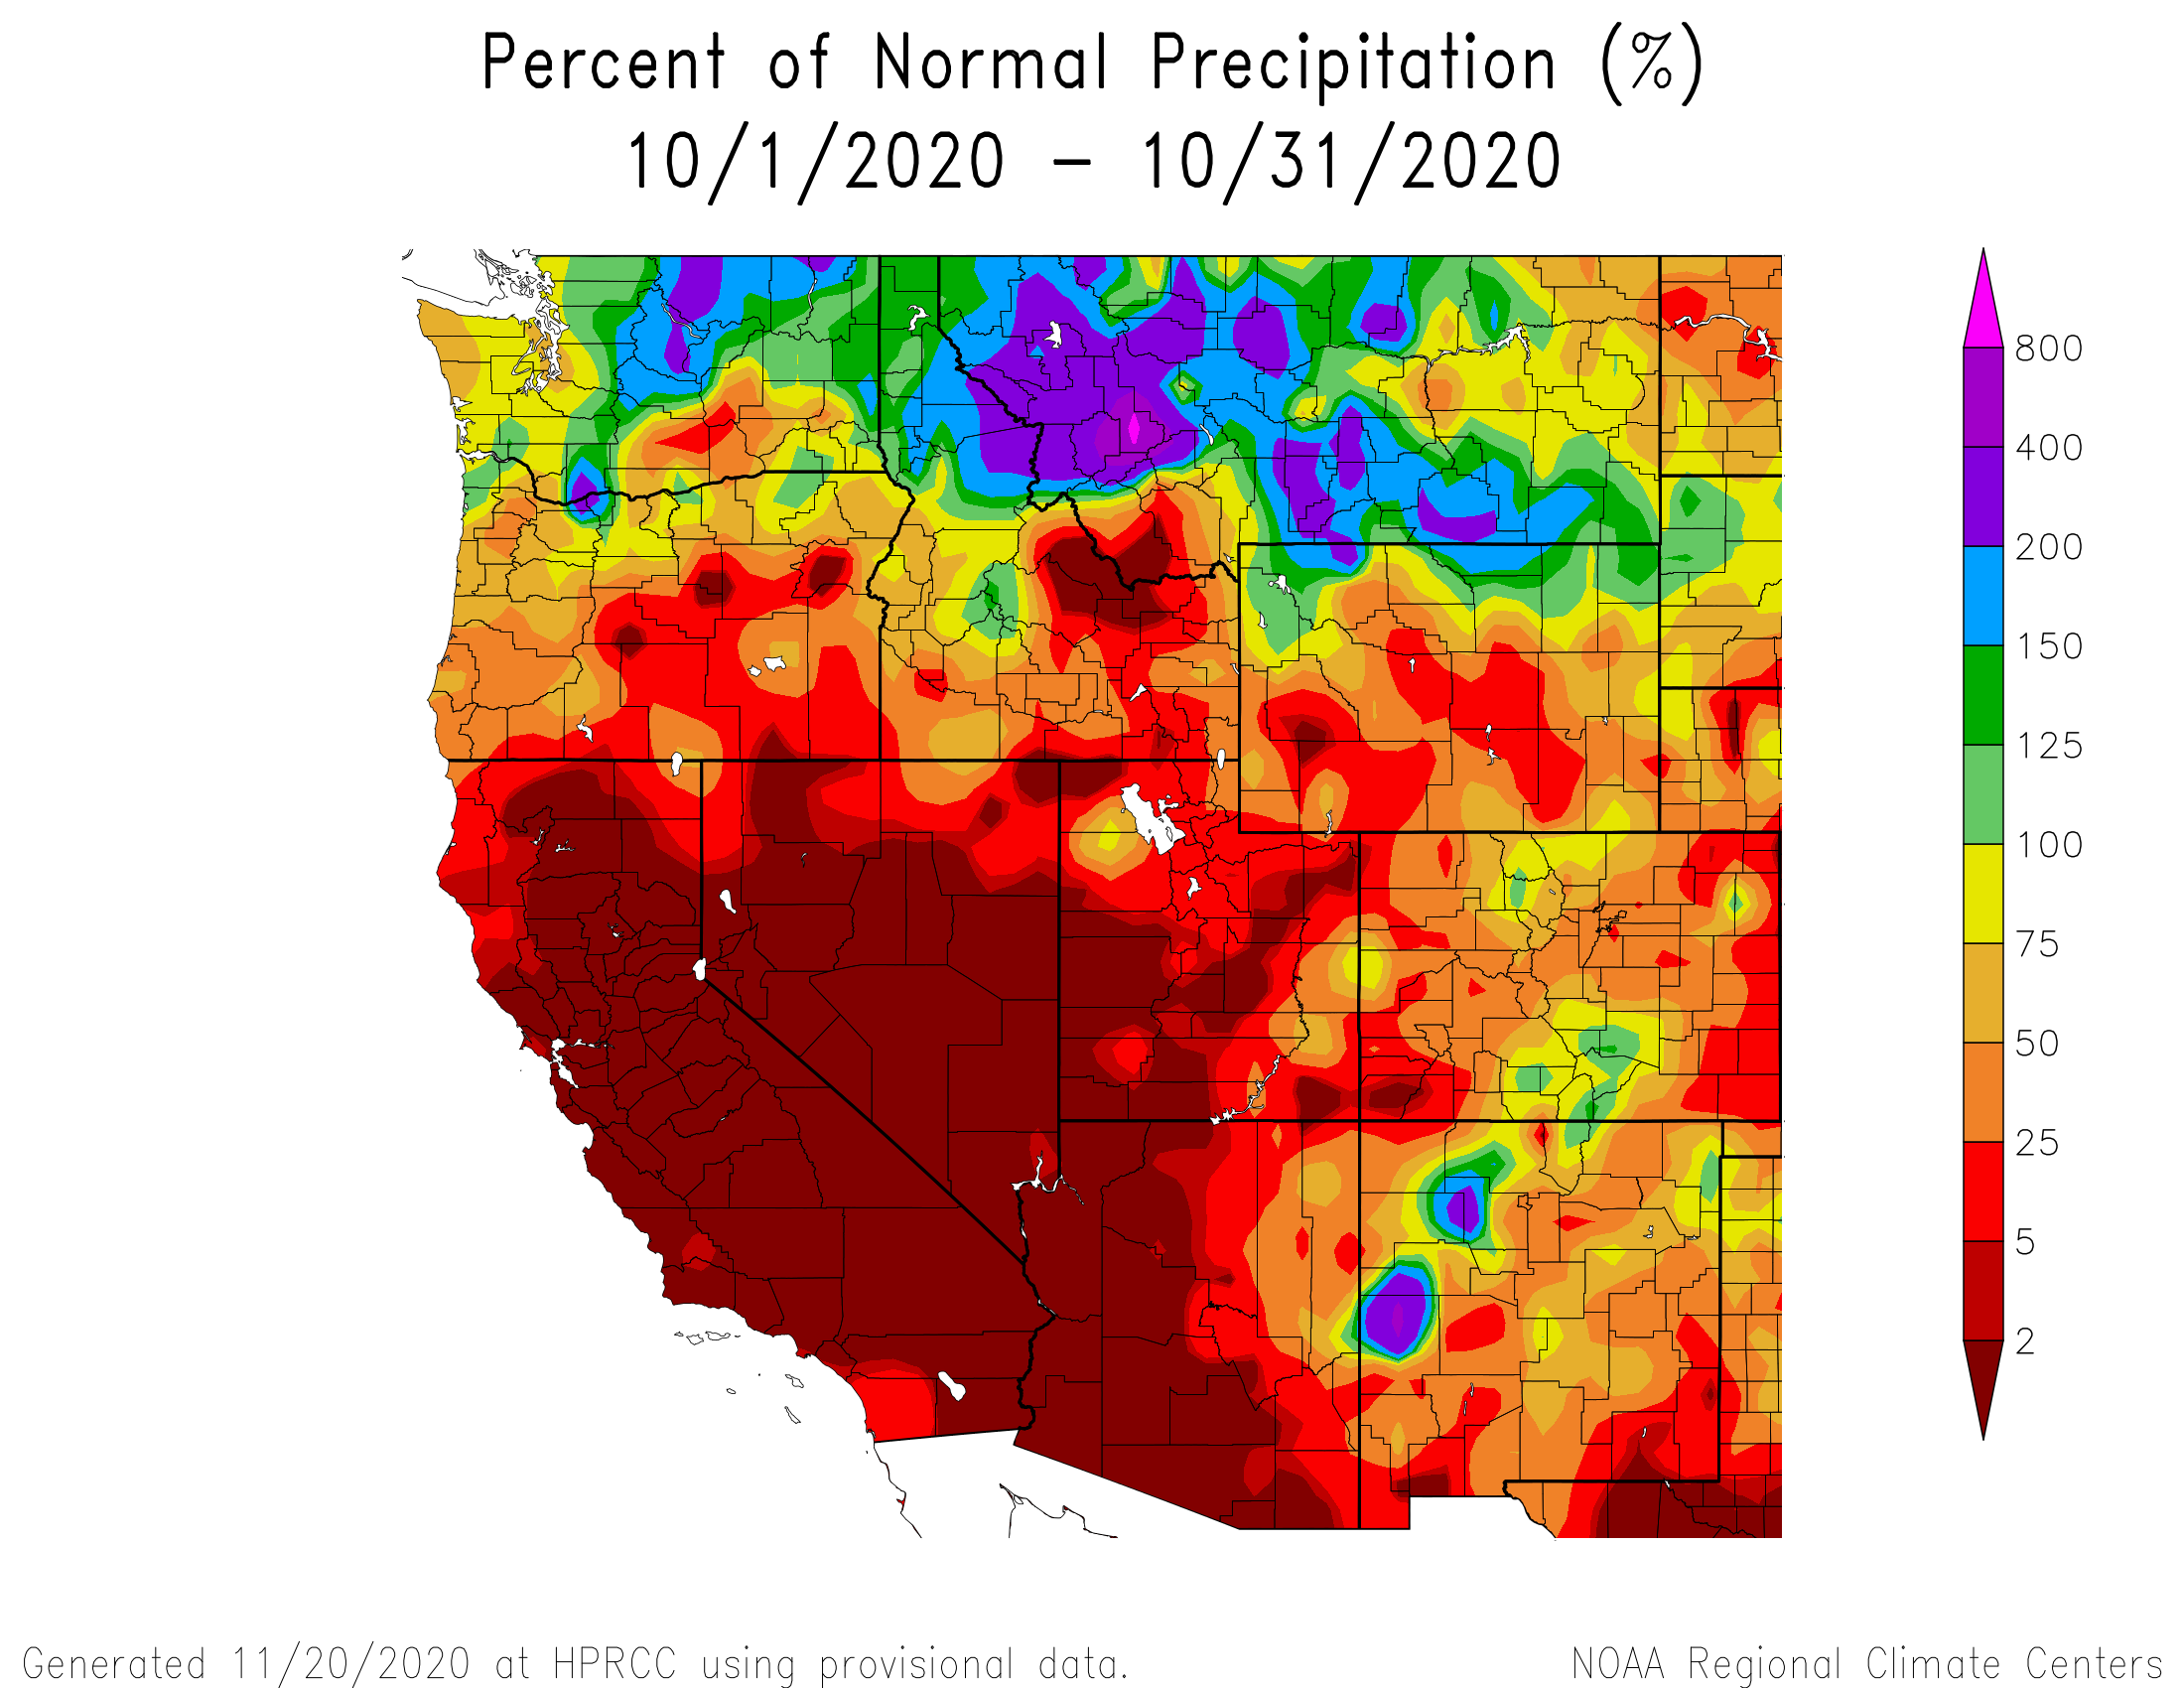
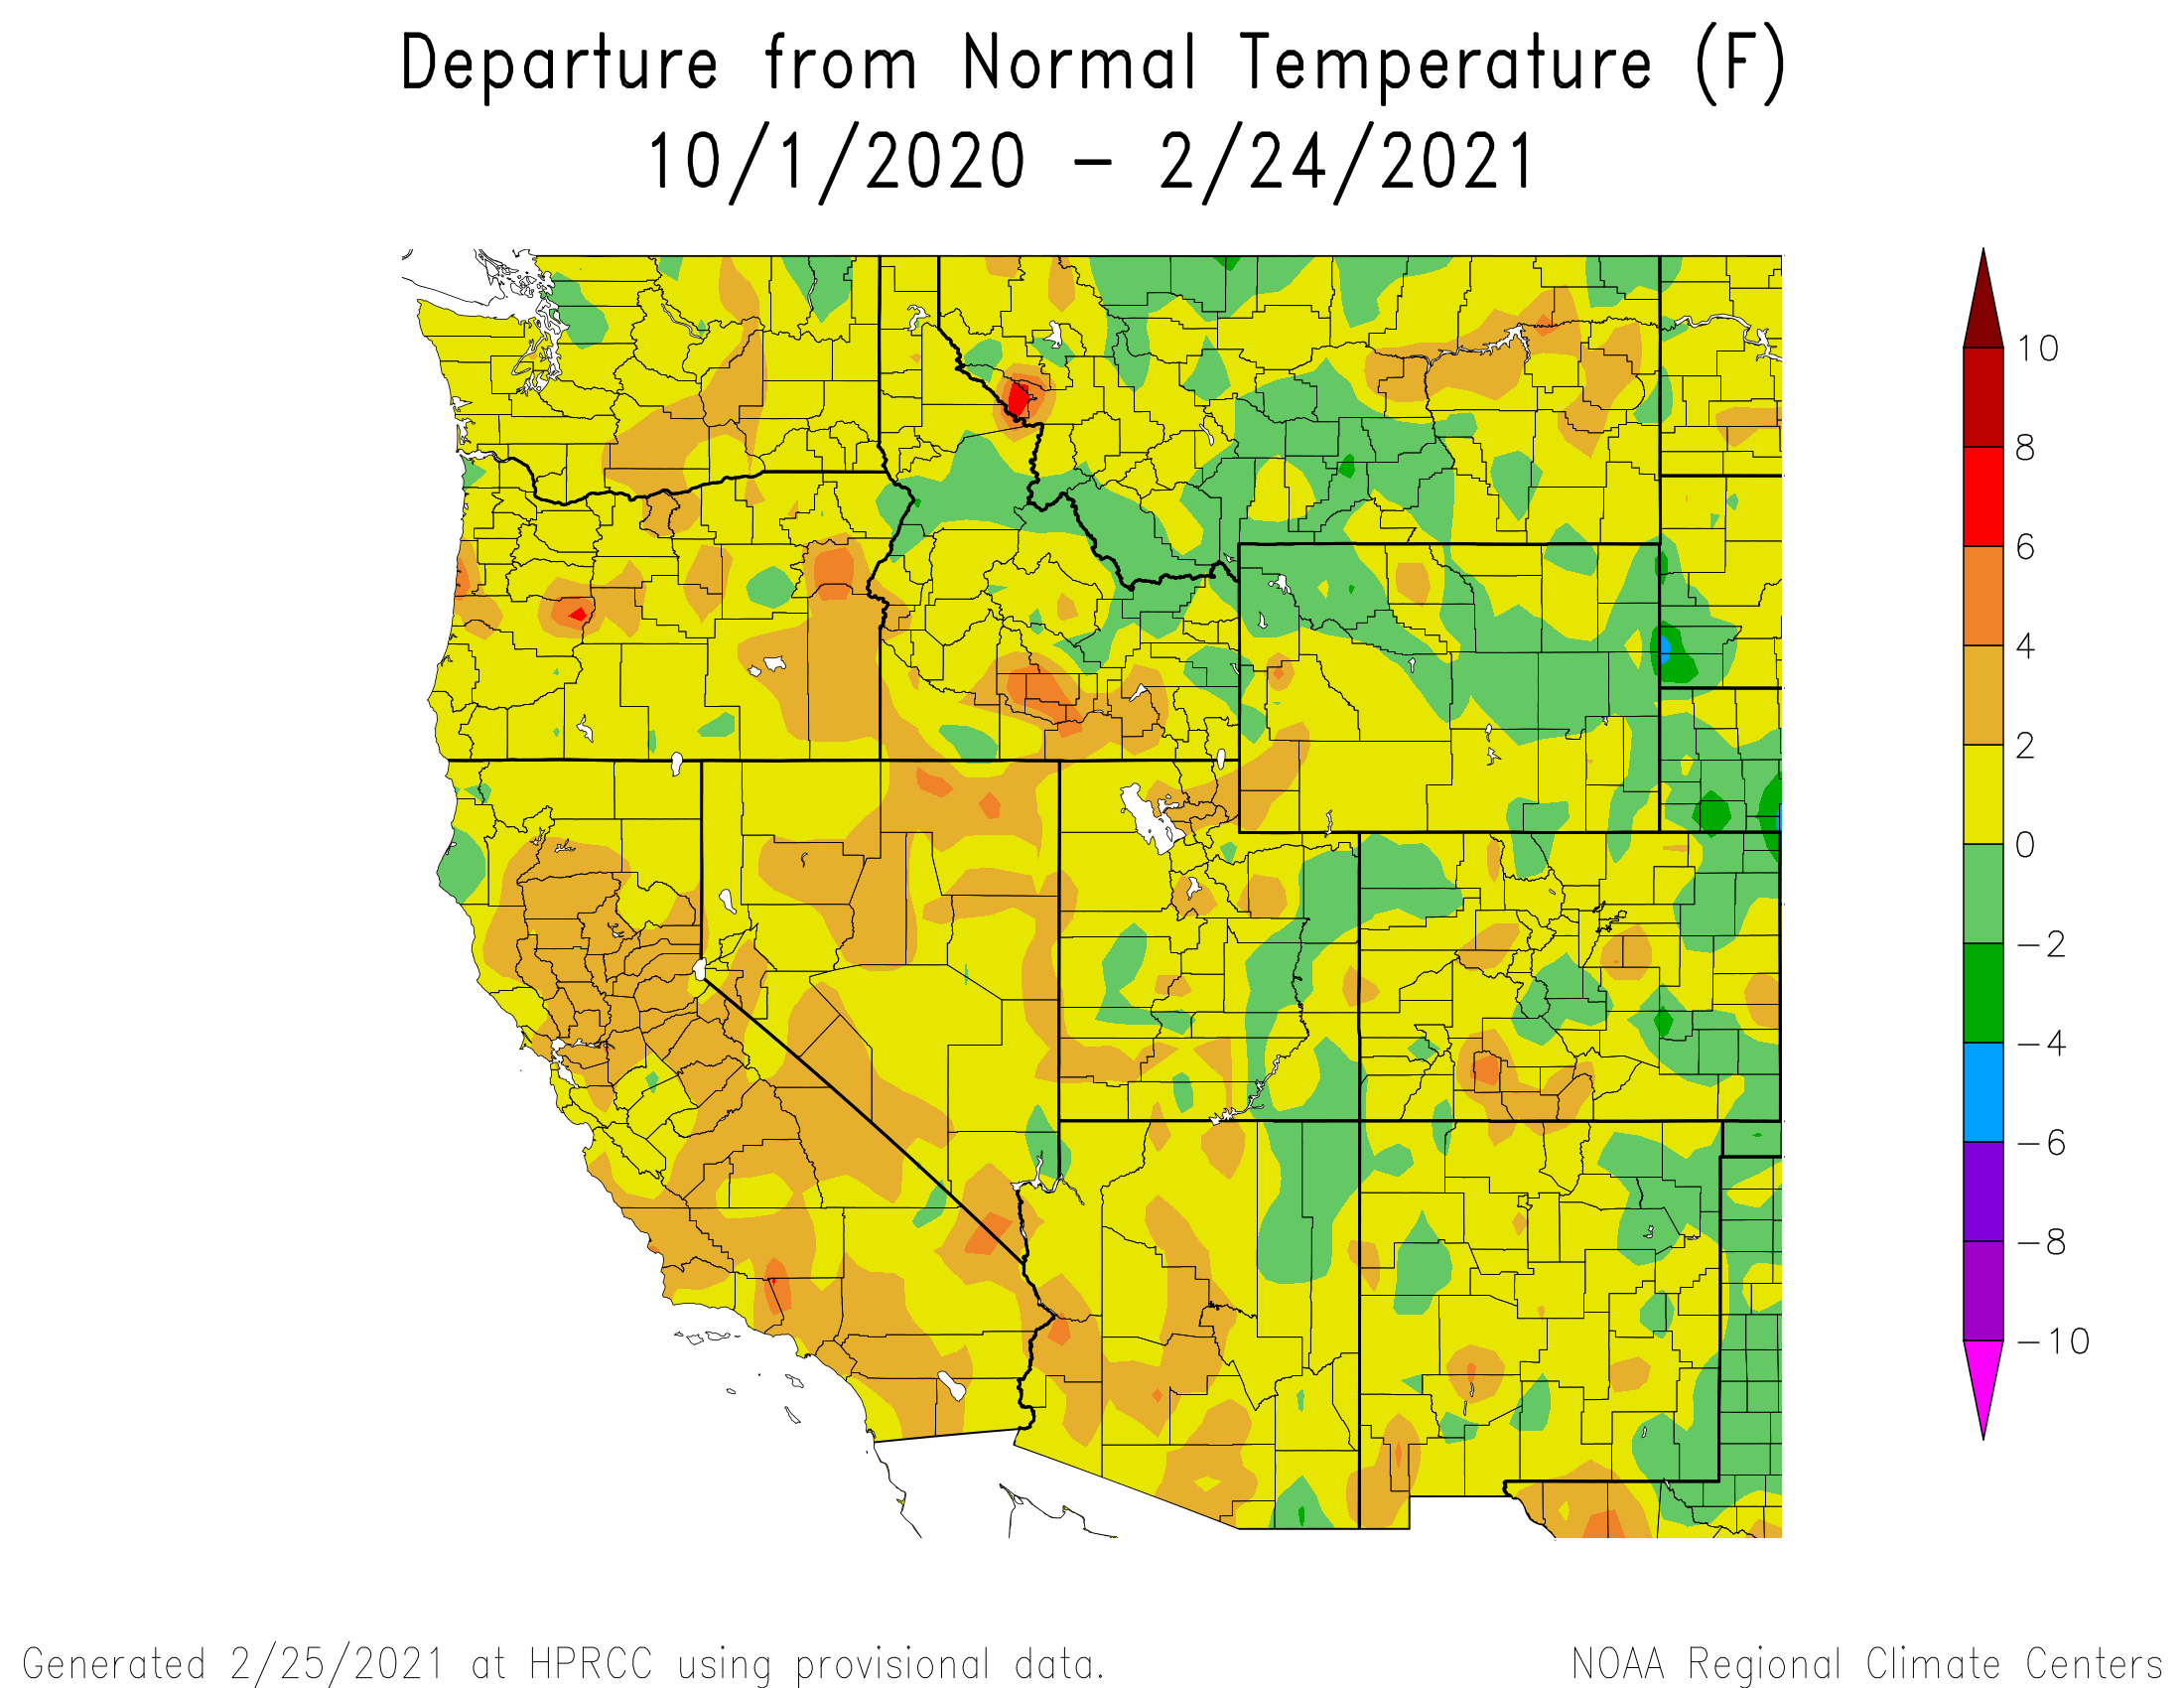
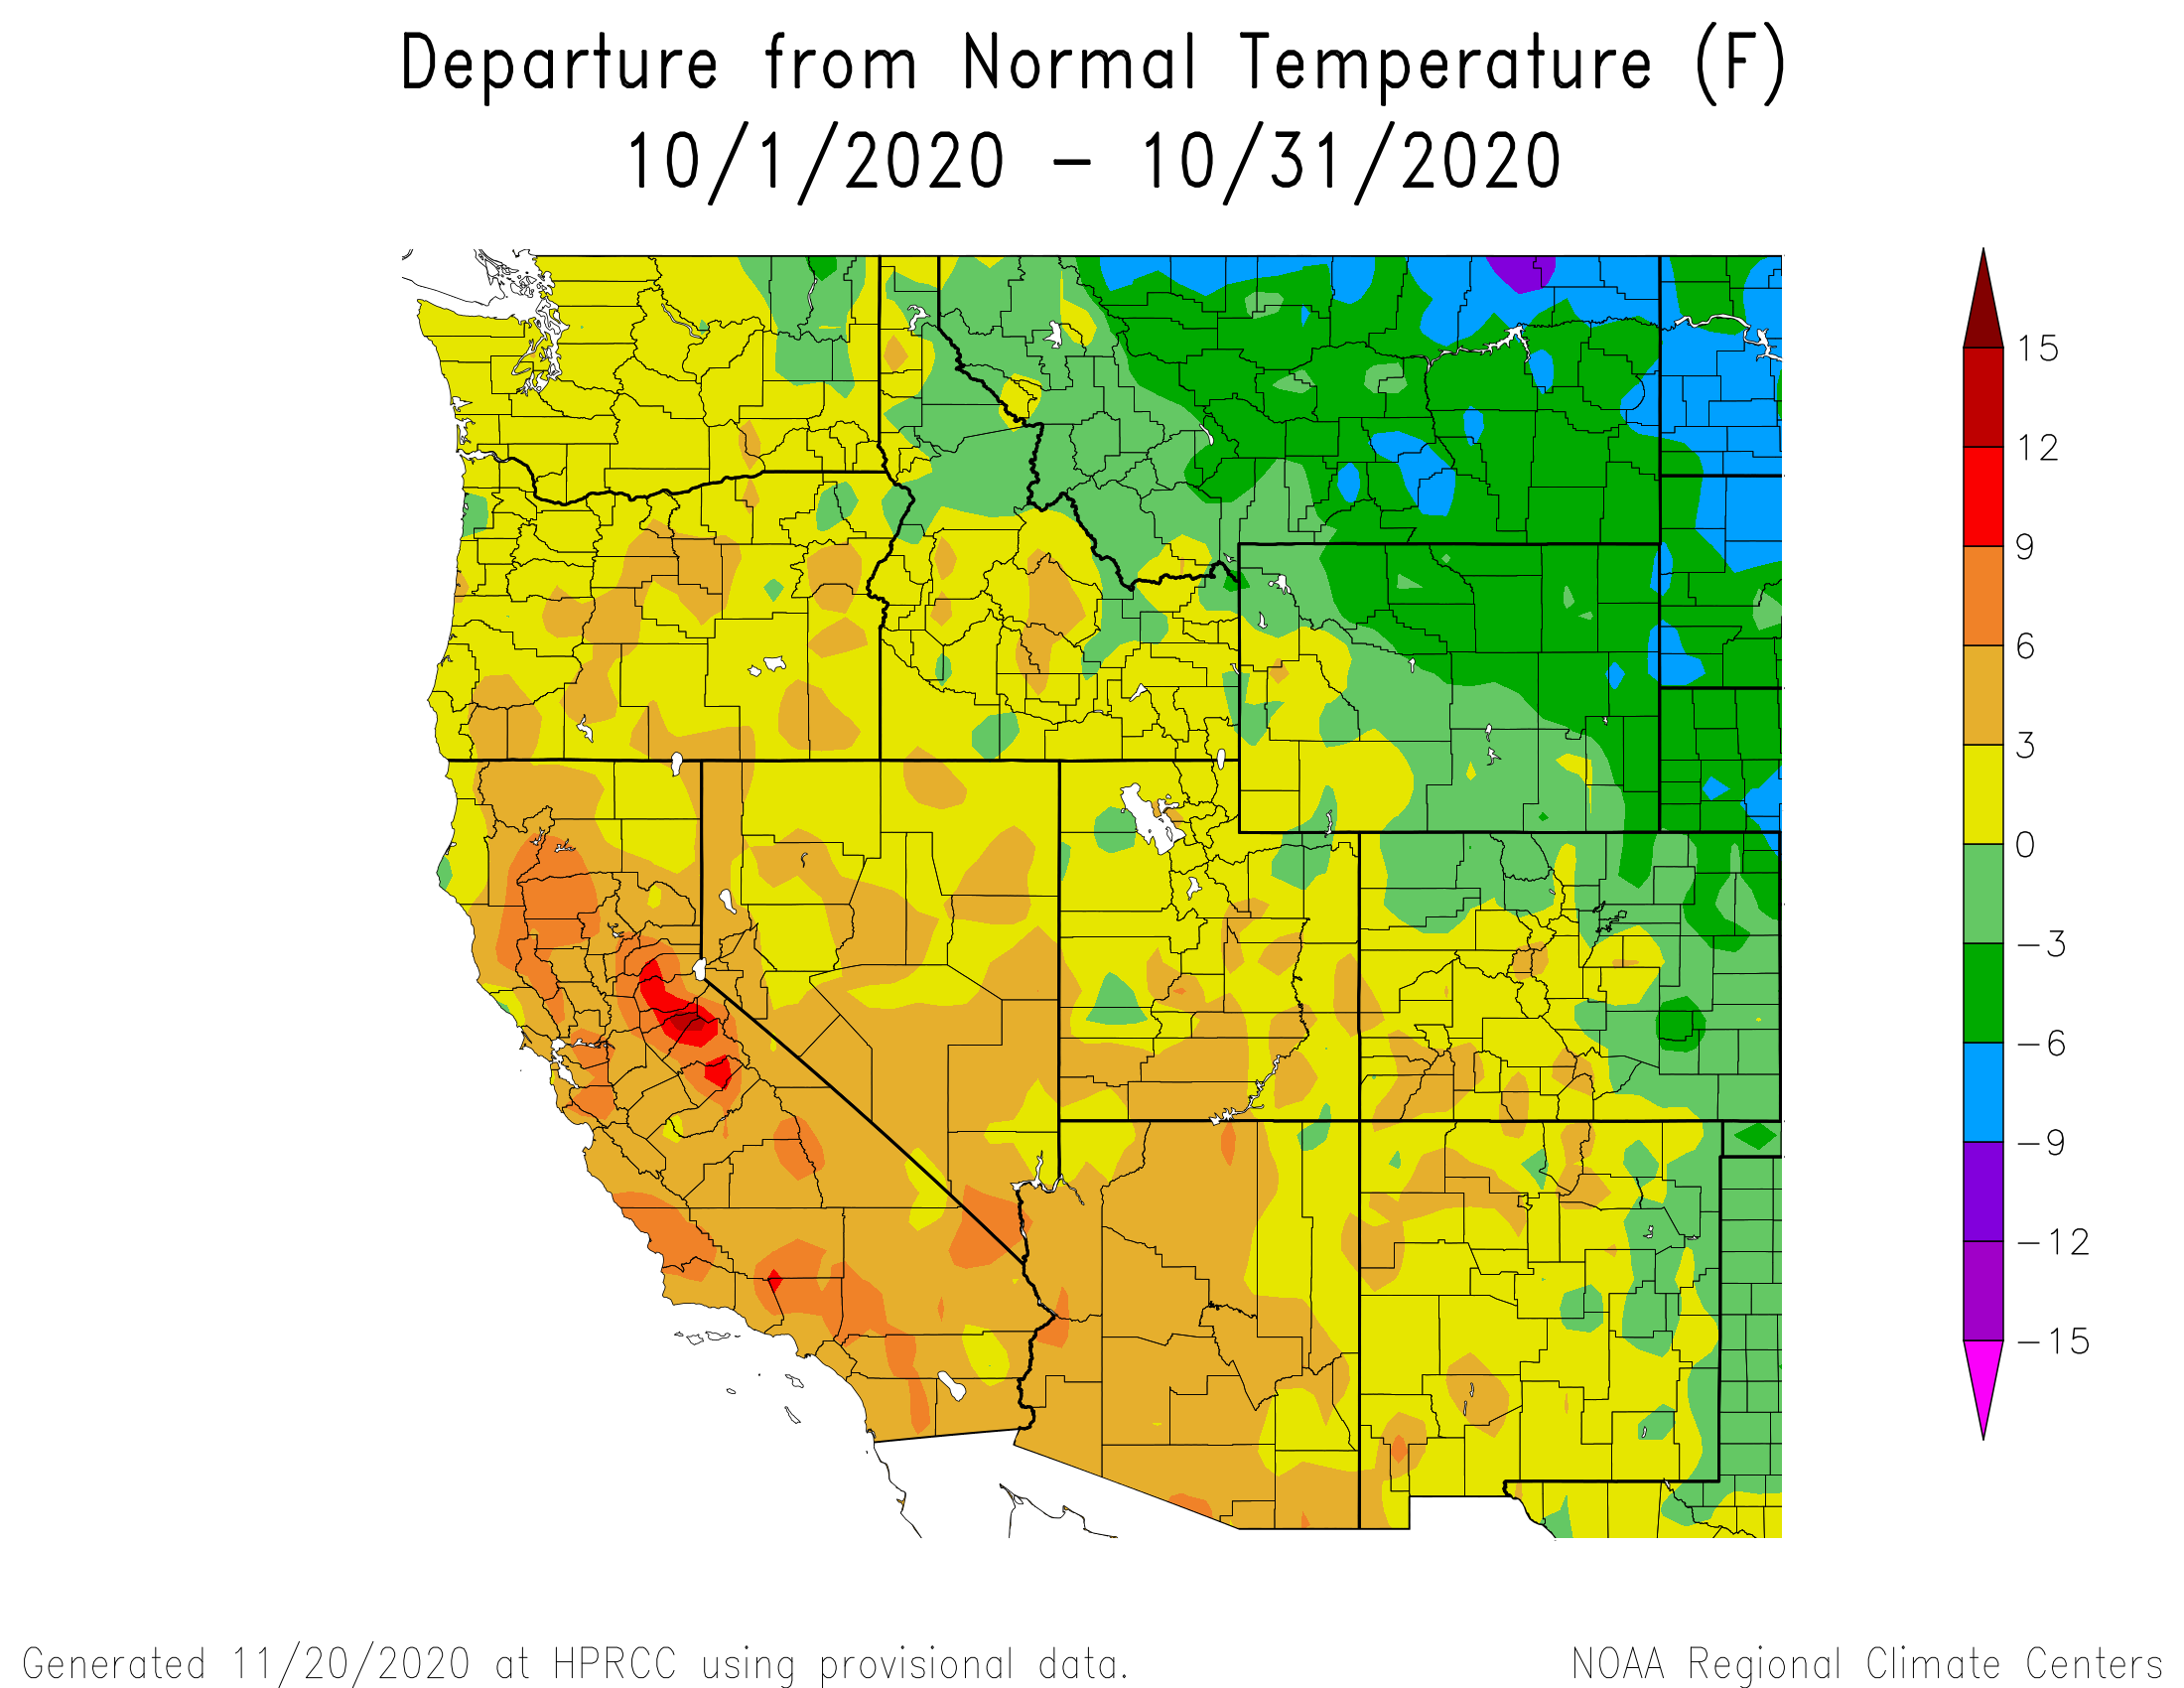
October 2020: The first two-thirds of October was the usual continuation of summertime hot and dry conditions before a storm and dynamic cold front moved through the area on October 24-26. This was the start of snowpack (0.7” at Swamp Angel) as significant snow fell in the mountains and some valleys. As this storm passed cold temperatures moved in breaking low records and abruptly ended valley agriculture. A warming and dry trend closed out the month. It was a hotter (0.5 – 3.0 degrees) and drier than normal overall.
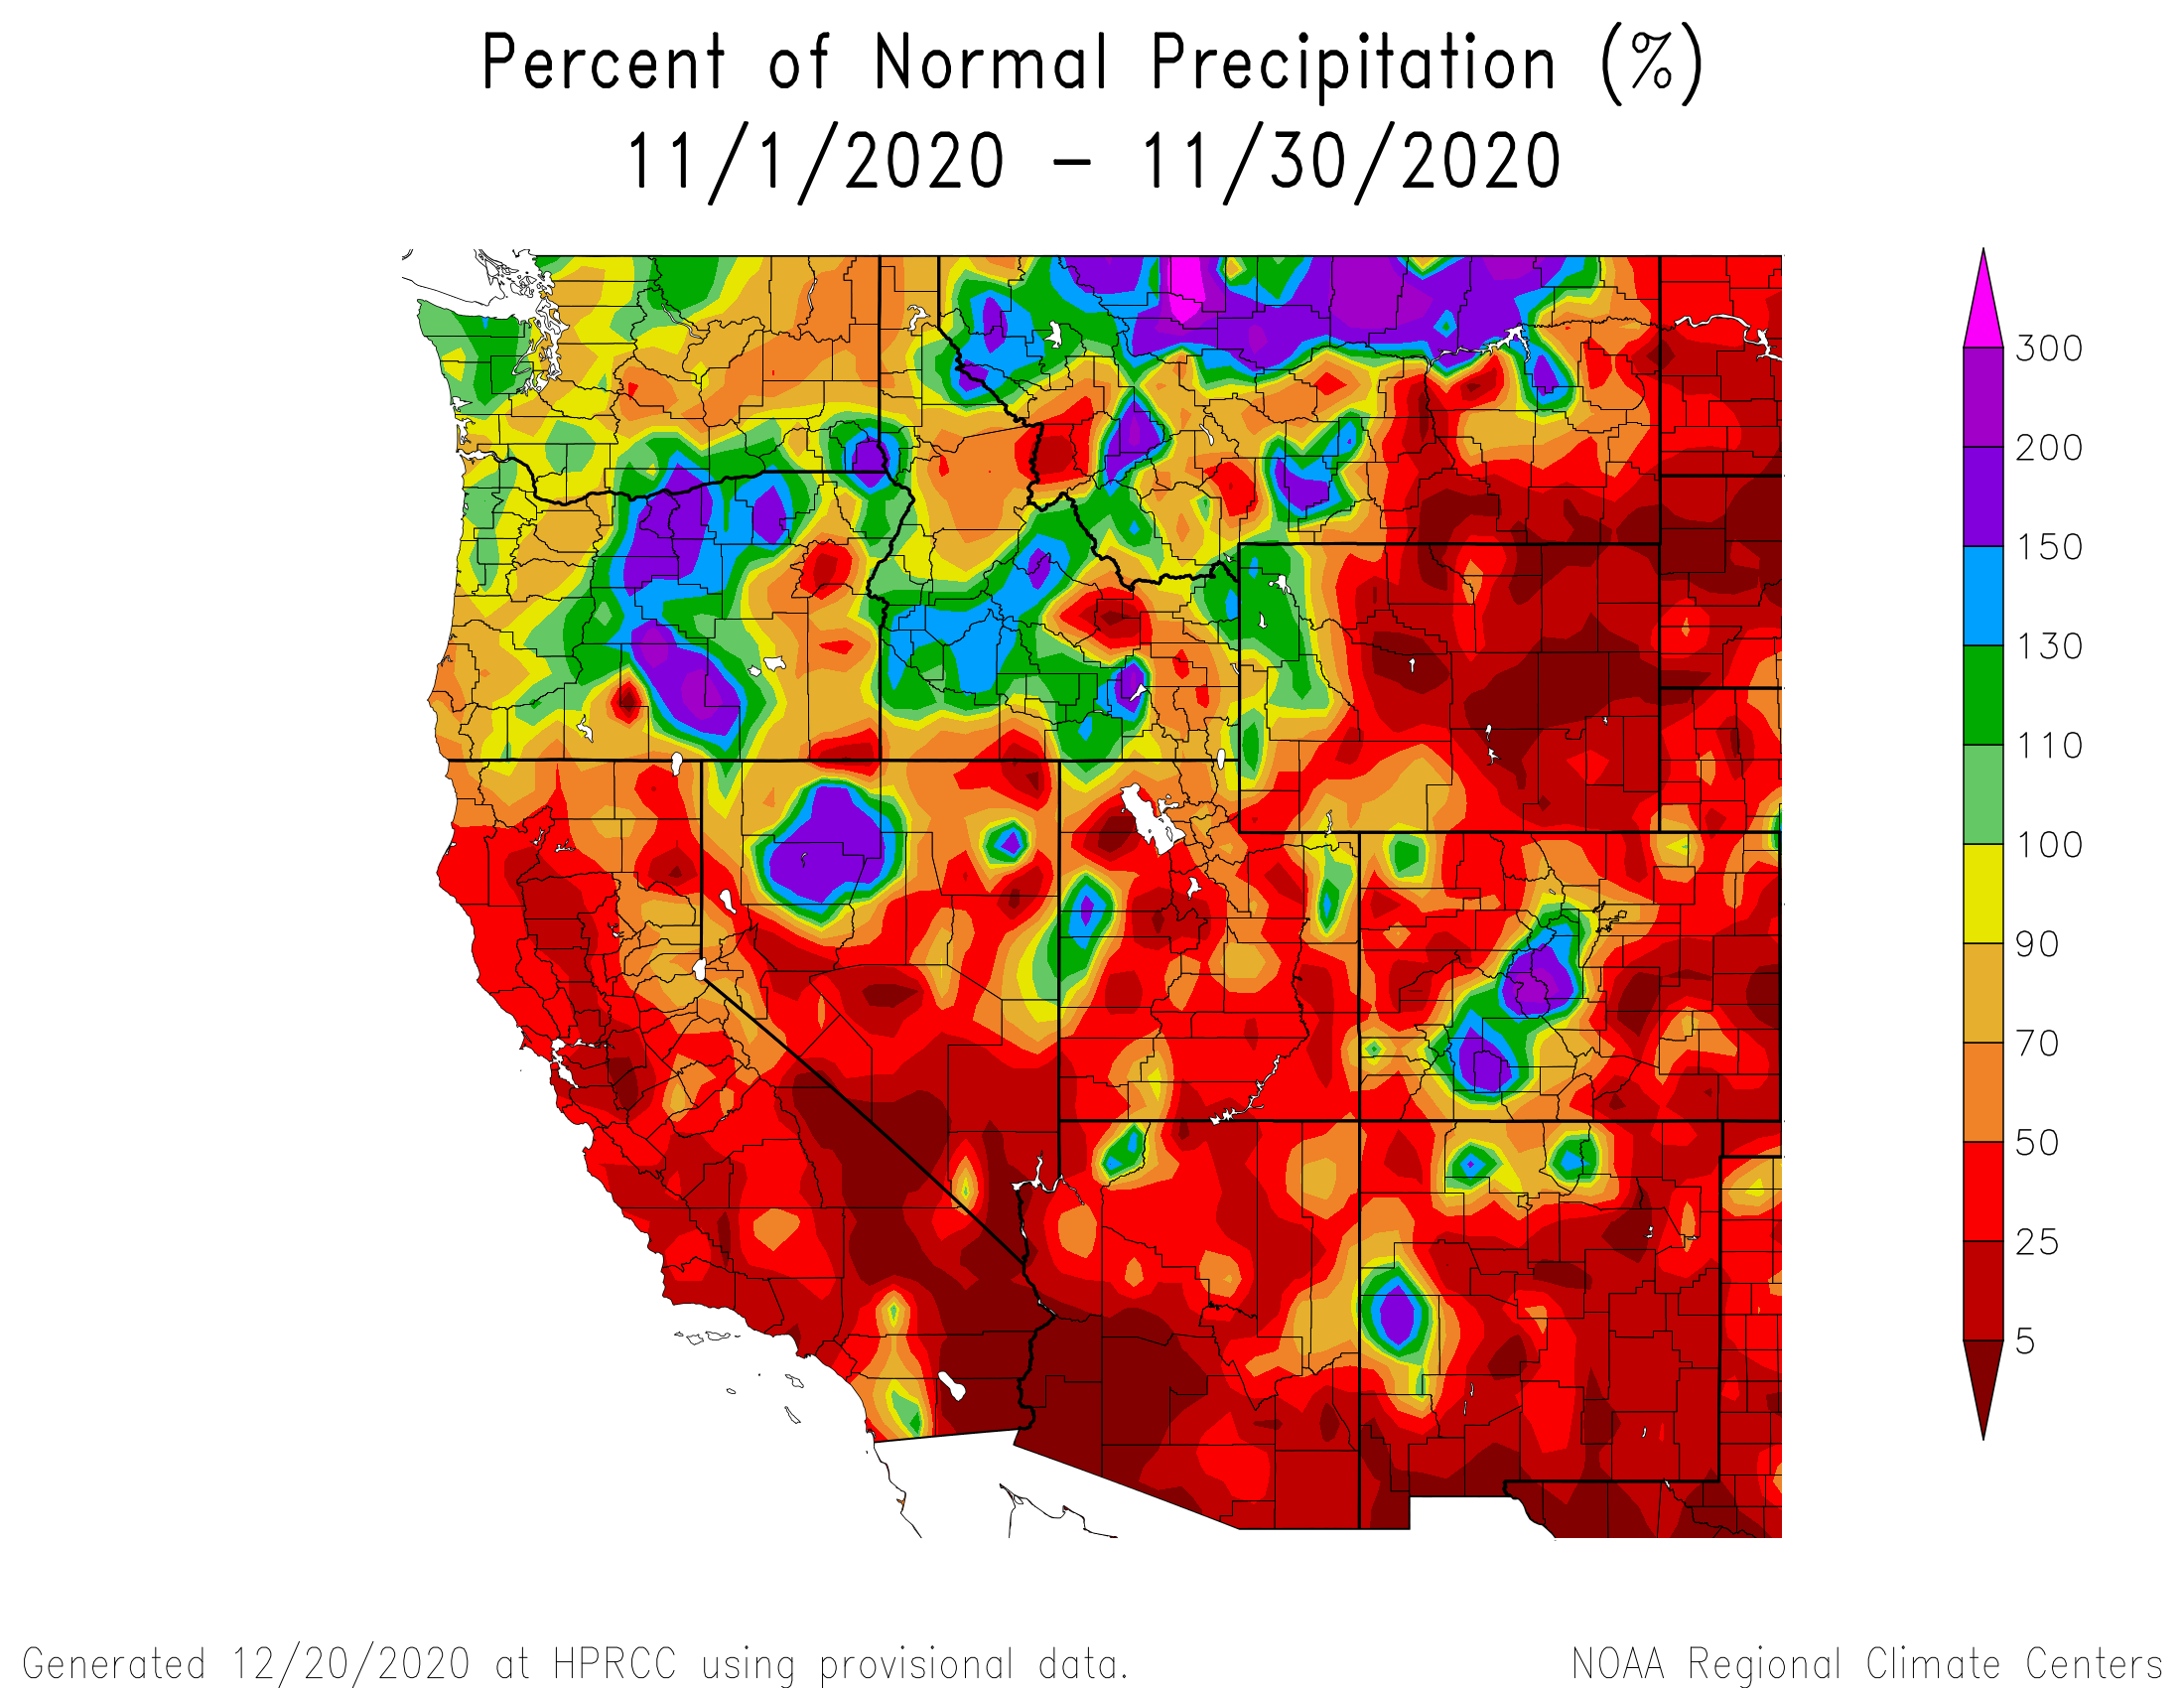
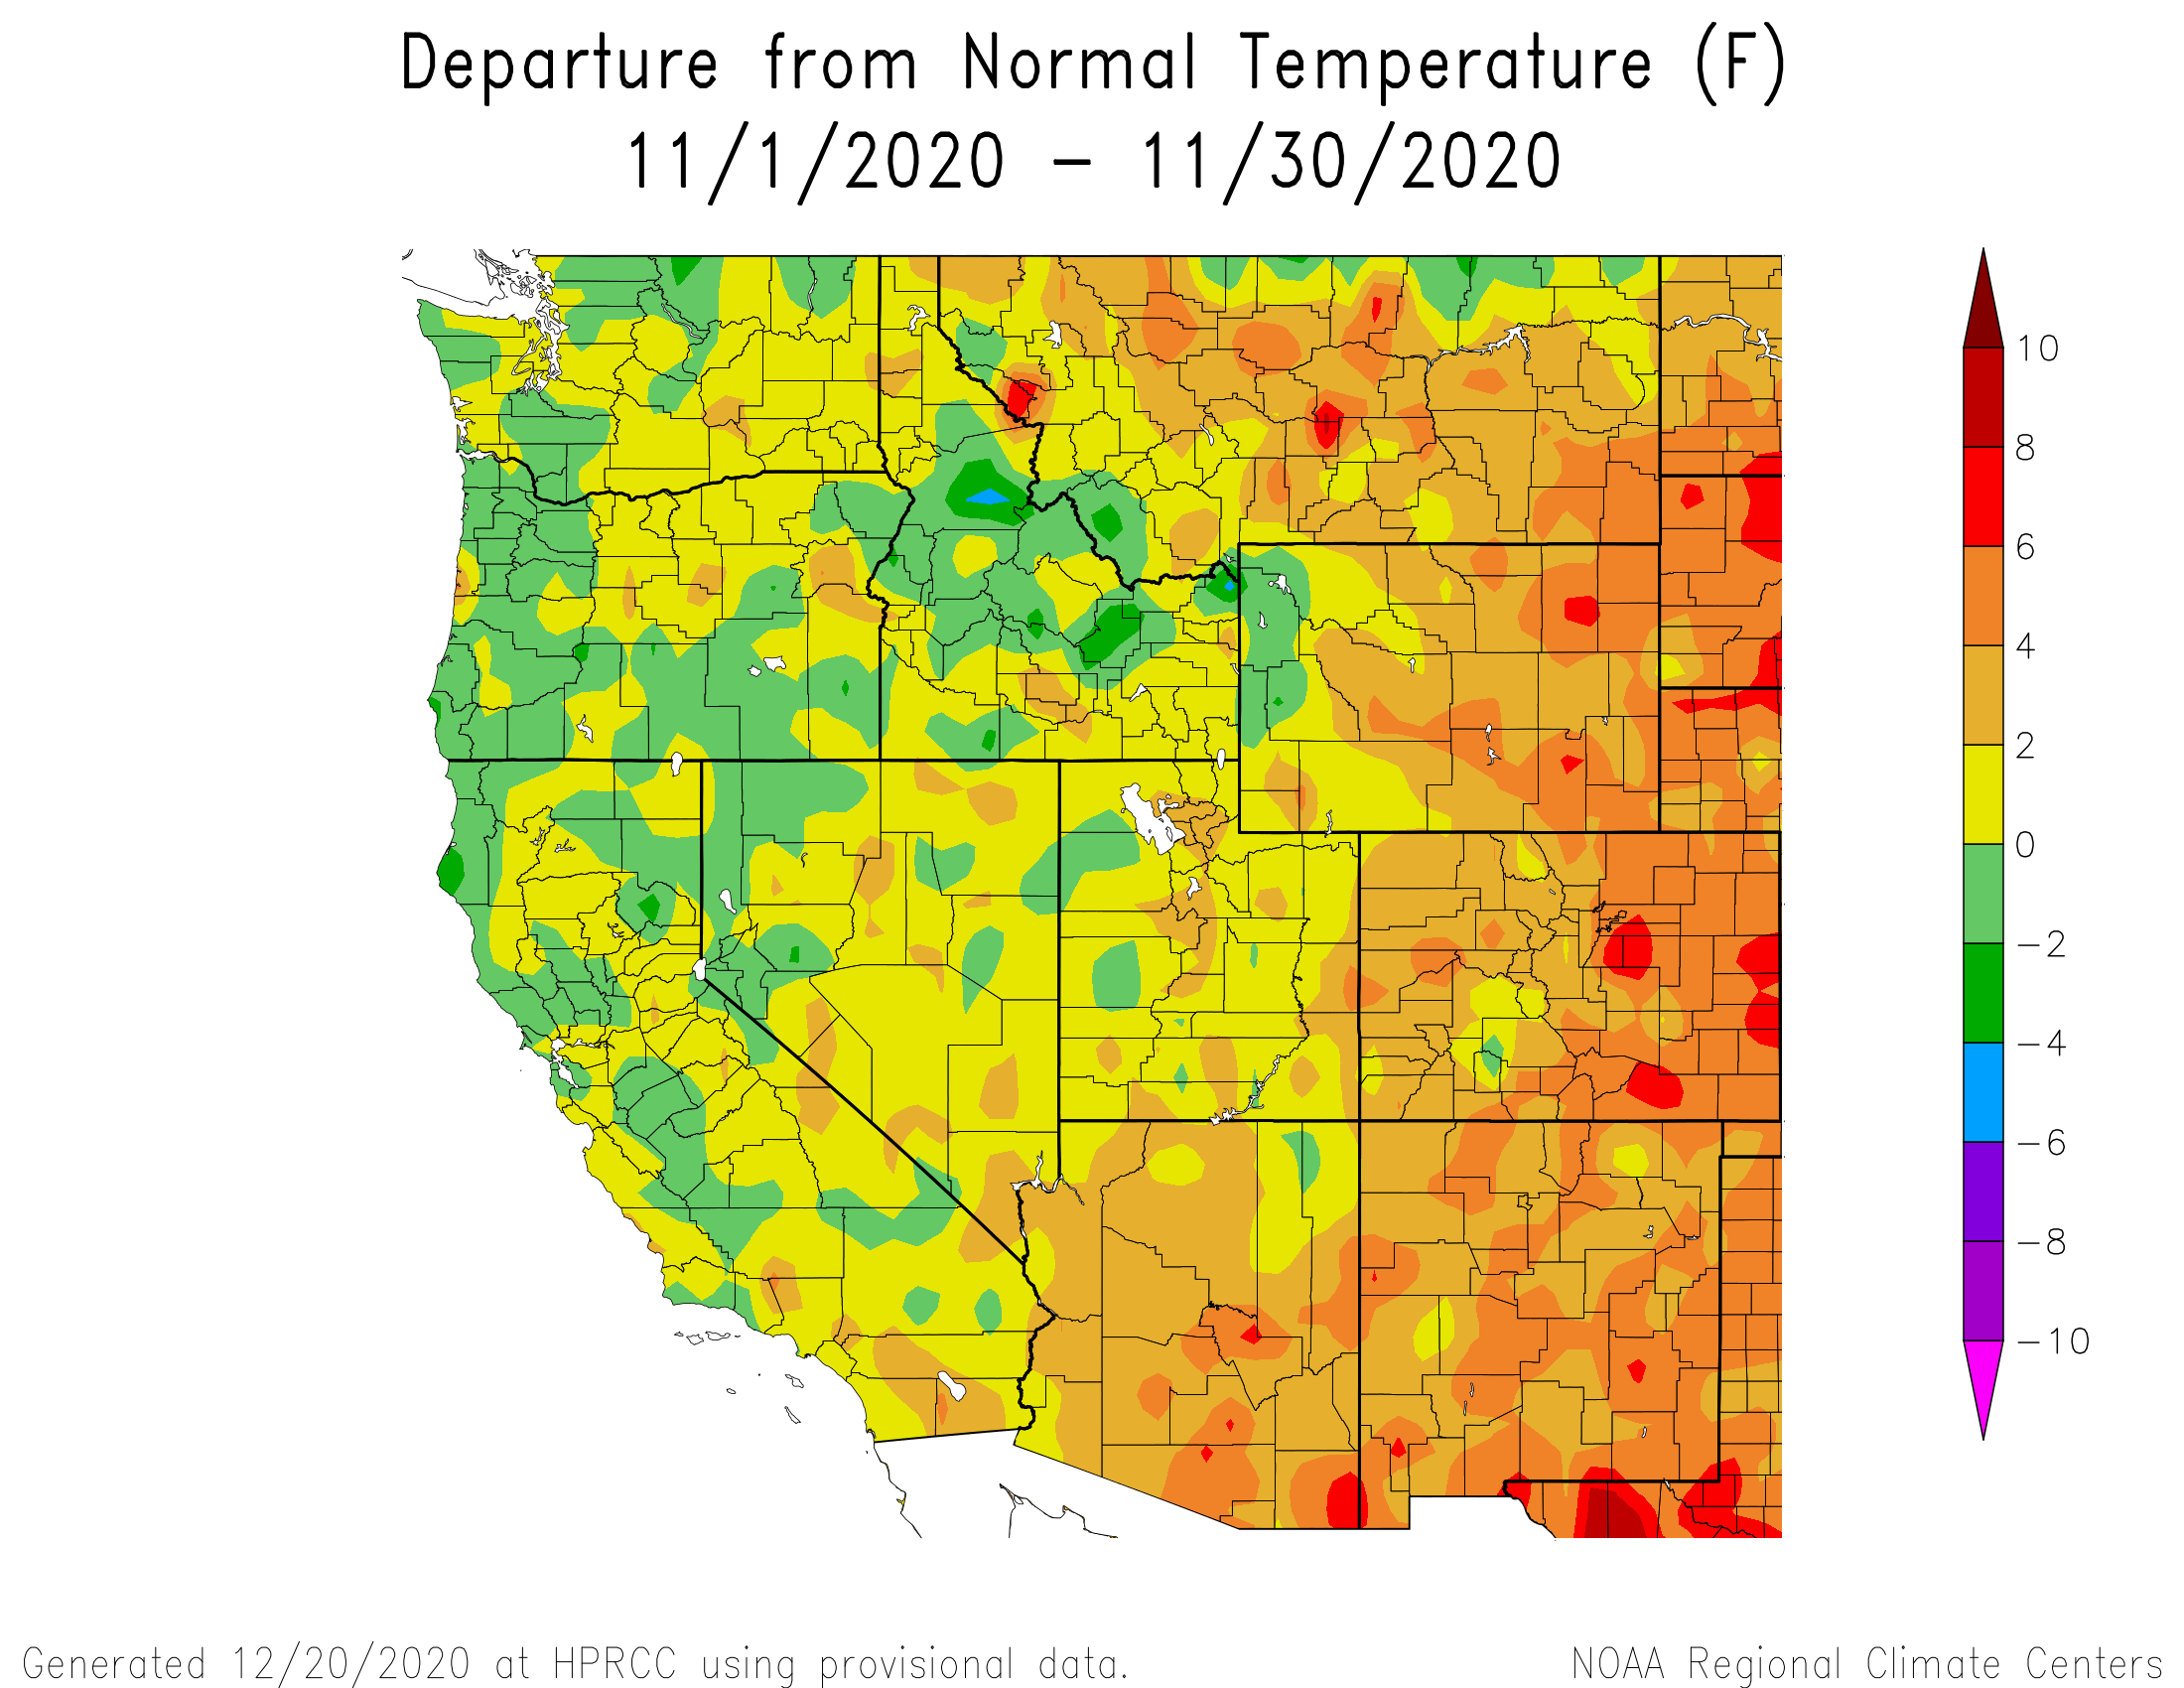
November: The first week of November continued the warming trend carried over from the end of October. November 8 started off a week that delivered 3.1” precipitation as 16” snow accumulation at Swampy. Warm and dry conditions prevailed for another week until Nov 22-24 saw decent accumulation across the Colorado mountains, at Swampy that meant 1.1” precipitation.
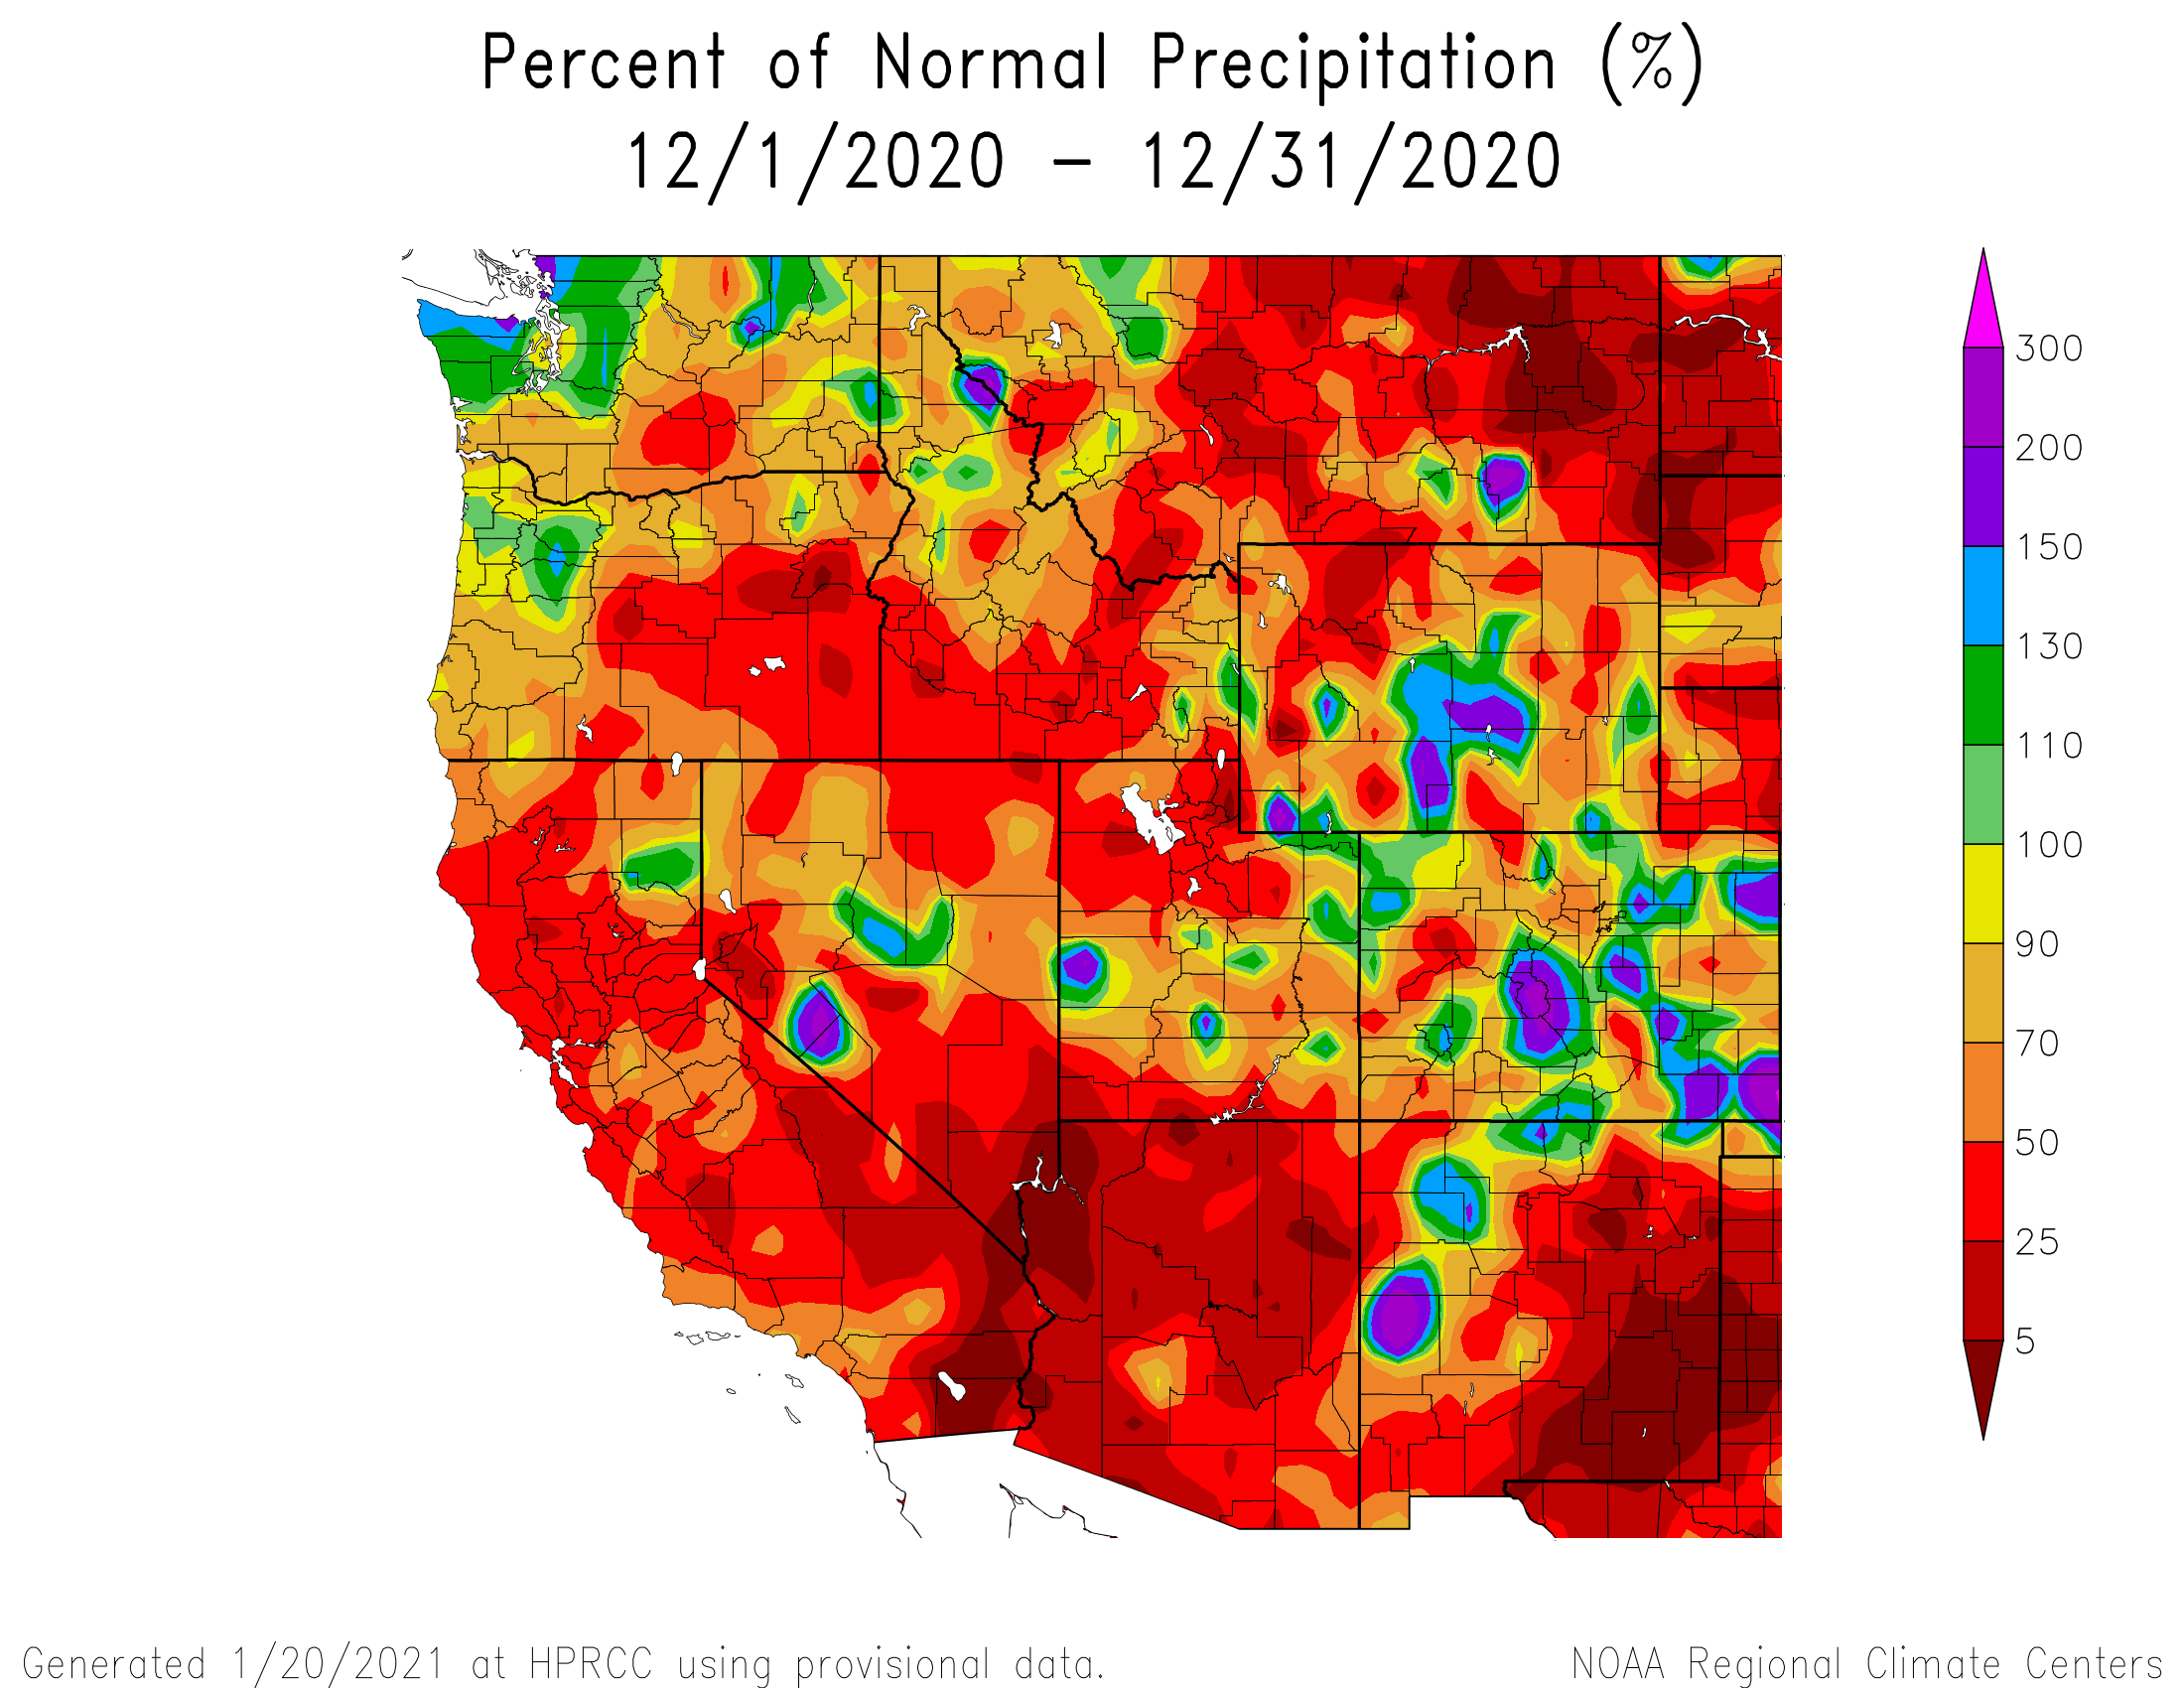
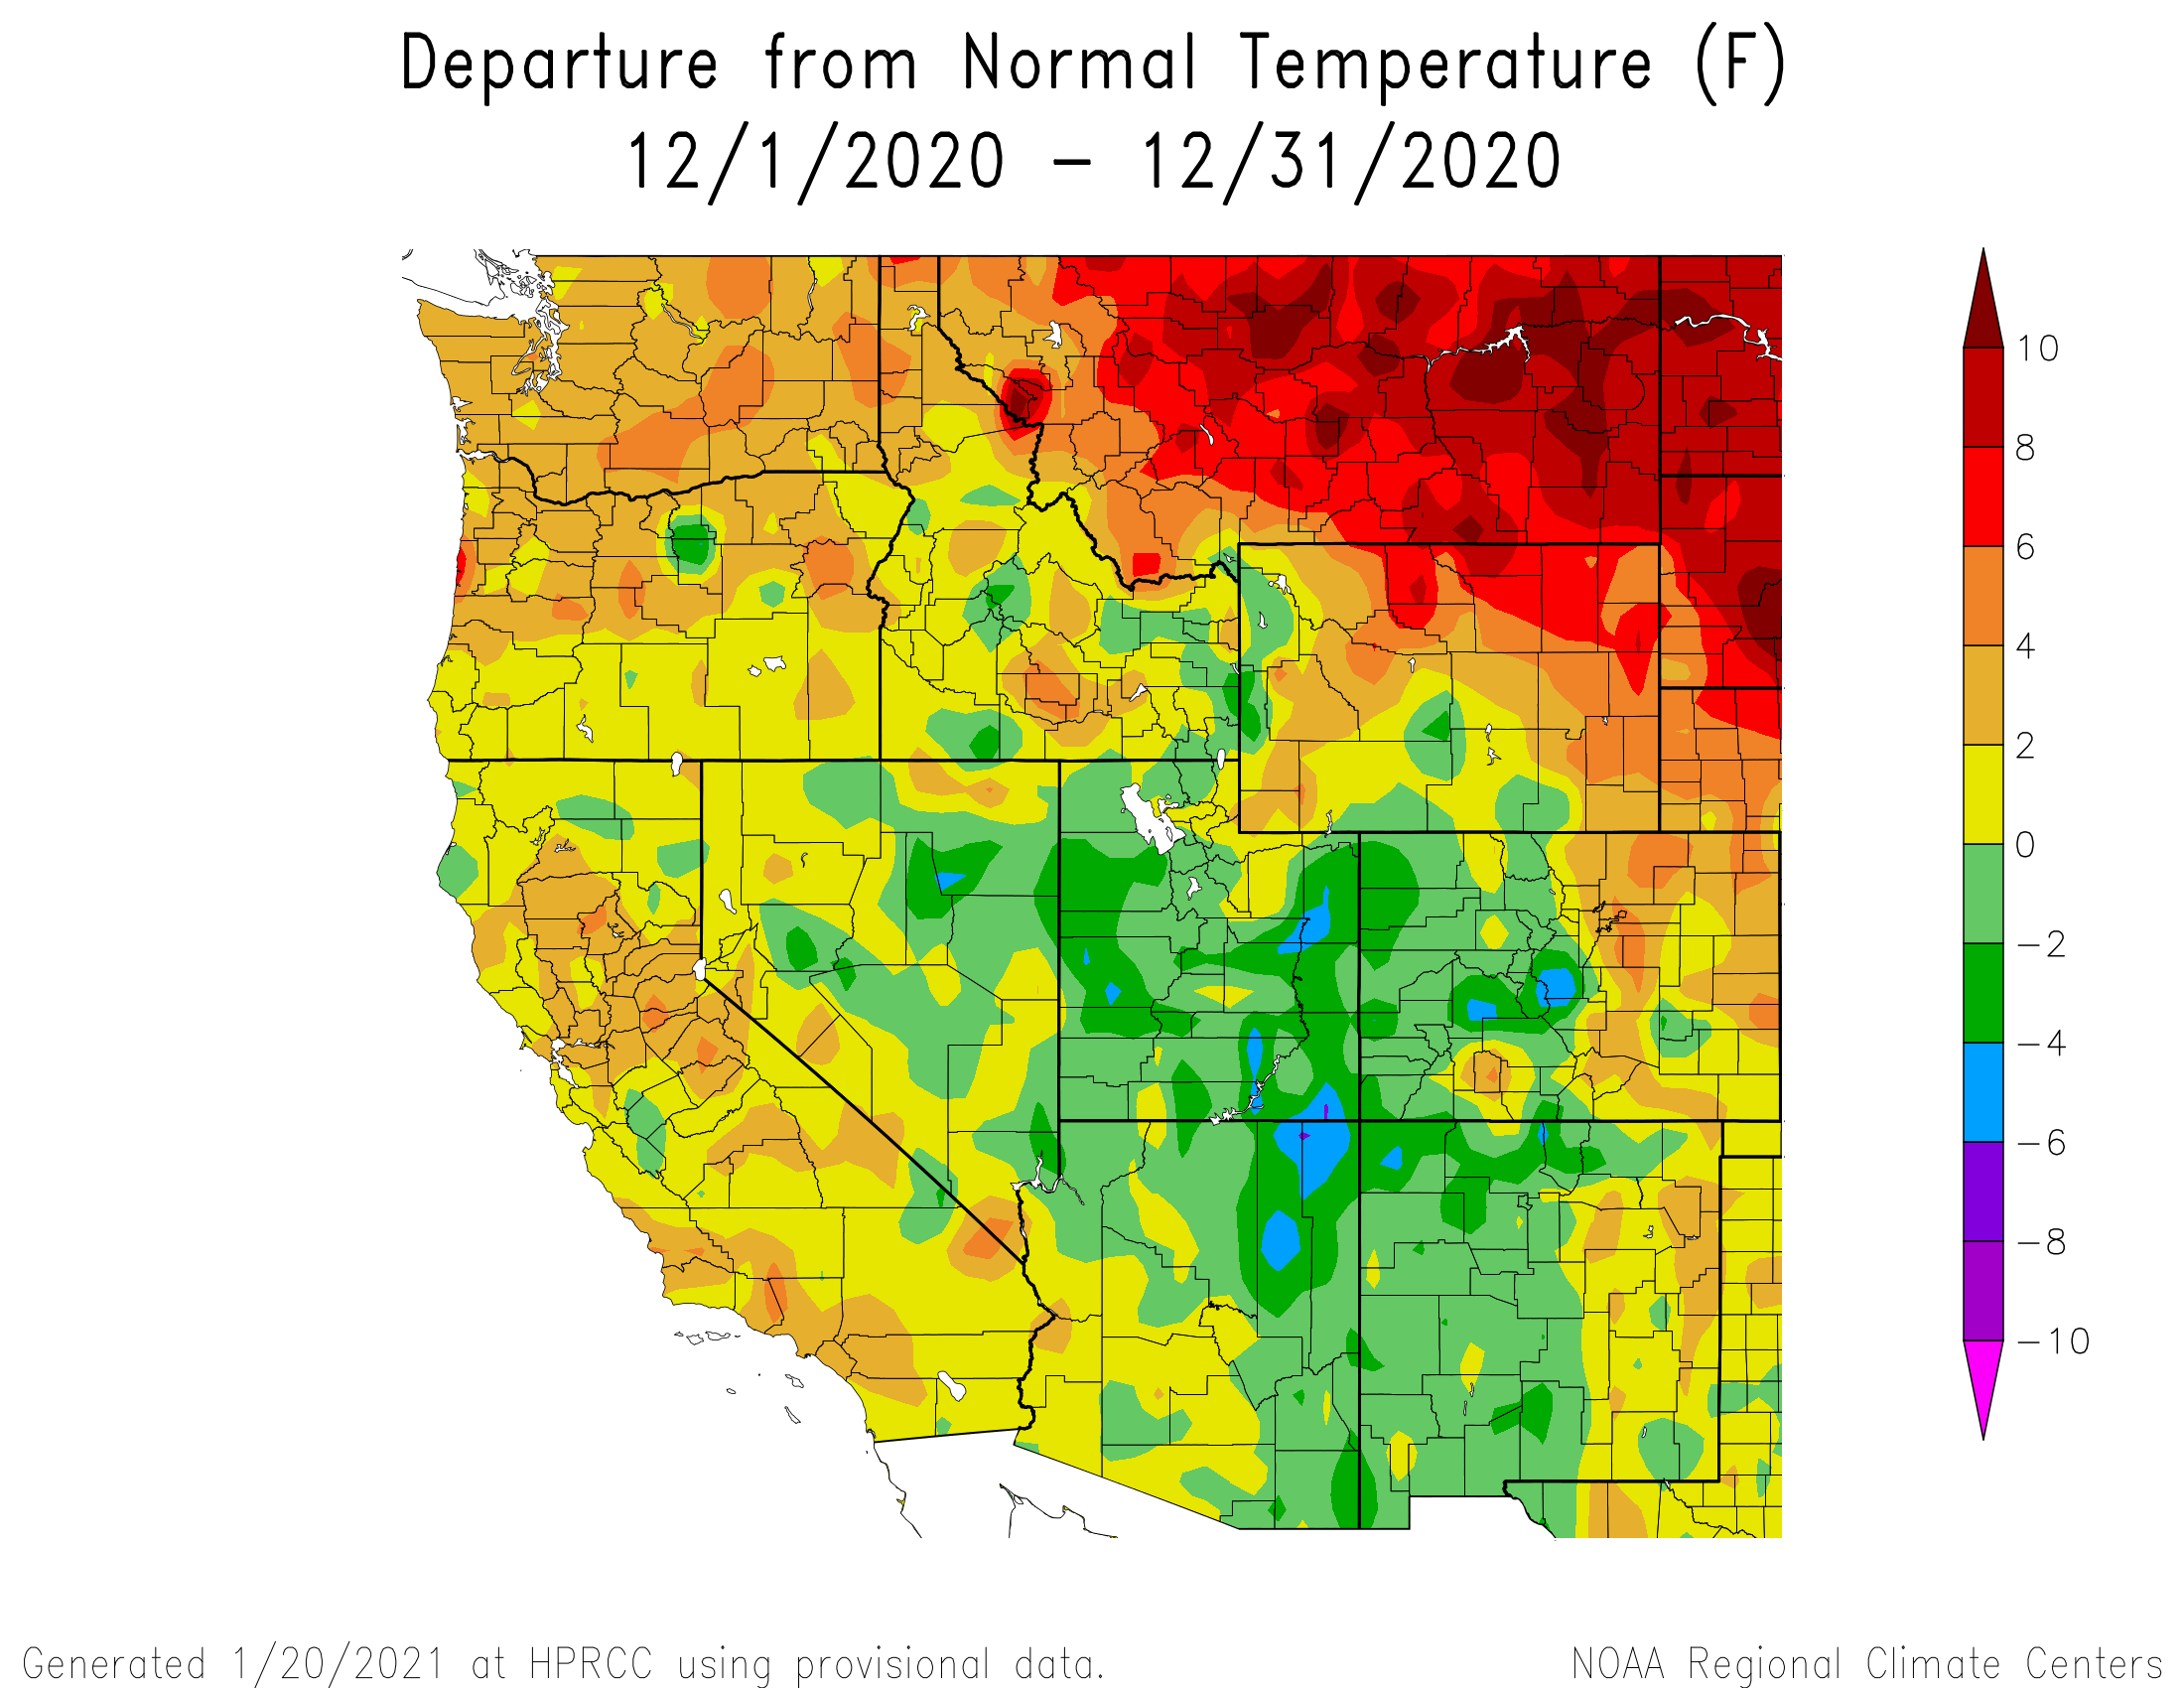
December: Another dry and warm stretch with only 3 days of measurable precipitation from Nov 25 – Dec 11. A fortunate period of active weather ensued but it only amounted to one official storm at Senator Beck Study Basin for the entire month of December. By the end of the month many SNOTEL stations in the Colorado River were below the 20th percentile for water year precipitation. In addition, the period from April-December was one of the driest on record.
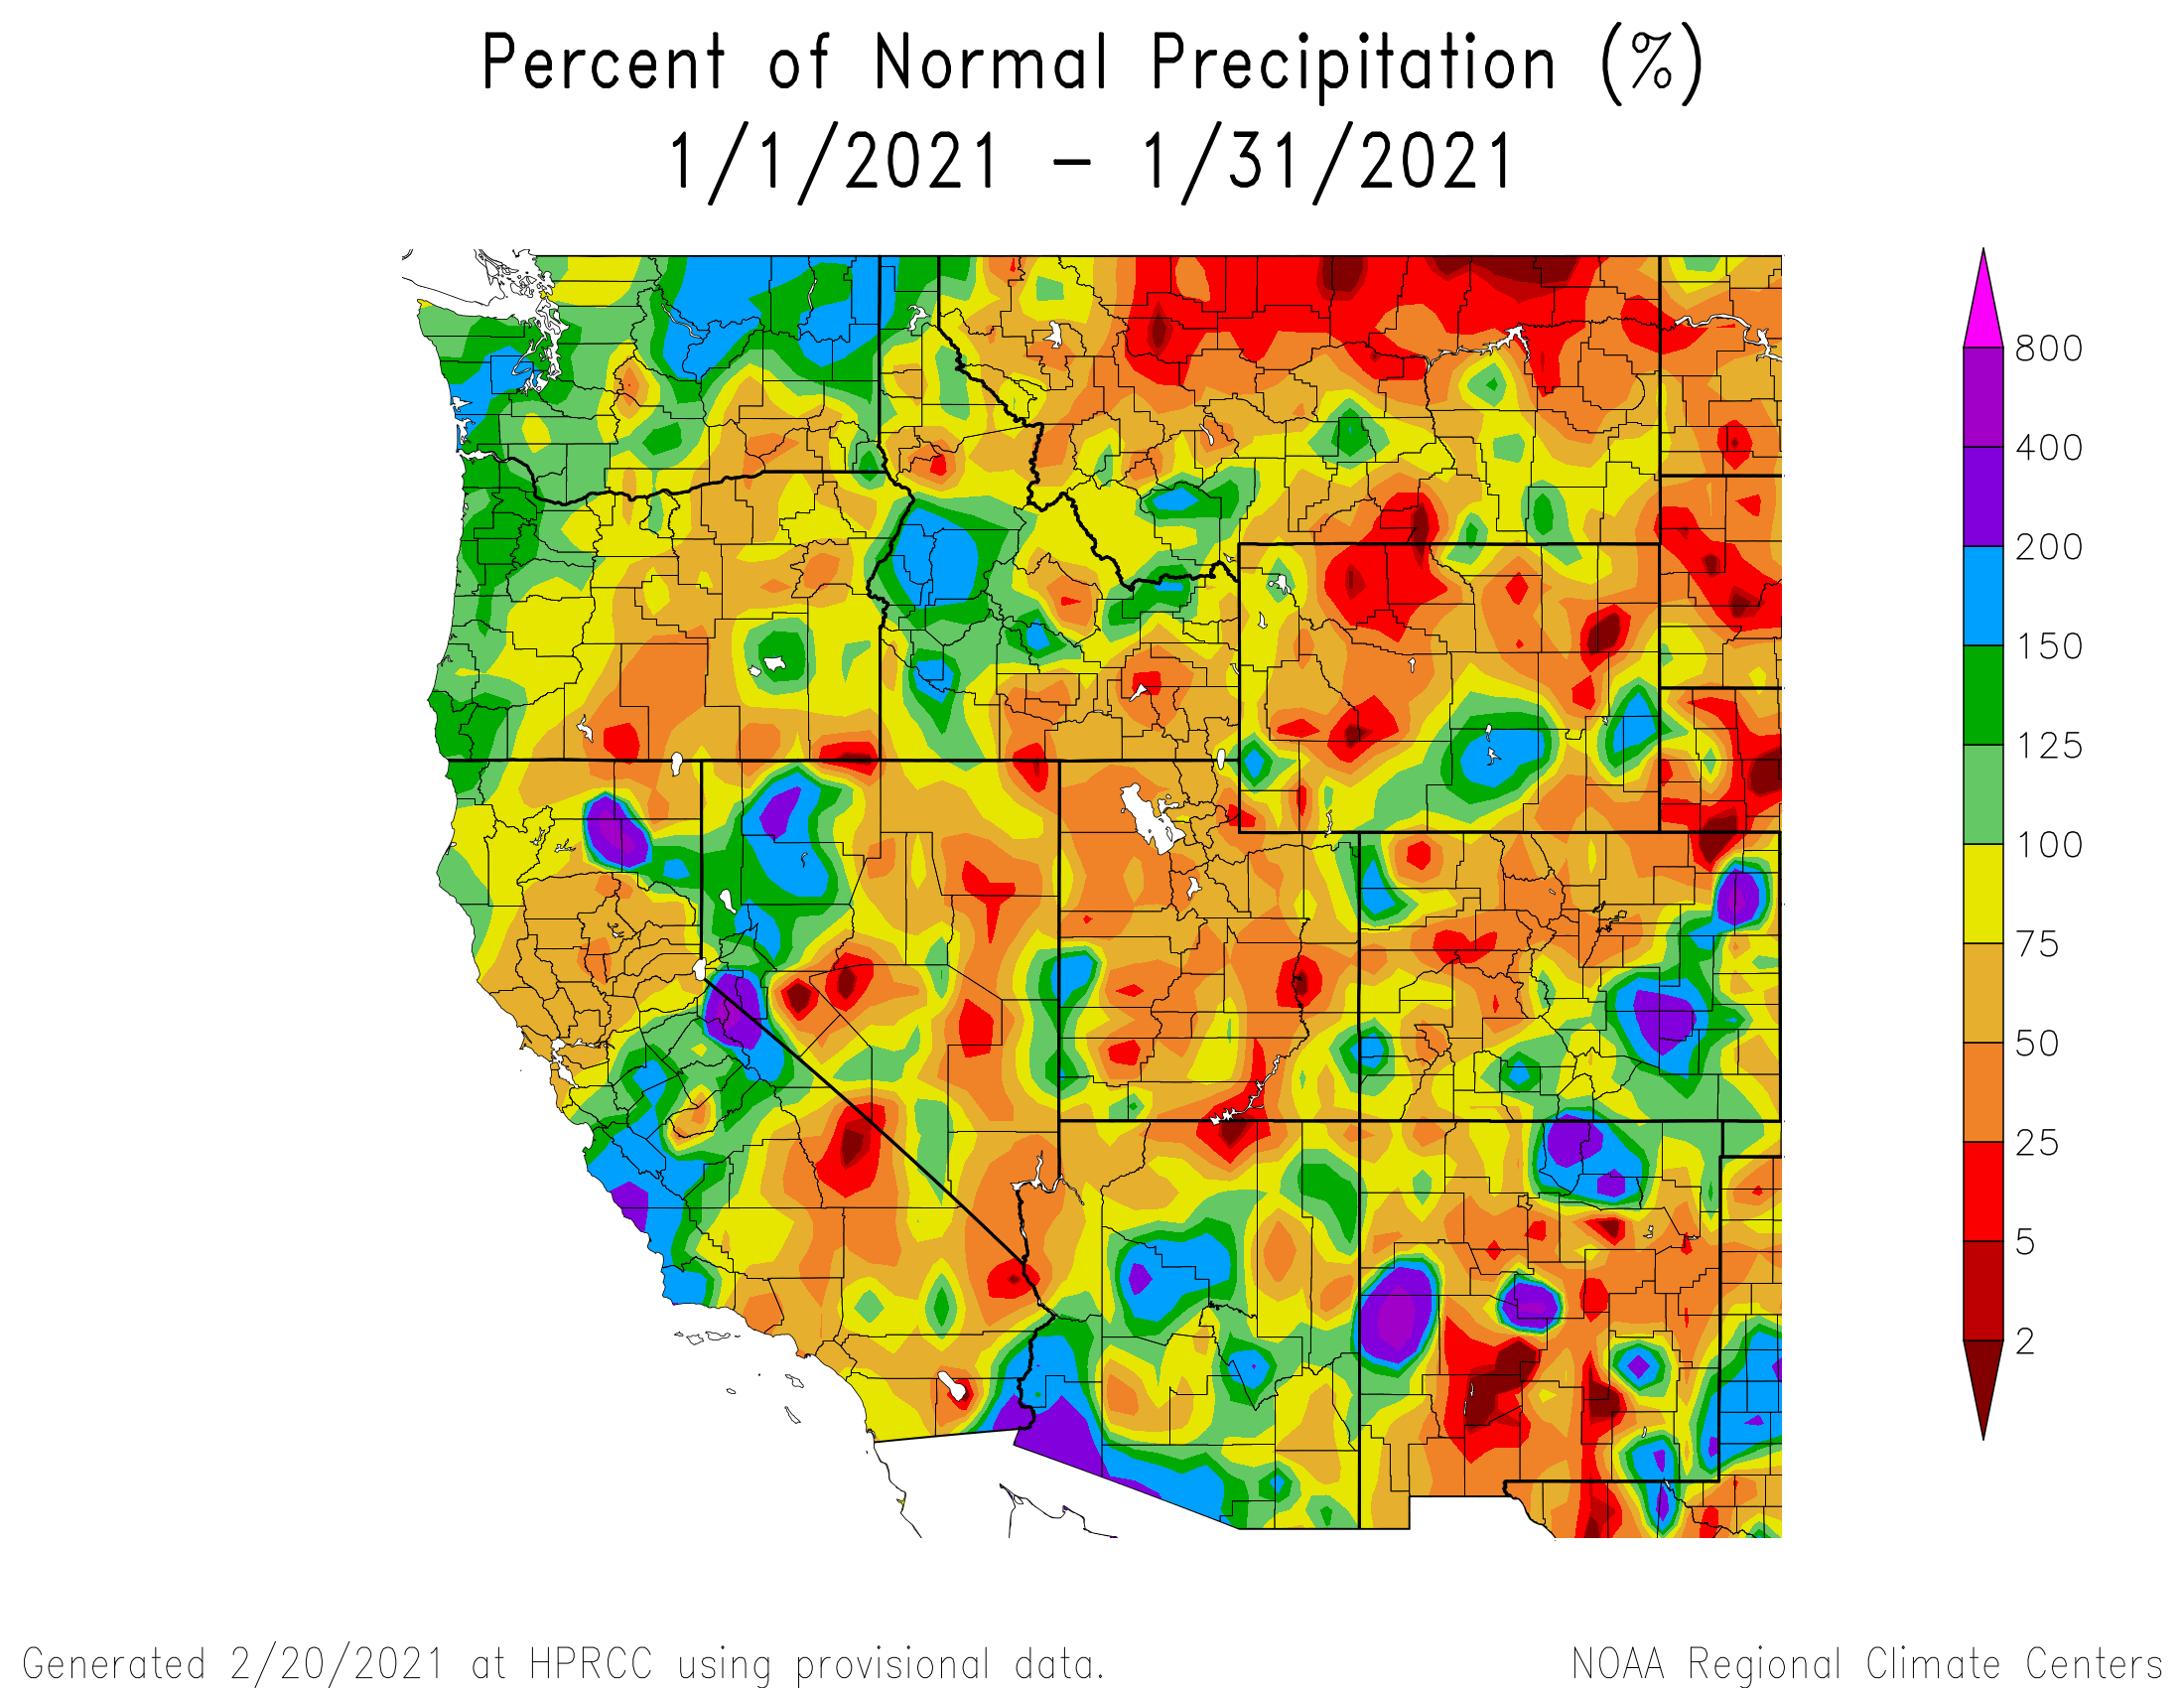
January: The month was active but variable. Early January SWE conditions started below to much below normal throughout Colorado and continued the trend for the month. January saw another long period of dry/warm conditions with the first 15 days of the month seeing only 2 days of precipitation at Swamp Angel. The latter half of January four storms hit our Senator Beck Study Basin (SBB) as the weather pattern transitioned to a deep trough with multiple cold storm systems impacting the area. The storms produced widespread precipitation over the entire region and especially favored southwest Colorado. January precipitation came in mostly below normal across the majority of Colorado.
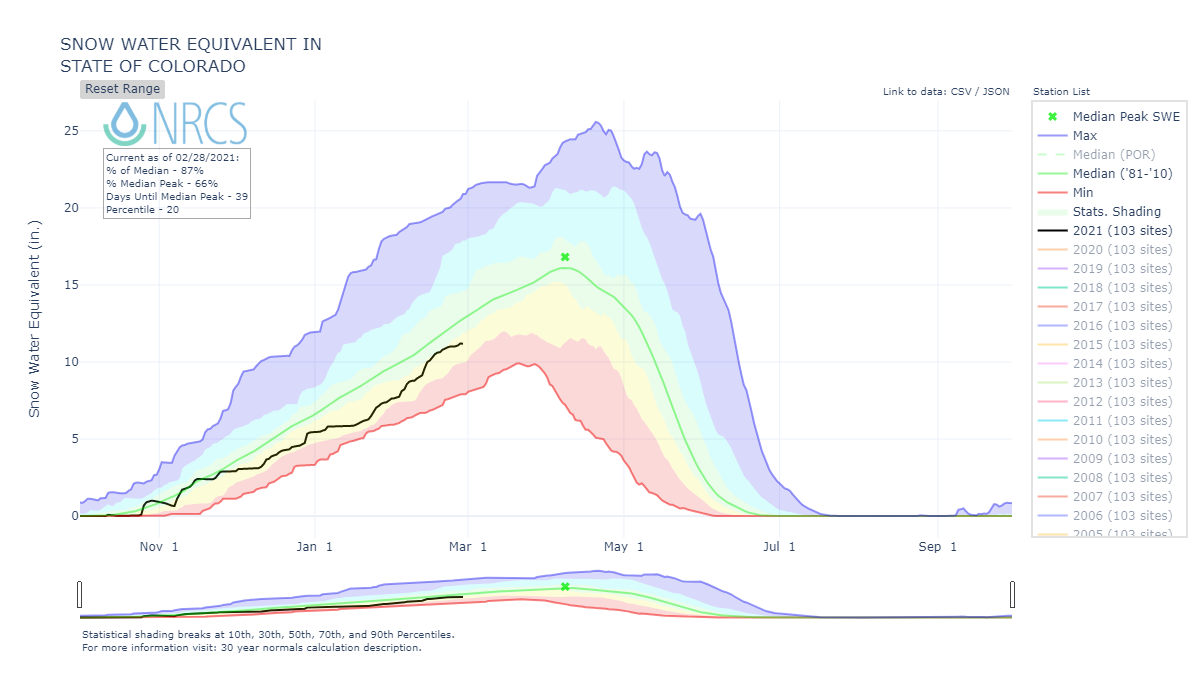
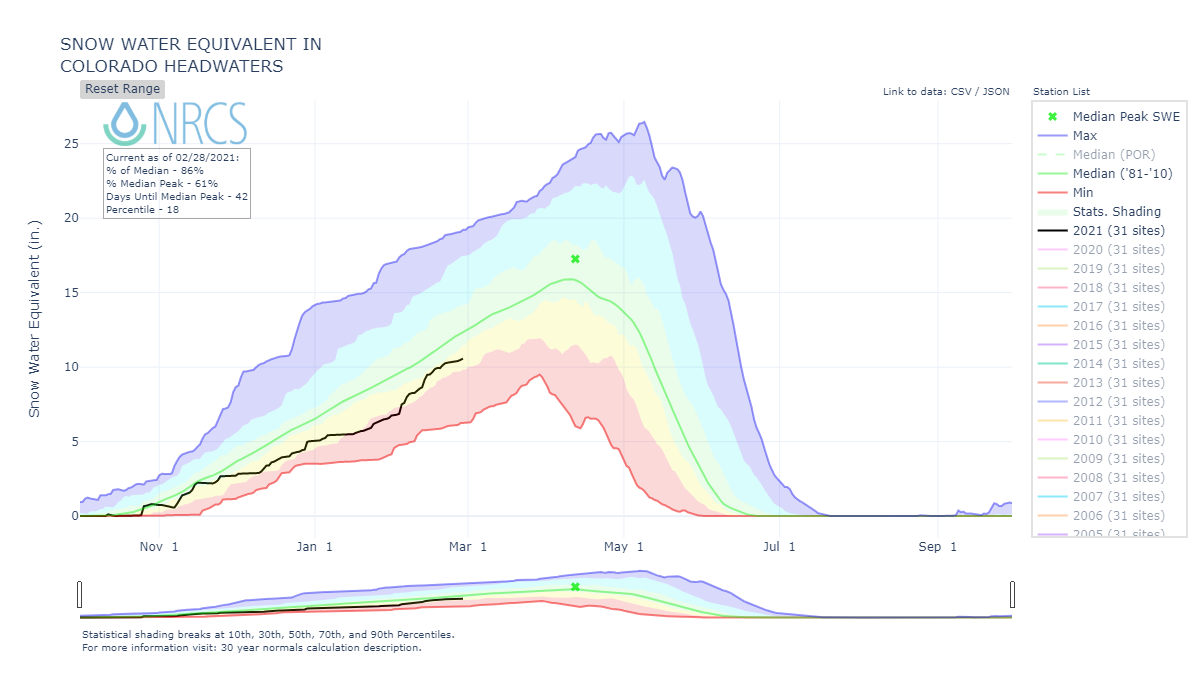
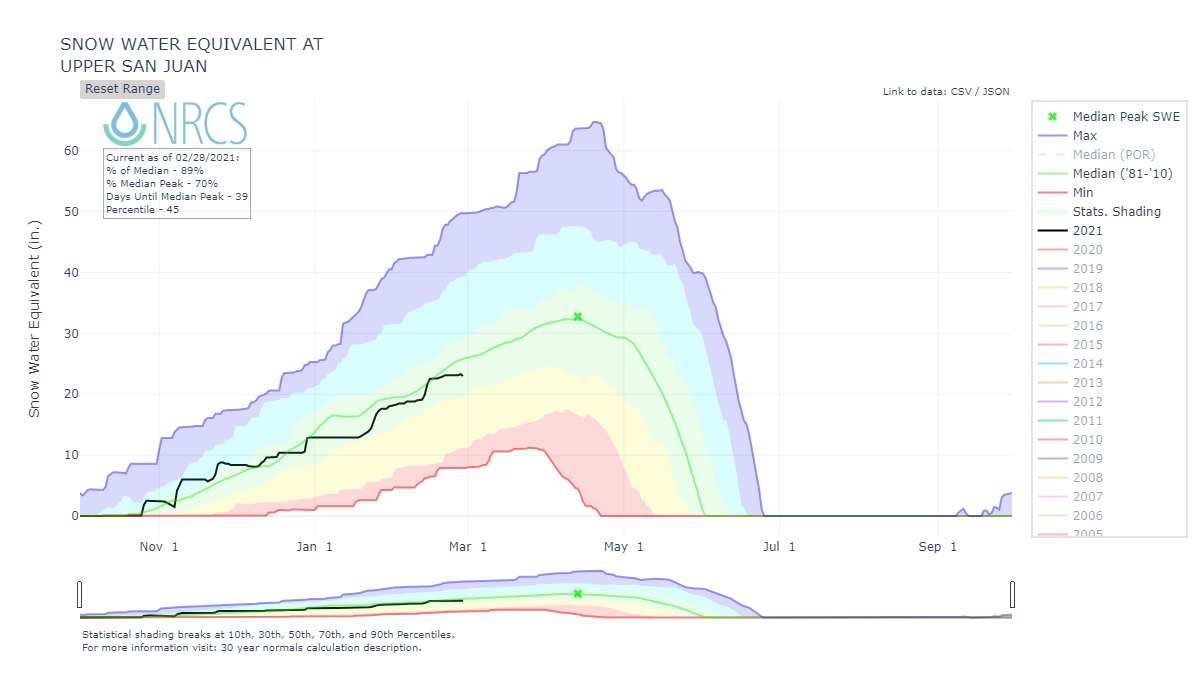
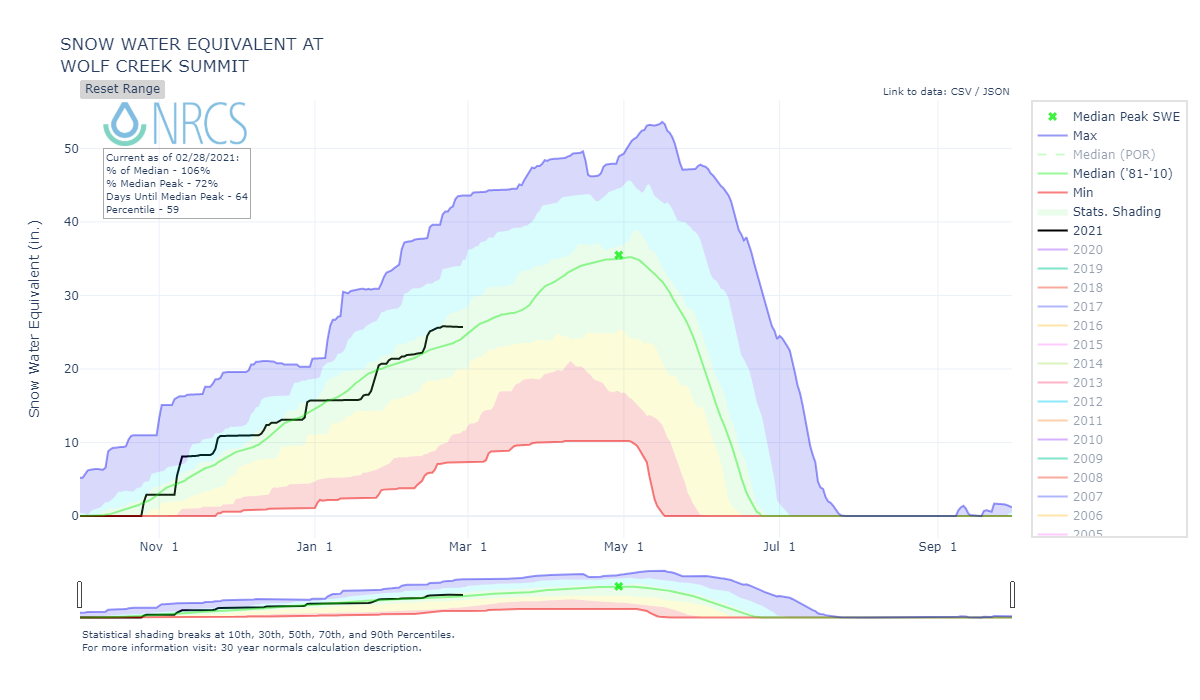
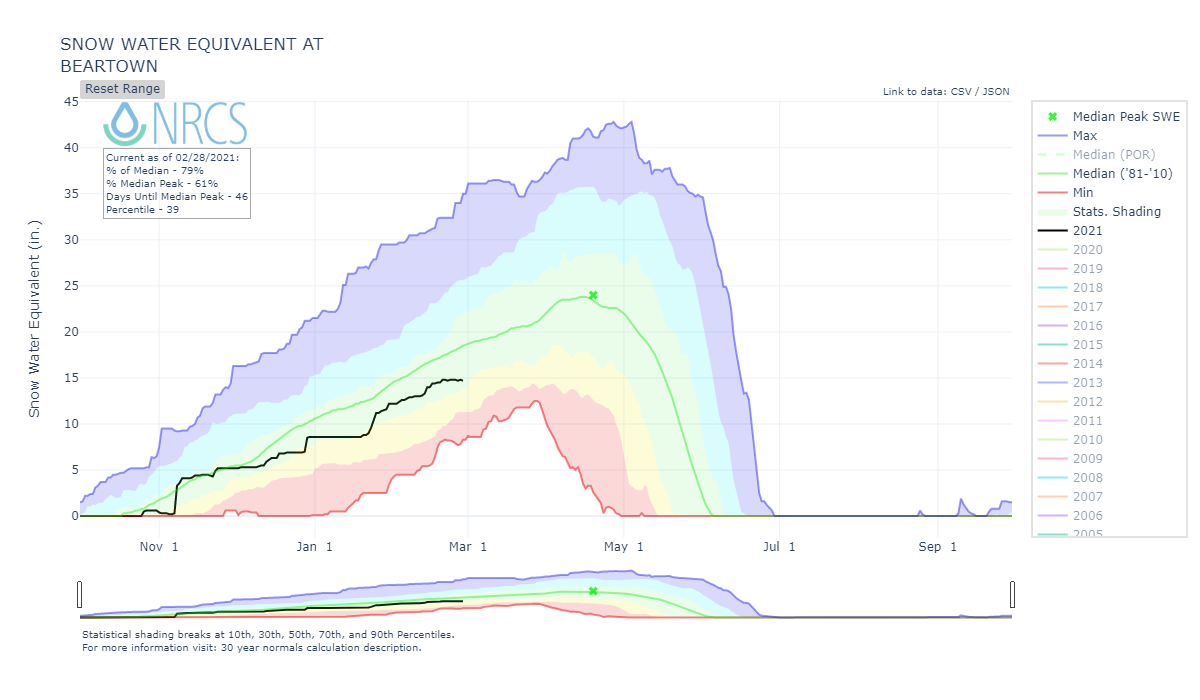
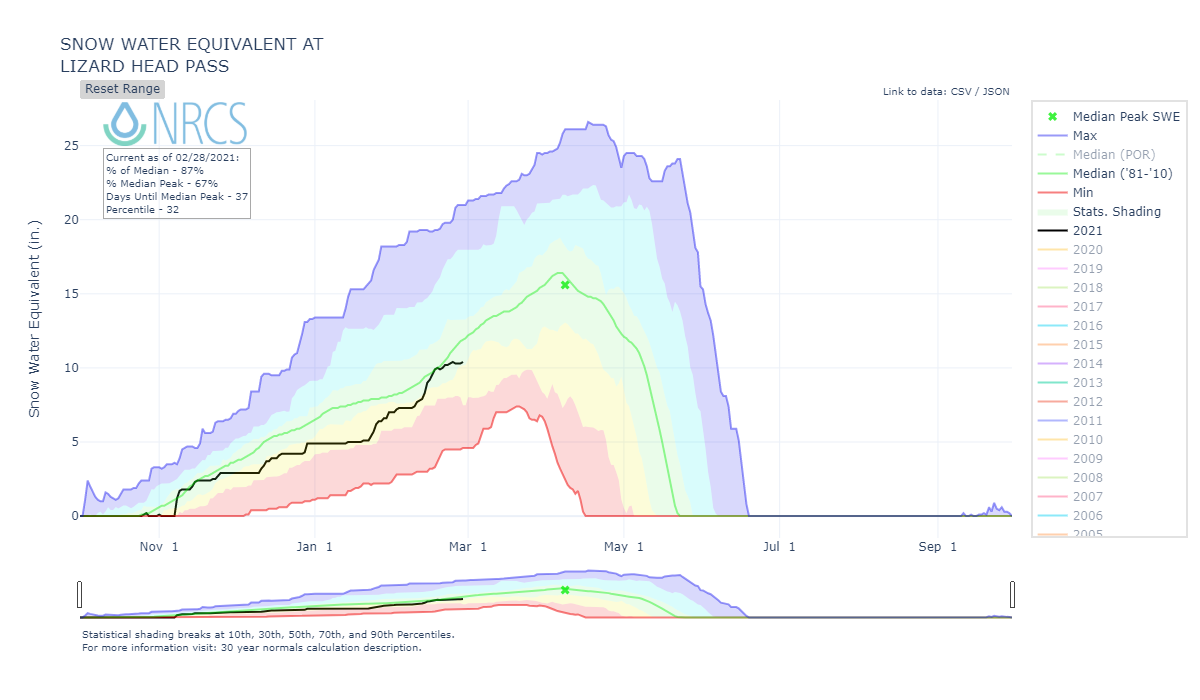
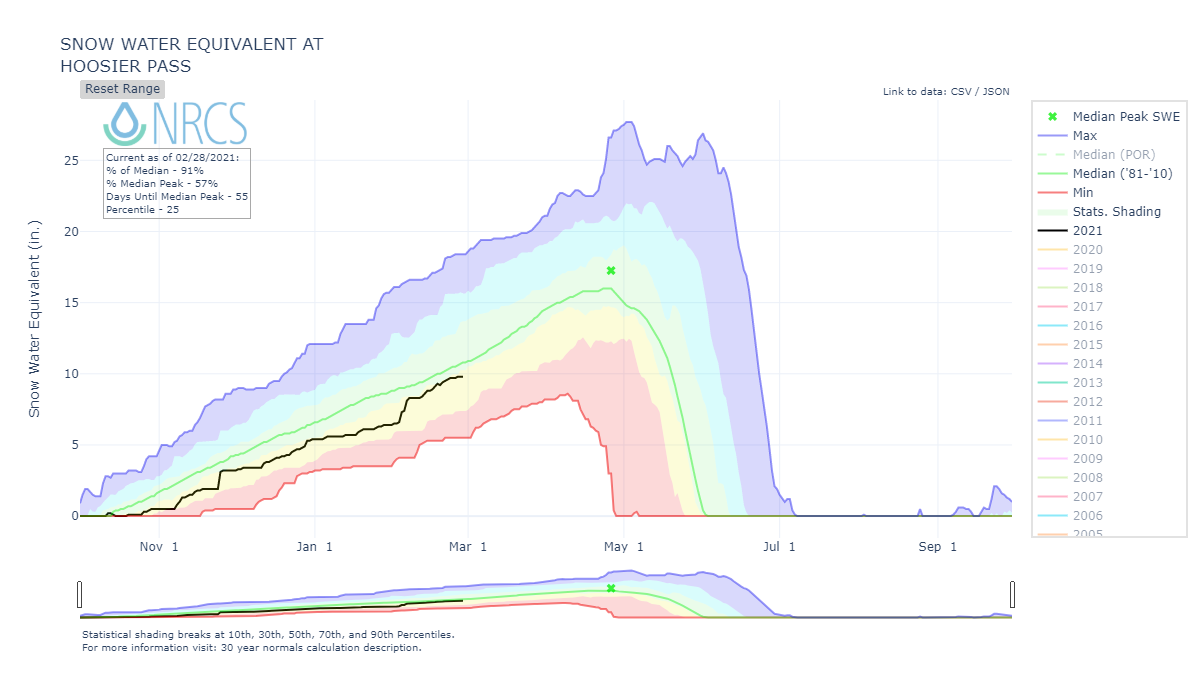
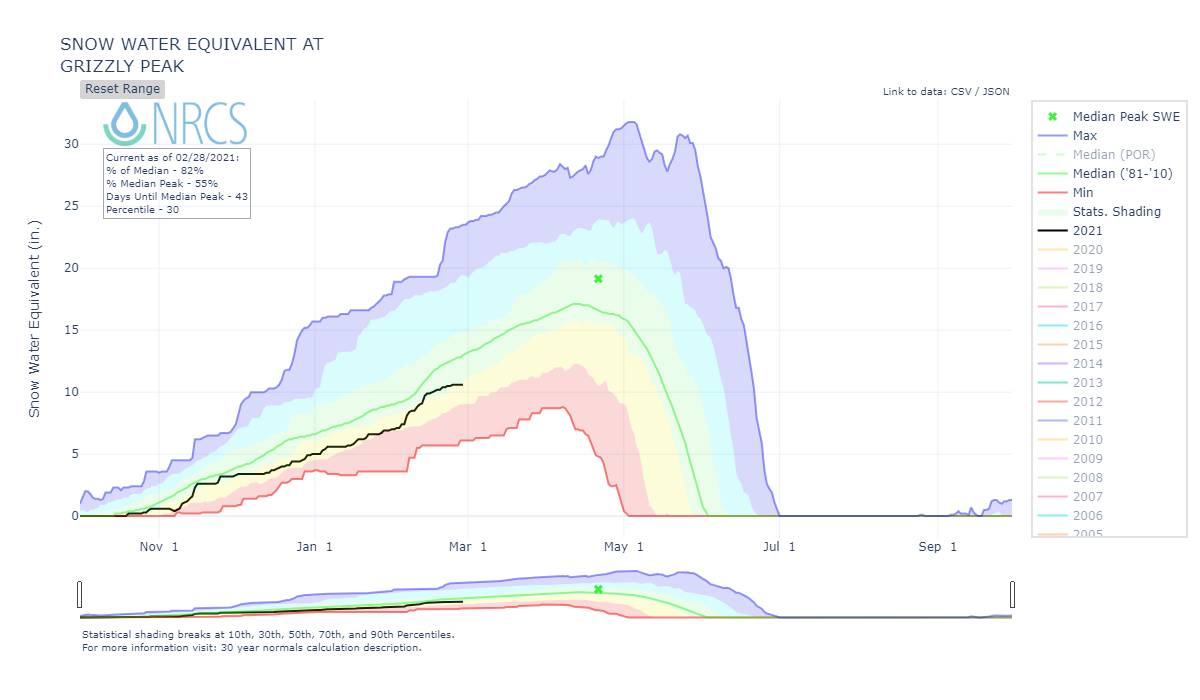
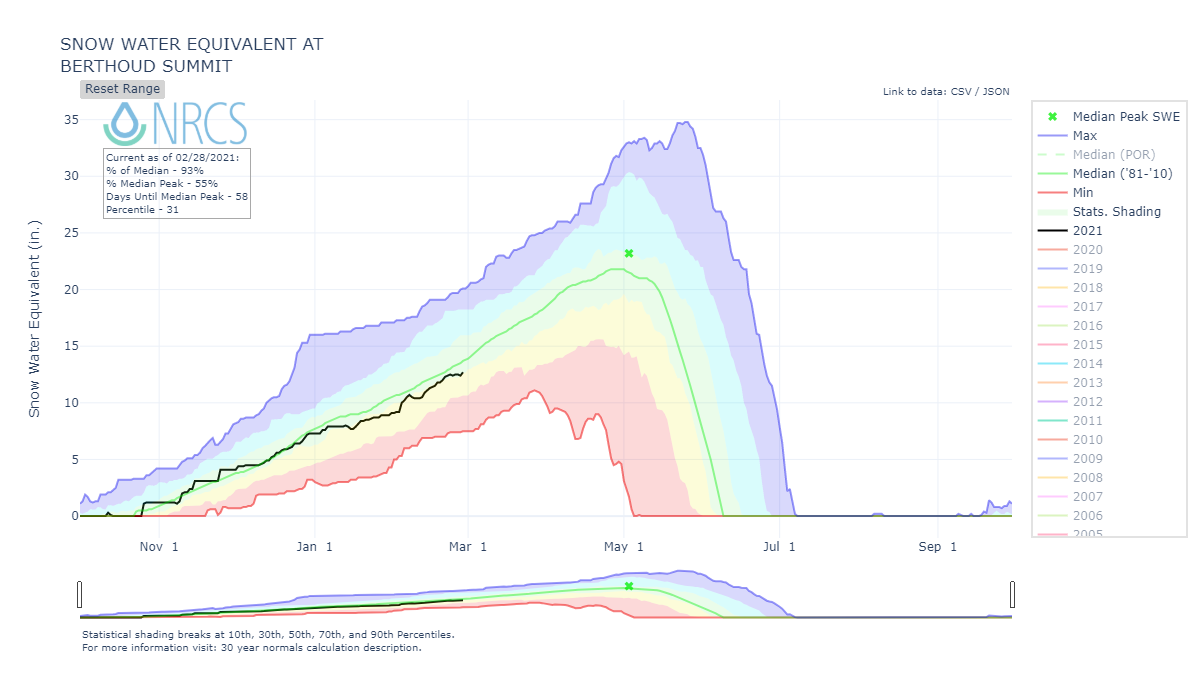
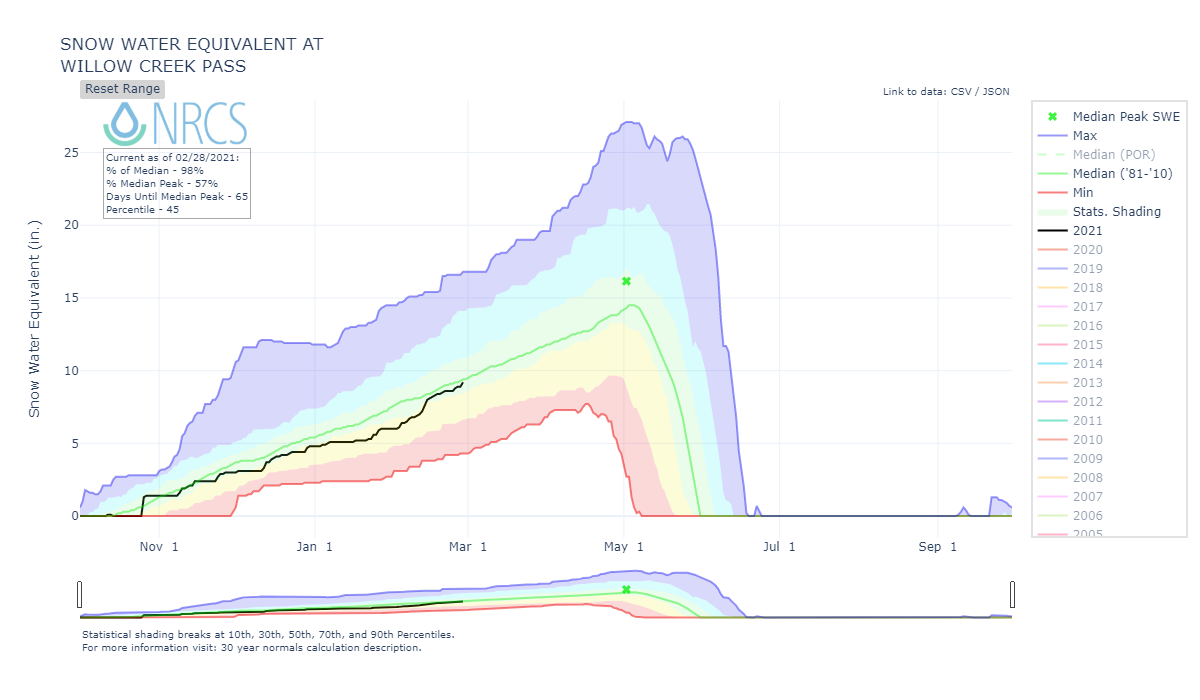
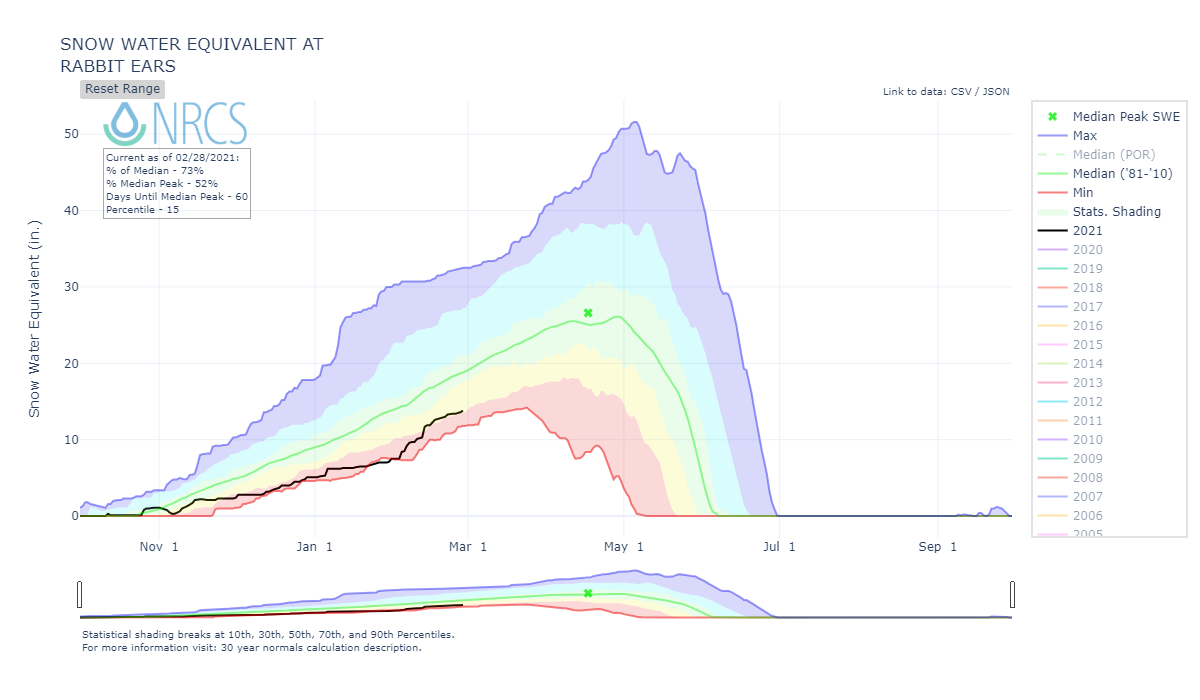
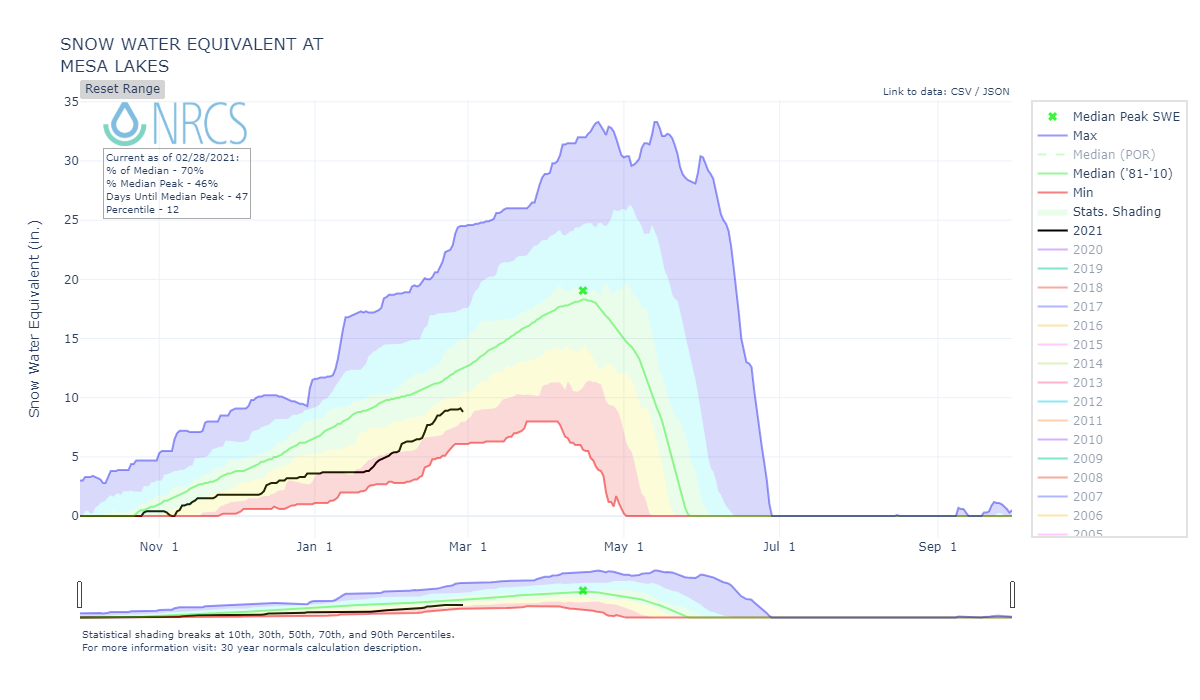
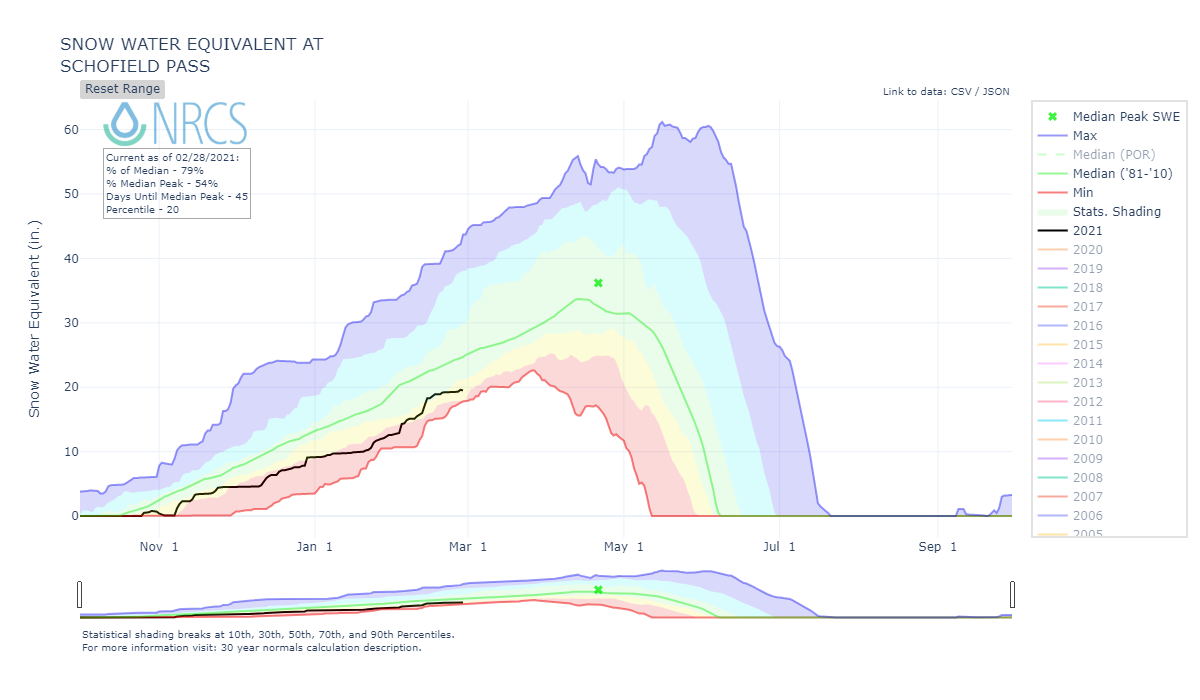
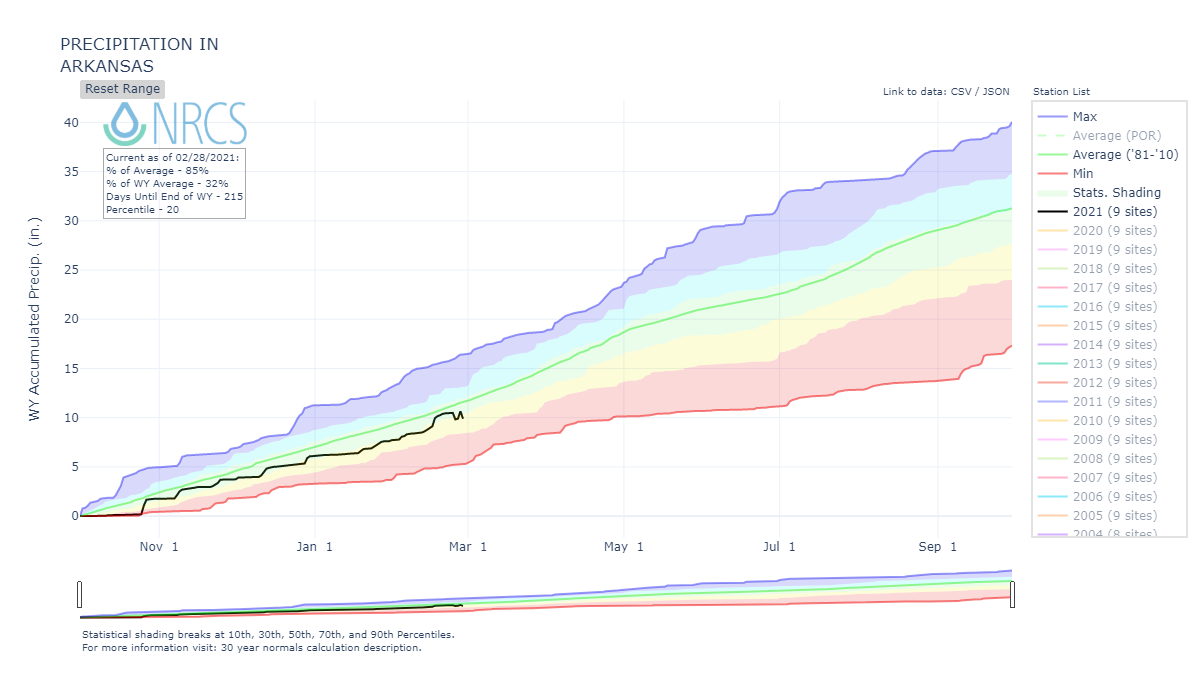
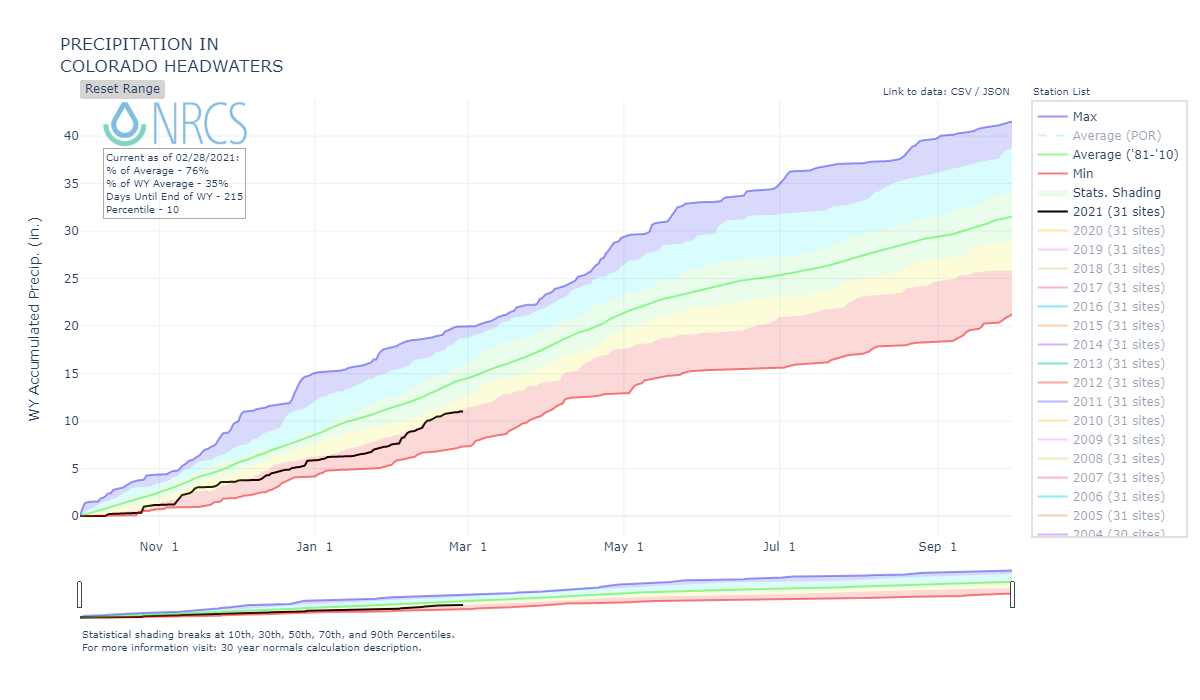
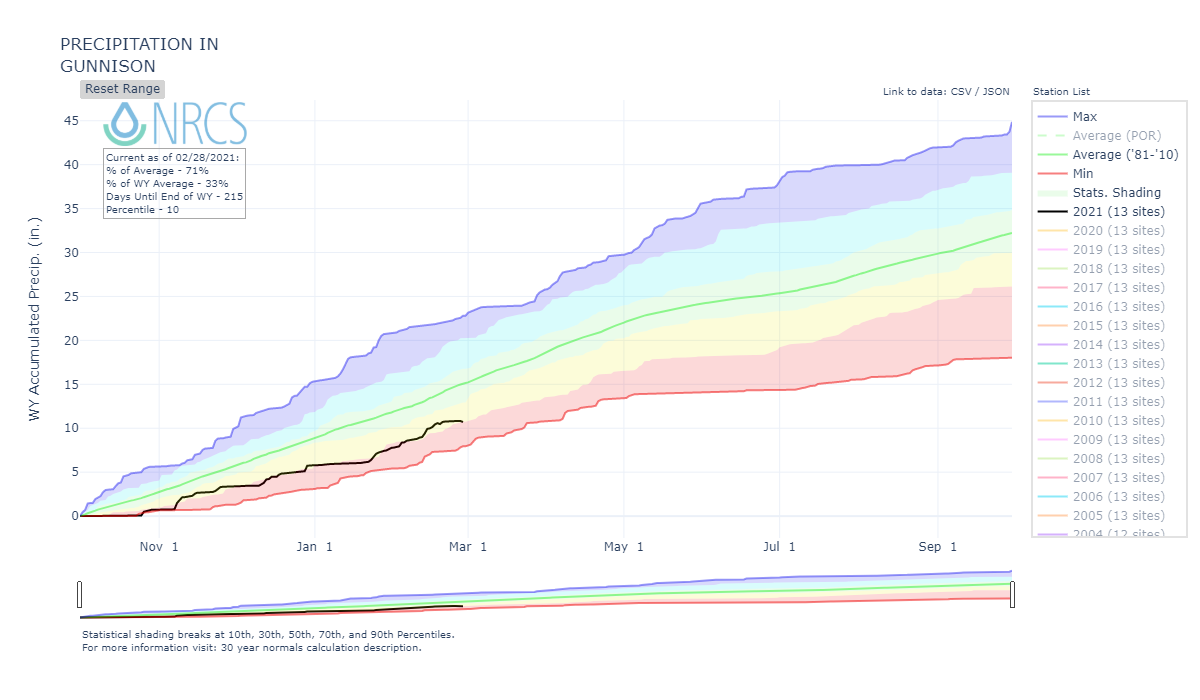
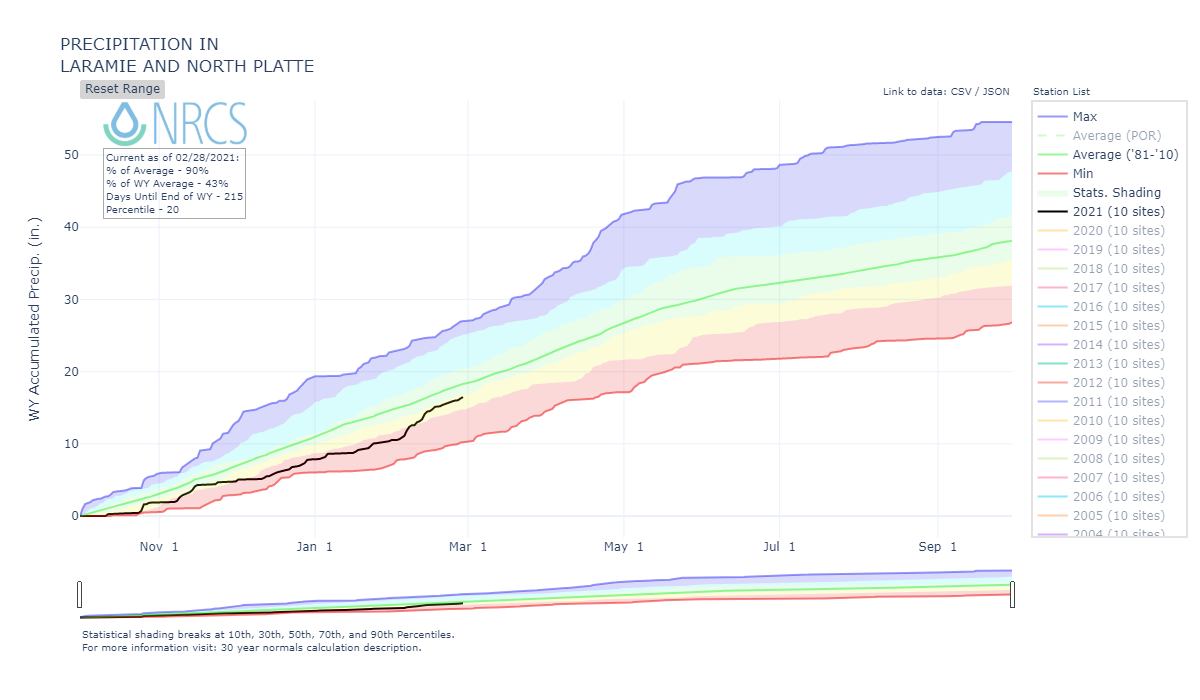
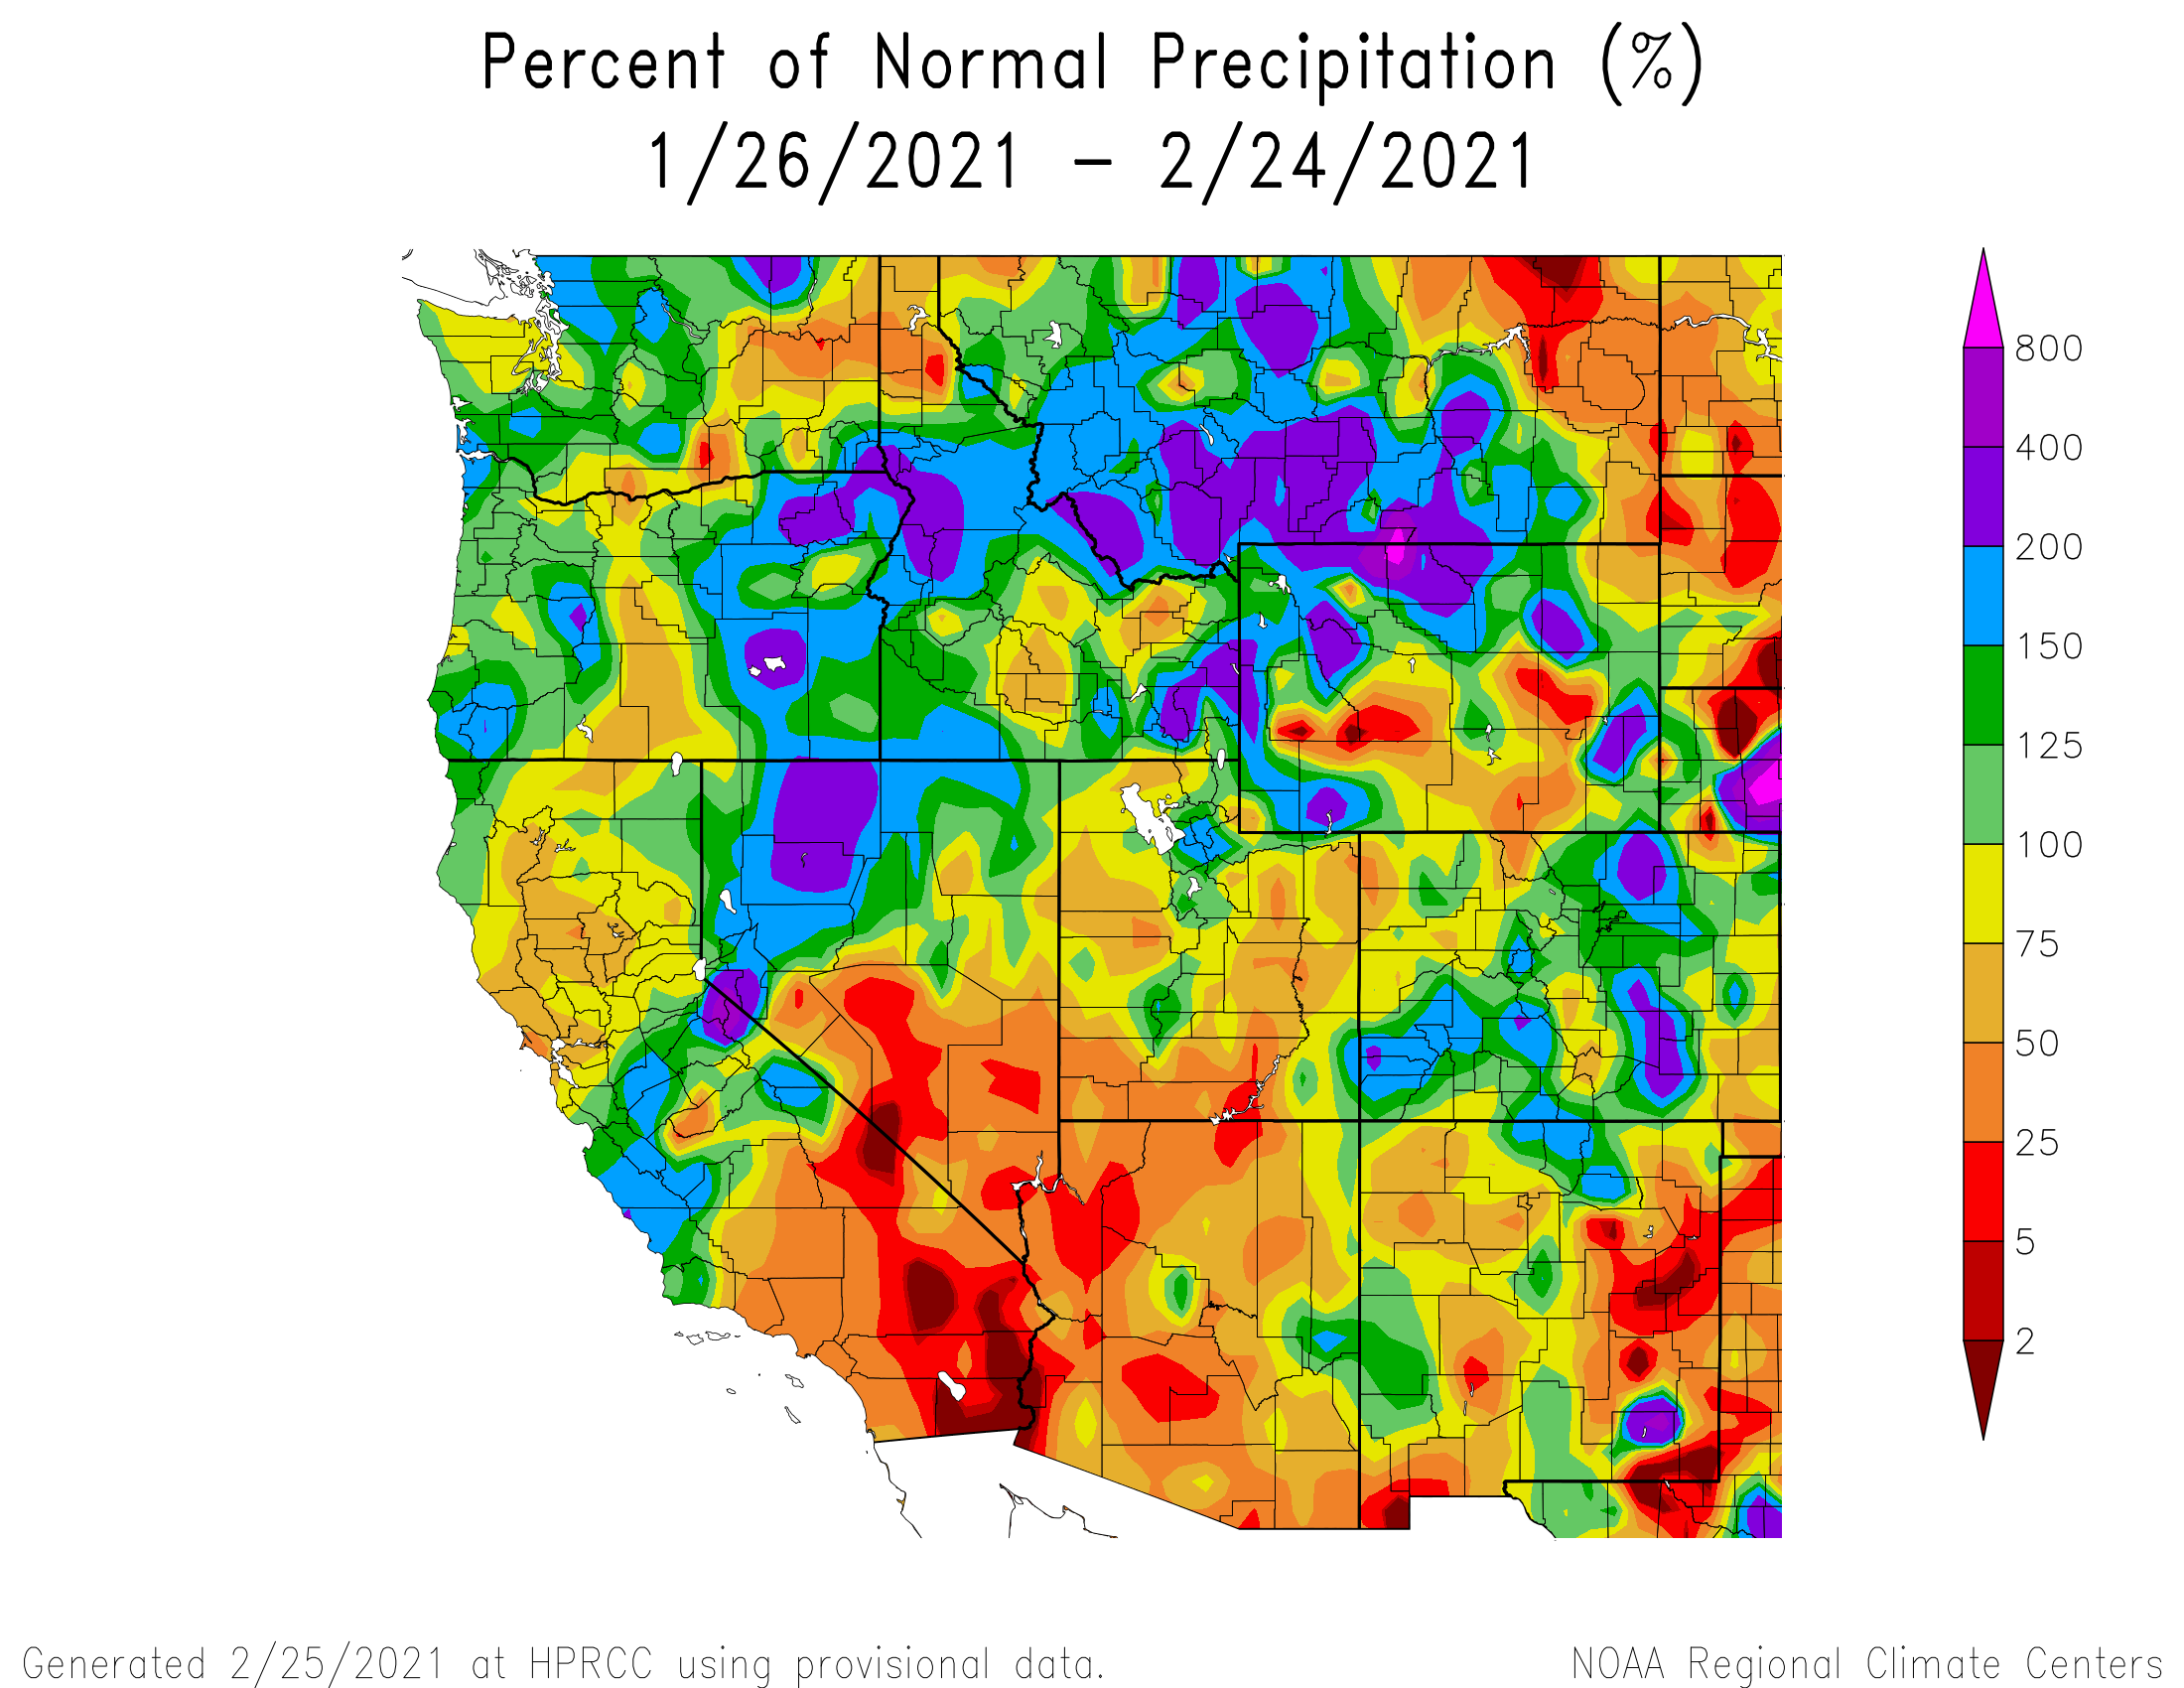
February: Going into February snowpack conditions generally ranged from 72-75% of the 1981-2010 historical median in the central and northern basins and 81-106% in the southern basins. Fortunately a productive week of active storm systems in mid-February benefitted all of Colorado Mountains. Over 6 days at Swamp Angel we observed 2” precipitation as 20” snow accumulation. Western Colorado in general saw 2”–4” of precipitation. Currently, Colorado basins sit at 80-100 % of normal snowpack. Please see graphs below.
A review of winter storms to date can be viewed on the storm reports page on our snowstudies.org website.
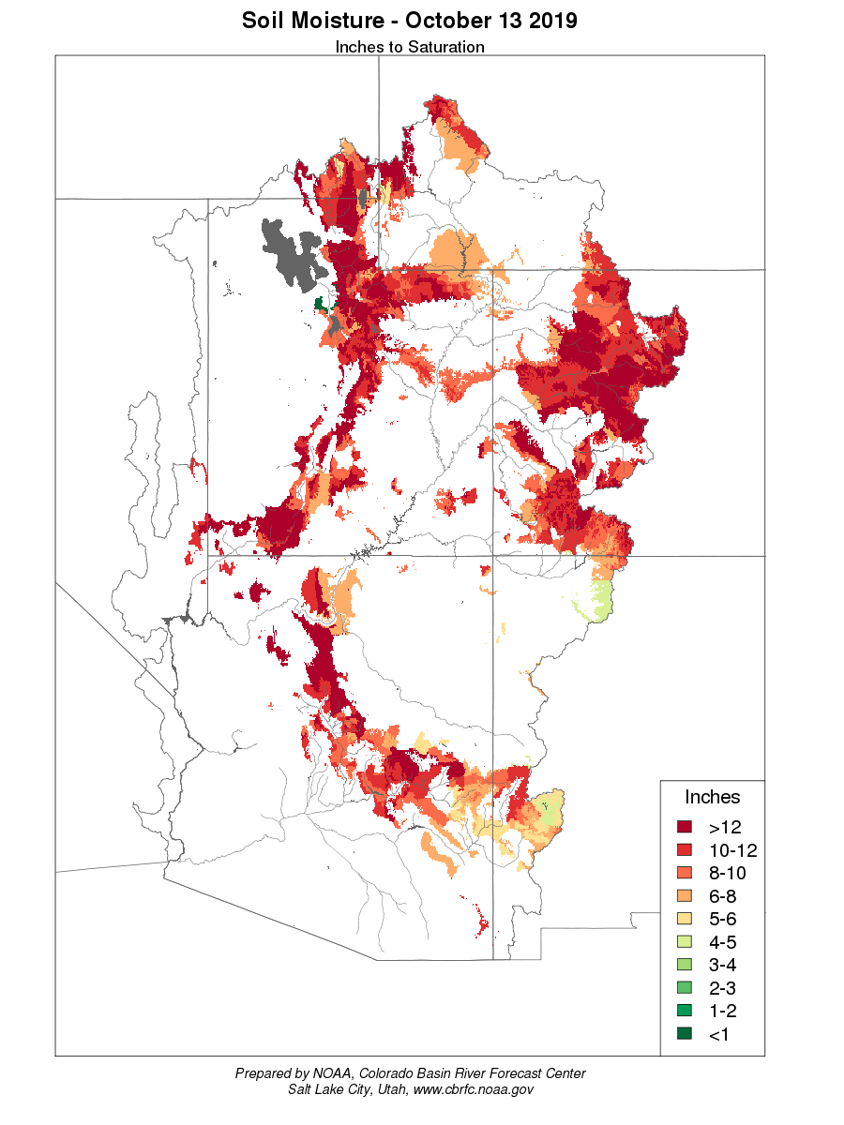
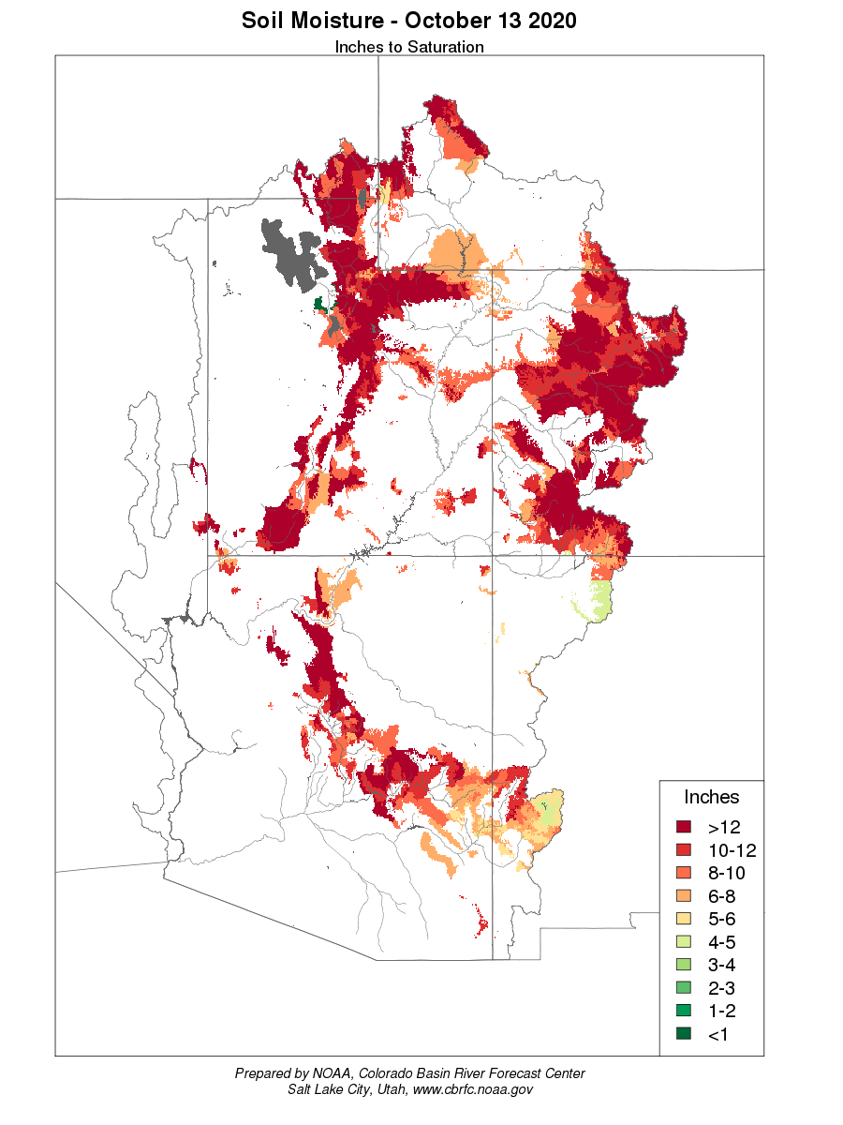
Below is a soil moisture map for the CRB, The maps look similar but close inspection shows this year worse off than last. Modeled soil moisture is in the bottom five across the Upper Colorado over the 1981-2020 40-year period. Given the dry conditions, an above normal snowpack or a wet spring will be needed to see near average water supply volumes.
Current DUST-ON-SNOW Conditions AND DERC CLASSIFICATION
Over the course of our 2005-2020 period of rigorous observations, March 1st has marked the beginning of the heart of “dust-on-snow season” for the Colorado Mountains (see the CODOS Dust Log chart of dust events by month). So far for WY2021 at SBB, the primary ‘sentry site’ for the CODOS program, we observed an early season dust-on-snow event with dust falling on a 3”-6” snowpack. This dust being deposited very near ground will not influence snowmelt come spring melt. Statewide, we have not observed or received reports of dust events, putting us under “Minimum” dust conditions so far this season.
Unless conditions change, the CODOS team will do our first statewide dust assessment of the season around mid-March. We try to time our trips to best document dust in/on snow conditions. If there is plenty of fresh snow accumulation and minimal dust we delay the tour, but if we feel dust layers are near the snowpack surface we hit the road to determine the potential short-term and later melt season impacts.
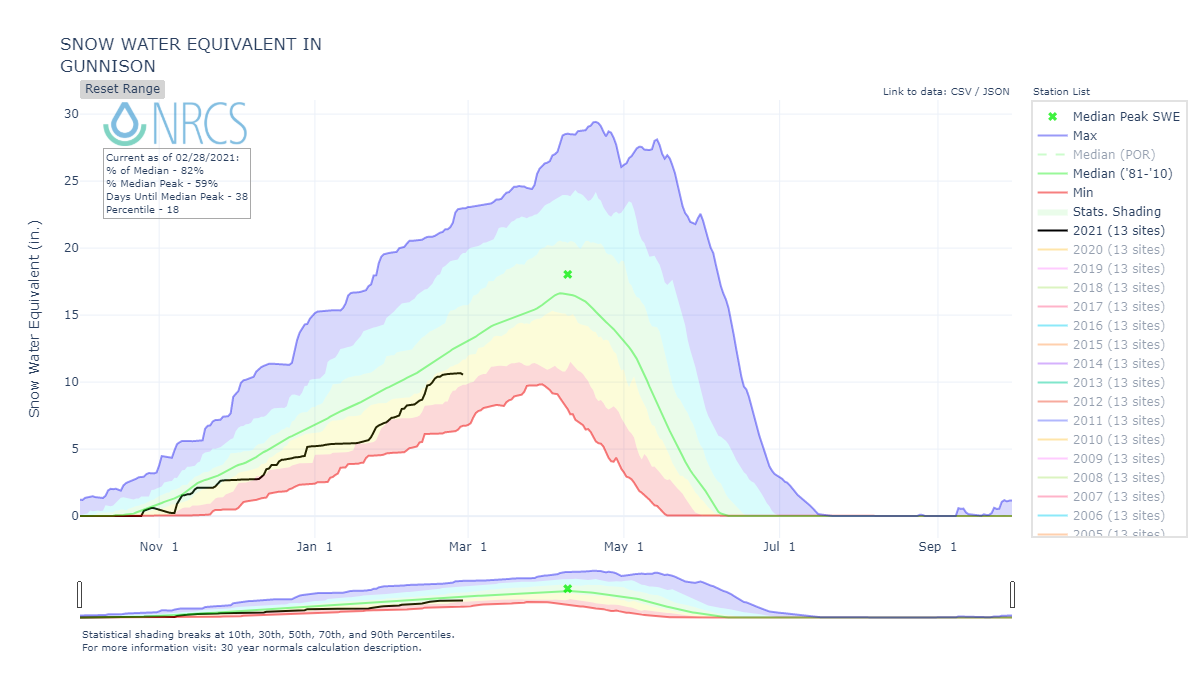
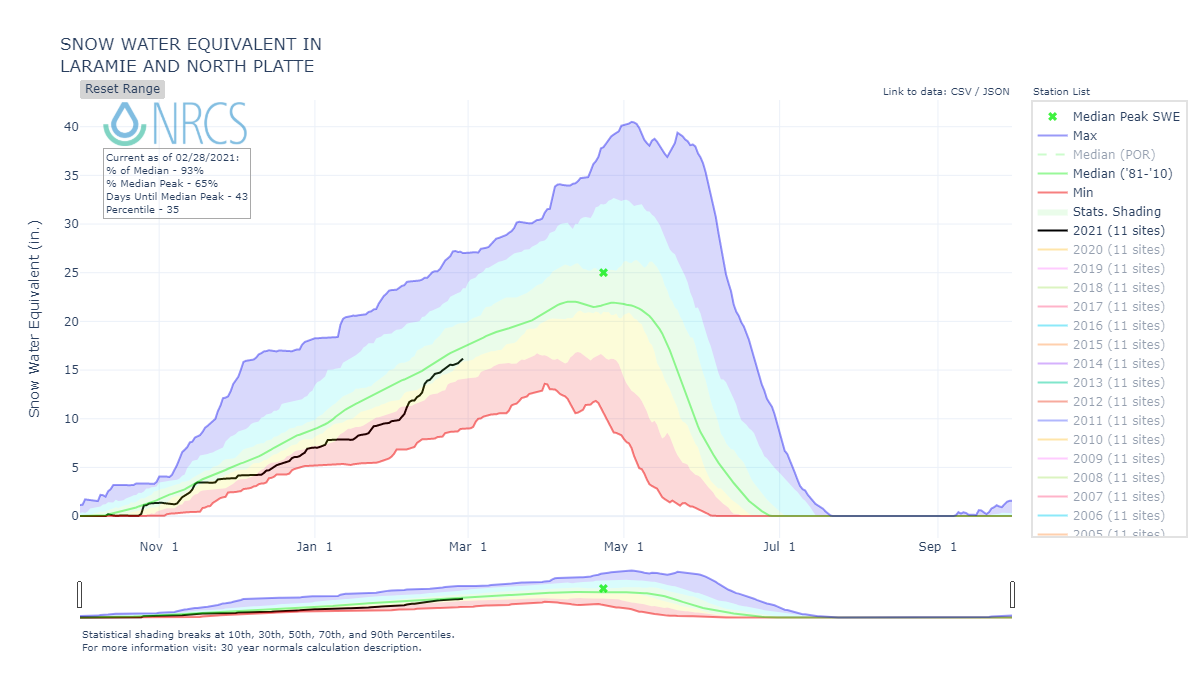
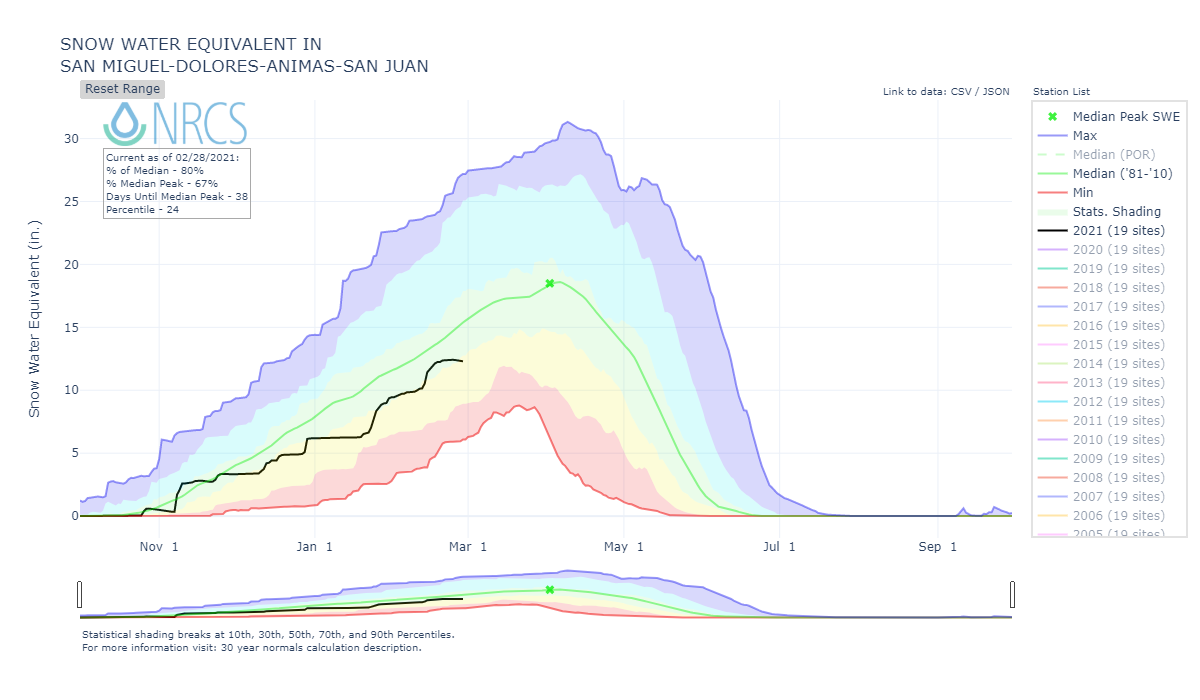
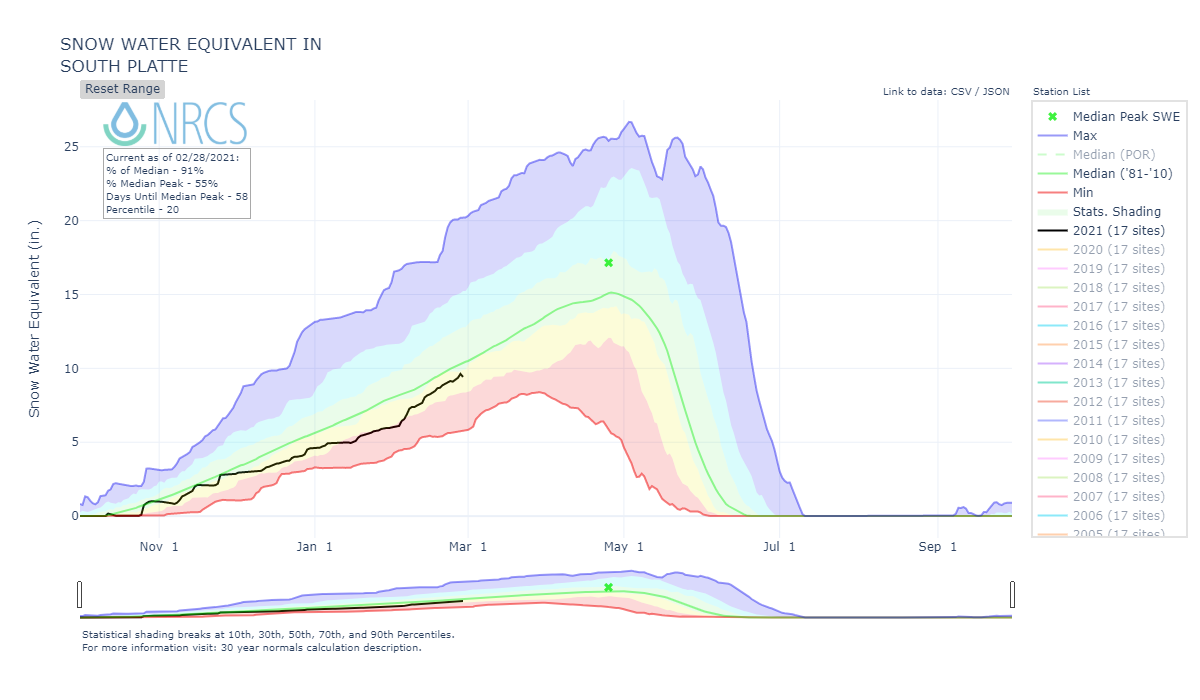
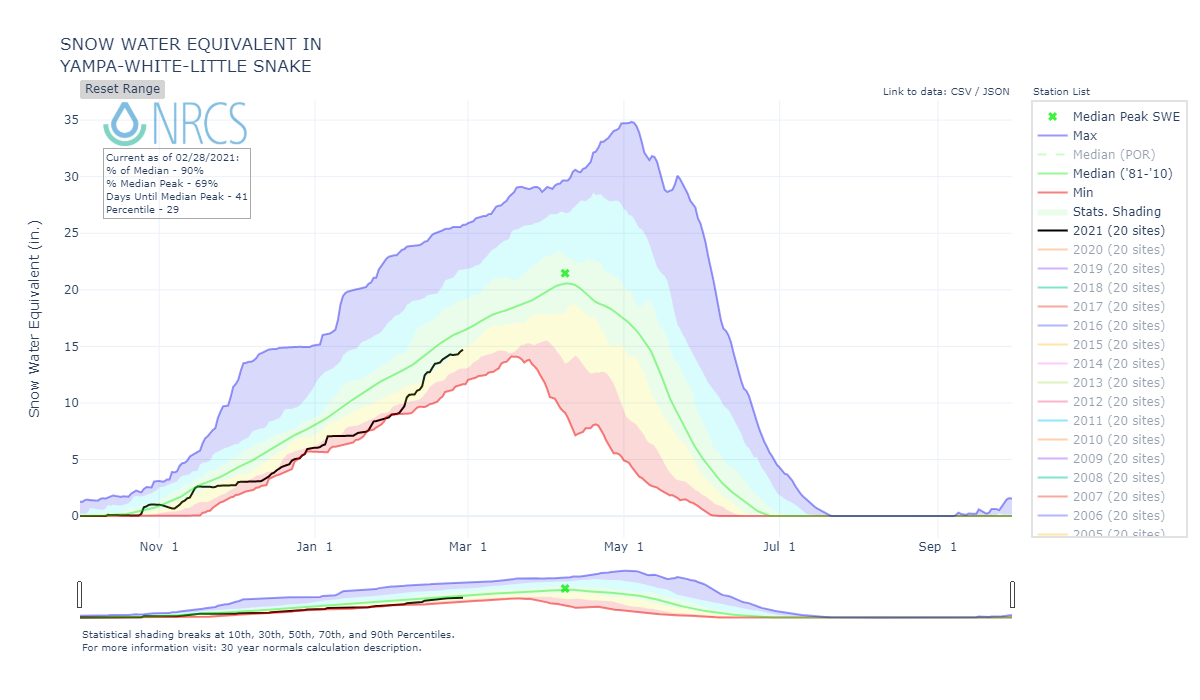
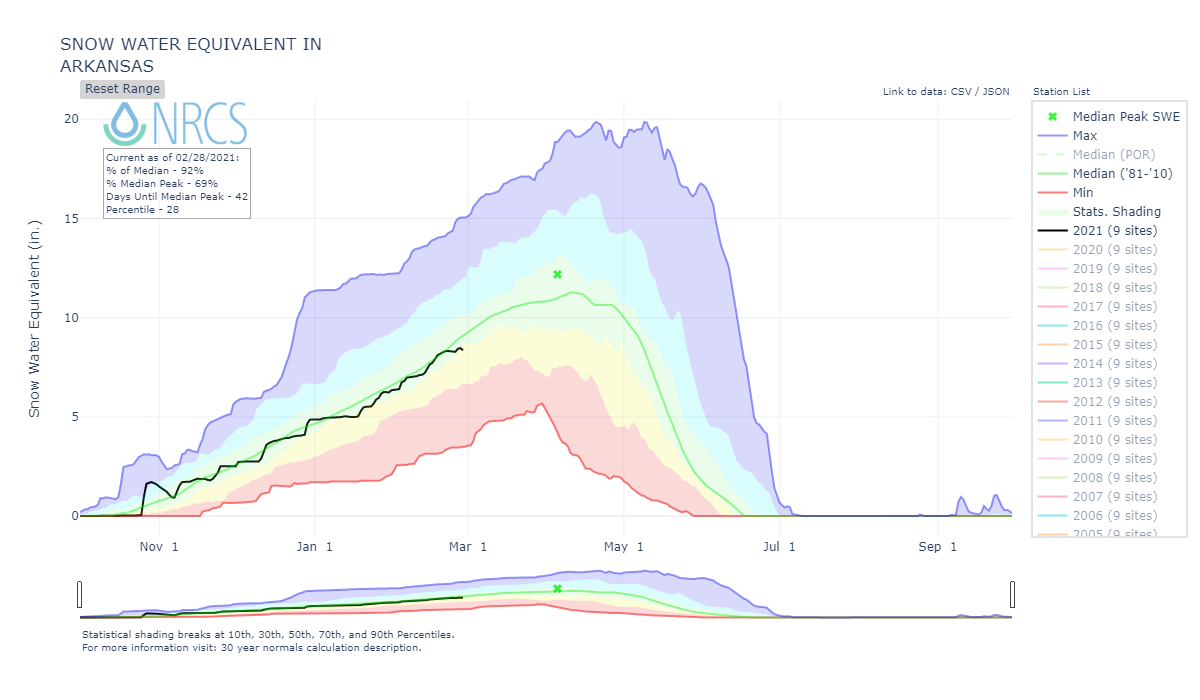
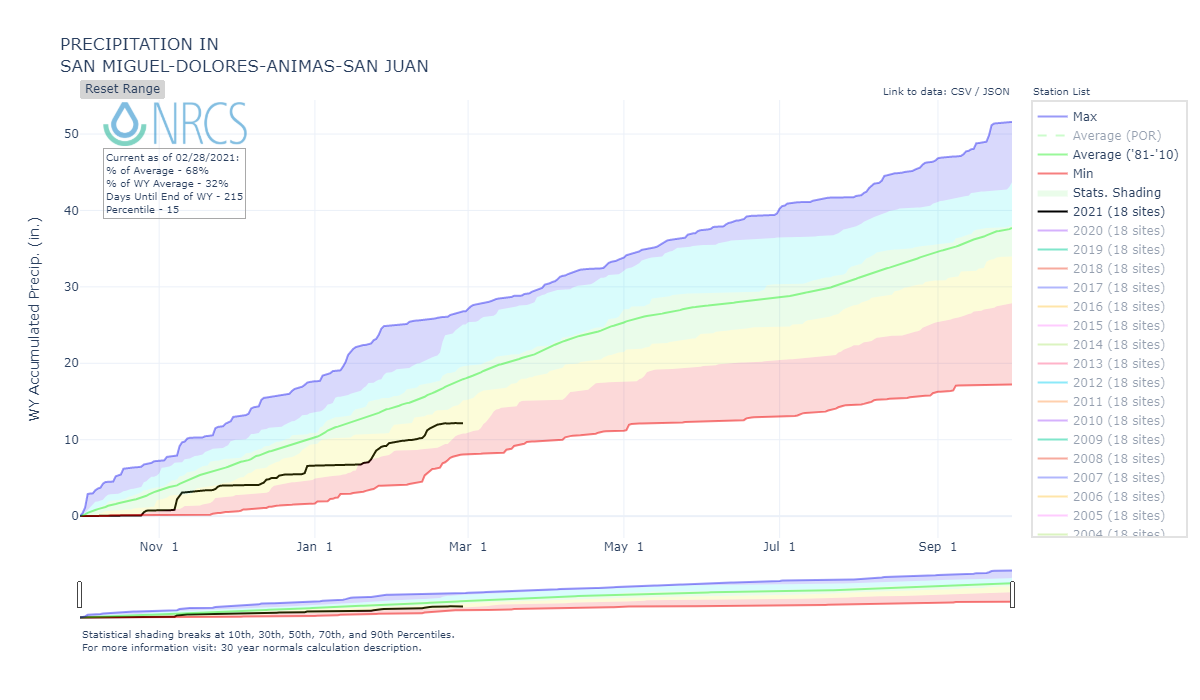
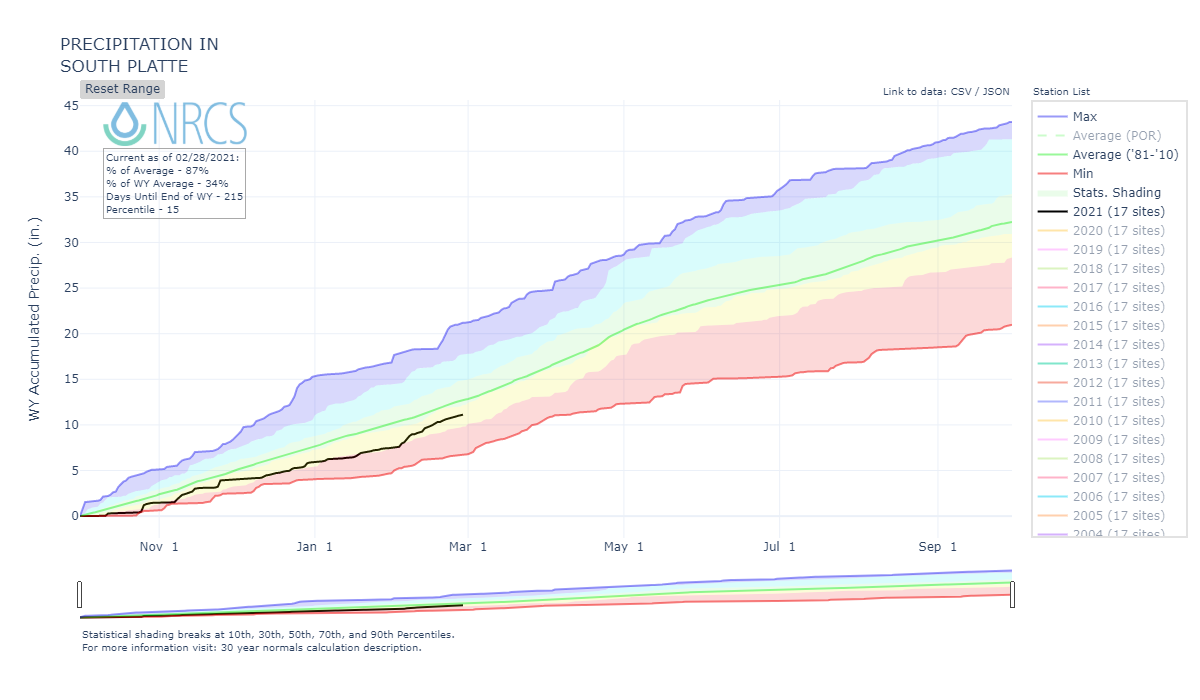
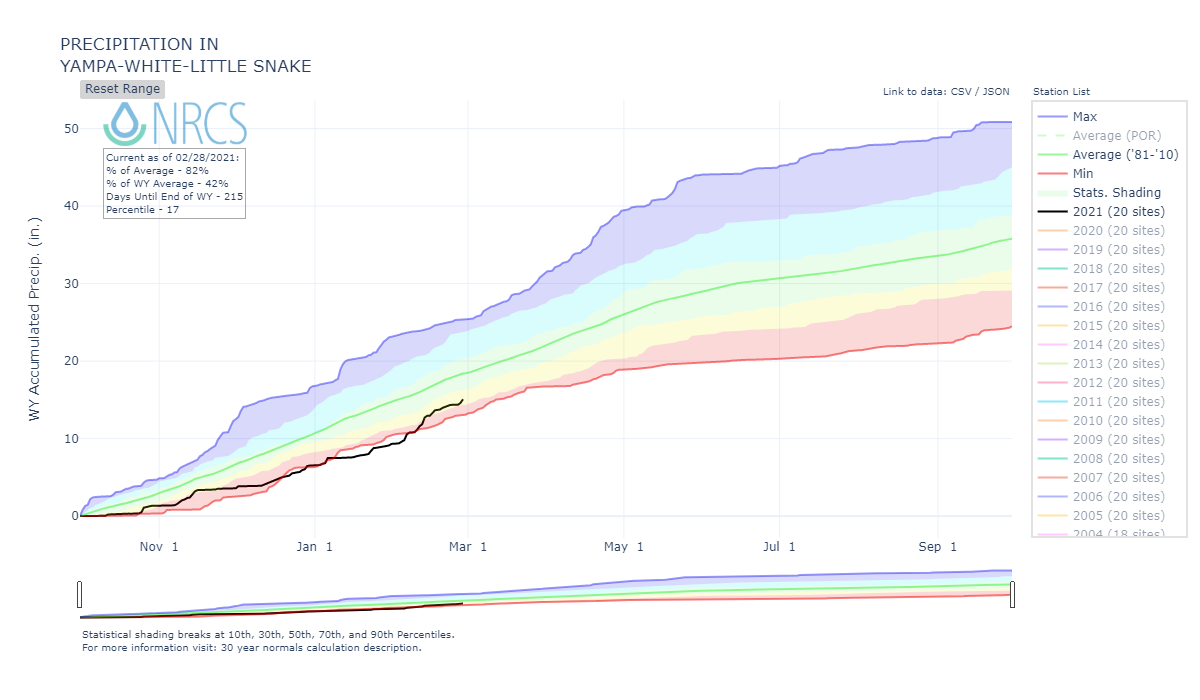
As of March 1st, SWE % is barely in the “average” category for the South Platte, North Platte, Yampa, Arkansas basins, and firmly for the Rio Grande basin. The Gunnison, Upper Colorado River, San Miguel/Dolores/Animas/San Juan are firmly in the “low” category. DERC “Average” SWE equals median +/- 10%, and deviation above and below those limits are assessed as having “high” or “low” SWE. The basins listed below are classified according to the appropriate DERC classification of either Low, Average, or High March 1st SWE domains.
Basin scale WY 2021 March 1 SWE conditions (NRCS data) classified using the Dust Enhanced Runoff Classification Scheme.
As described on the CODOS website, the DERC framework is utilized to identify prior years with similar patterns of dust-on-snow intensity, March 1st SWE, and spring precipitation conditions, and their associated hydrographs. March 1st SWE analyses have been performed for each CODOS site. From this, hydrographs from 2006-2020 with associated March 1st SWE conditions have been identified and included in the analyses.
An ‘exploded view’ of the Dust Enhanced Runoff Space, separated by March 1 SWE classifications.
CODOS SITE-SPECIFIC ANALYSES
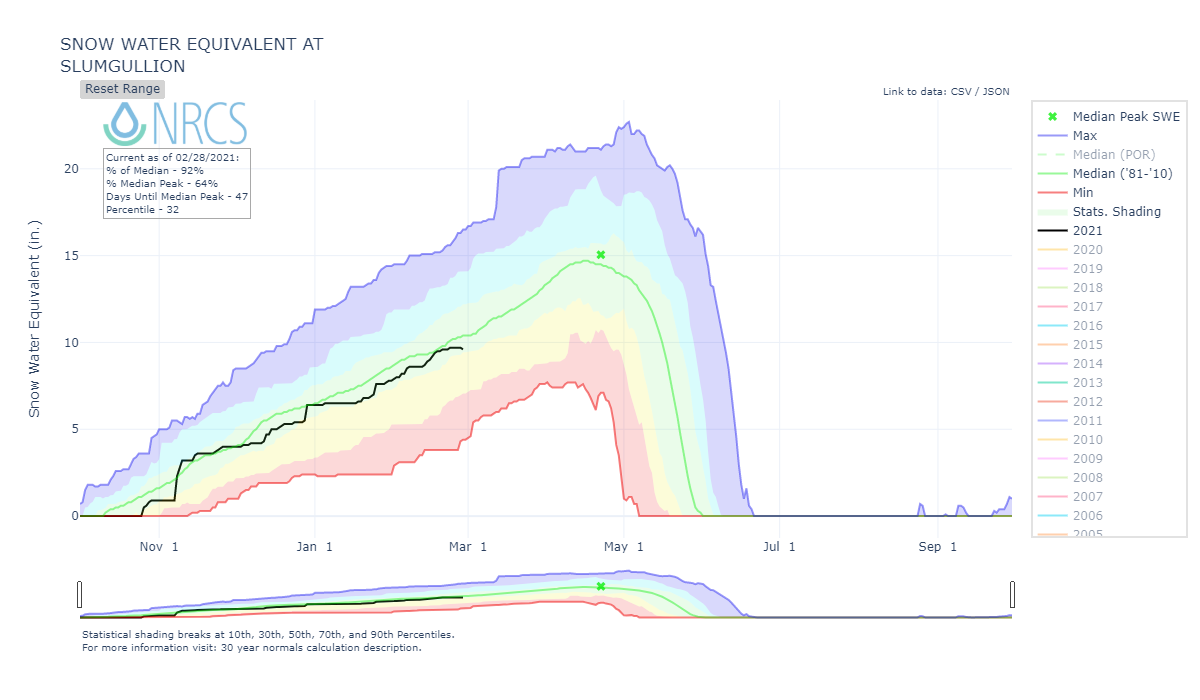
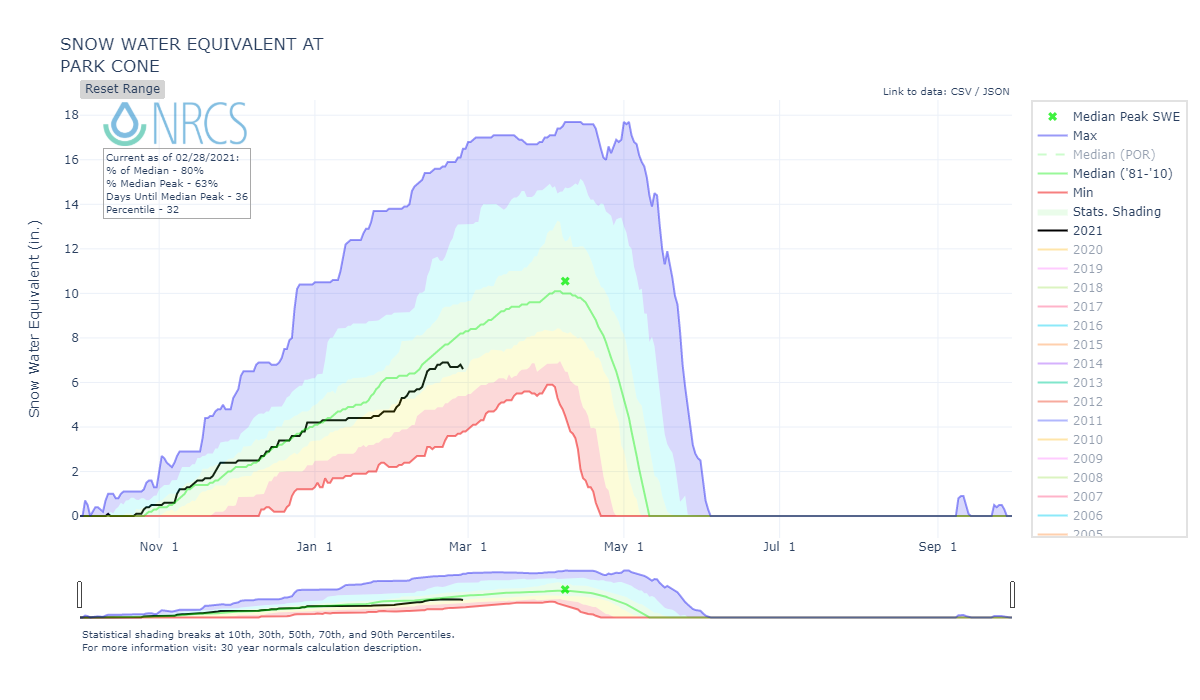
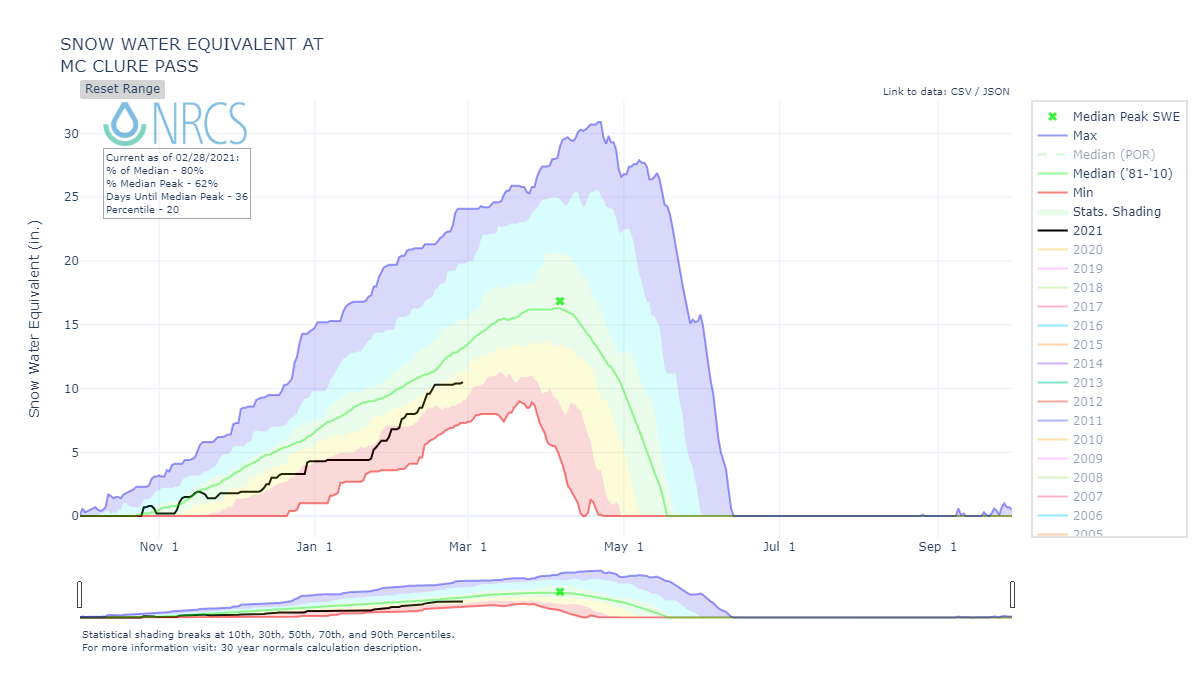
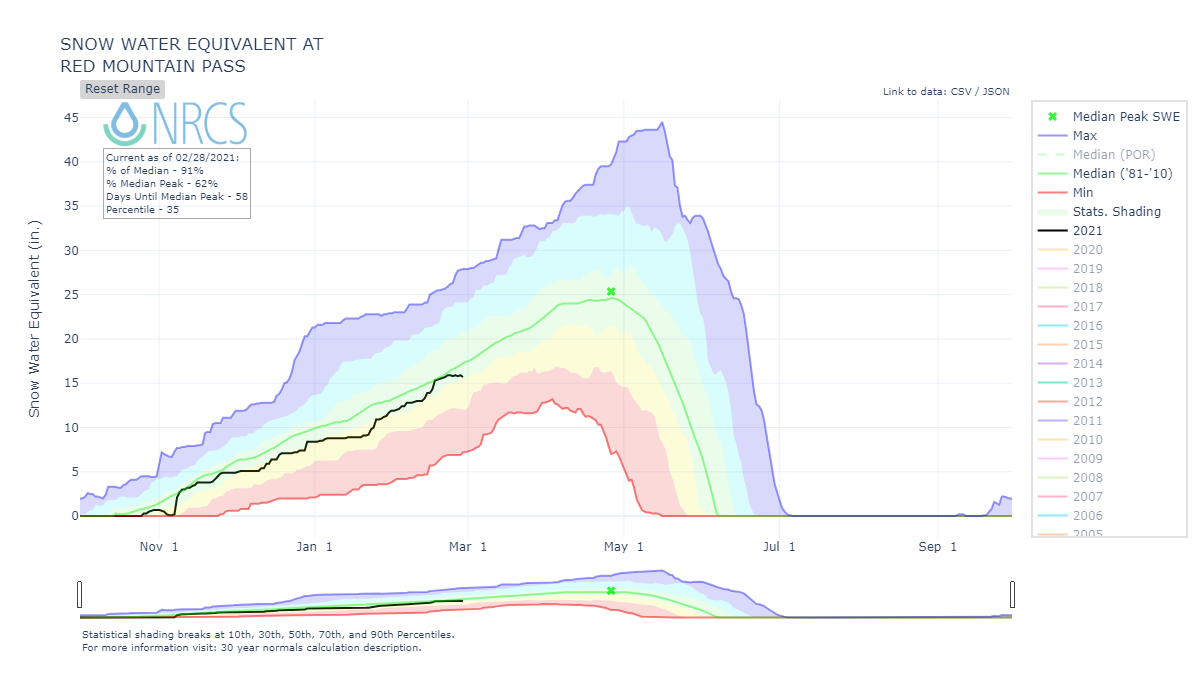
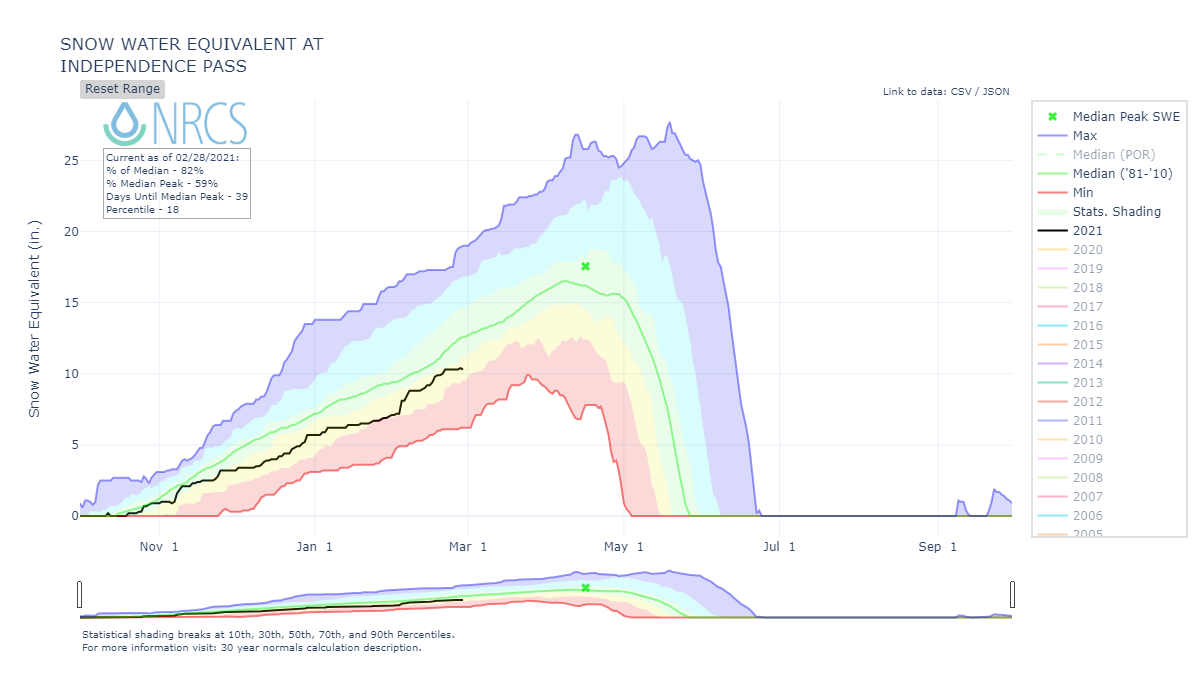
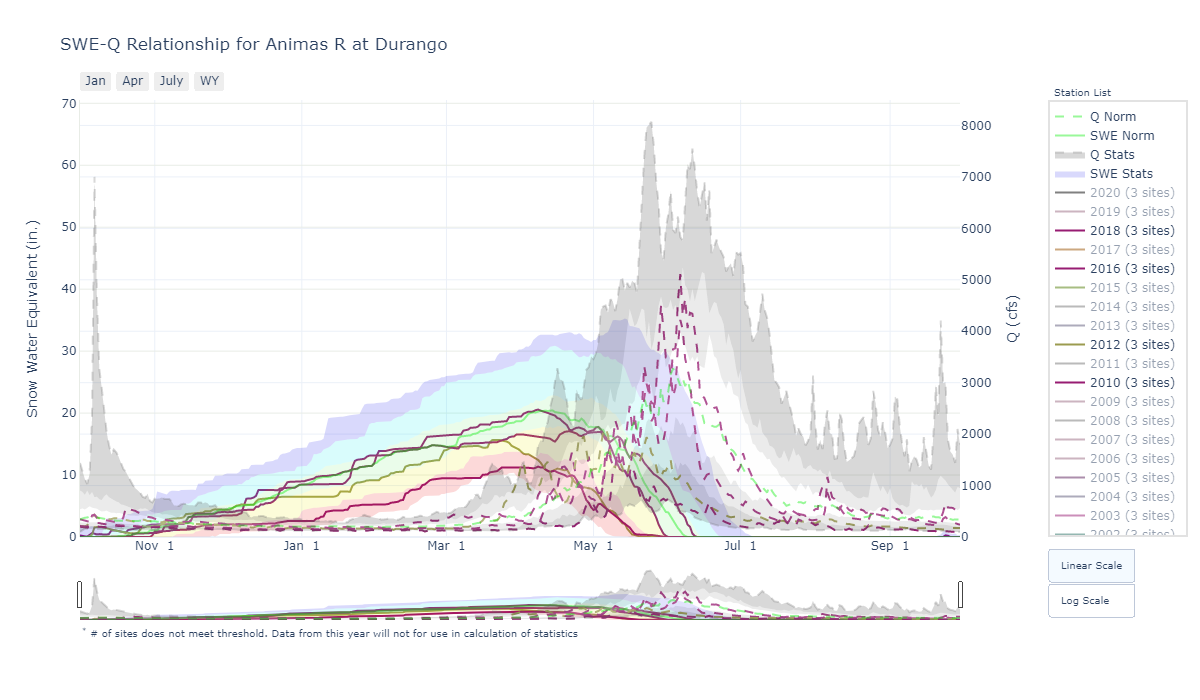
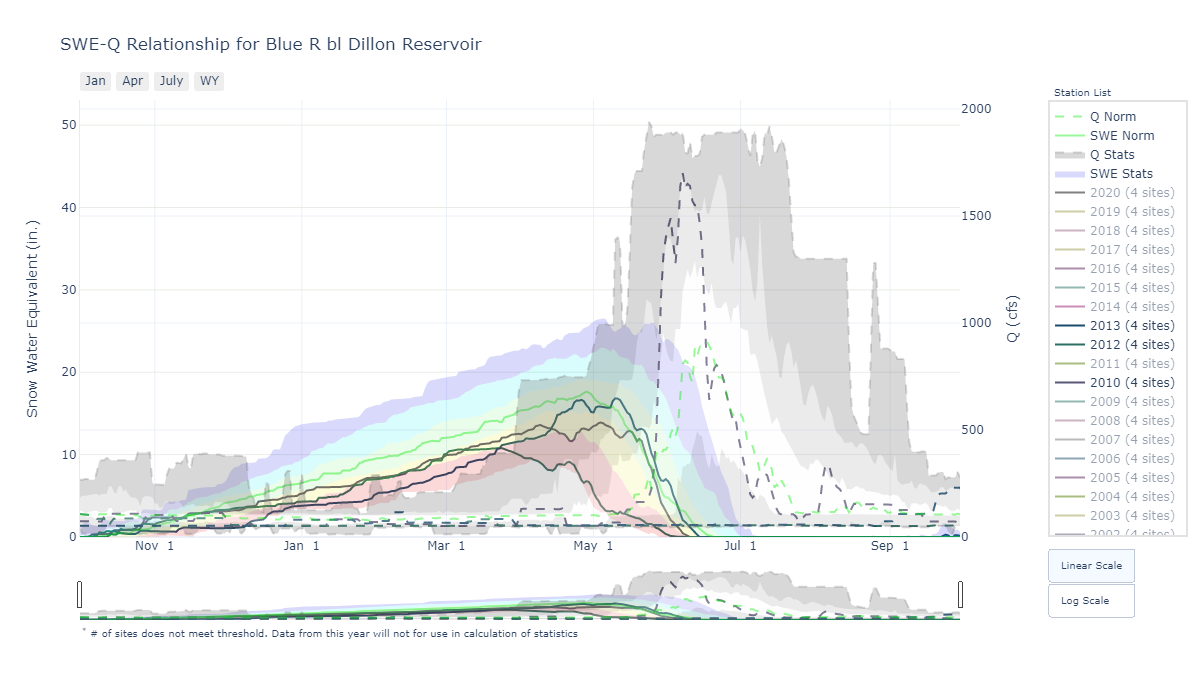
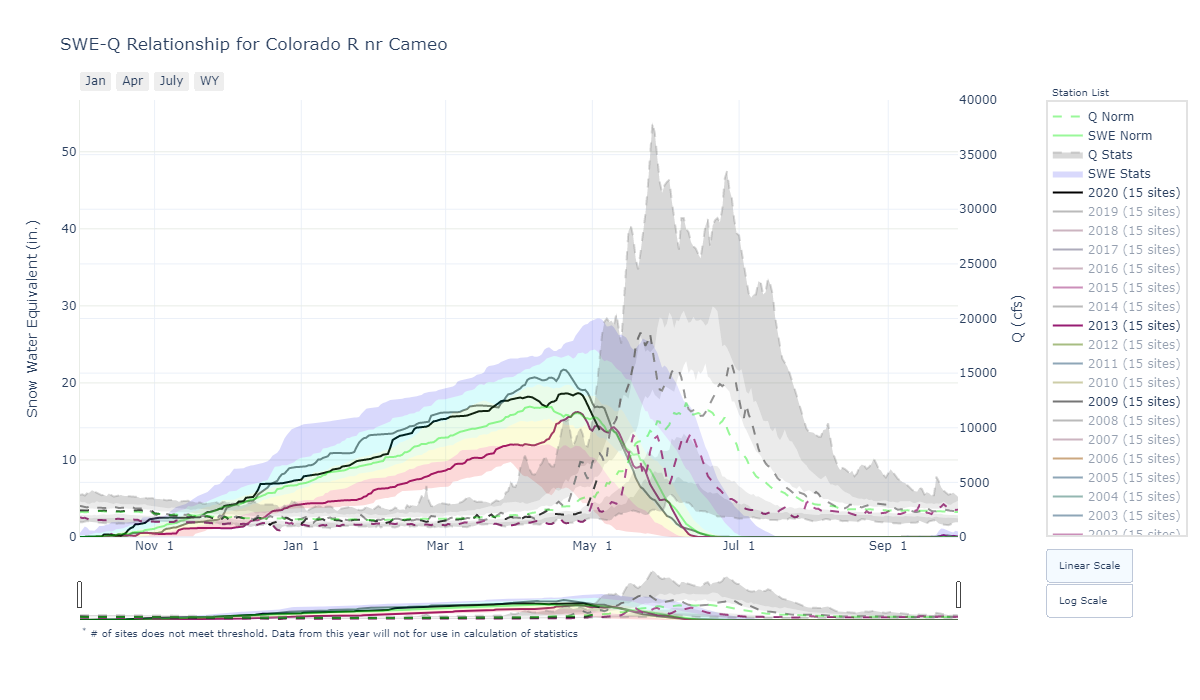
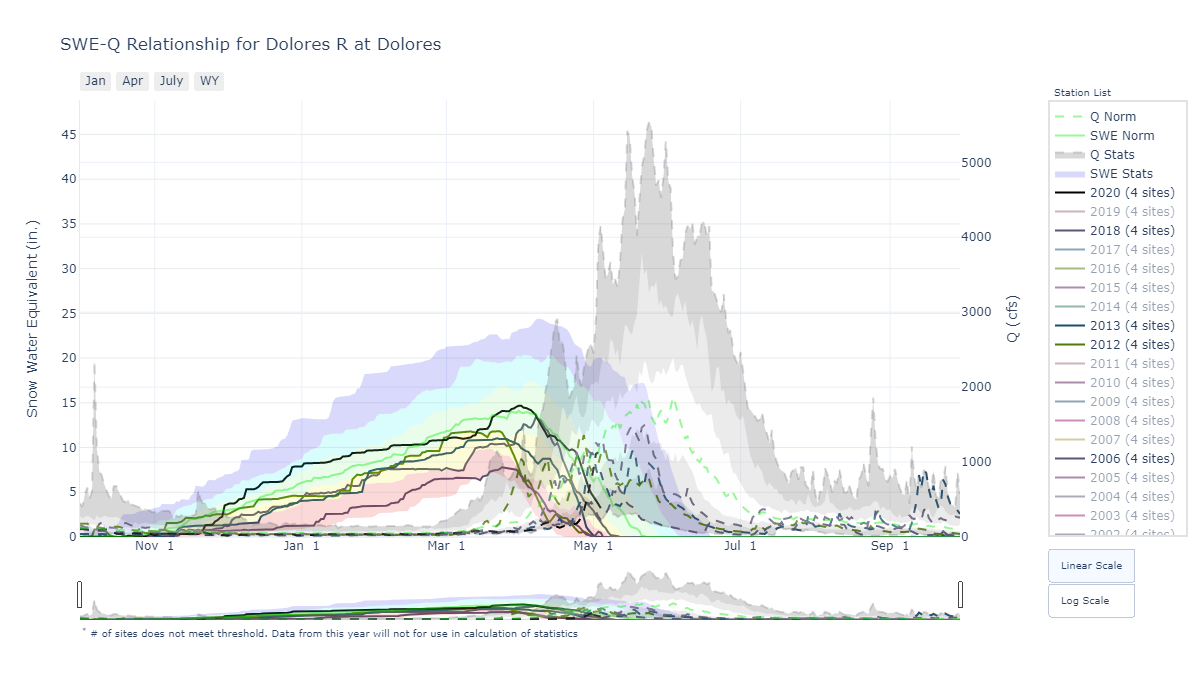
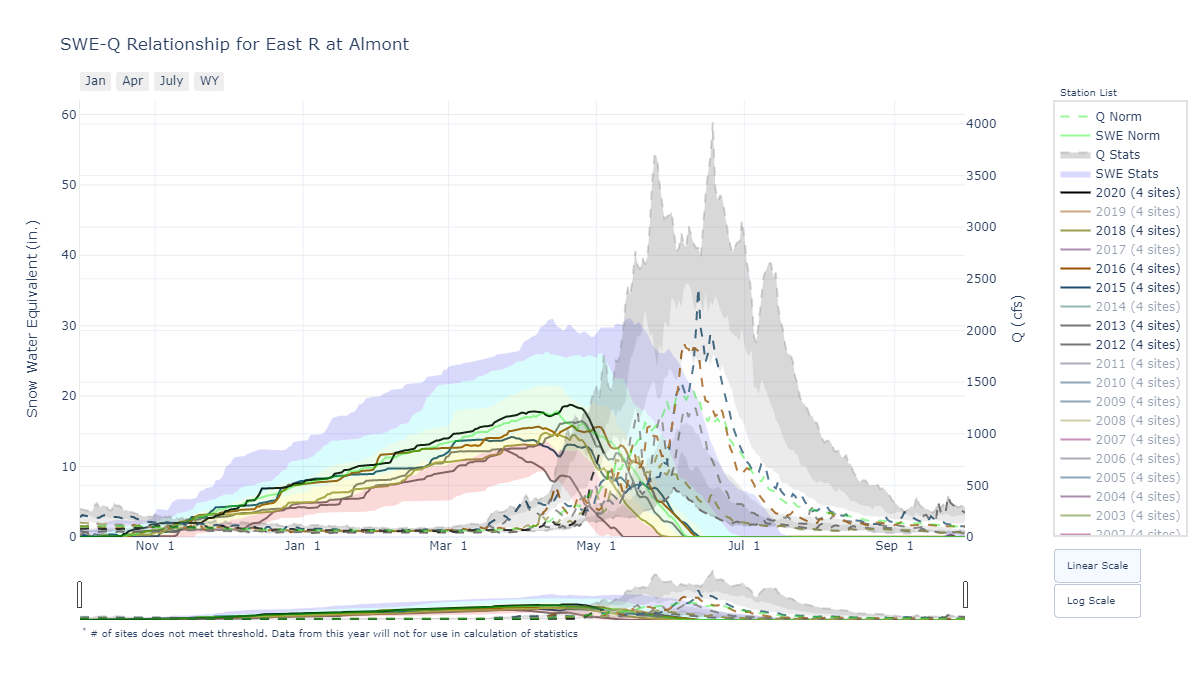
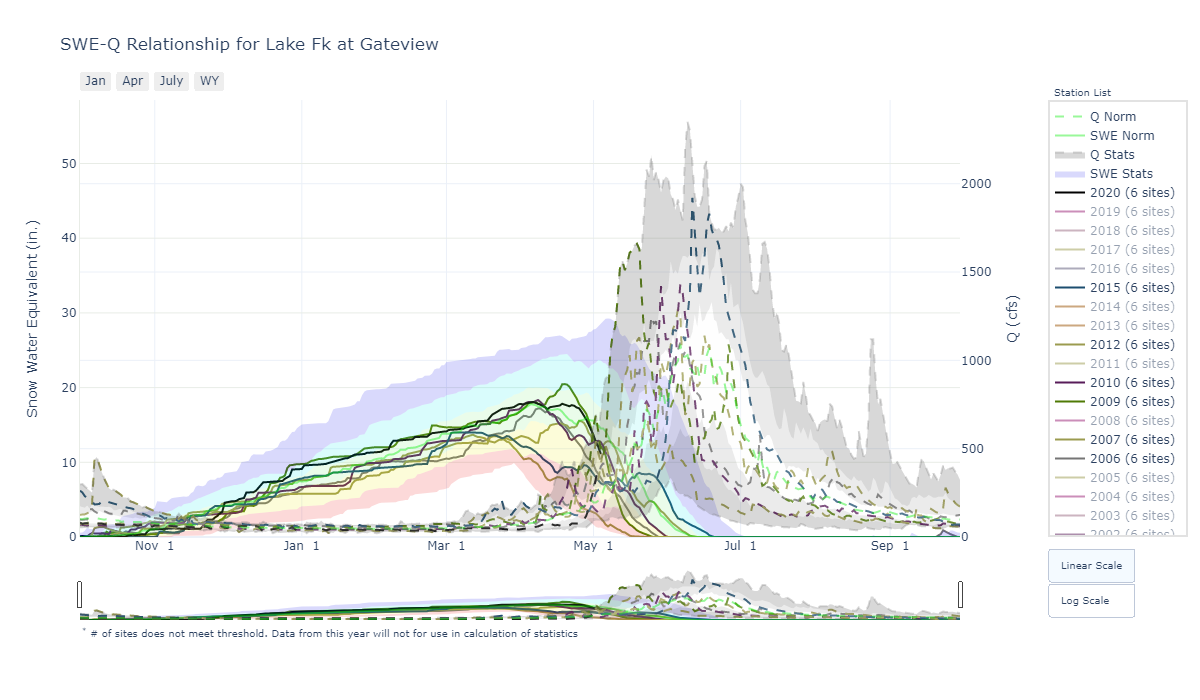
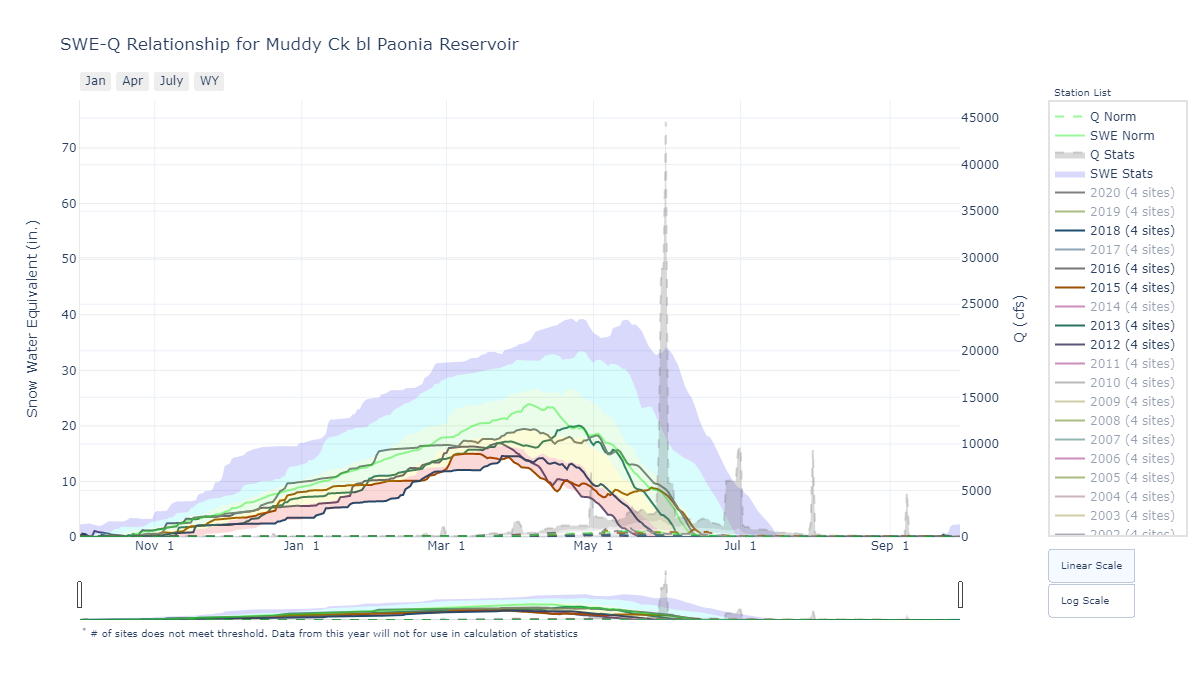
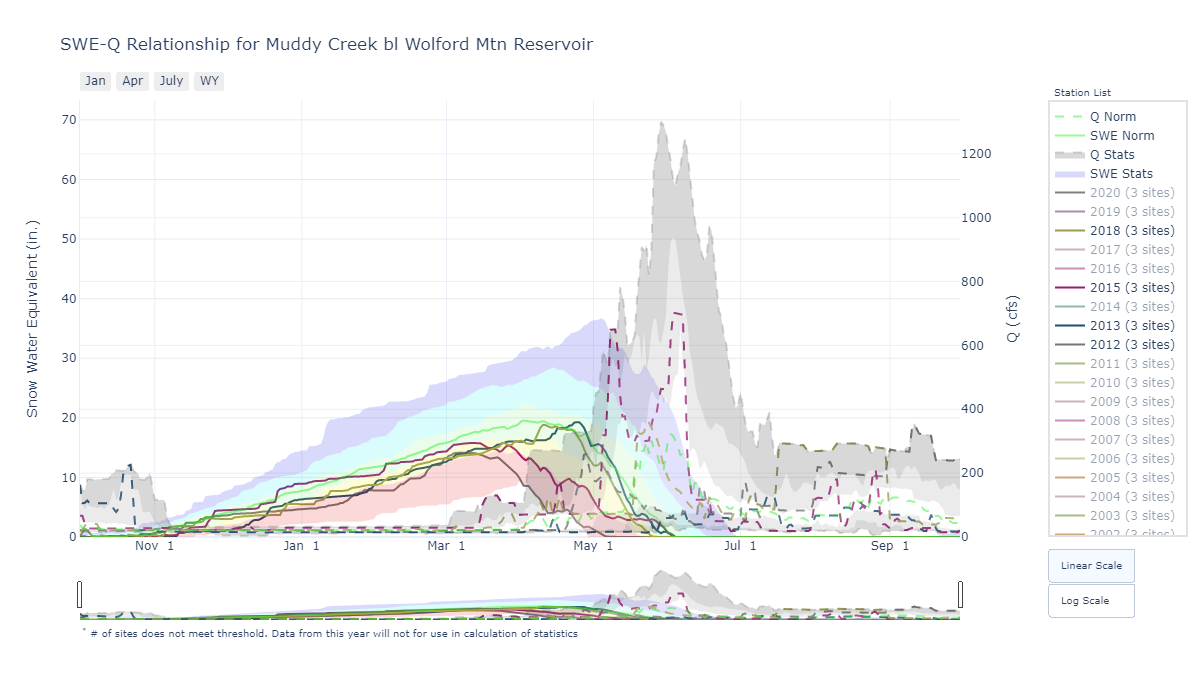
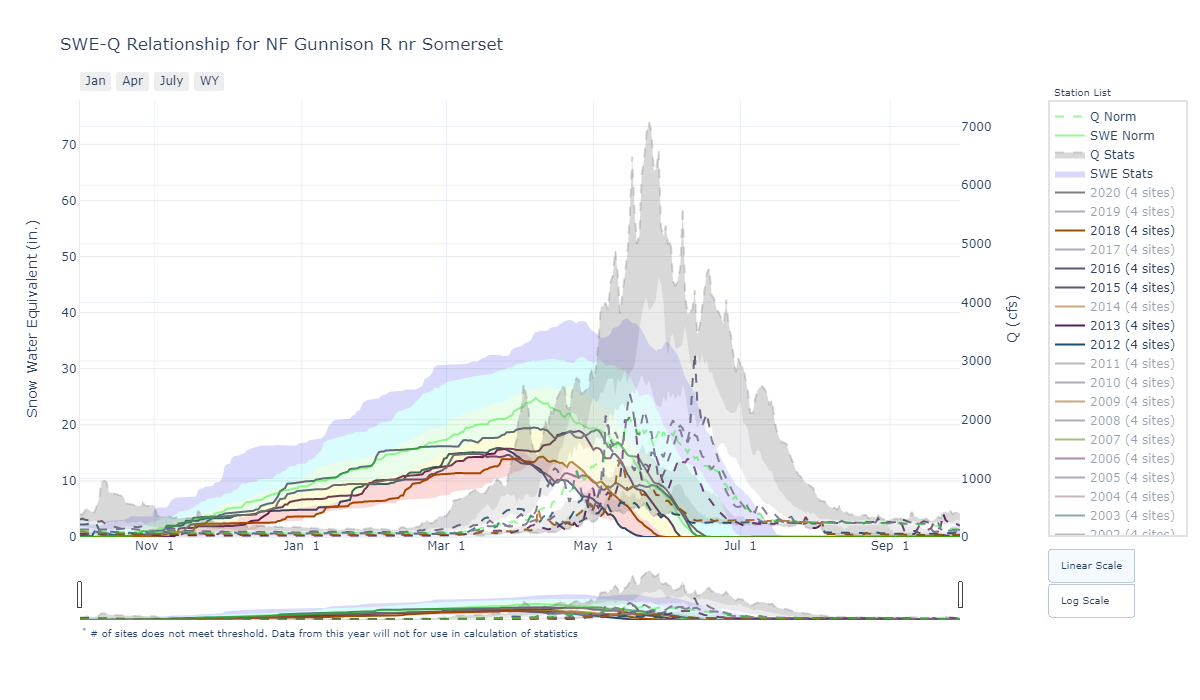
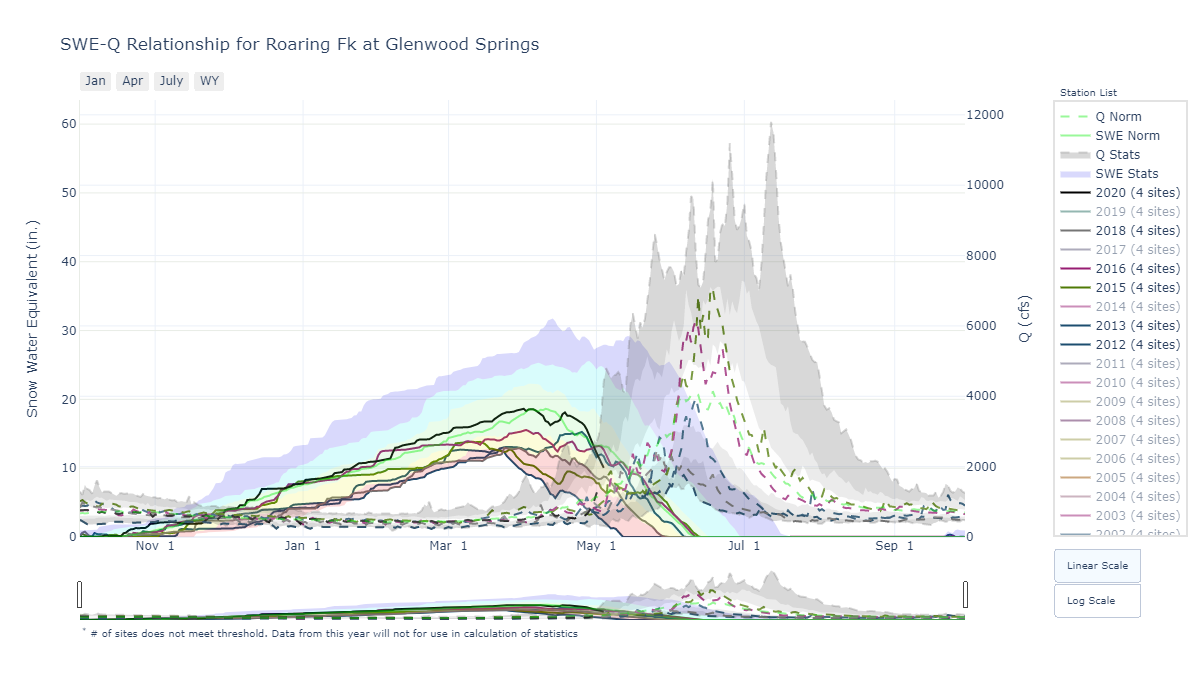
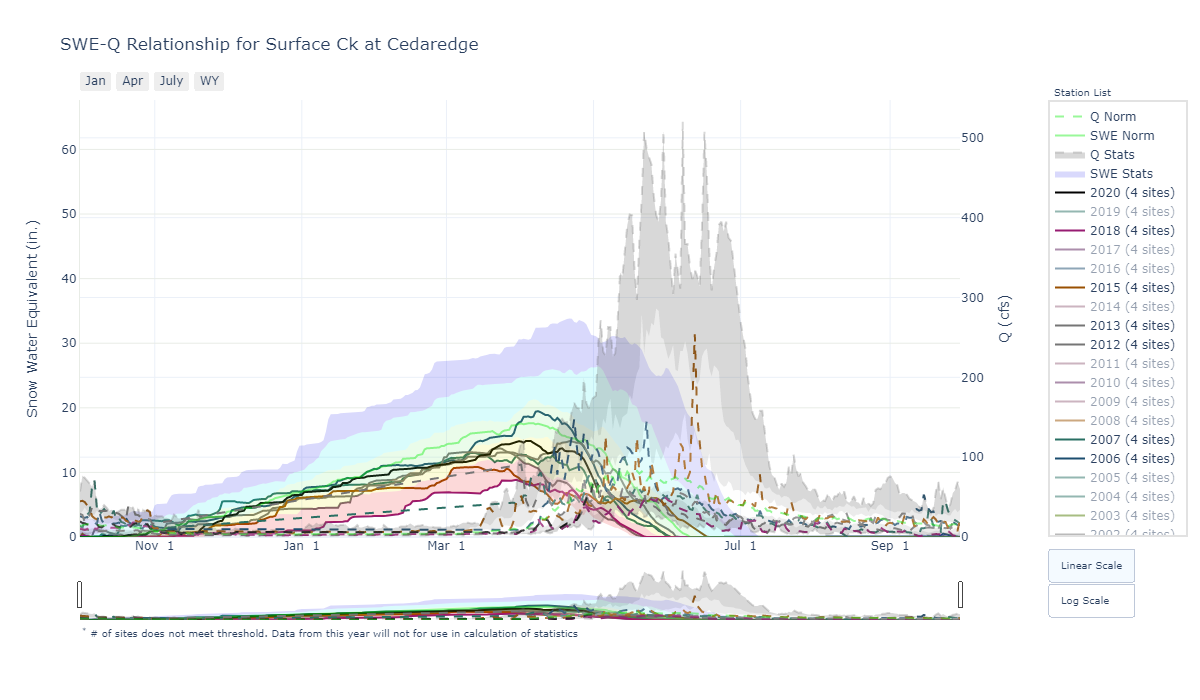
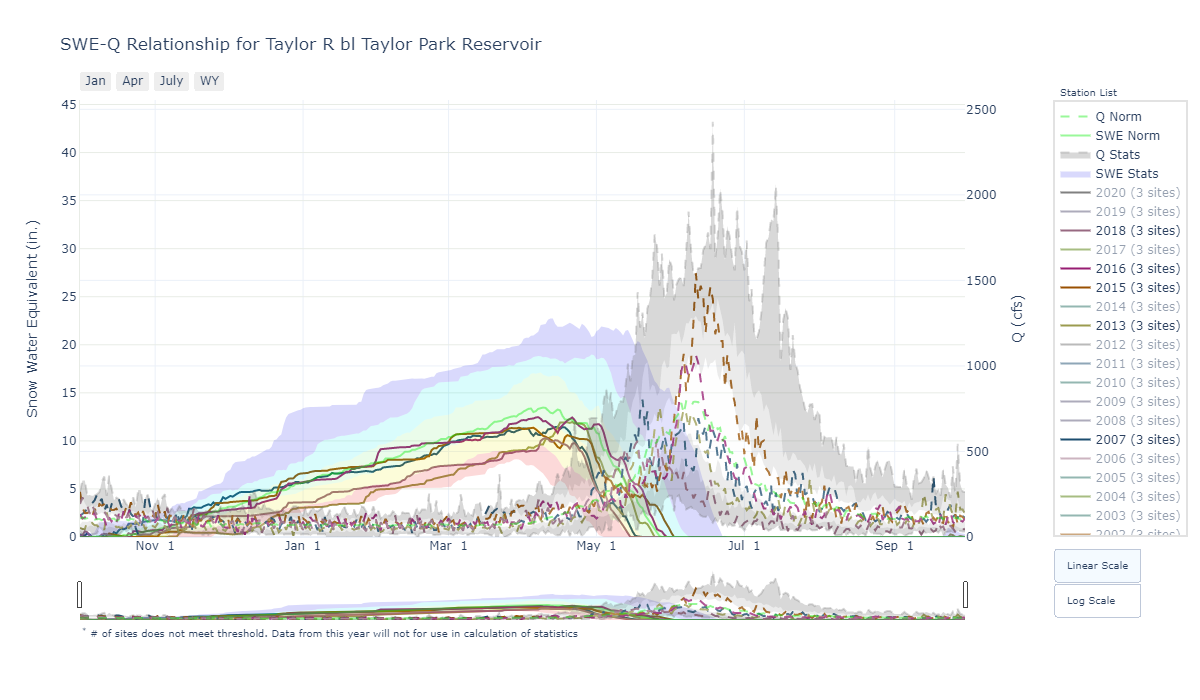
For individual SNOTEL stations associated with our eleven CODOS sites, March 1 SWE ranges from 69%-103% of median levels. March 1 SWE conditions were classified for the SNOTEL station directly associated with each CODOS site, and also for select nearby SNOTEL stations. Prior seasons with similar March 1st conditions were identified and placed within the appropriate dust enhanced March 1st SWE space. Local watershed hydrographs (from 2006-2020) associated with those March 1st SWE conditions are presented as plausible examples of runoff behavior in spring 2021, with the understanding that these prior years exhibit a relative limited variety of 2006-2020 dust and spring precipitation conditions for each CODOS site.
These analyses are presented in PDF format and are available for the watersheds listed below. You can see the entire period-of-record hydrographs as it relates to dust conditions on our CODOS website.
Below: The plots below show SWE and discharge for select watersheds for years with similar March 1 conditions.
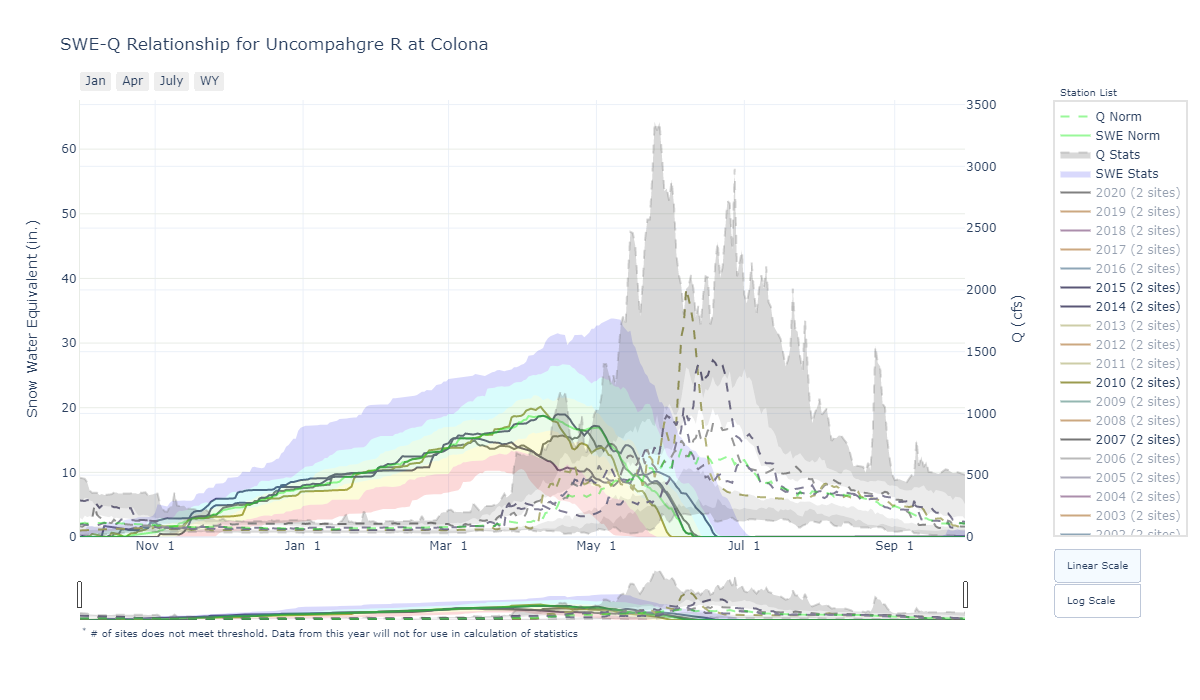
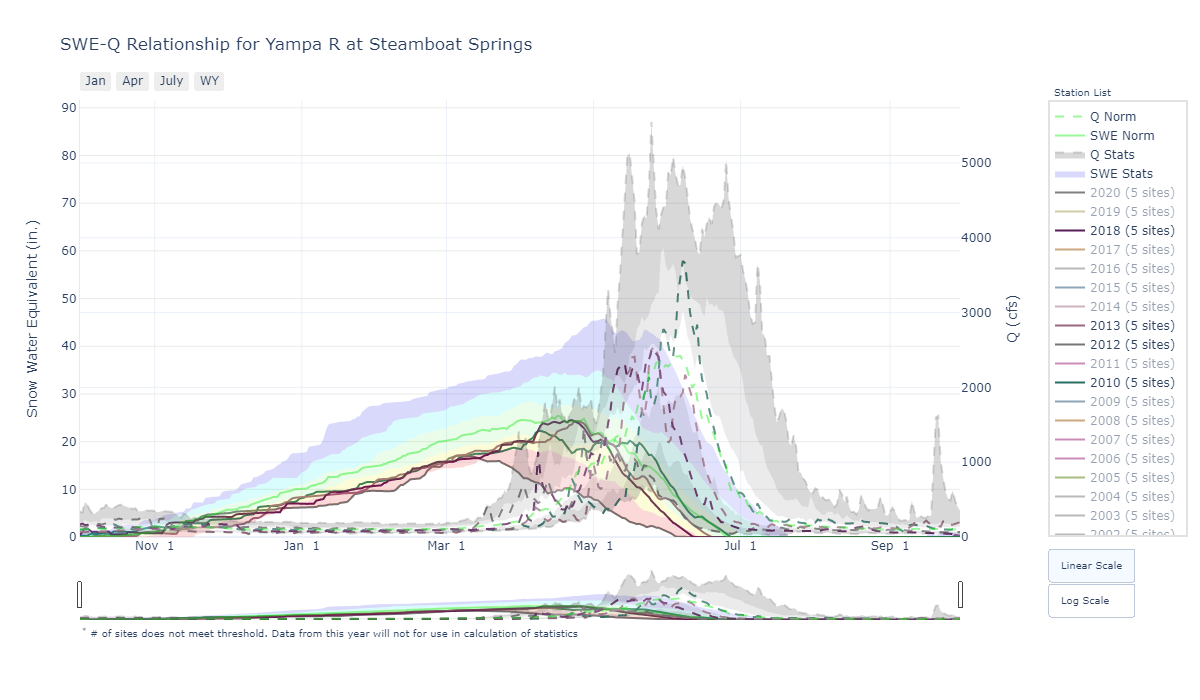
SENATOR BECK STUDY BASIN DATA PLOTS
SBB is located at, or near, the headwaters of four major watersheds (Animas, Uncompahgre, San Miguel, and Rio Grande) and is the only high alpine study site in the region collecting comprehensive snowpack information. We regularly dig snow profiles to assess snow/dust conditions, and our meteorological stations measure the entire energy budget of the snowpack. Being a headwater study basin, the elevations that we collect snowpack information and continue meteorological station monitoring is well above the highest of most SNOTEL stations.
Snowpack at the Swamp Angel Study Plot (SASP) is above average in both snow depth and SWE. The same is true for the Senator Beck Study Plot (SBSP), which is more exposed and at a higher elevation than SASP.


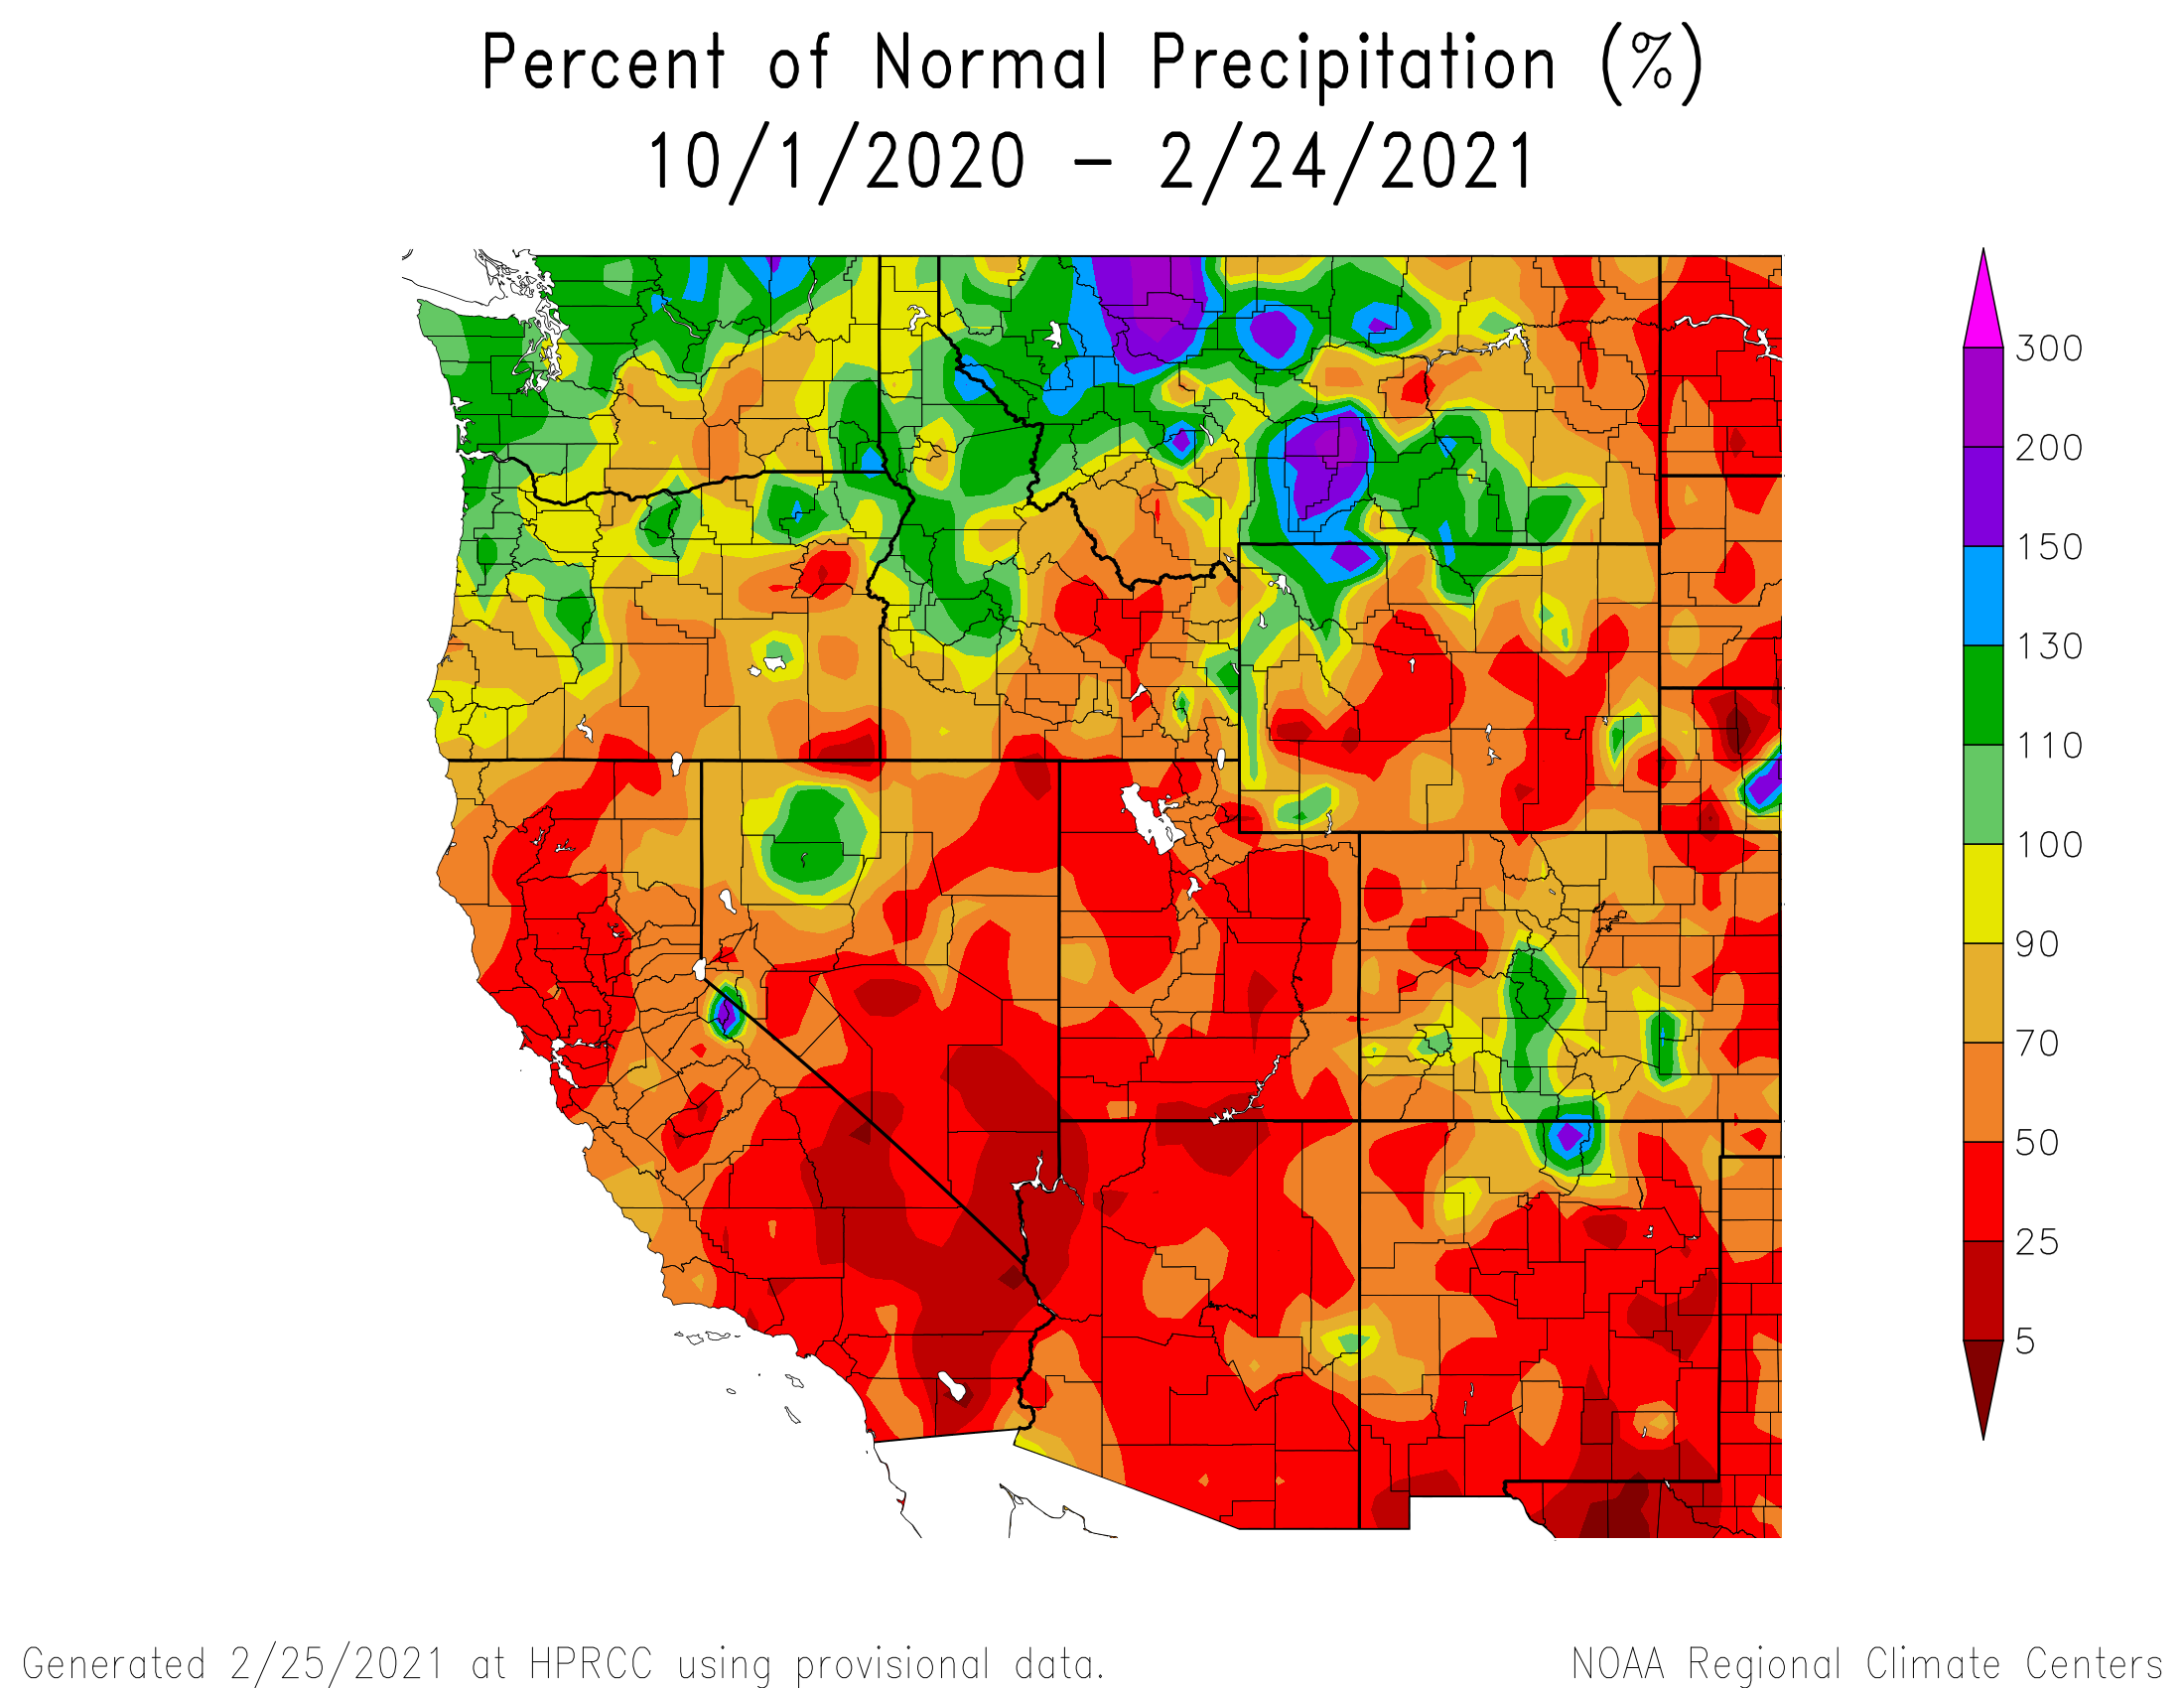
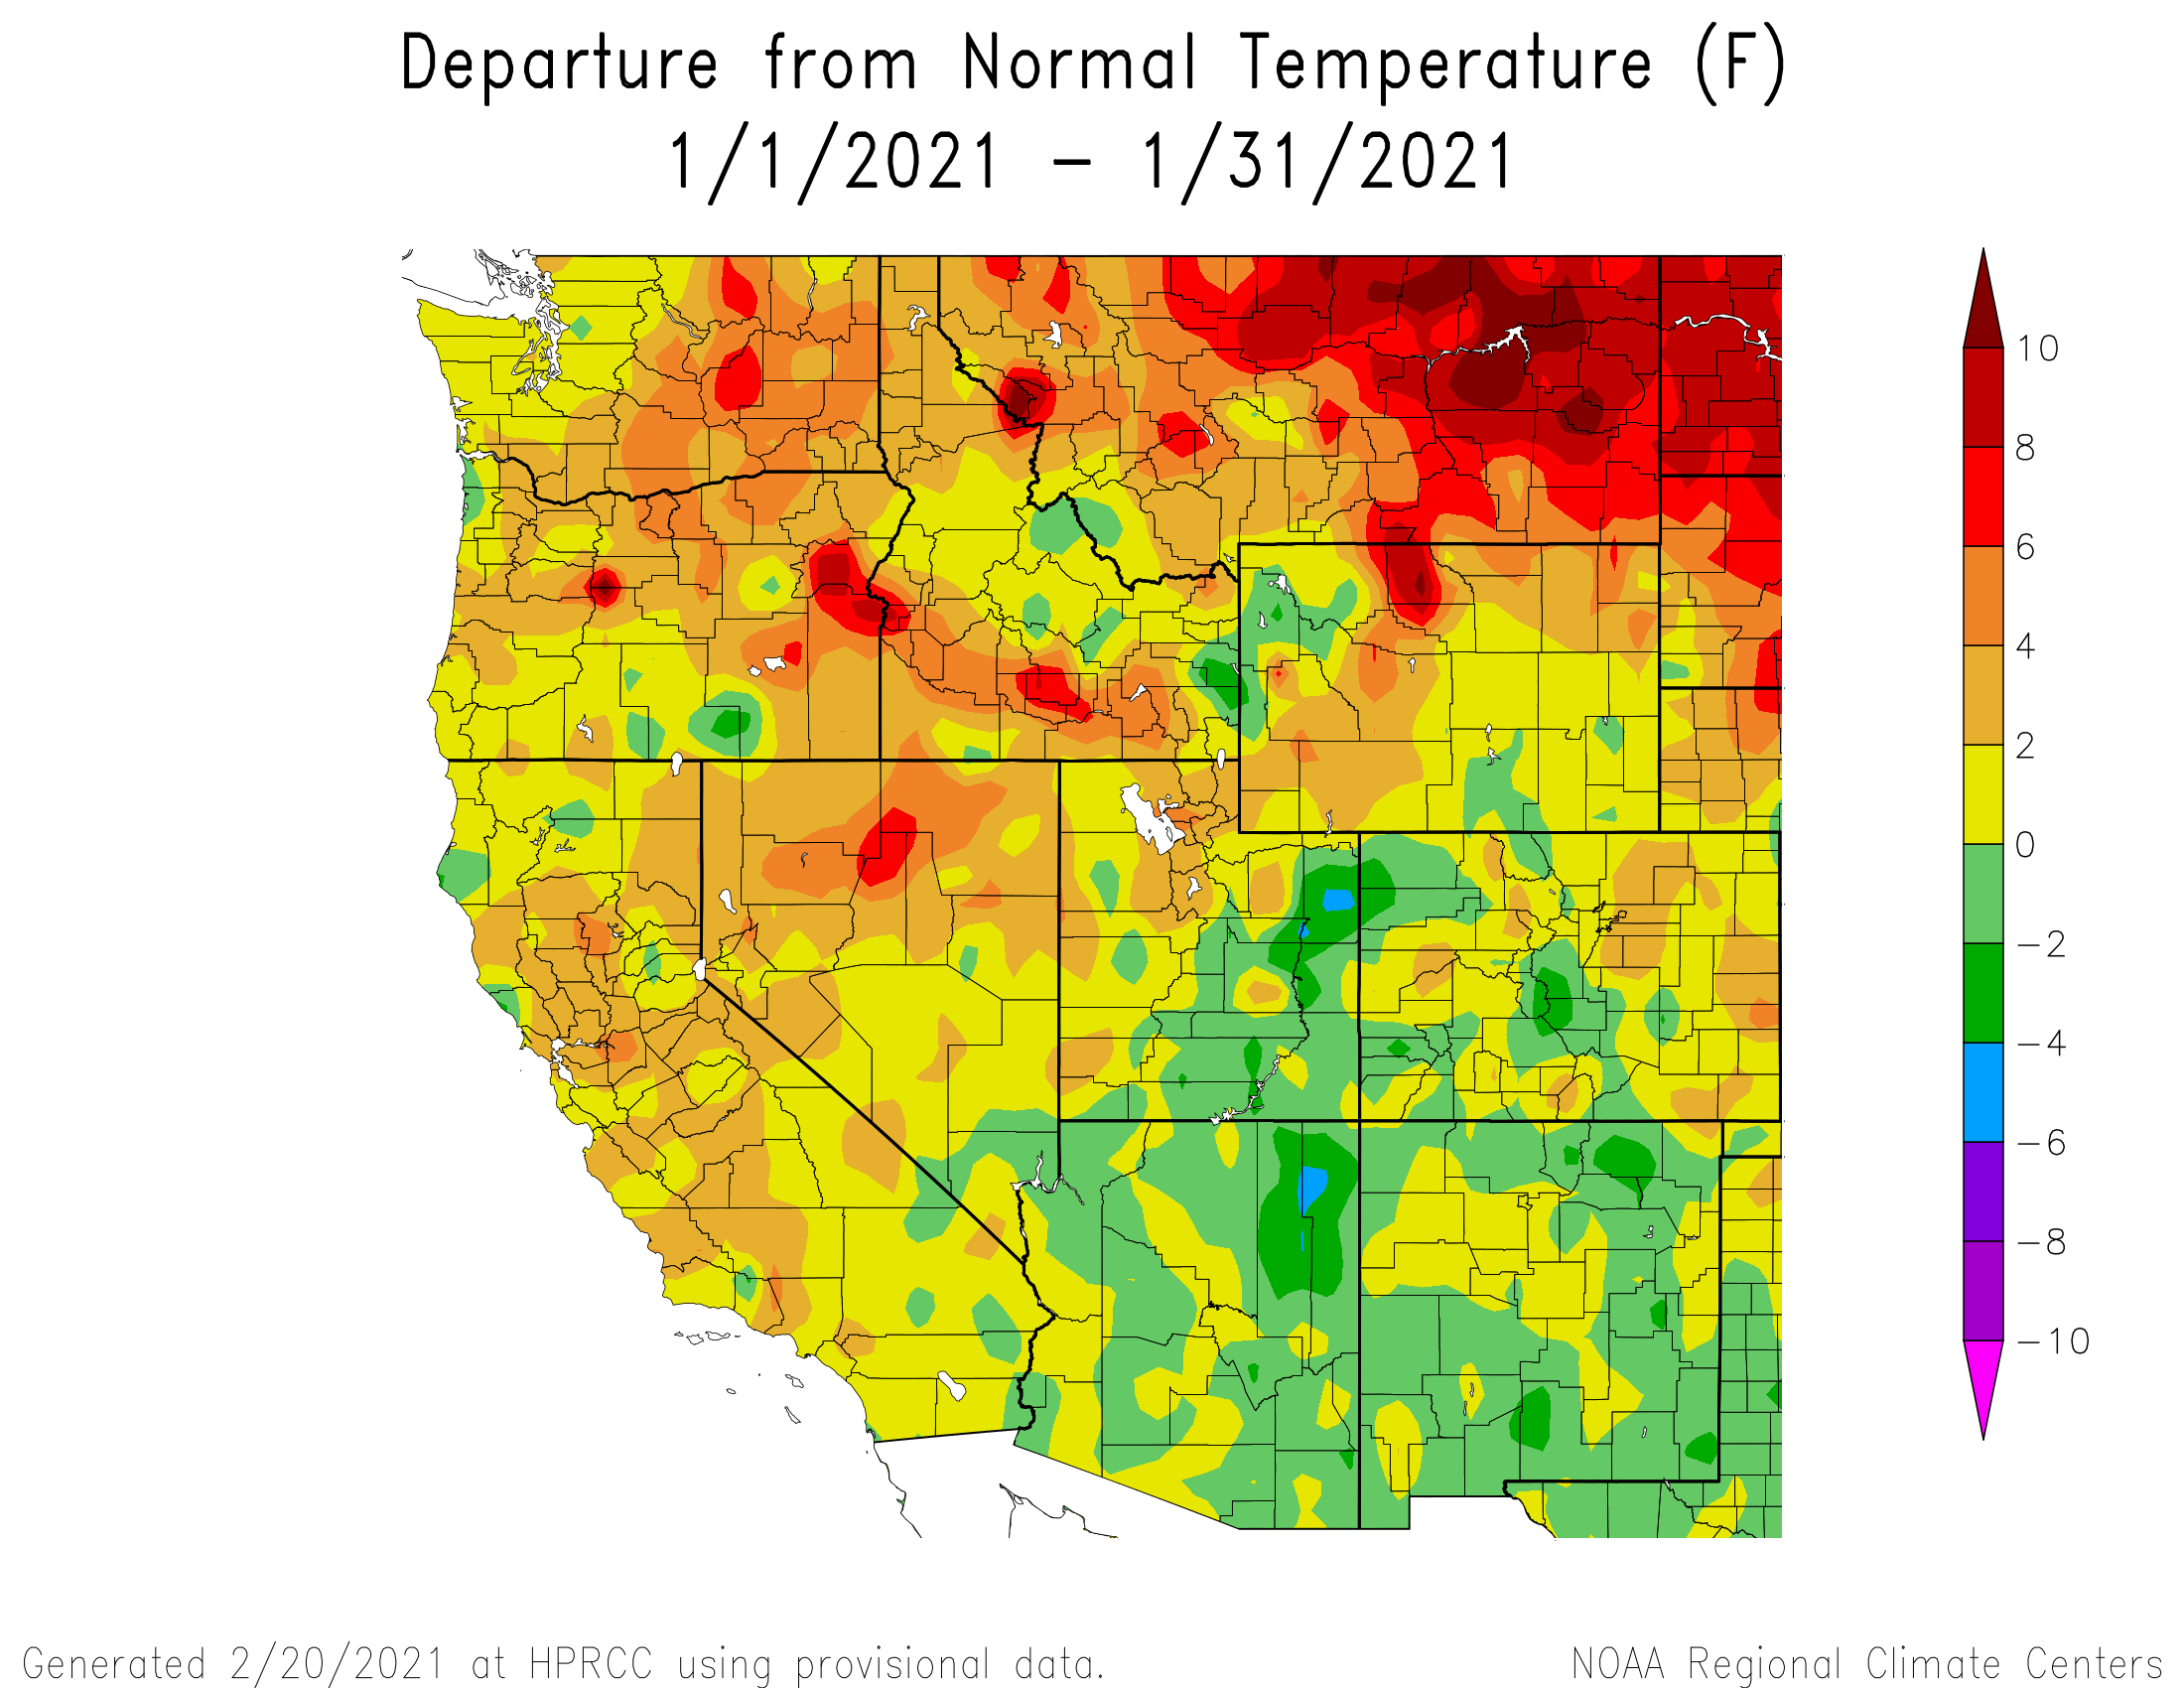
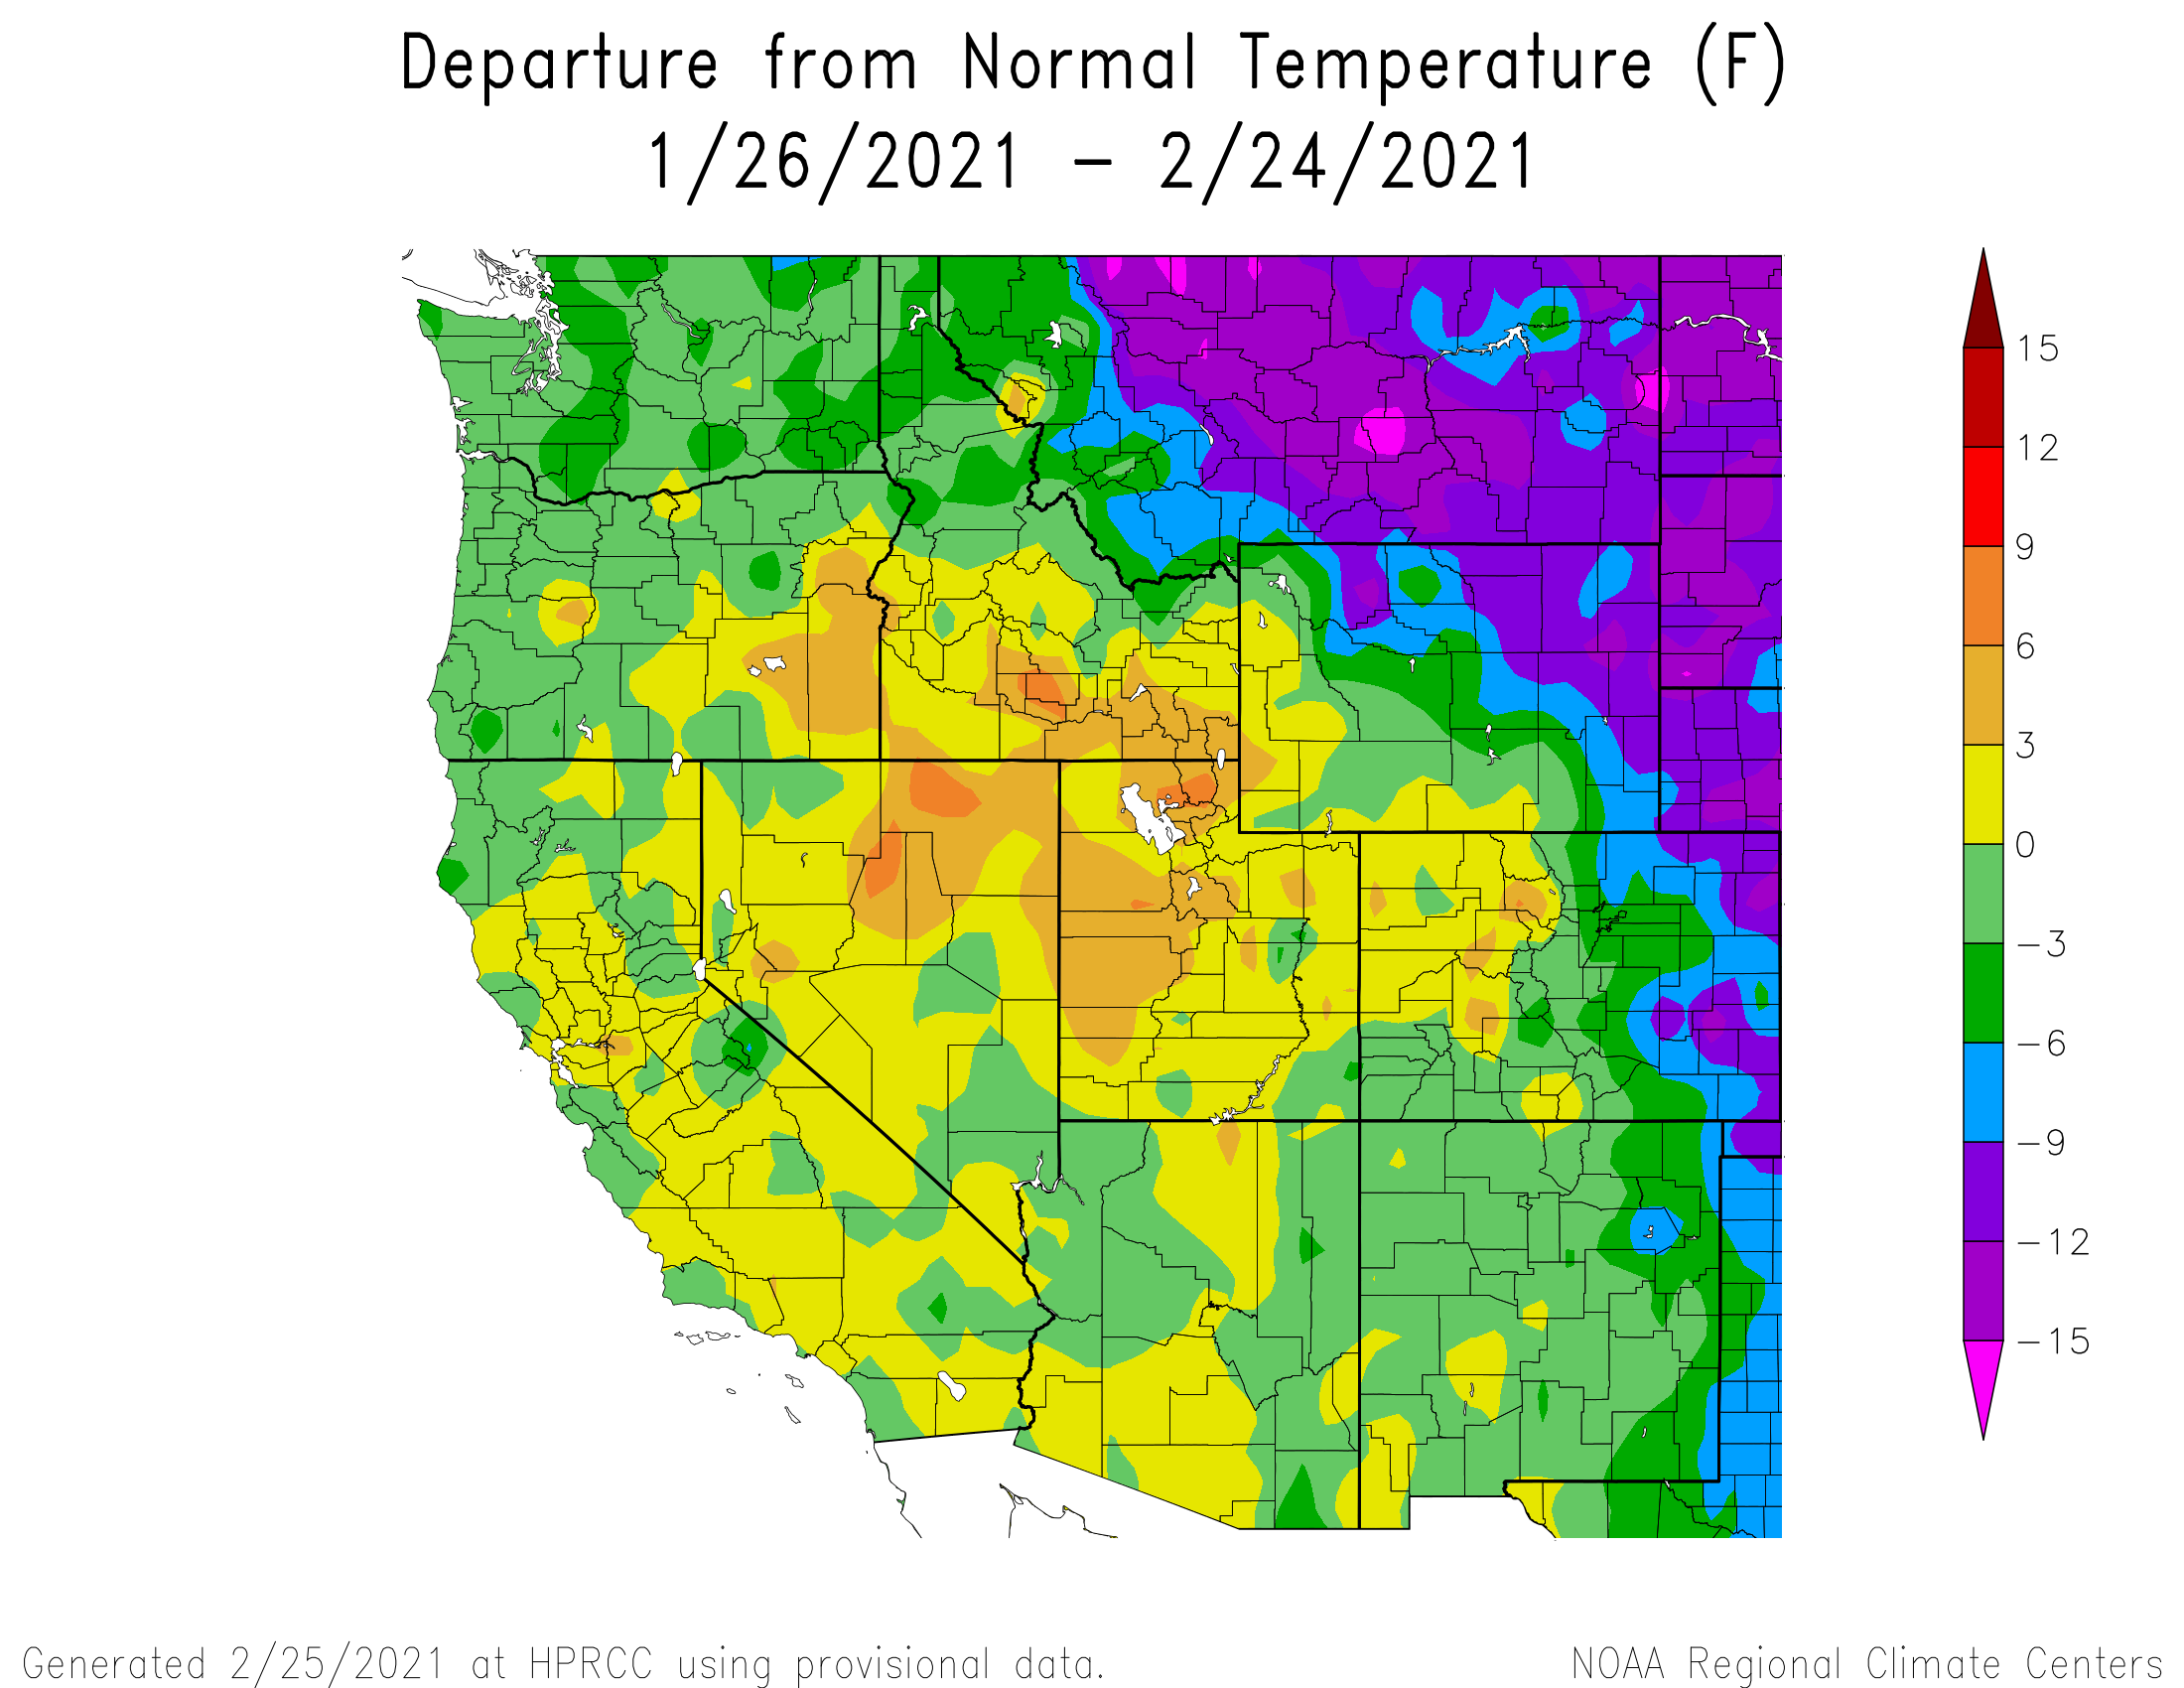

Below: Dry conditions are expected to prevail the remainder of winter.


Below: Comparison of current drought conditions to last year at this time. 2020 was Colorado's second driest calendar year on record, leaving soils, base flows, and some reservoirs low entering 2021.
SENATOR BECK STUDY BASIN SETTING
Usually just before spring it is helpful to remind long-time CODOS subscribers and inform new subscribers where Senator Beck Basin (SBB) and it’s meteorological stations are located, so when we refer to data at SASP (Swamp Angel Study Plot) or SBSP (Senator Beck Study Plot) the reader understands the environment in which it was collected.
Senator Beck Study Basin location near Red Mountain Pass near Silverton, CO. Elevation of the Basin ranges from 11,030’ at the stream gauge to 13,510’ at the crest of the peaks. The blue line delineates watershed boundary. Senator Beck Study Plot and Swamp Angel Study Plot are the locations of highly instrumented meteorological stations and are also where snowpack data is collected. This picture was taken from our Putney station, where we collect “free air” wind speed and direction.
