

Overview
Every March 1 the Colorado Dust-on-Snow Program (CODOS) summarizes dust-on-snow and snowpack conditions statewide and evaluates snow water equivalent (SWE) data from SNOTEL stations associated with our eleven CODOS sample sites and places them within the framework of the Dust Enhanced Runoff Classification scheme (DERC) developed by CODOS. The intent is to offer a glimpse of plausible WY2023 hydrograph characteristics based on current snowpack and dust conditions compared to similar conditions in our period of record.
SNOWPACK CONDITIONS
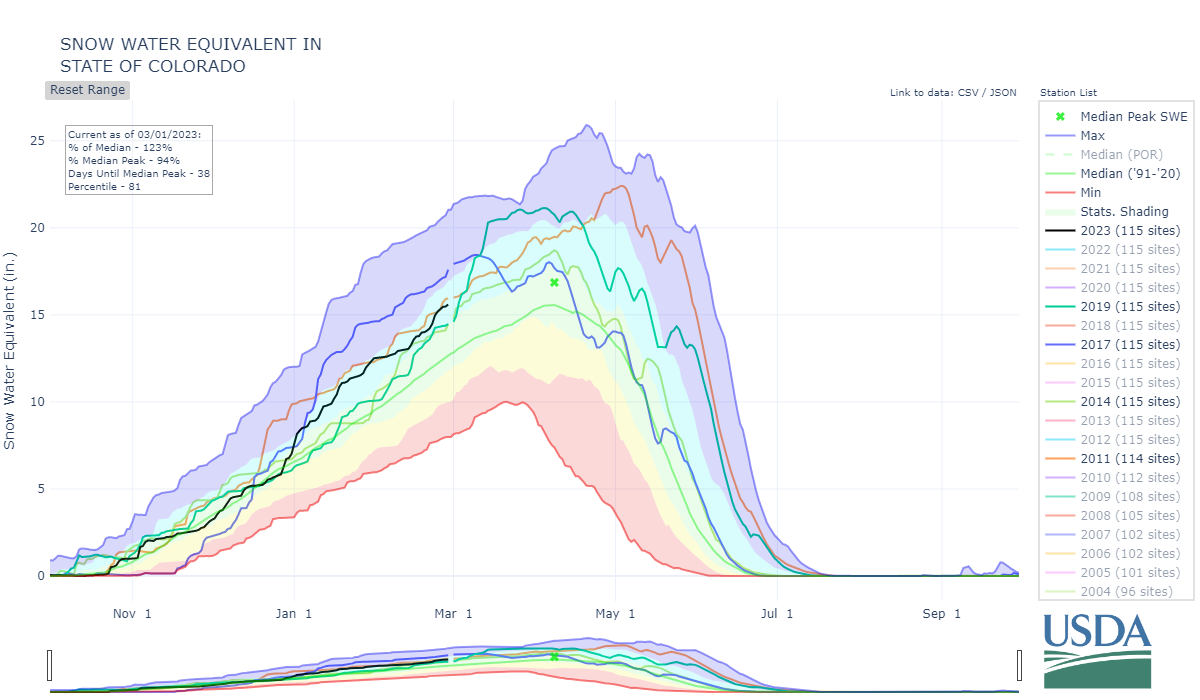
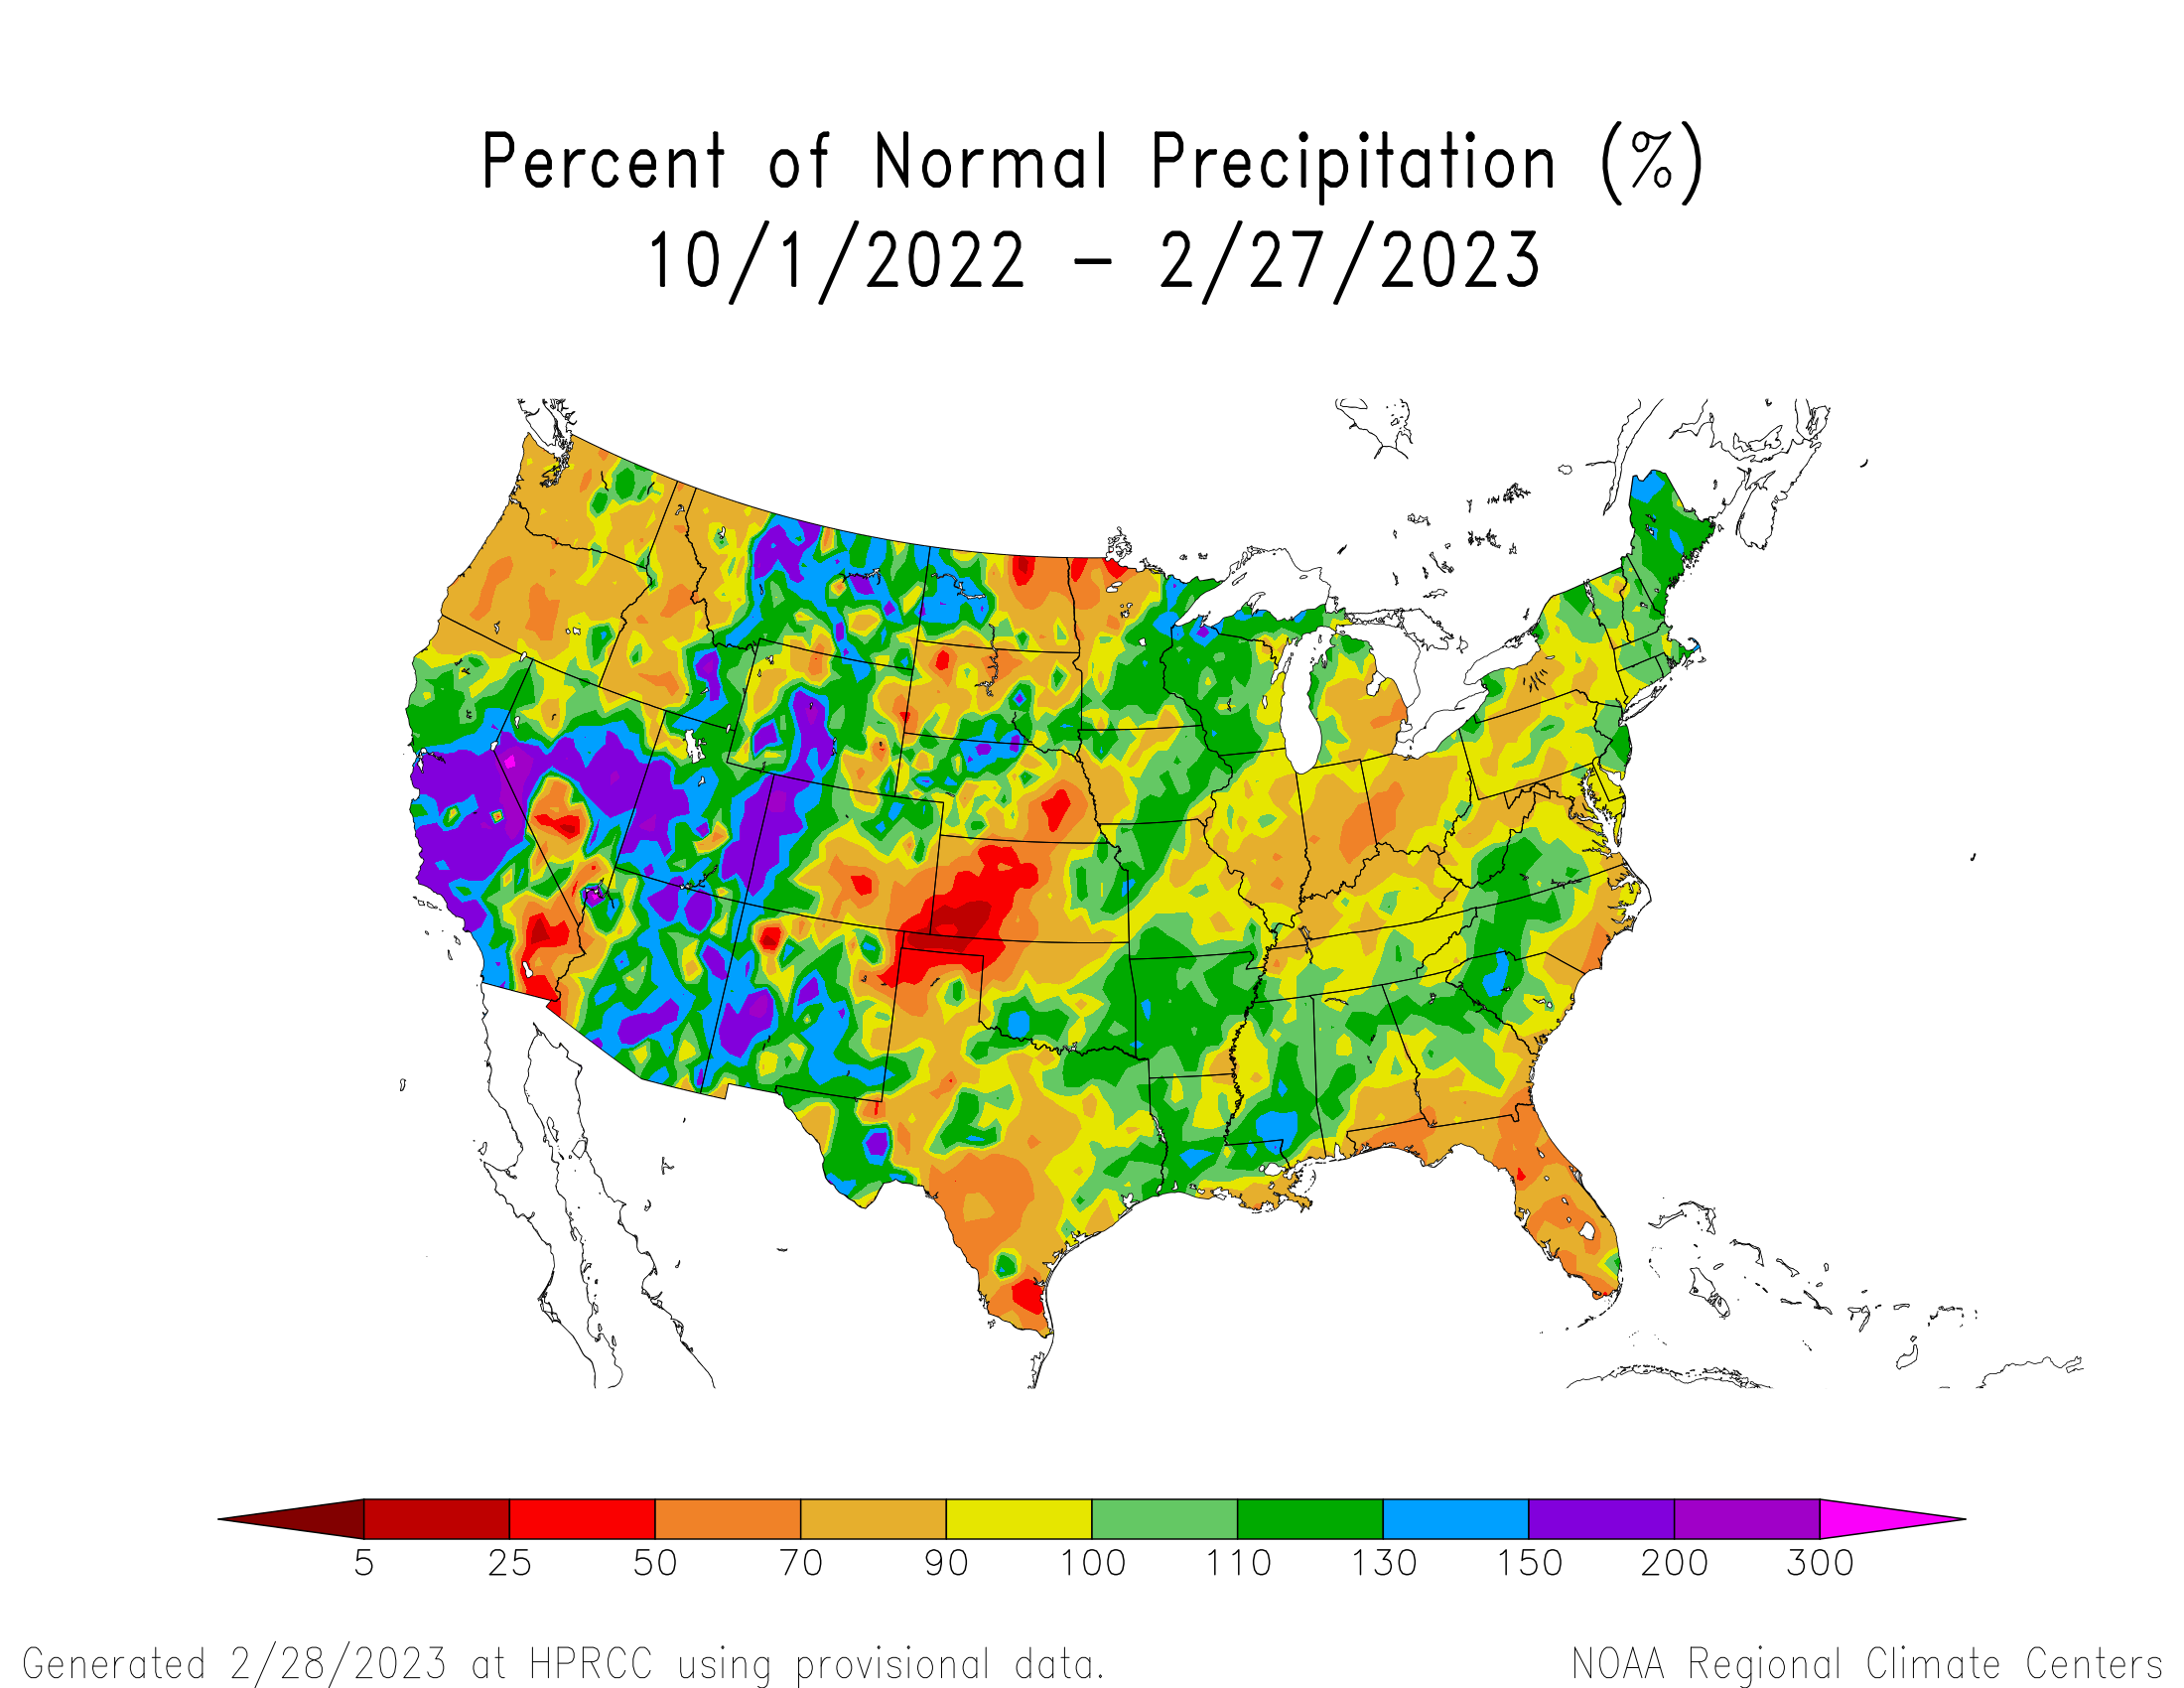
The WY2023 winter has been a crazy whirlwind, seemingly one storm after another. If you are a weather nerd, as soon as one storm passes there is hardly time to shift your focus to the next one rolling in. If there has been a reprieve in Colorado then watching storms in other parts of the country have been equally entertaining. Major Colorado basins are currently 77% (Arkansas) to 141% (Southwest Basins) of average. As we head into spring snowpack conditions, depending on basin, look similar to WY2017, WY2011, and WY2019. As we get closer and closer to spring the possibility that we will see an above average runoff increases. The forecast for the next month is looking wetter than normal, beyond that it is hard to say what will unfold in terms of spring weather. If the active weather pattern continues then this spring may finally be different than the hot/dry and high dust conditions we have seen the past few years. Currently, dust-in-snow conditions are “minimum” in terms of severity. We have received one moderate event on Feb. 22 here in the San Juans. Seeing how March/April/May are the biggest dust producing months, I anticipate we will be in the “average” category come springtime.
A Brief Monthly Summary
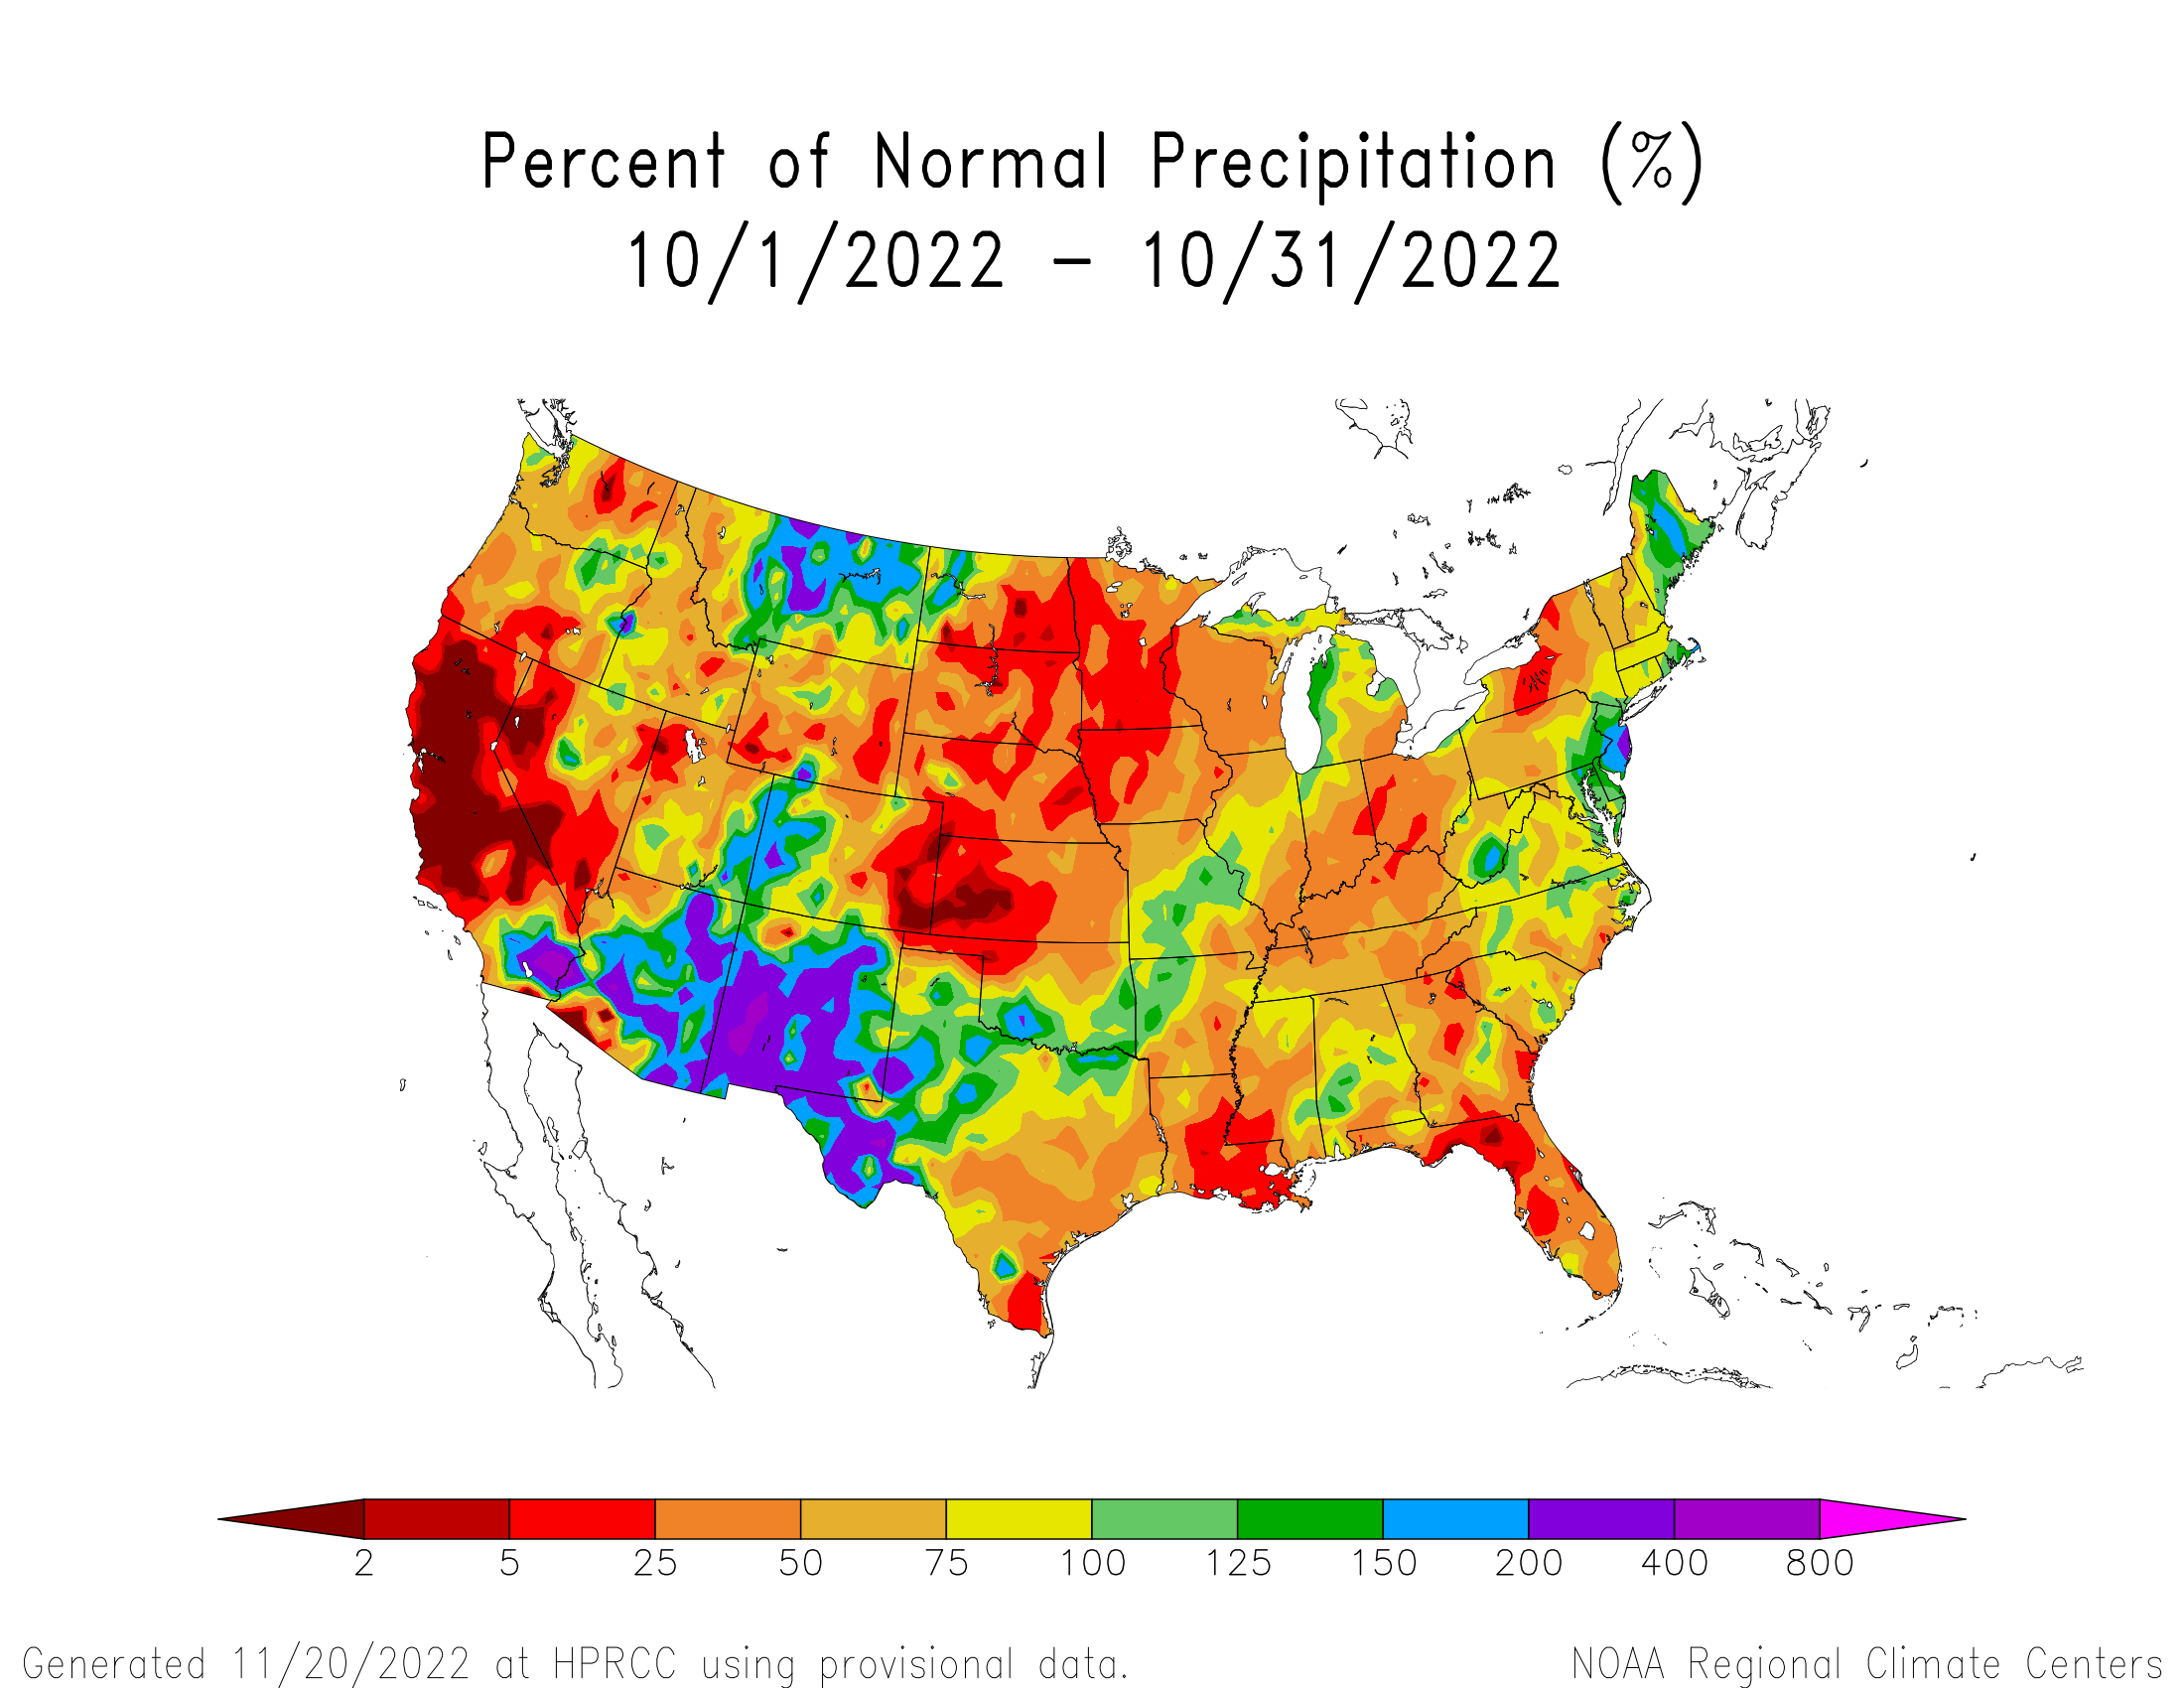
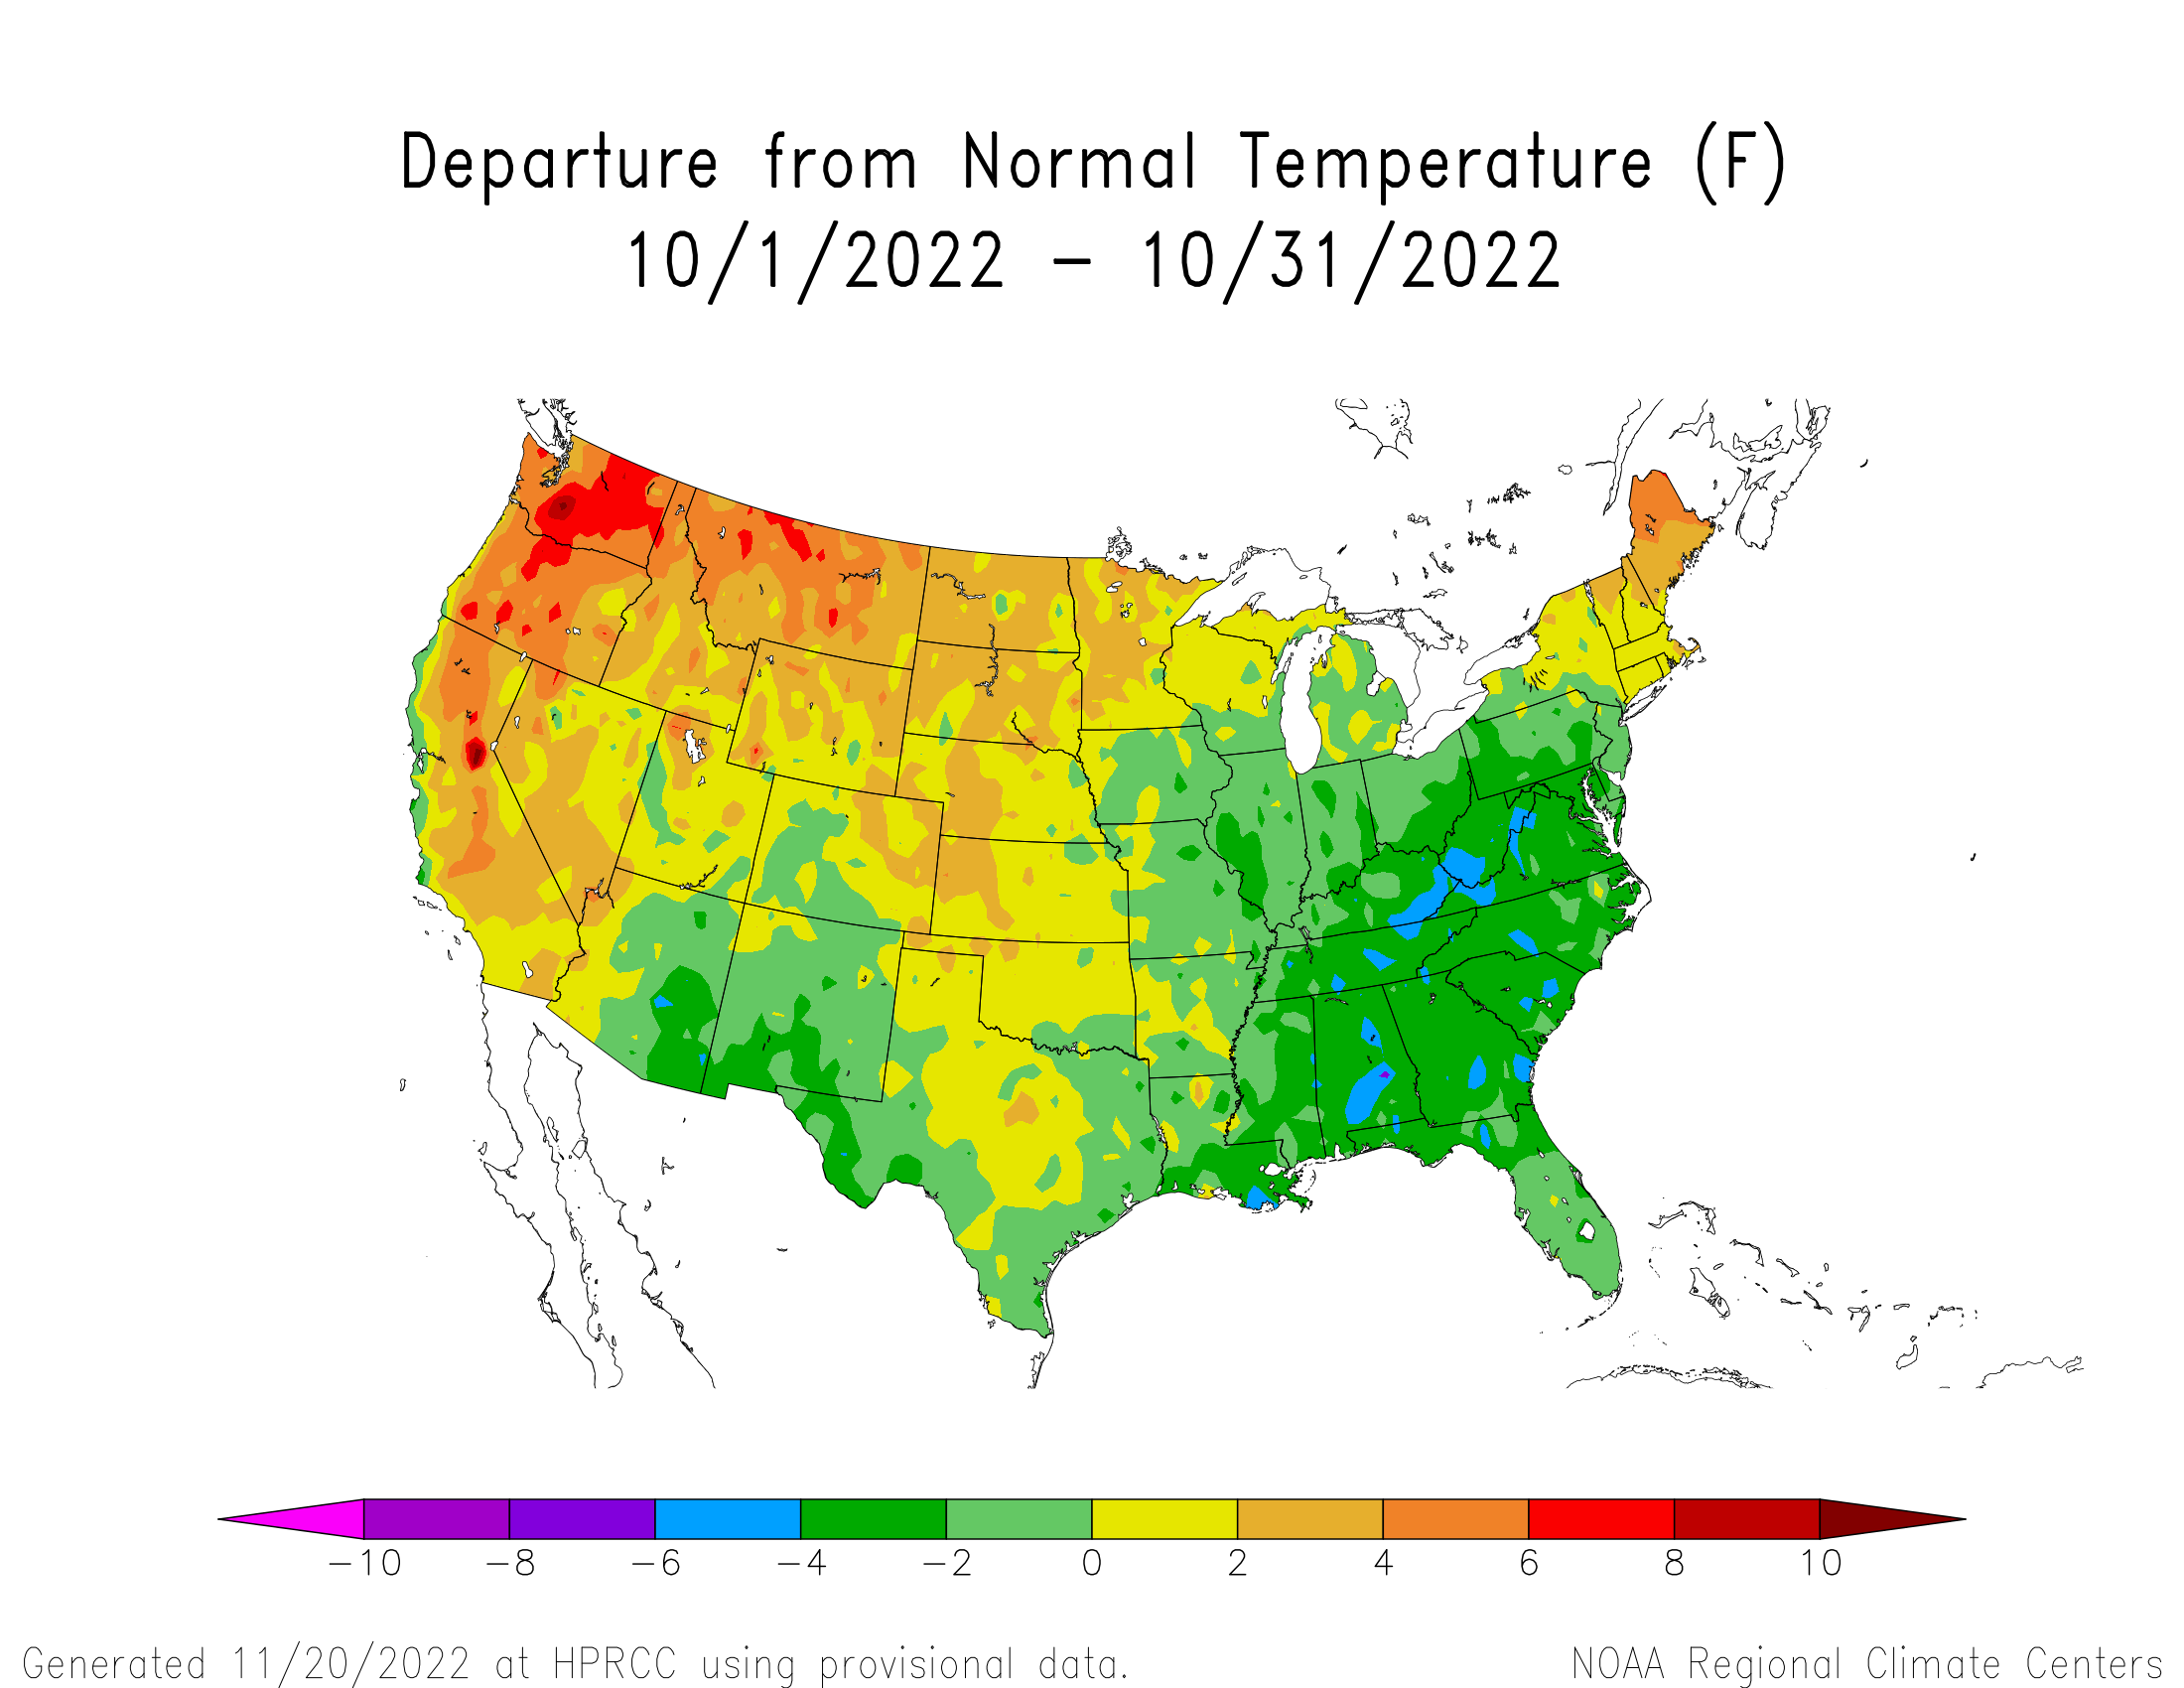
October 2022: We saw multiple winter storms in October, with the snow beginning to stick around the final week. The first storm to jumpstart the season deposited 9.8” on the ground at Swamp Angel by the morning of October 24th. It stayed cold, and the next wave of precipitation a couple days later brought 6.5”. Northwestern Utah saw significant snowfall totals in these same storm events, and precipitation rested much above normal heading into November. A La Niña year is predicted with a high degree of certainty through the winter, which generally indicates a sad year in terms of precipitation for those in the southern parts of Colorado as the Pacific Jet Stream heads north.
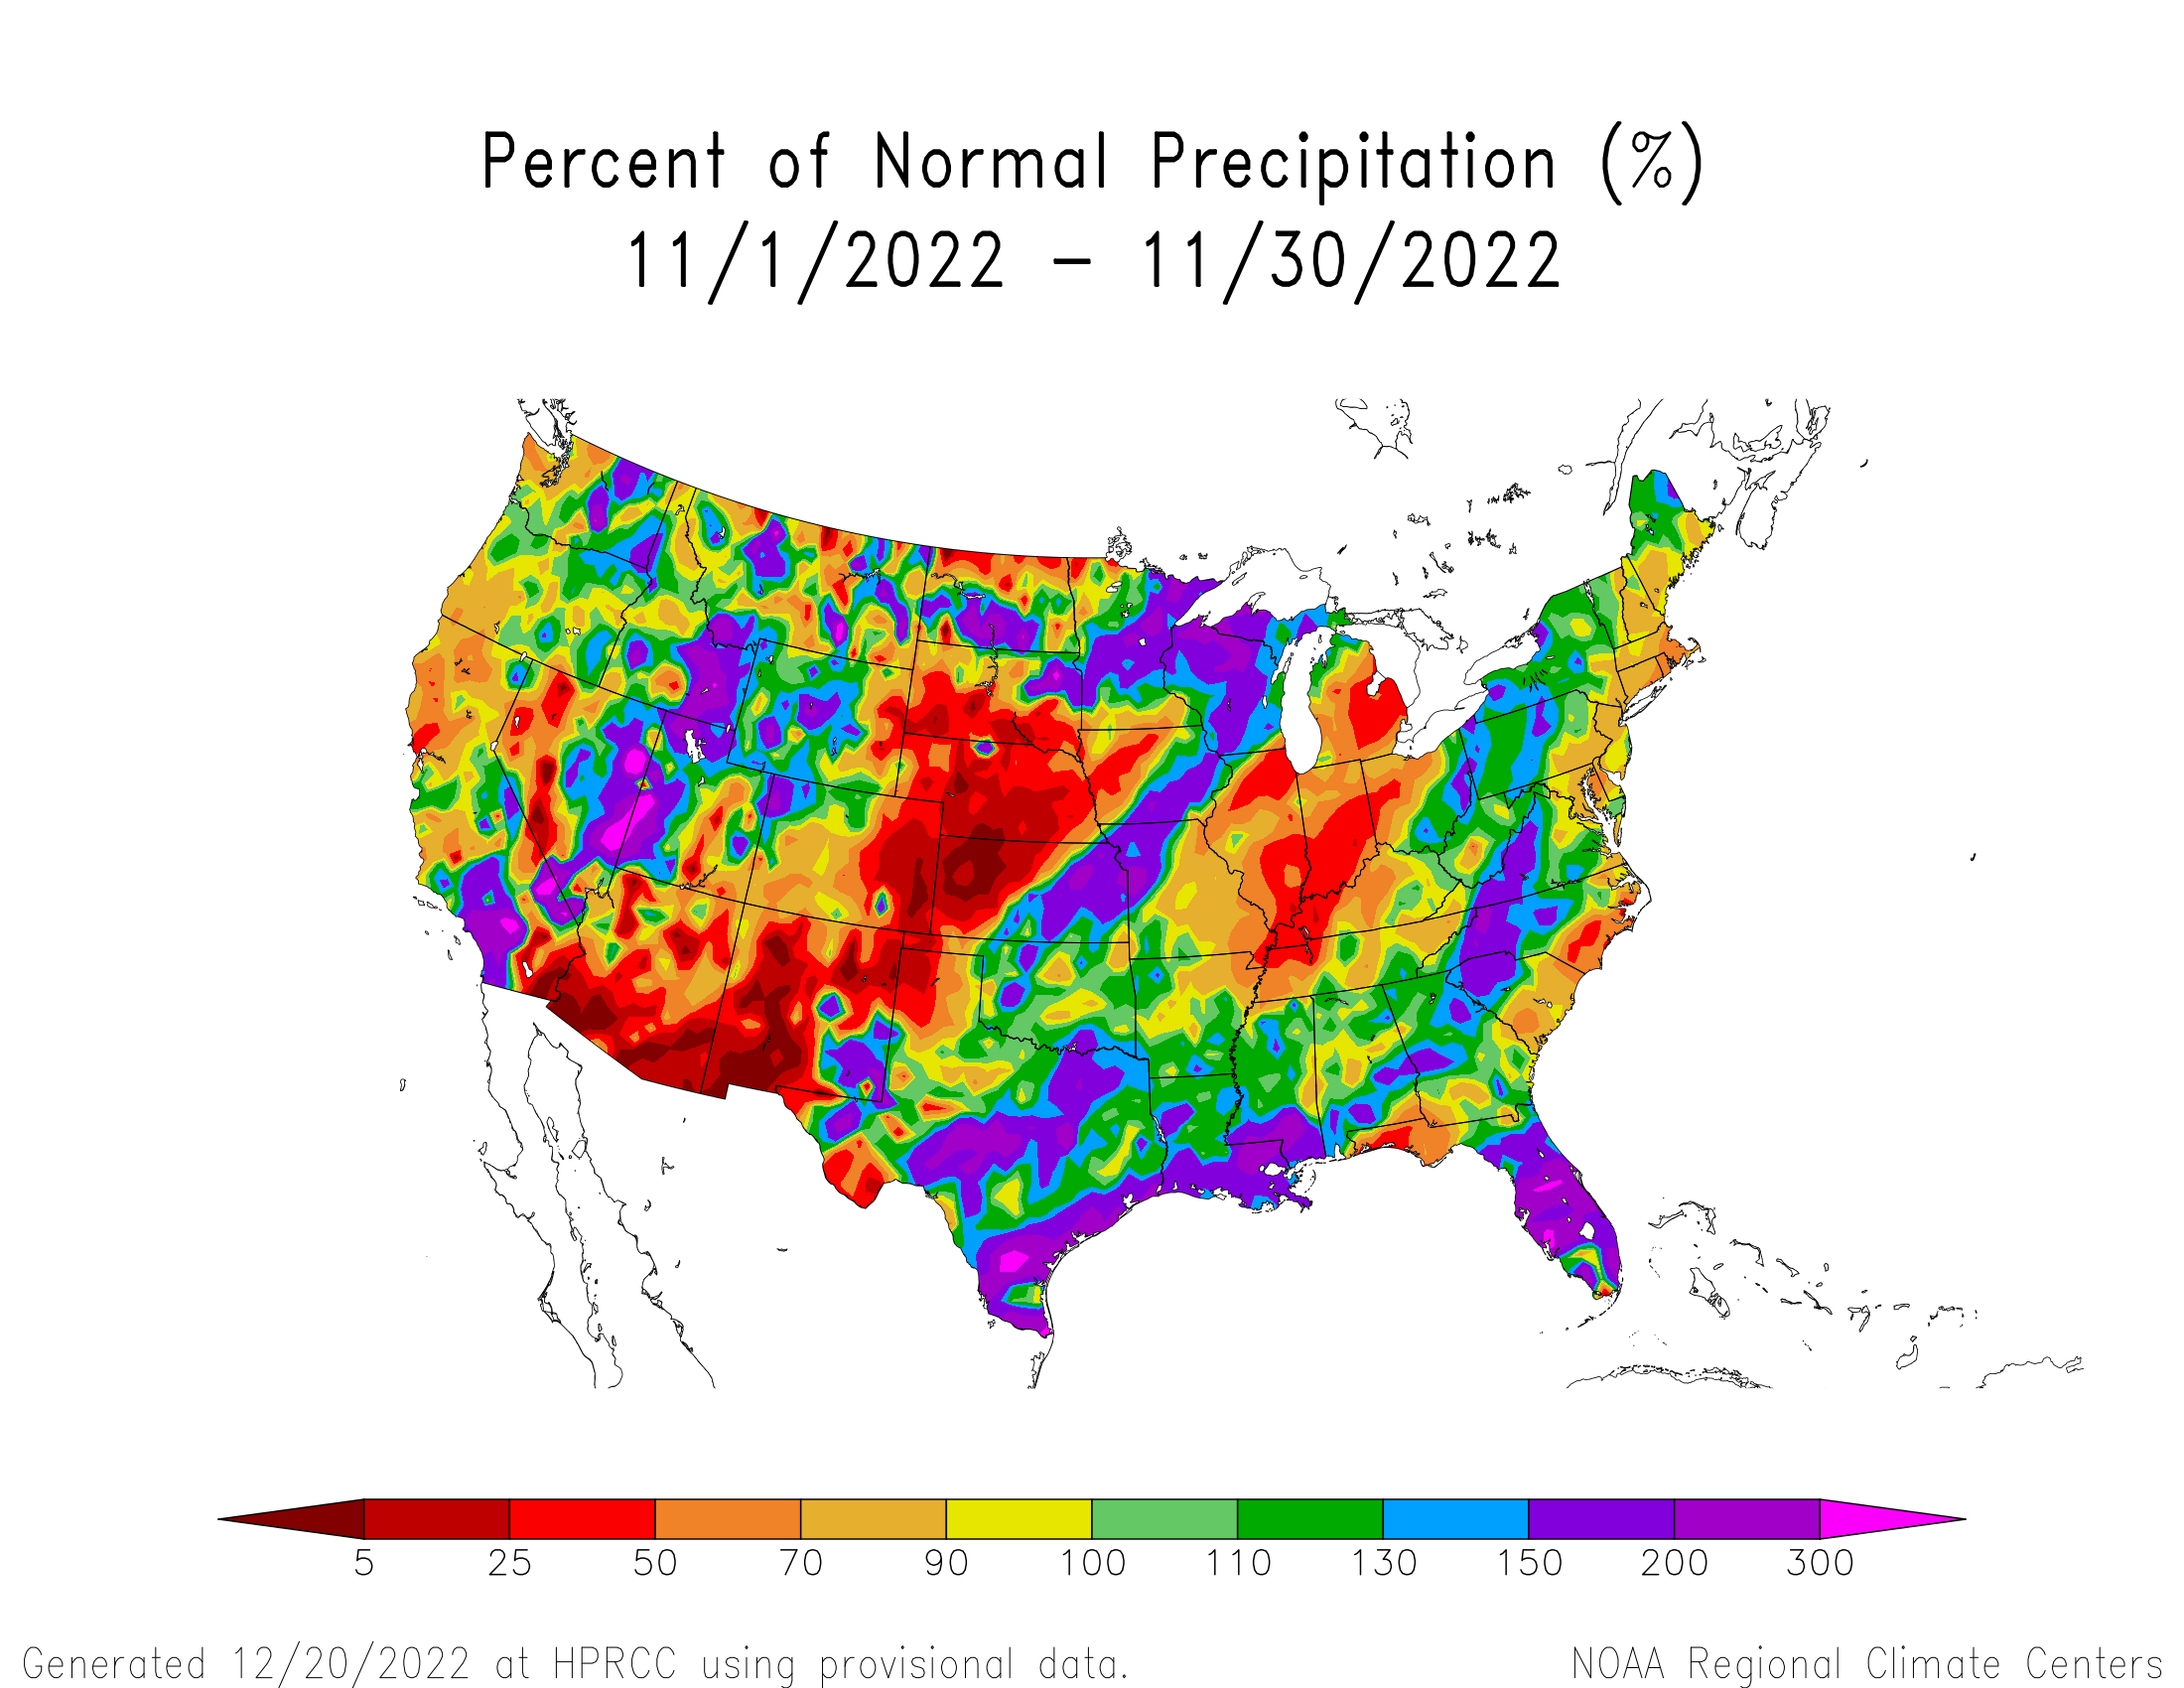
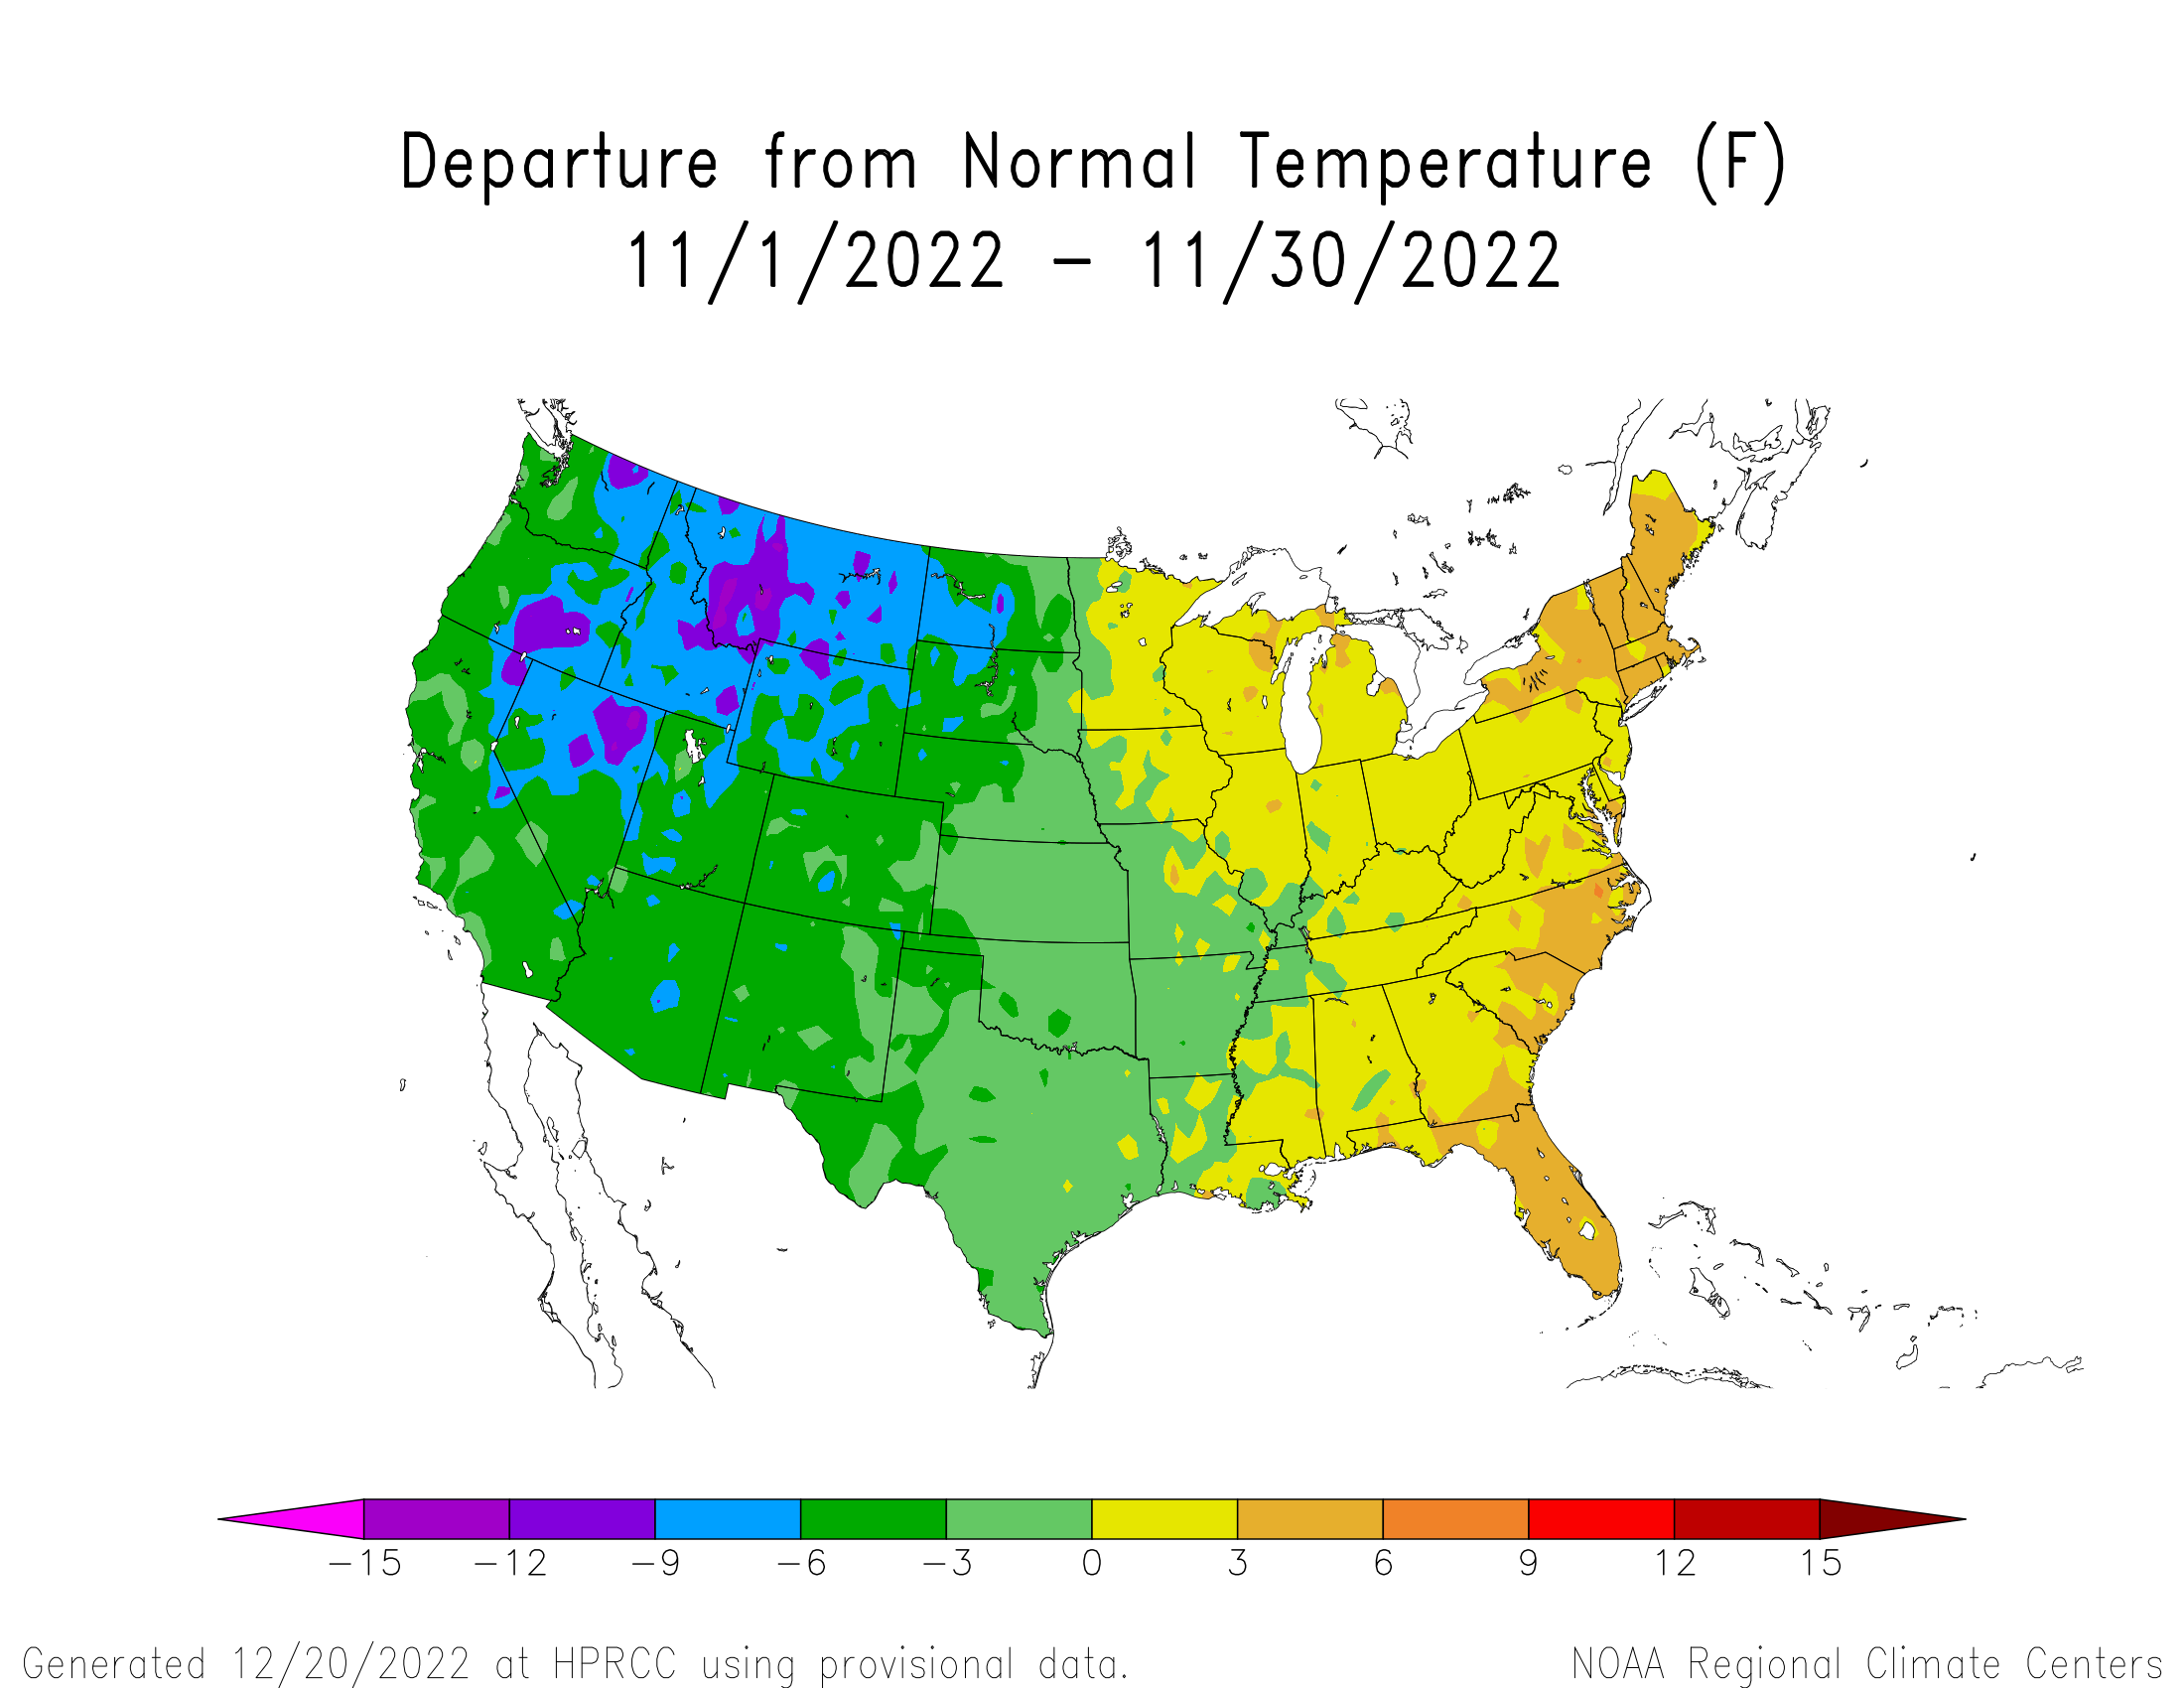
November 2022: Colorado experienced a cold November. Utah’s mountains, and the northwest in general, continued to see above average snowpack. Northwestern Colorado saw a bit above average snowfall, but most of Colorado’s snowpack lingered around normal. Swamp Angel recorded two winter storms in November, one early and one late, bringing the November total snowfall in at 23” or 2.2” of water. Last year’s November at Swamp Angel was dry in comparison, with only one winter storm bringing in a piddling 0.6” precipitation. In worldwide news, NOAA reported that Earth saw its 9th warmest November in the last 143 years, and polar sea ice coverage was 4th lowest on record. In other major water news, the Colorado River Compact is one hundred years old this month.
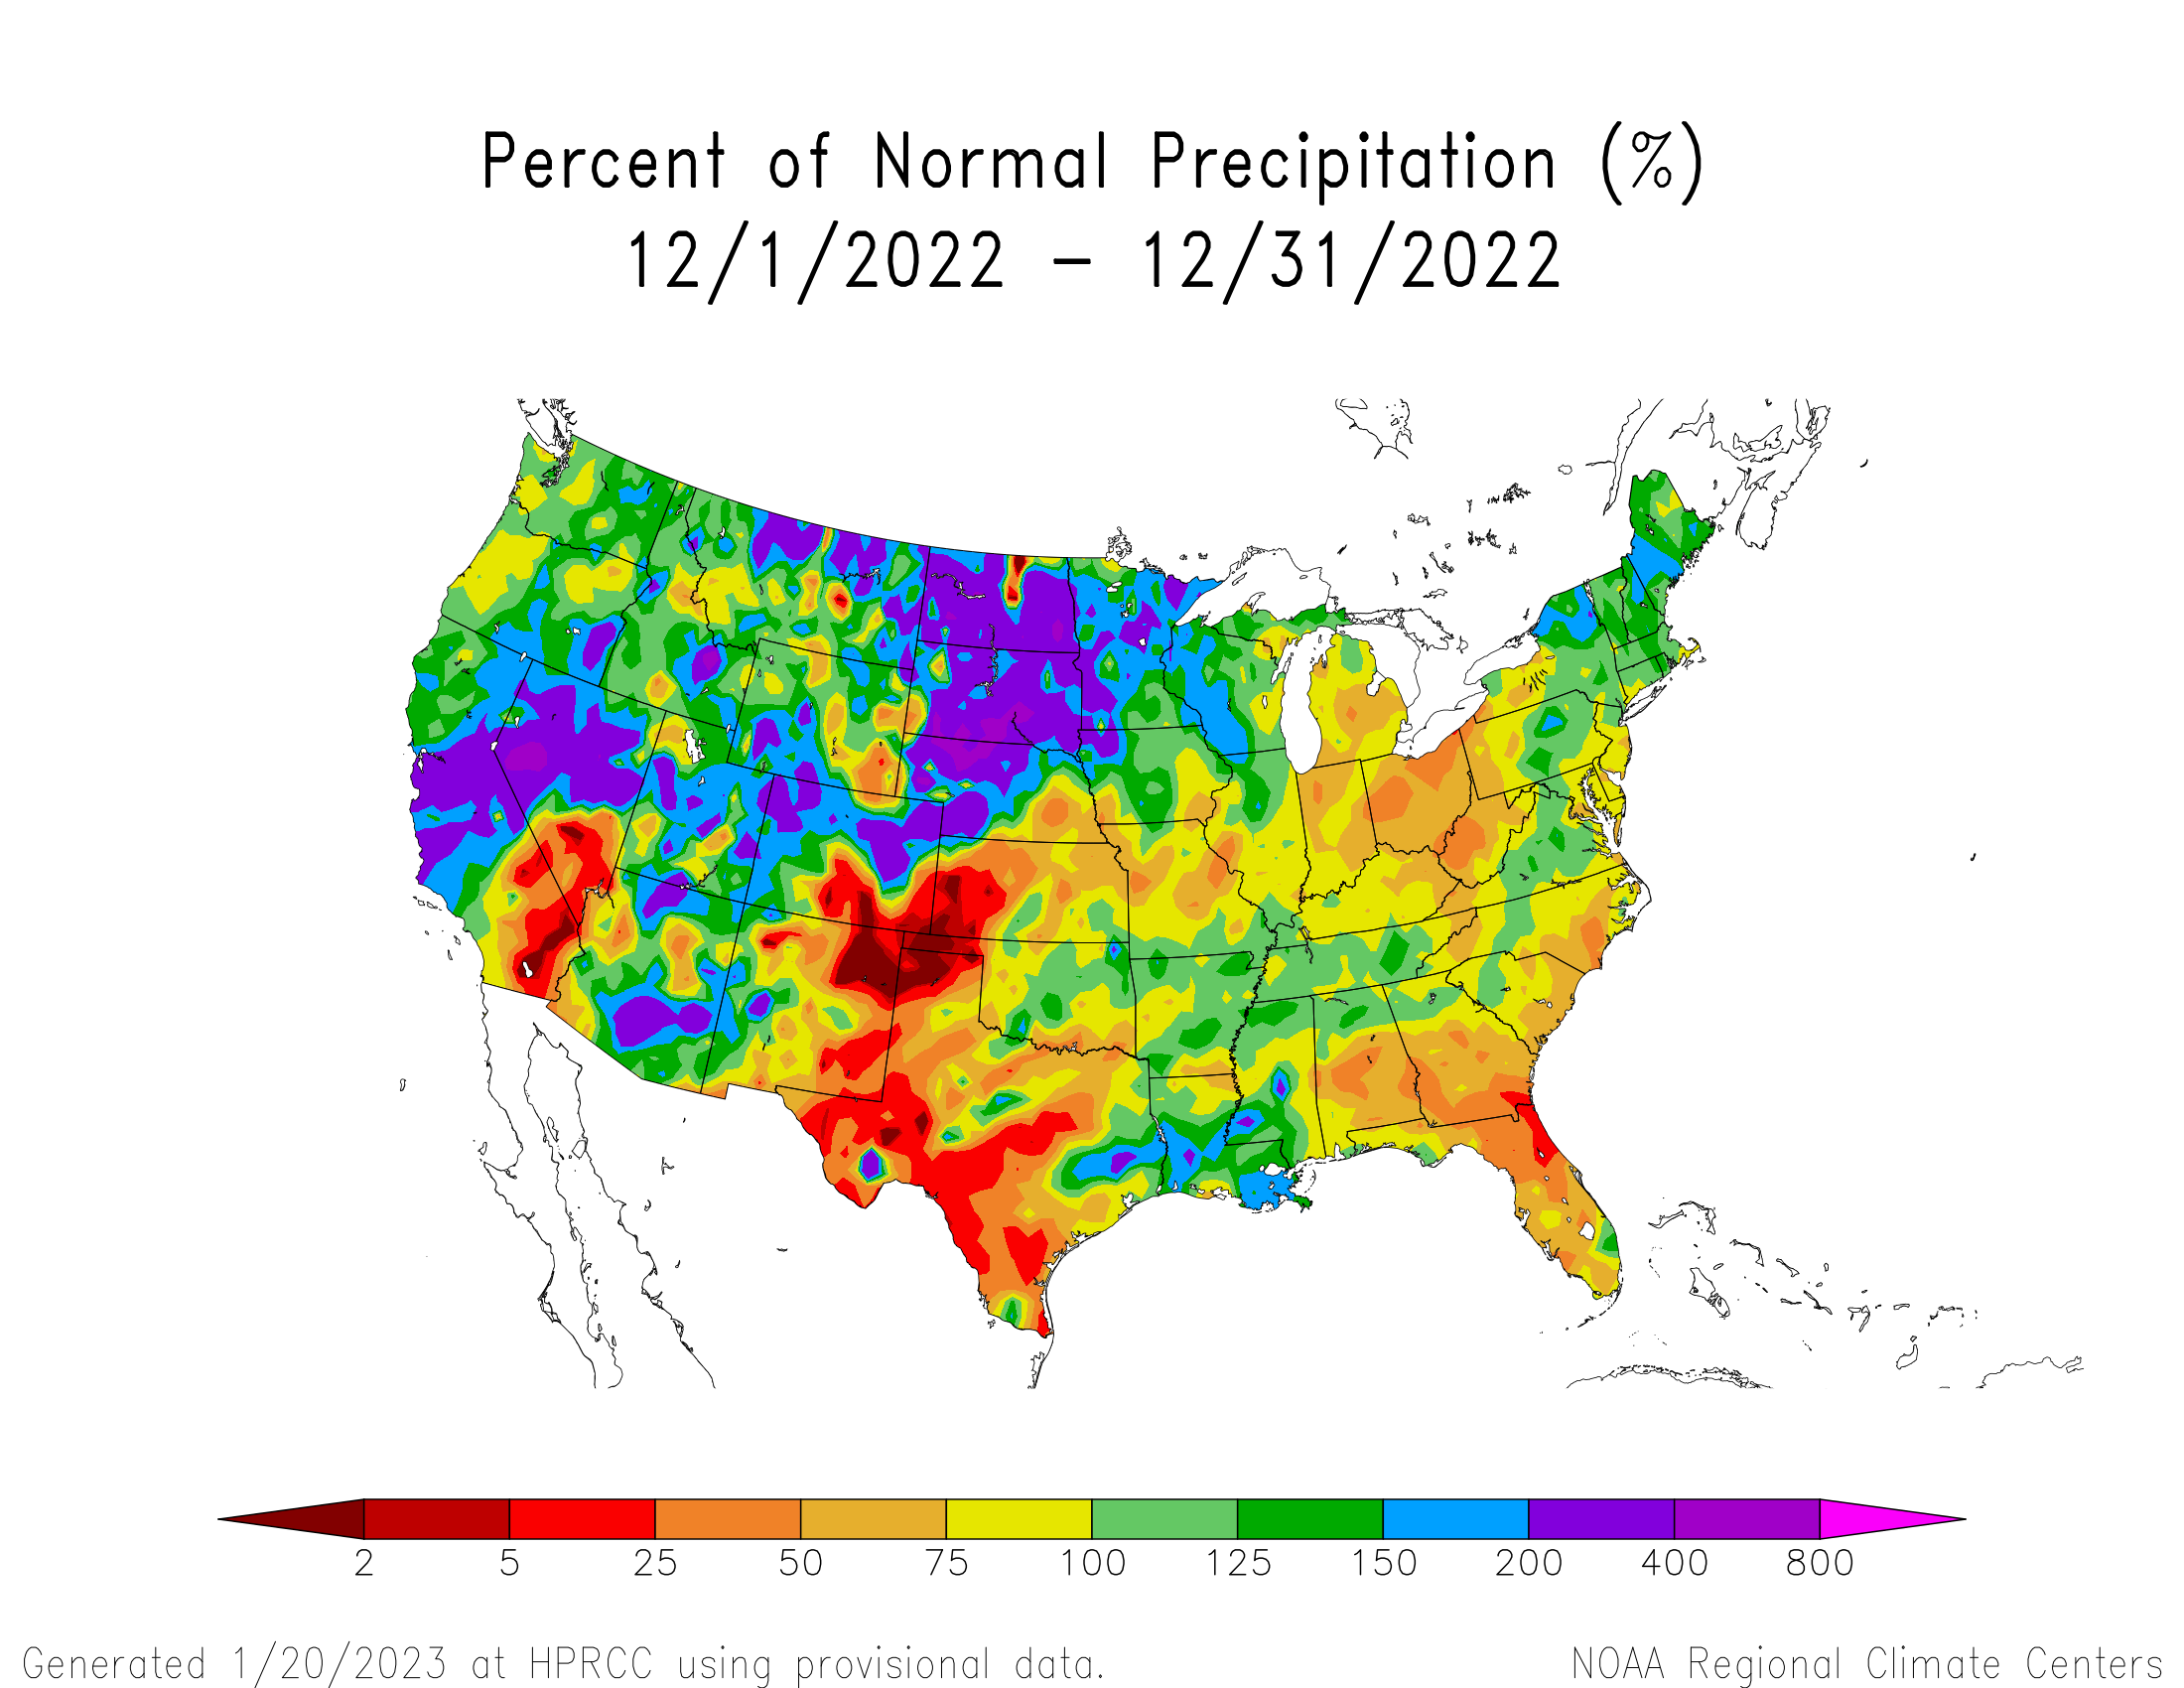
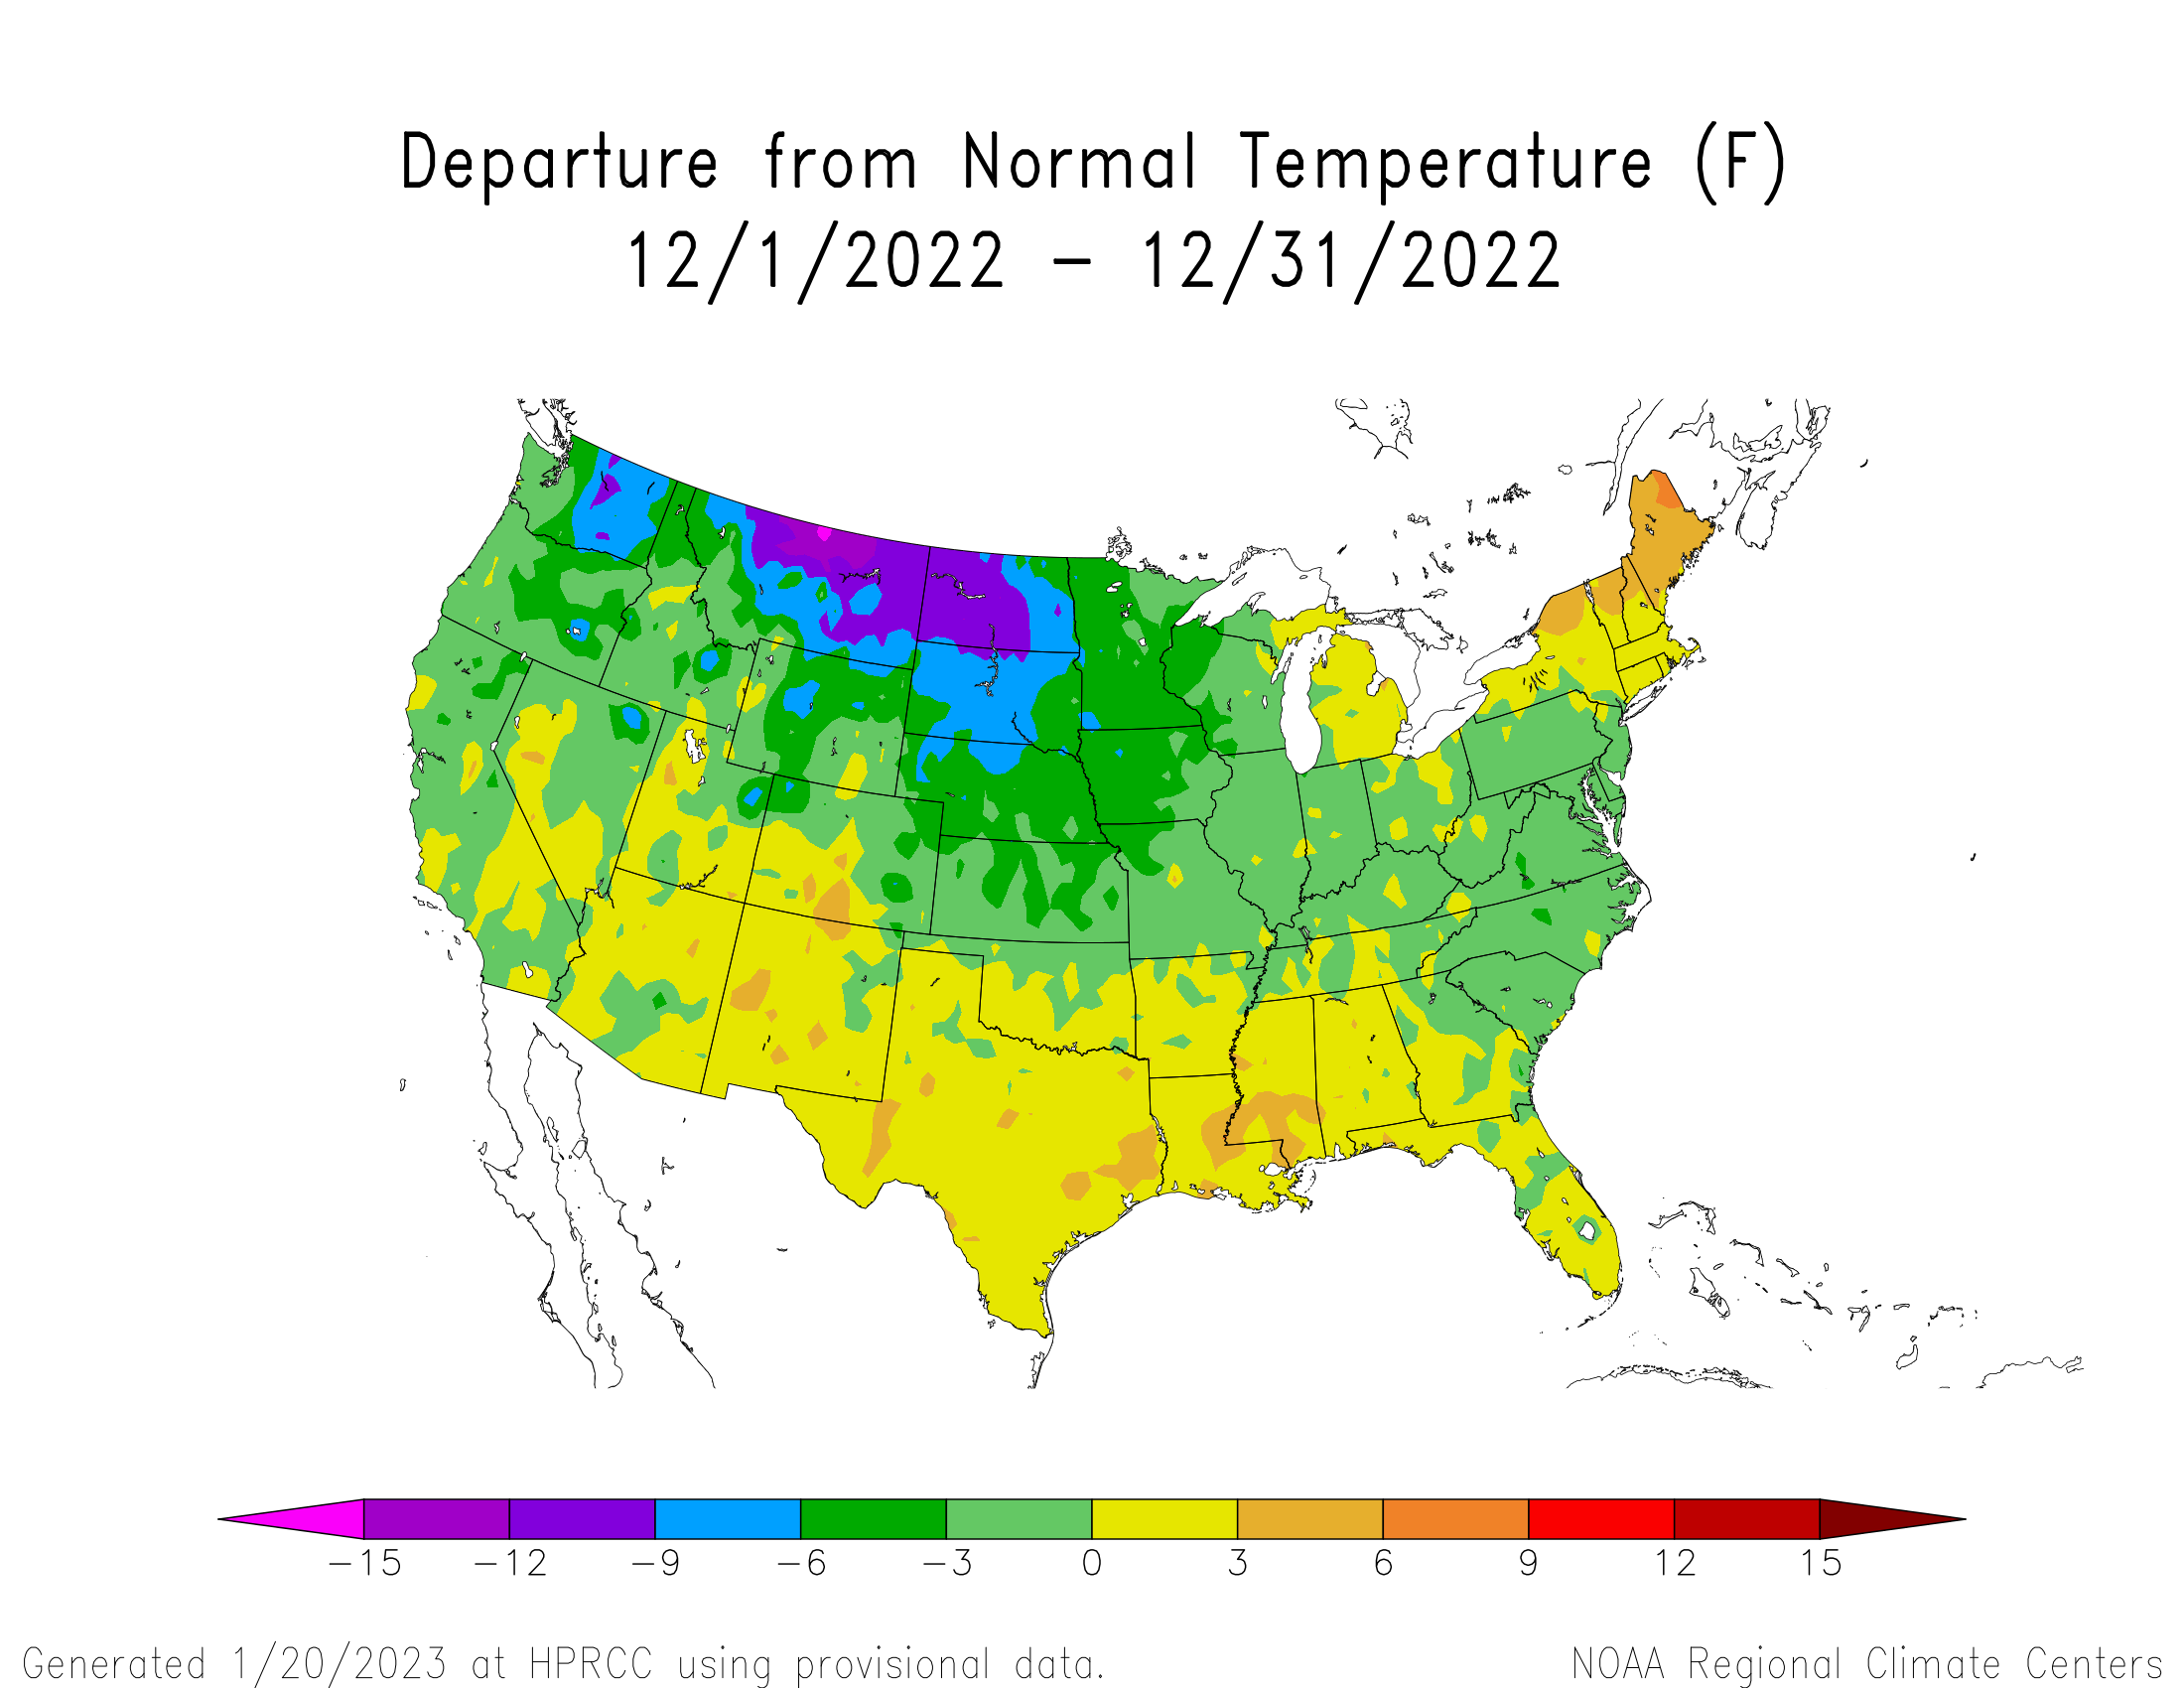
December 2022: Coming off of a cold November, we entered a snowy December characterized by strong atmospheric rivers dropping above average precipitation on much of Colorado, Utah, and western Wyoming. Utah in particular ended the month with 155% of median SWE. The majority of Colorado saw either a one or two category improvement in drought status, or no change. Only a small pocket in south central, the Sangre de Cristo’s, saw worsening drought, and the Rio Grande and Arkansas are struggling to keep up with the median snowpack. Swamp Angel reported four December storms, with total December precipitation of 4.9” and 2.6’ of snow depth gained with 17 days of precipitation. The first storm brought total snowpack accumulation at Swamp Angel to 2.5’, a solid start. The next storm in December favored higher elevations across the country, though with the wind, Senator Beck only accumulated about three inches. A storm nestled in between the holidays, December 27-29, bumping Swamp Angel’s snowpack up a foot and a half, and the final storm in December continued into the New Year, dropping another foot of new snow. Snowpack rests above the median at the beginning of January for the San Juan Mountains. Temperatures remain still slightly below average in northern Colorado, slightly above average in southern Colorado. There is a forecasted switch to neutral ENSO from La Nina, with 60-80 percent certainty due to warming Pacific waters. Potential for an El Nino fall. The NOAA seasonal outlook predicts below average precipitation for January-March
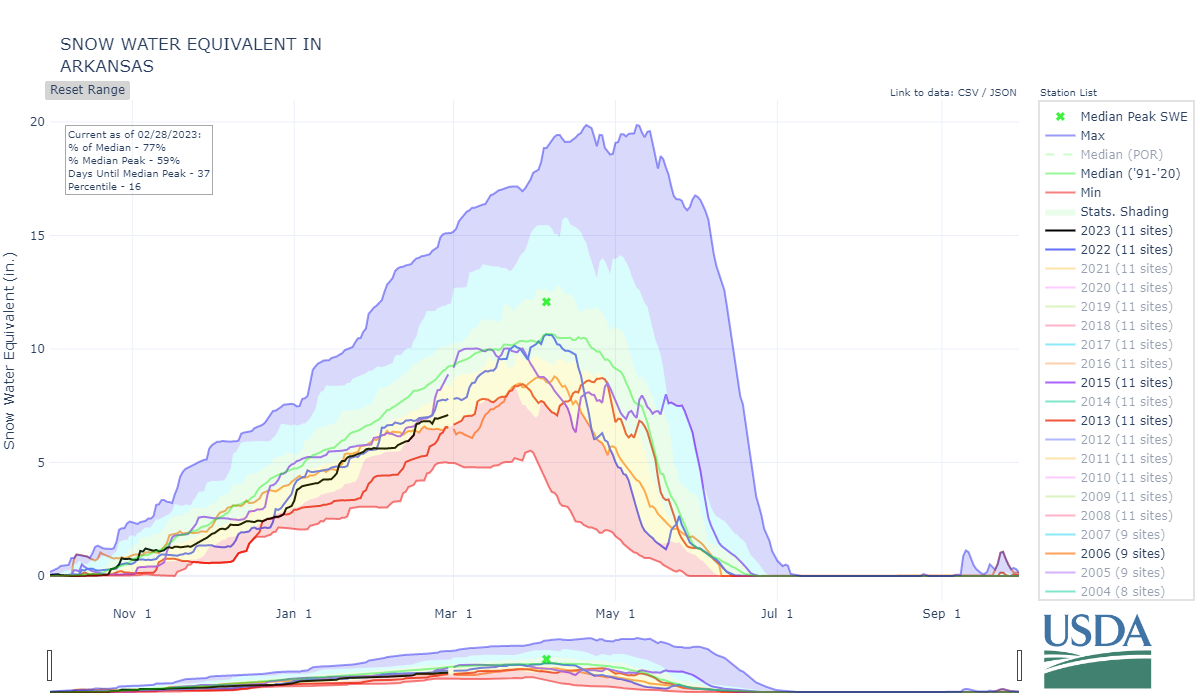
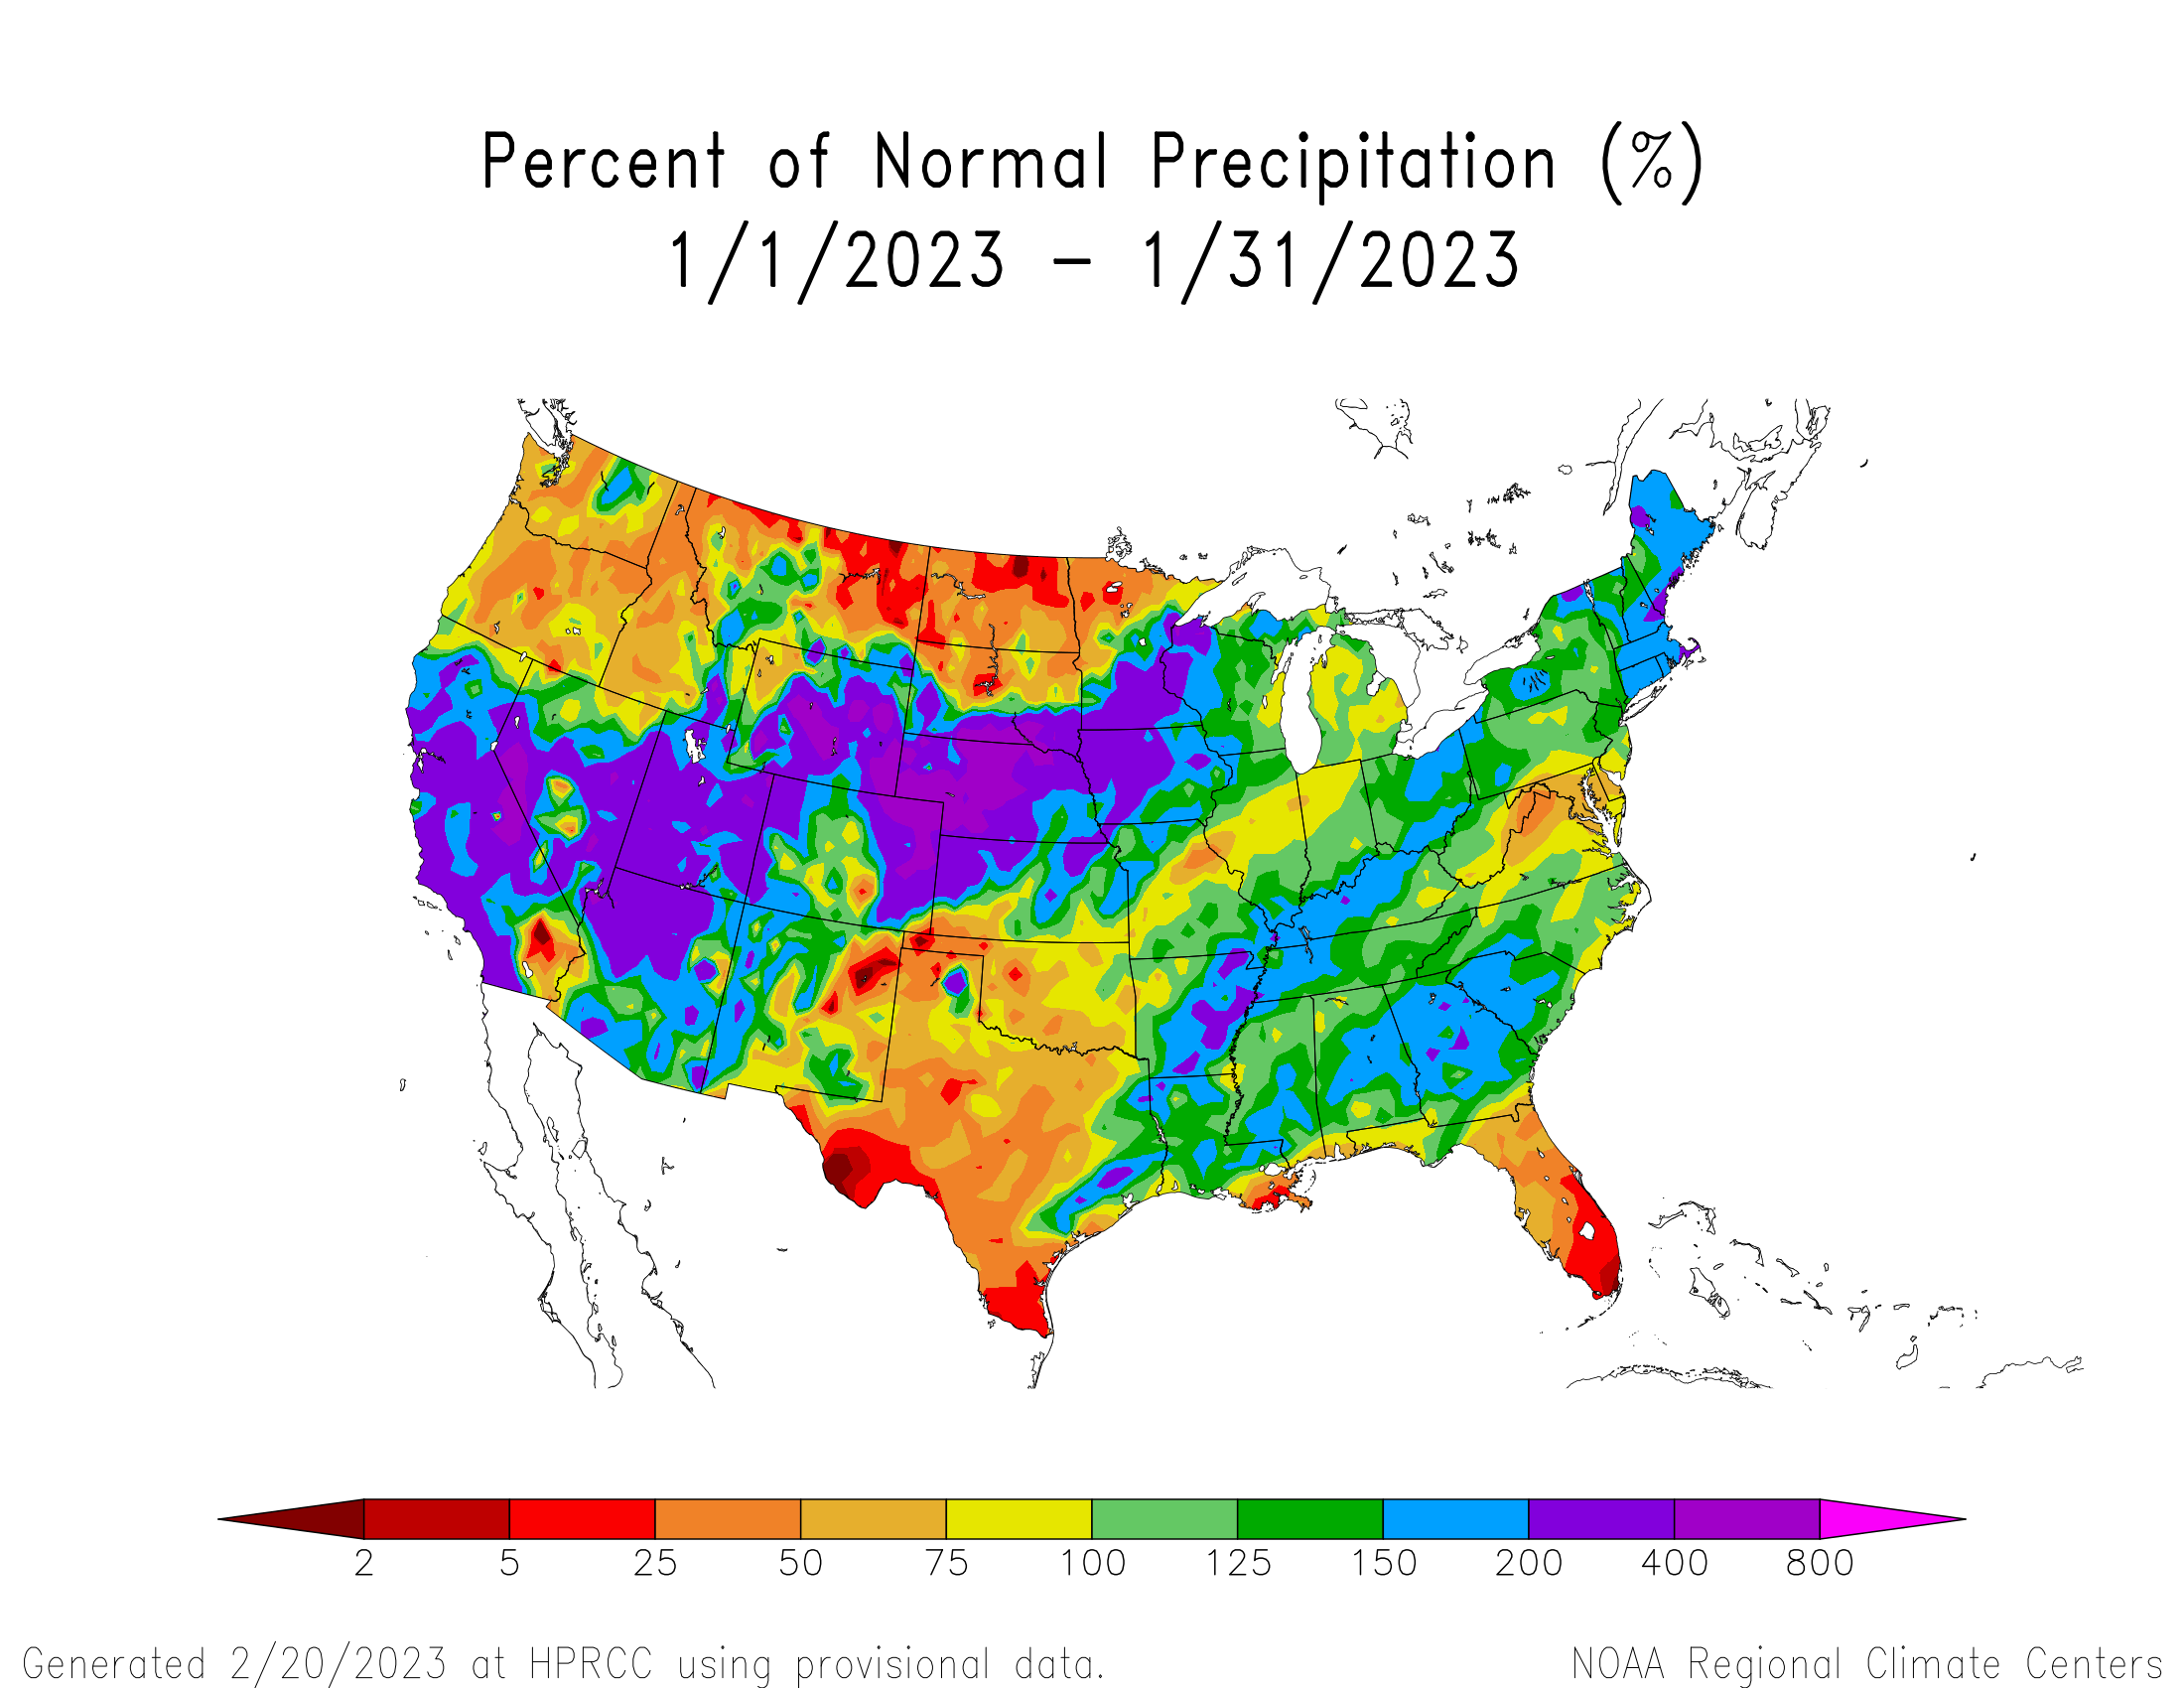
January 2023: It was a big month for much of the intermountain west, ending with above average SWE across the mountains. Utah sits with more snow in the beginning of February than it has in 25 years, making it the snowiest winter since 1997. The state of Colorado had its 10th wettest January on record, ending the month with average SWE for Colorado at 131% of normal. The Arkansas River basin continues to stand out with below average SWE, at 82% of normal.
Swamp Angel had a much bigger January compared to last year; January 2022 recorded zero storms. This year we had four January storms (five if you include the last December storm which rolled through into January 2nd), with 6.7” of total precipitation. 28 out of 31 days we recorded precipitation! Swamp Angel snowpack height neared two meters after the last January storm, at 1.9 m.
January started off snowing, from a 76-hour storm that began on December 30th and lasted through January 2nd. A string of consistent storms carried us through the month. The first January storm added 0.5” of precipitation and half foot of snow. The second, January 9-11, saw a bit more, just over 7” to the Swamp Angel snowpack. A few days later, the third January storm (14th-15th) added a good bit of snow to the Senator Beck study plot, and a little less at Swampy. The last January storm (16th-18th) dropped over a foot of snow and 1.9”of precip, bringing the SASP snowpack close to 2 meters. The last half of January didn’t see any CSAS ‘storms’, ie 12 mm of precipitation with less than 12 hours of a break in precipitation, but continued to add small amounts of water to the snowpack.
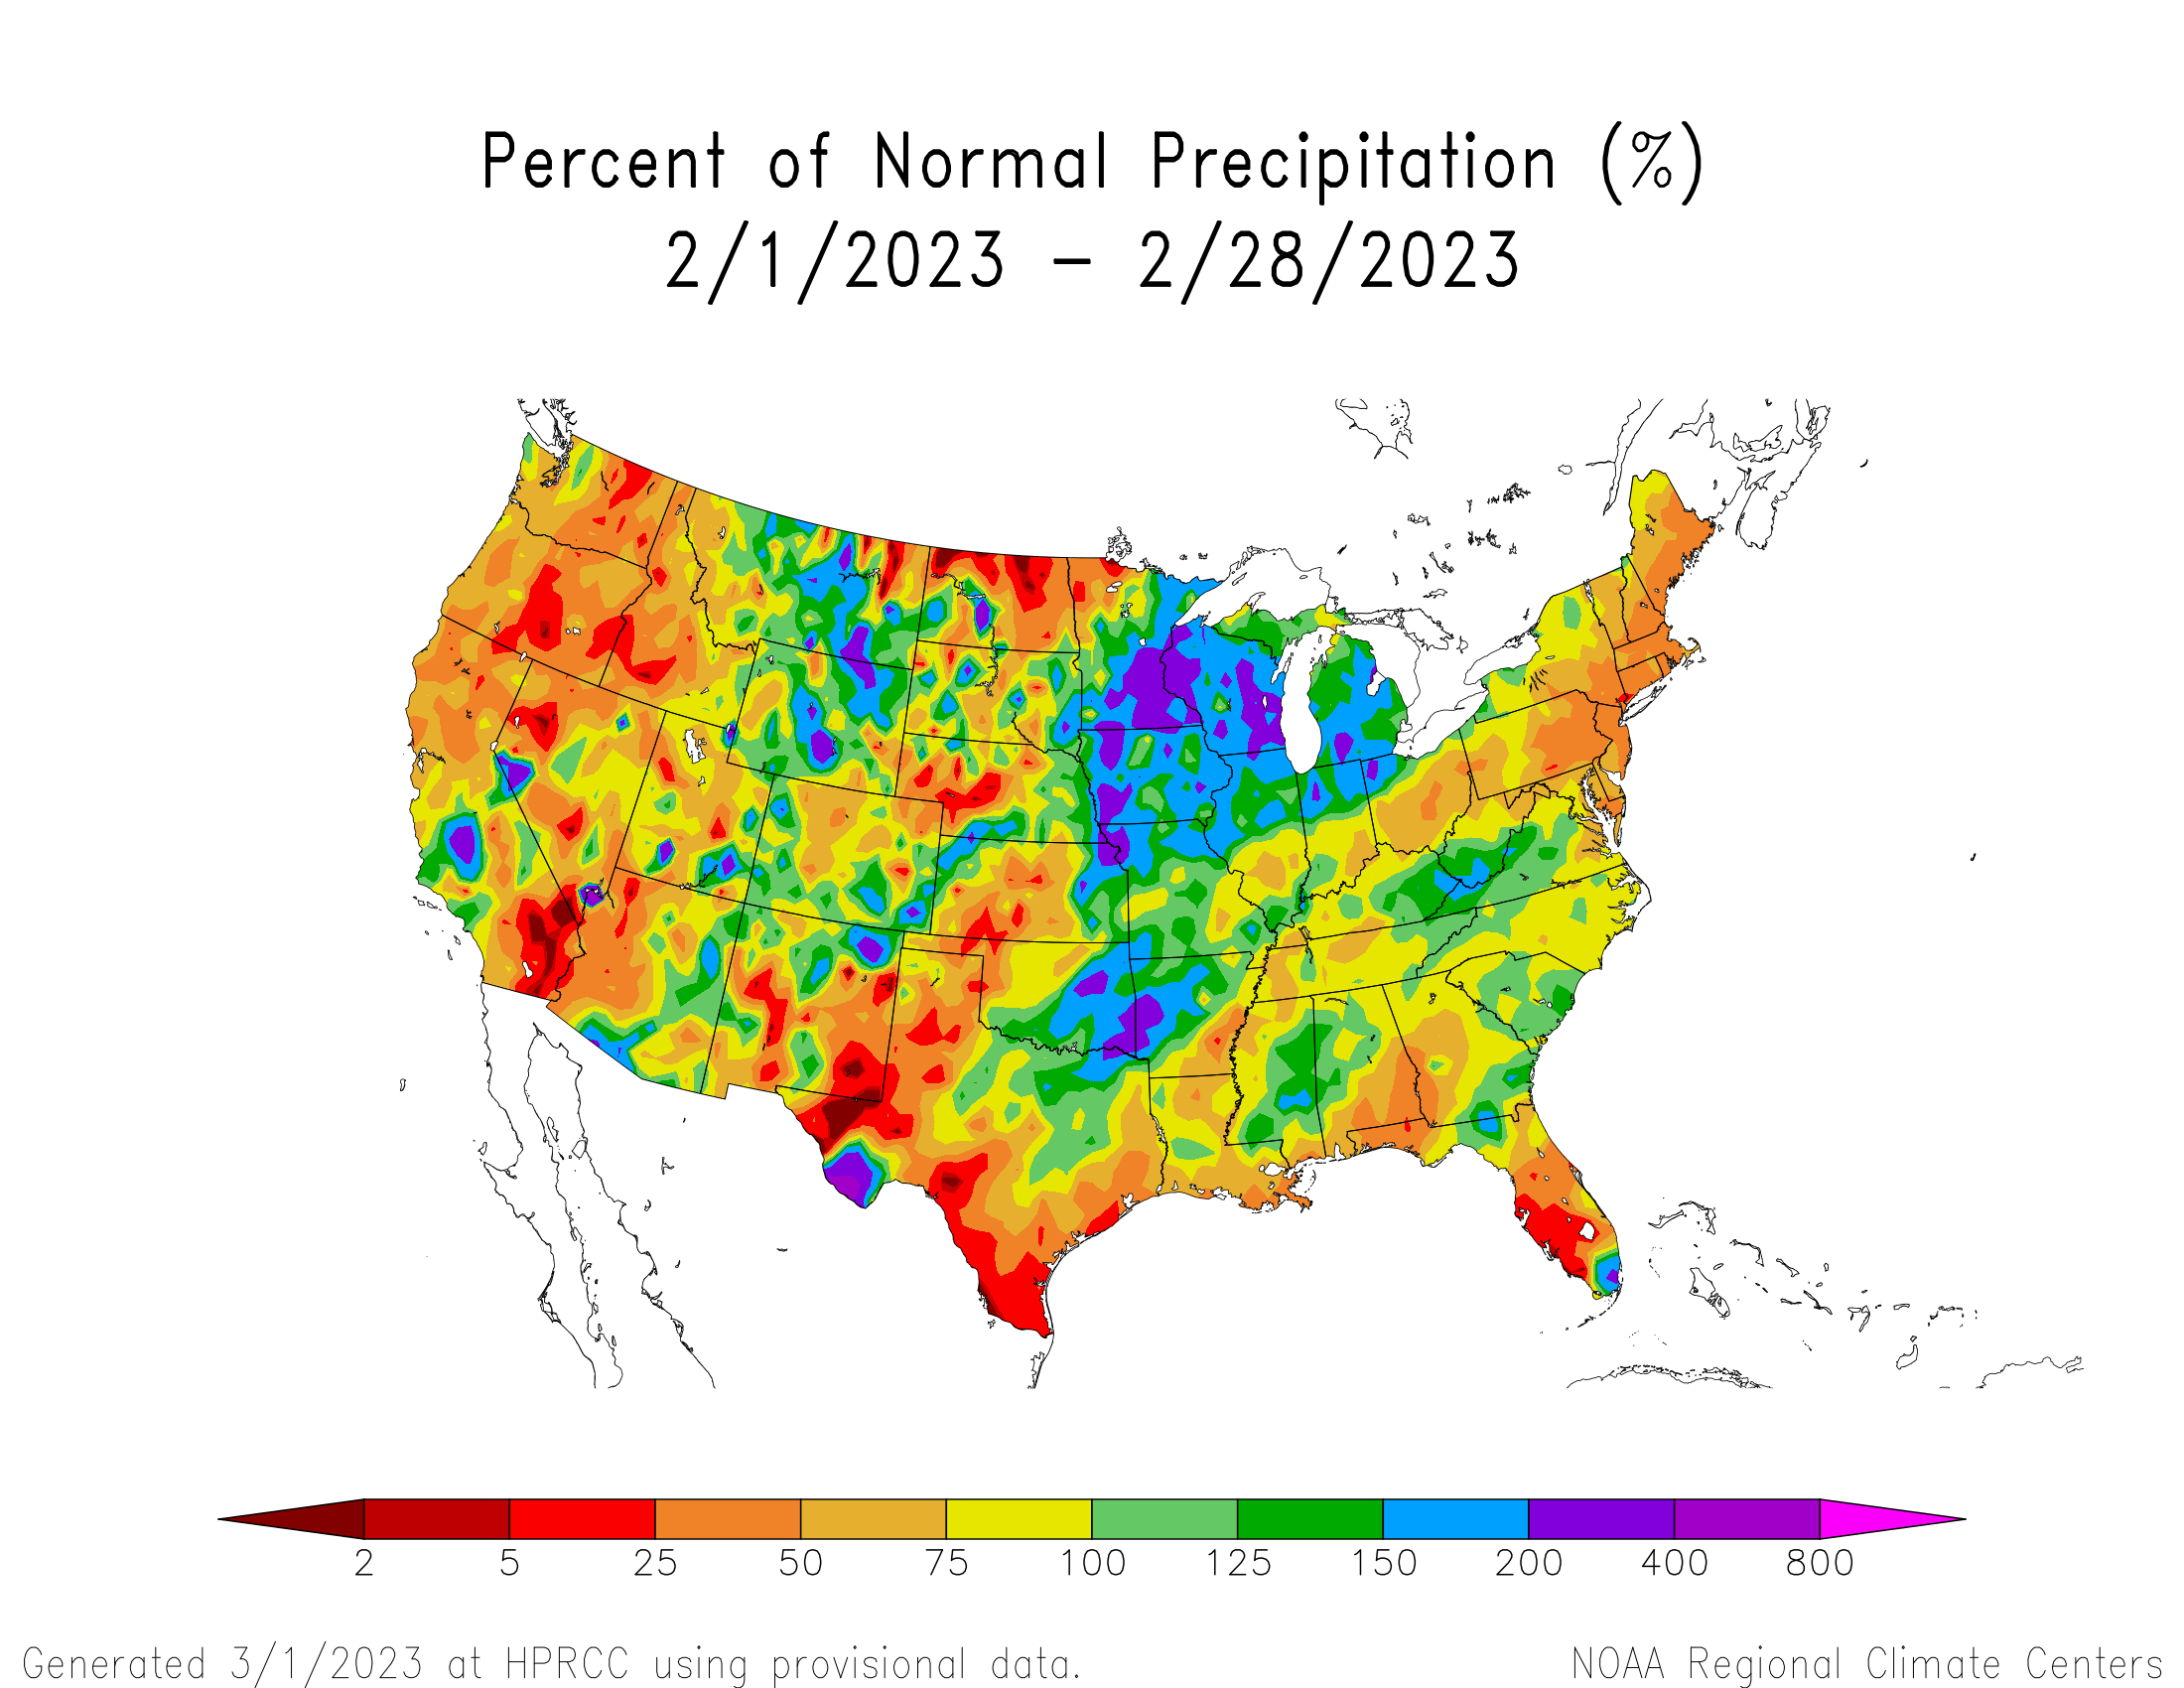
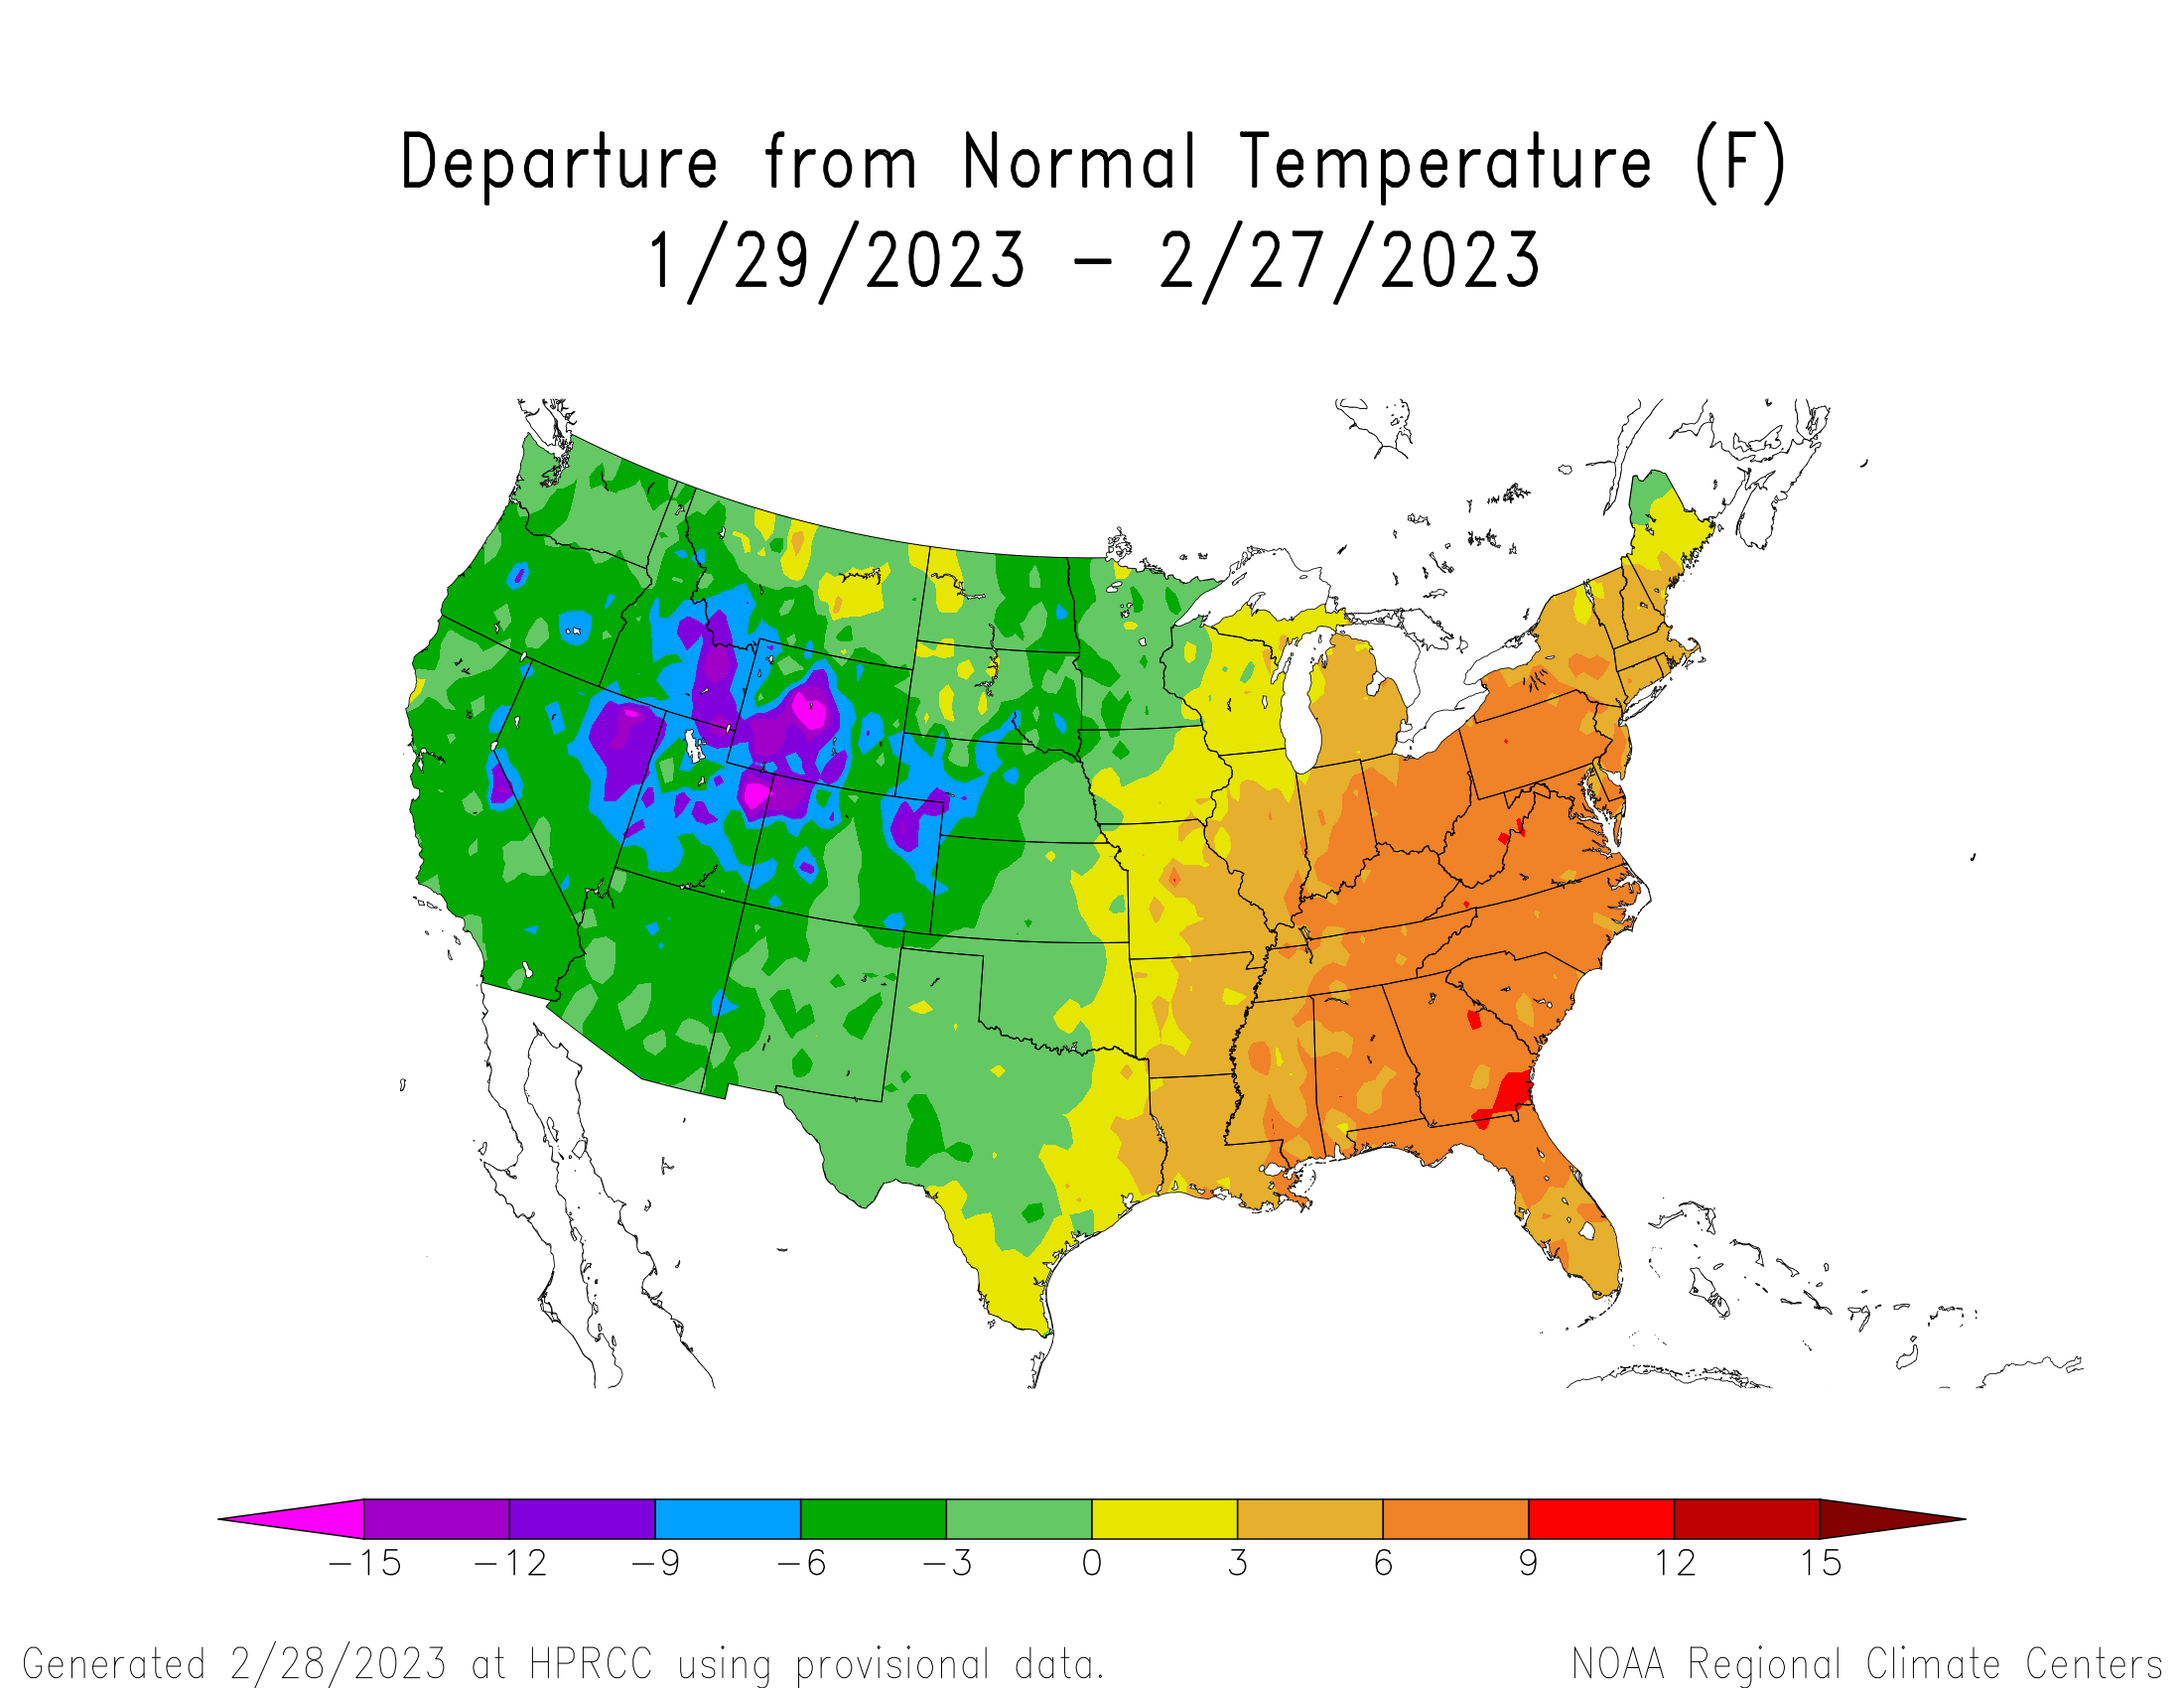
February 2023: February was notably cold and windy, with colder-than-average temperatures statewide. Above average SWE conditions have held steady. The exception for above average SWE is the Arkansas River basin which rests at 78%, down from 82% at the end of January. Notably, the southern mountains were hit with significant snowfall; the Upper Pecos river basin in New Mexico went from 76% of the median to 109% of median (1991-2020) within the month.
Swamp Angel’s daily average air temperature at our lower sensor (3.4 m) stayed below freezing all month. We recorded two storms after an early February dry spell, February 13-15th and February 21-24th, depositing 3.7” precip out of the monthly total of 4.0” in 9 days of precipitation. Putney Study Plot recorded a max wind gust of the month at 105 mph during our second February storm, which brought our first notable dust event. A review of winter storms to date can be viewed on the storm reports page on our snowstudies.org website.
With a La Nina, why has it been wet in the southwest? Read the drought.gov article and find out.
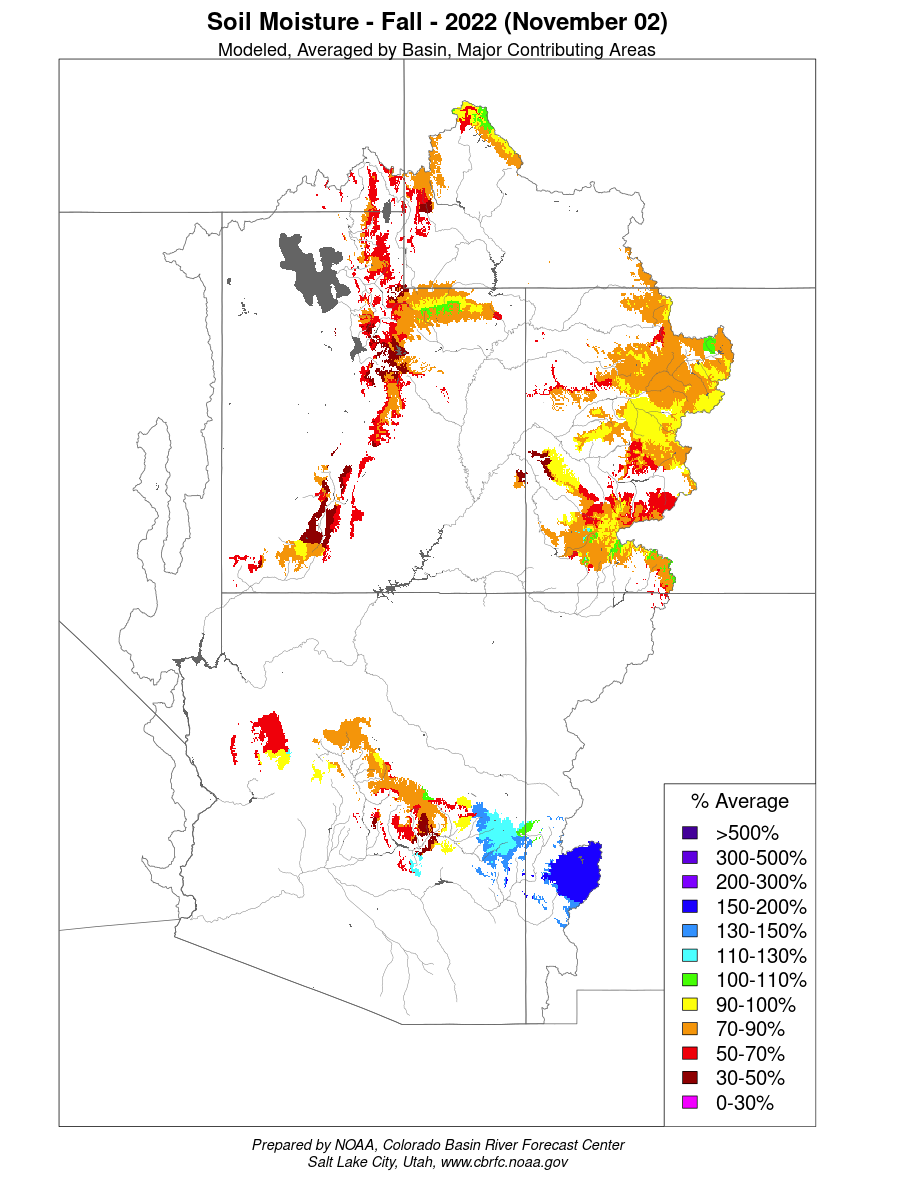
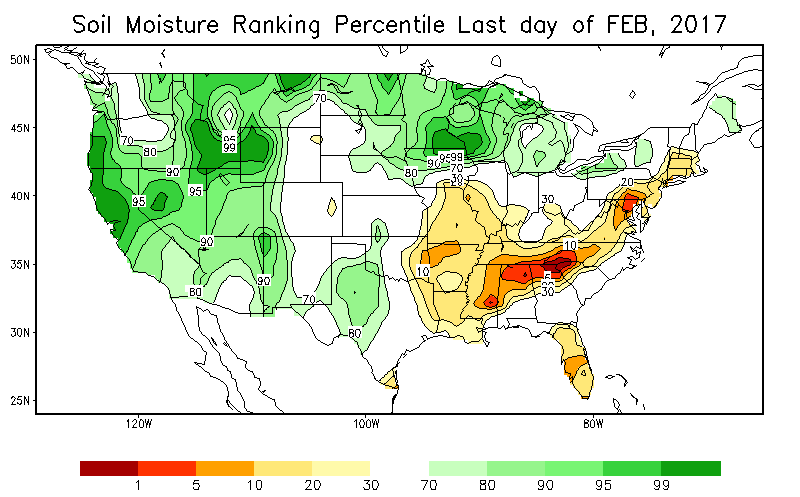
Below: Soil moisture map for the CRB. Going into winter modeled soil moisture is much improved compared to the last few years.
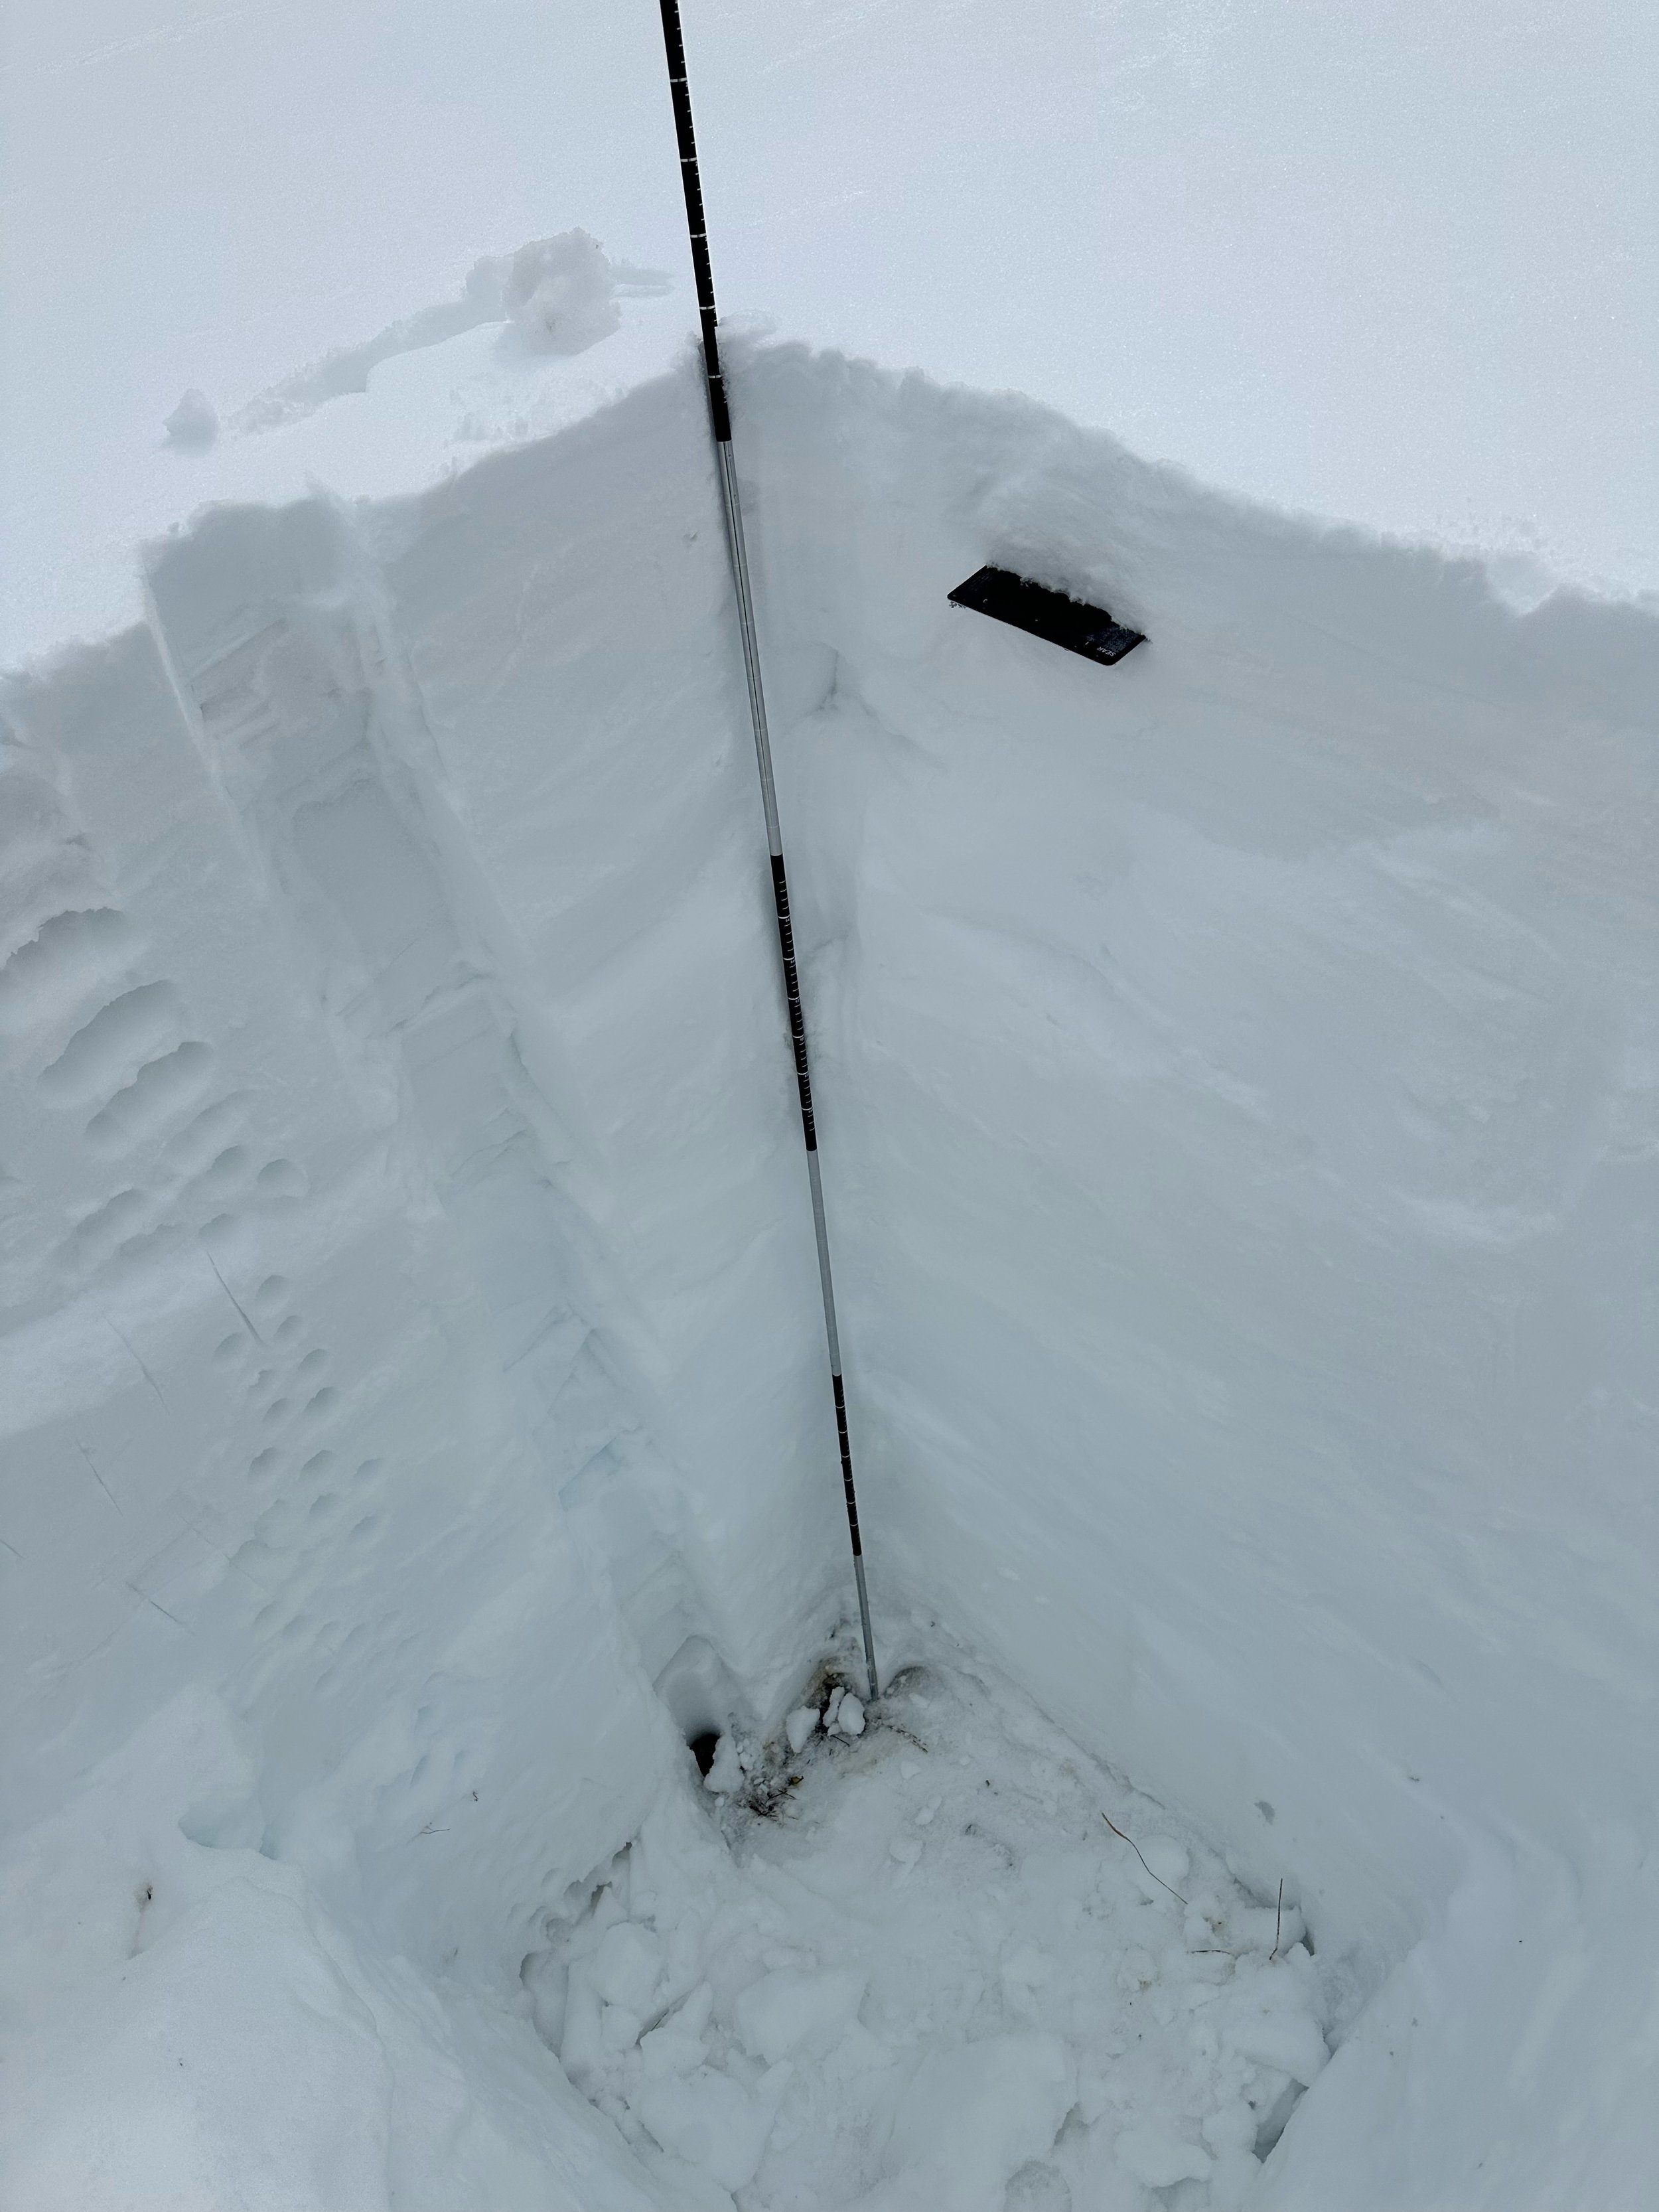
Below: Swamp Angel study plot in Senator Beck Study Basin on Feb 25. The black card indicates where the dust layer #2 is located.
Current DUST-ON-SNOW Conditions AND DERC CLASSIFICATION
Over the course of our 2005-2023 period of rigorous observations, March 1st has marked the beginning of the heart of “dust-on-snow season” for the Colorado Mountains (see the CODOS Dust Log chart of dust events by month). So far for WY2023 at Senator Beck Basin, the primary ‘sentry site’ for the CODOS program, we observed 2 dust events. The first event (dust event D1) occurred early season, likely in November as this layer is located 10 cm above the ground. This medium severity layer is inconsequential to snowmelt this spring since it sits near/at the bottom of the snowpack
The second dust (D2) event was mild-to-medium in severity occurring February 22. The winds were so high and variable (gusts up to 106 mph) the distribution of this dust is likely highly variable across the landscape. With the snowfall that followed the dust event, plus what has fallen since, D2 is currently at least ~10” below the snow surface. With only the one notable dust event we are still in the “minimum” category in terms of overall dust severity in southern Colorado and very likely farther north. The CODOS team will do our first statewide dust assessment of the season around mid-March.
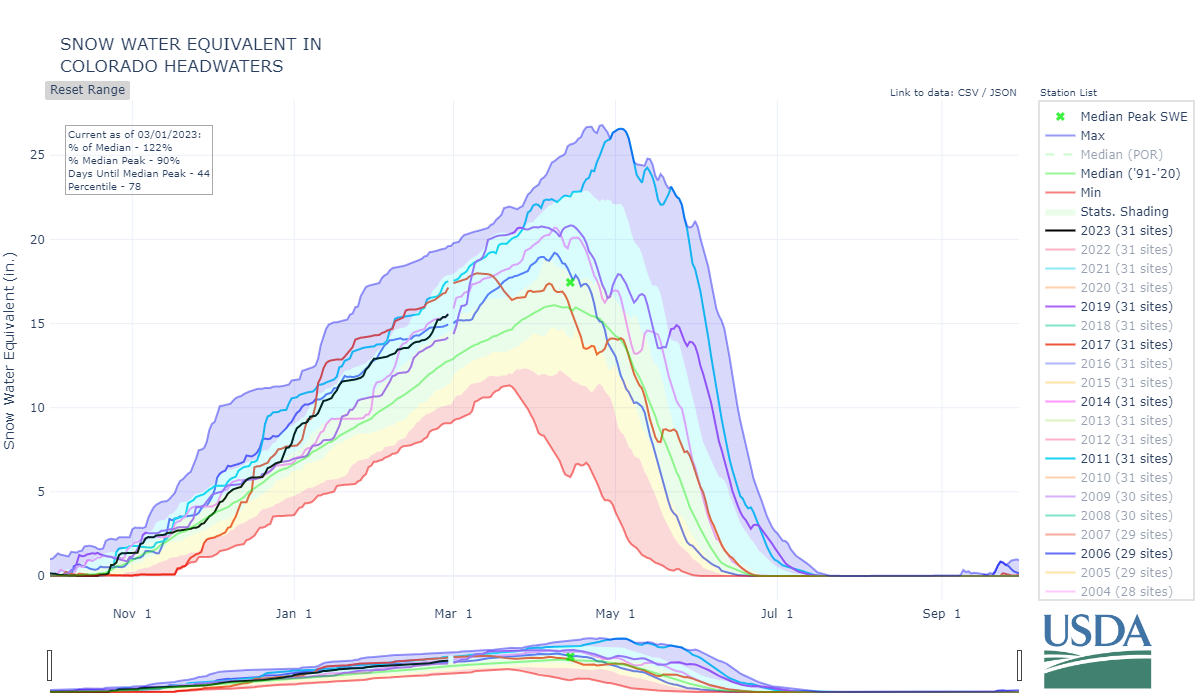
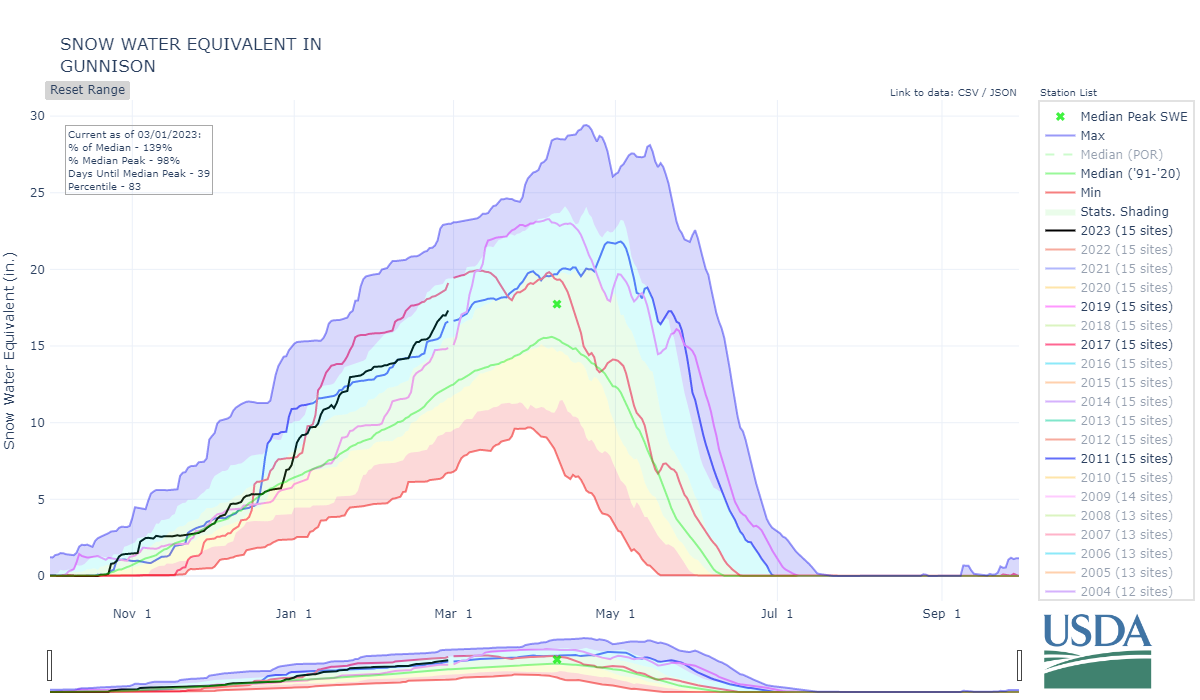
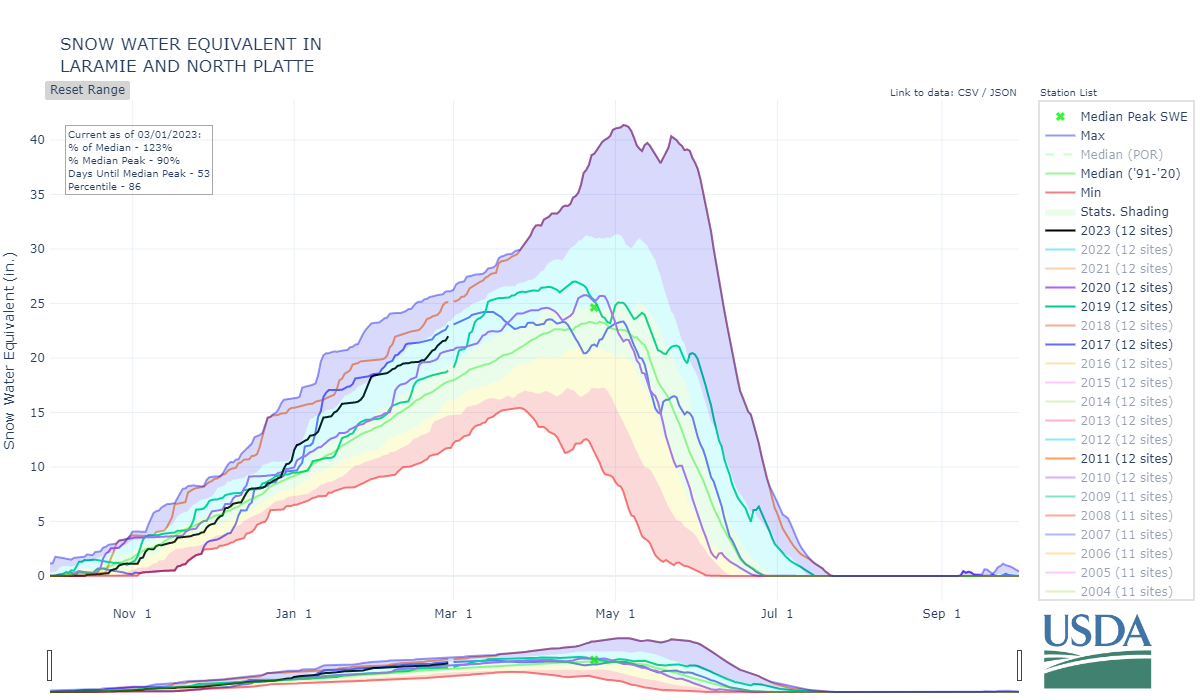
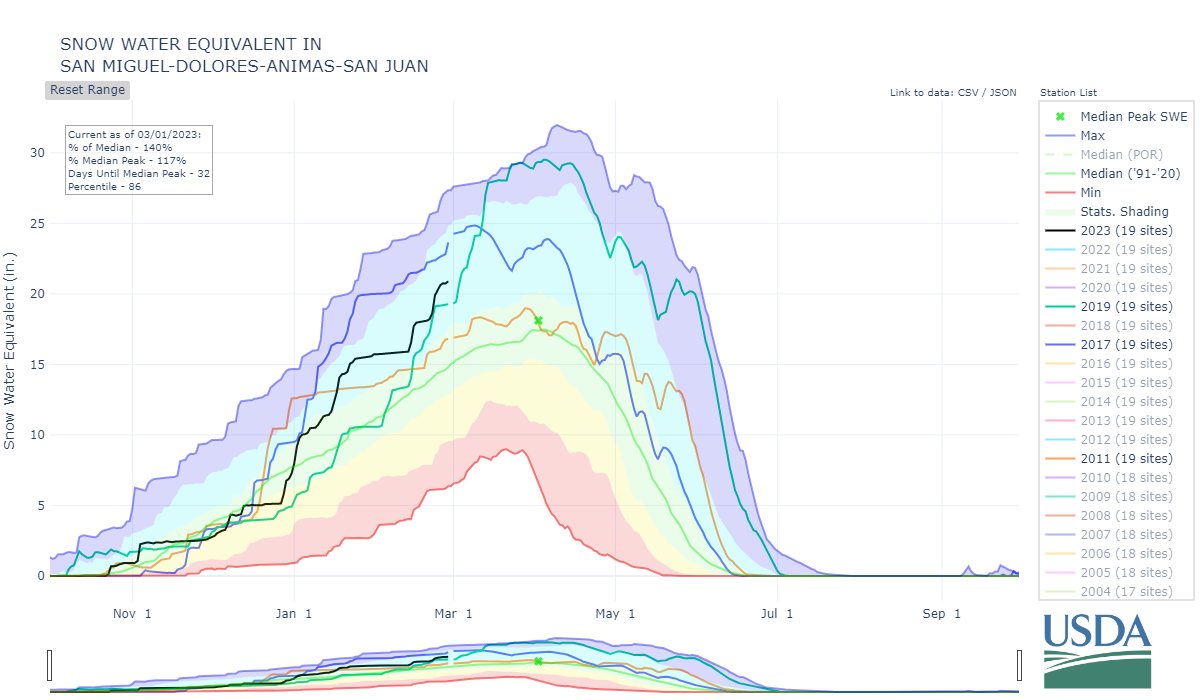
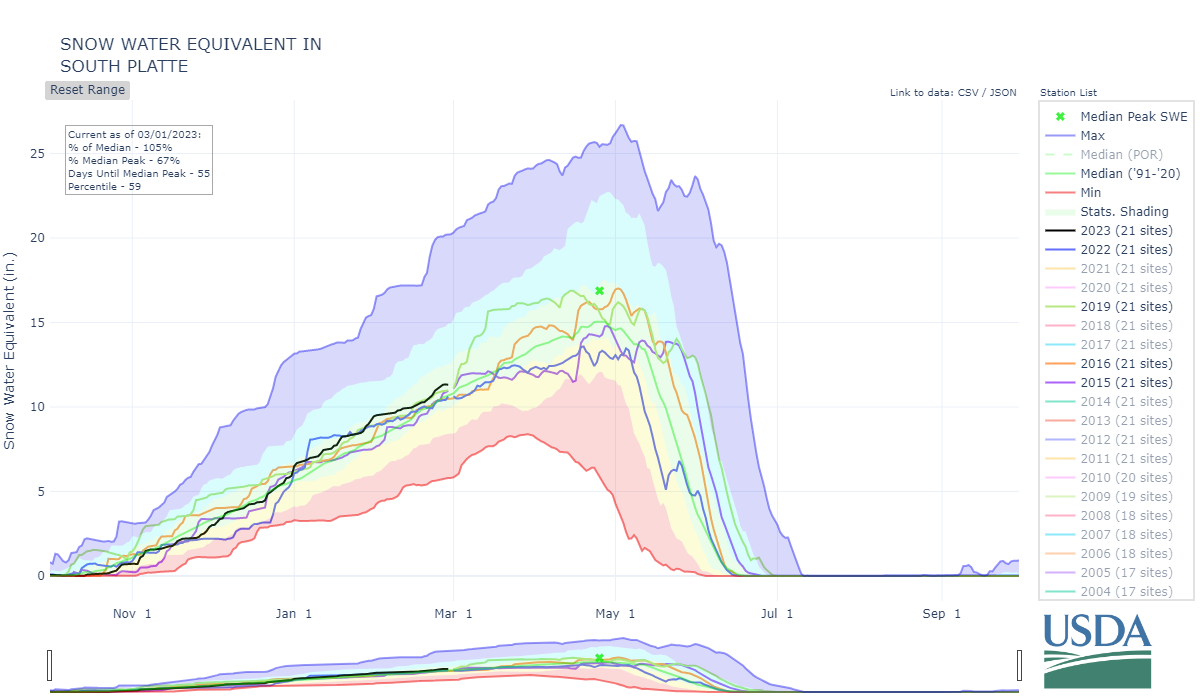
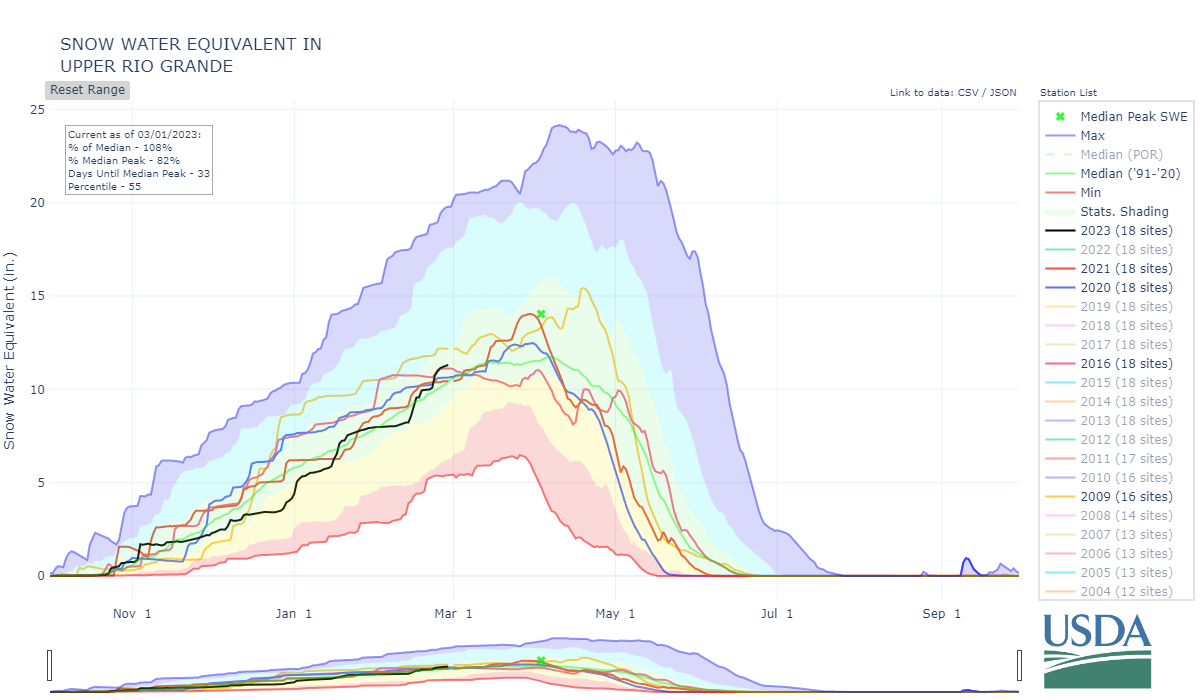
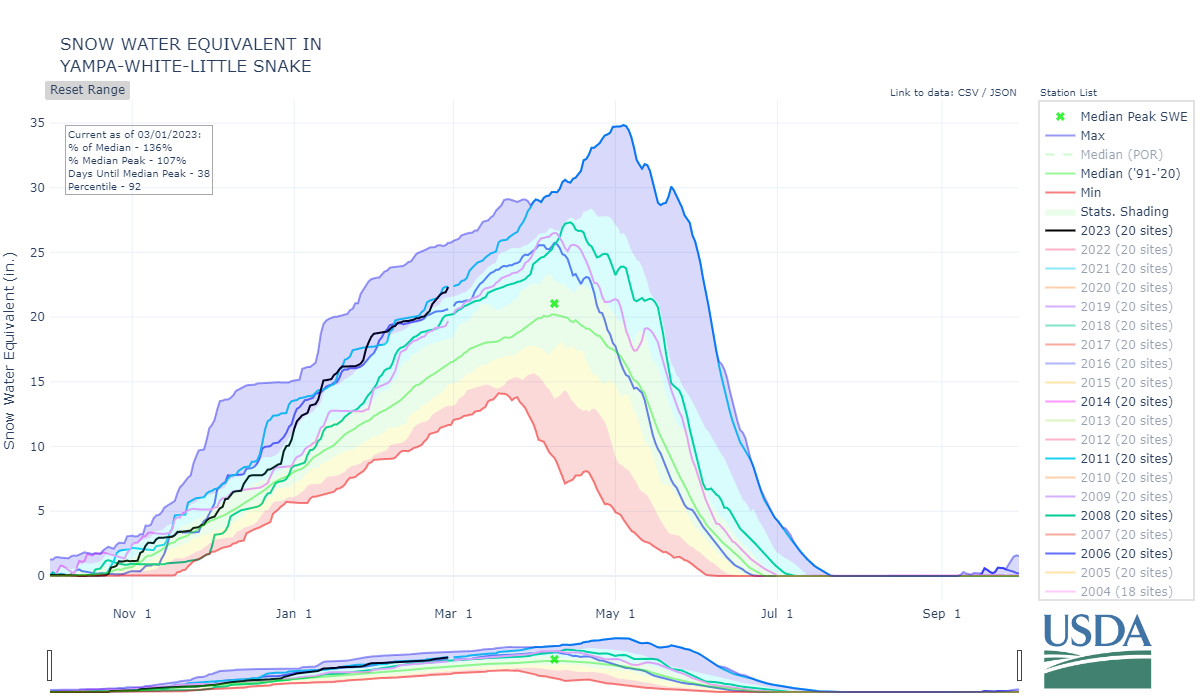
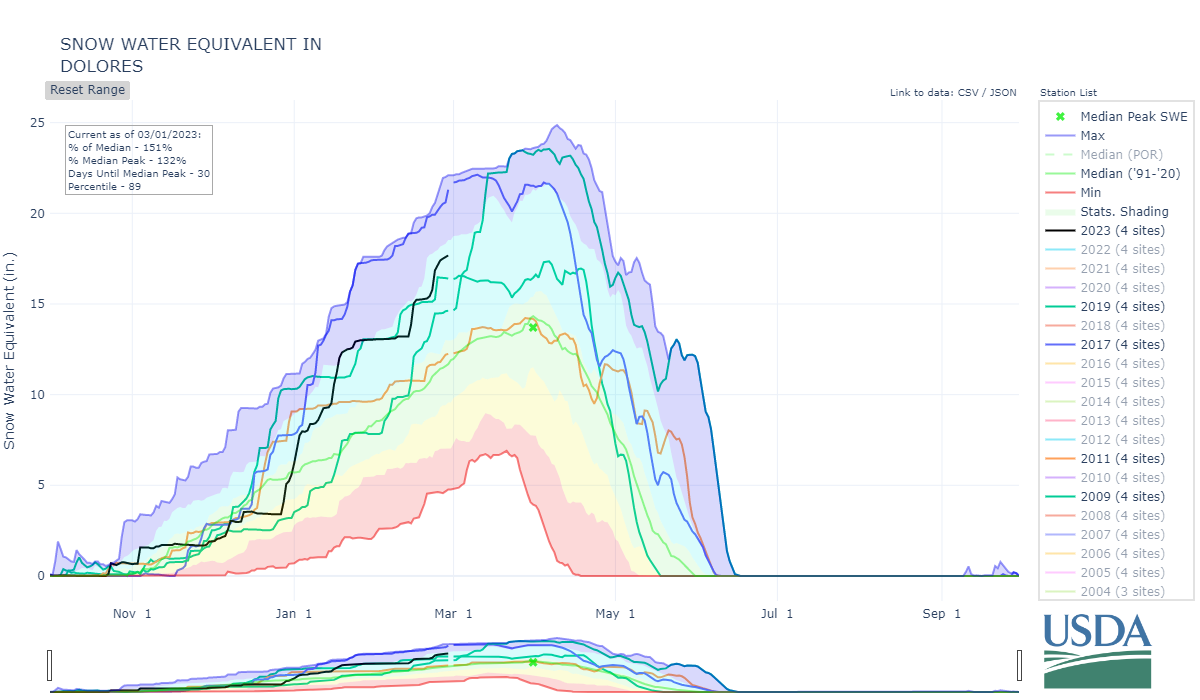
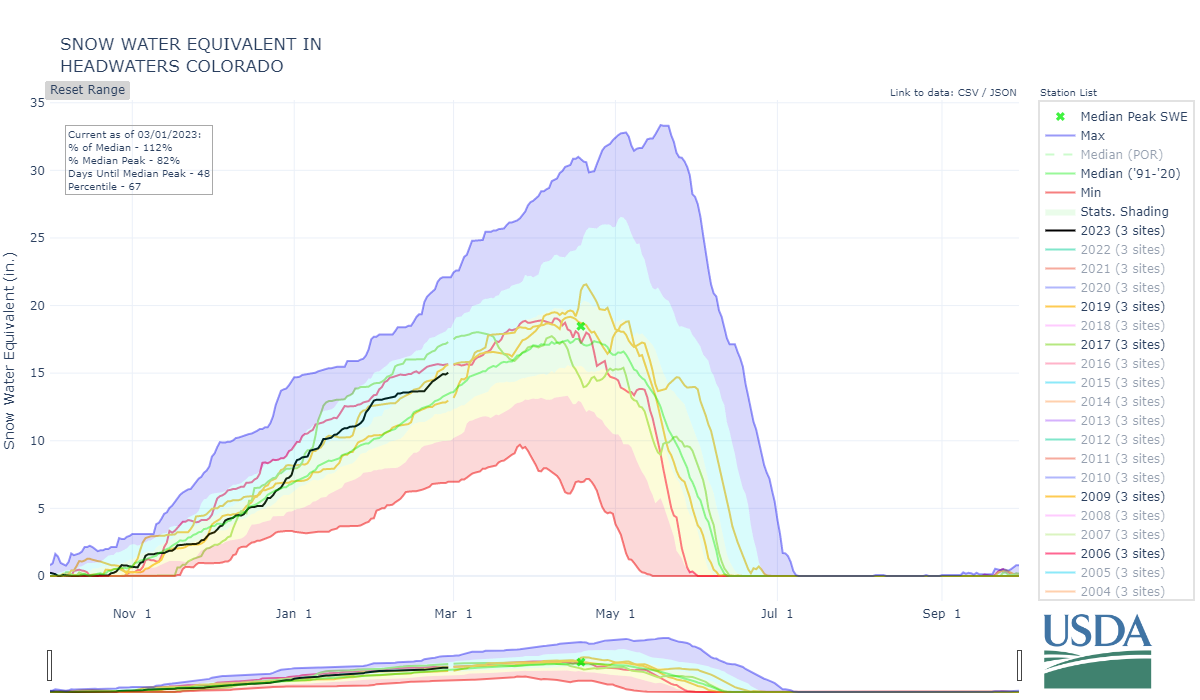
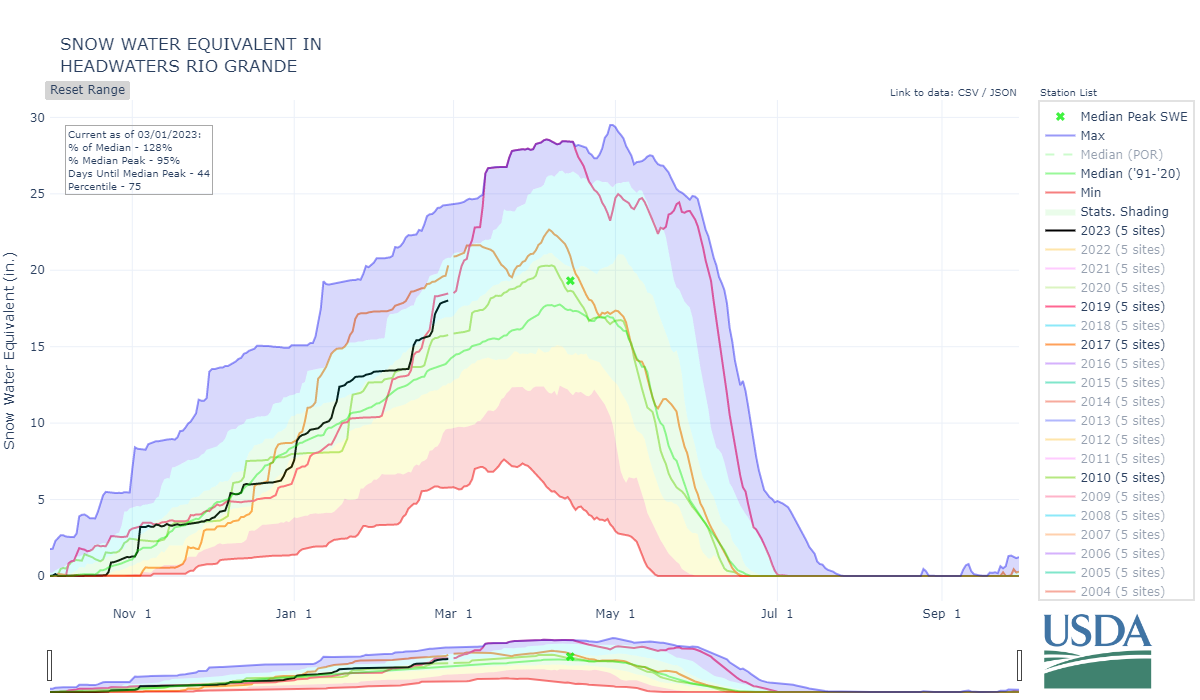
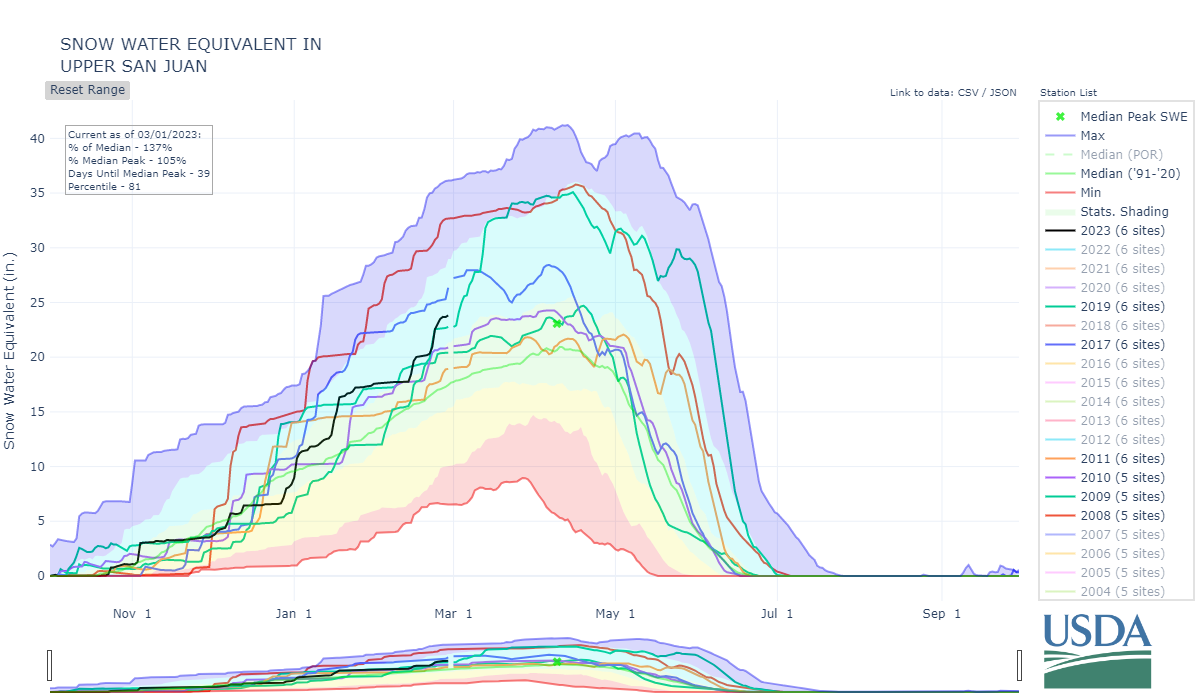
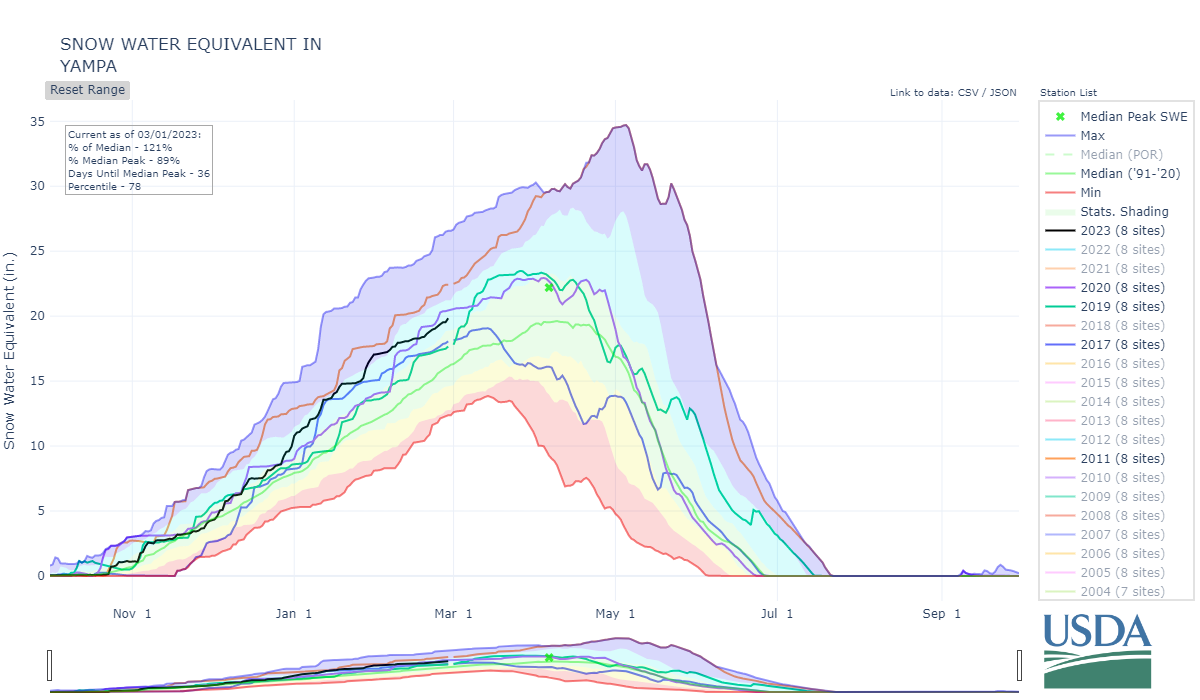
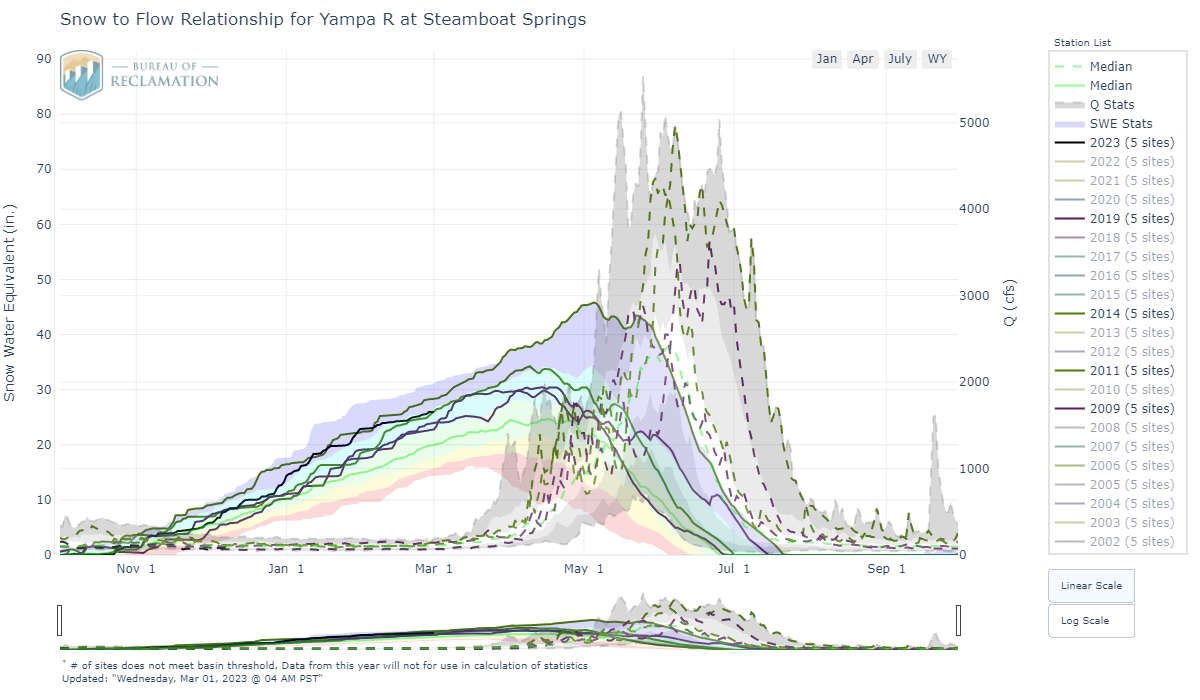
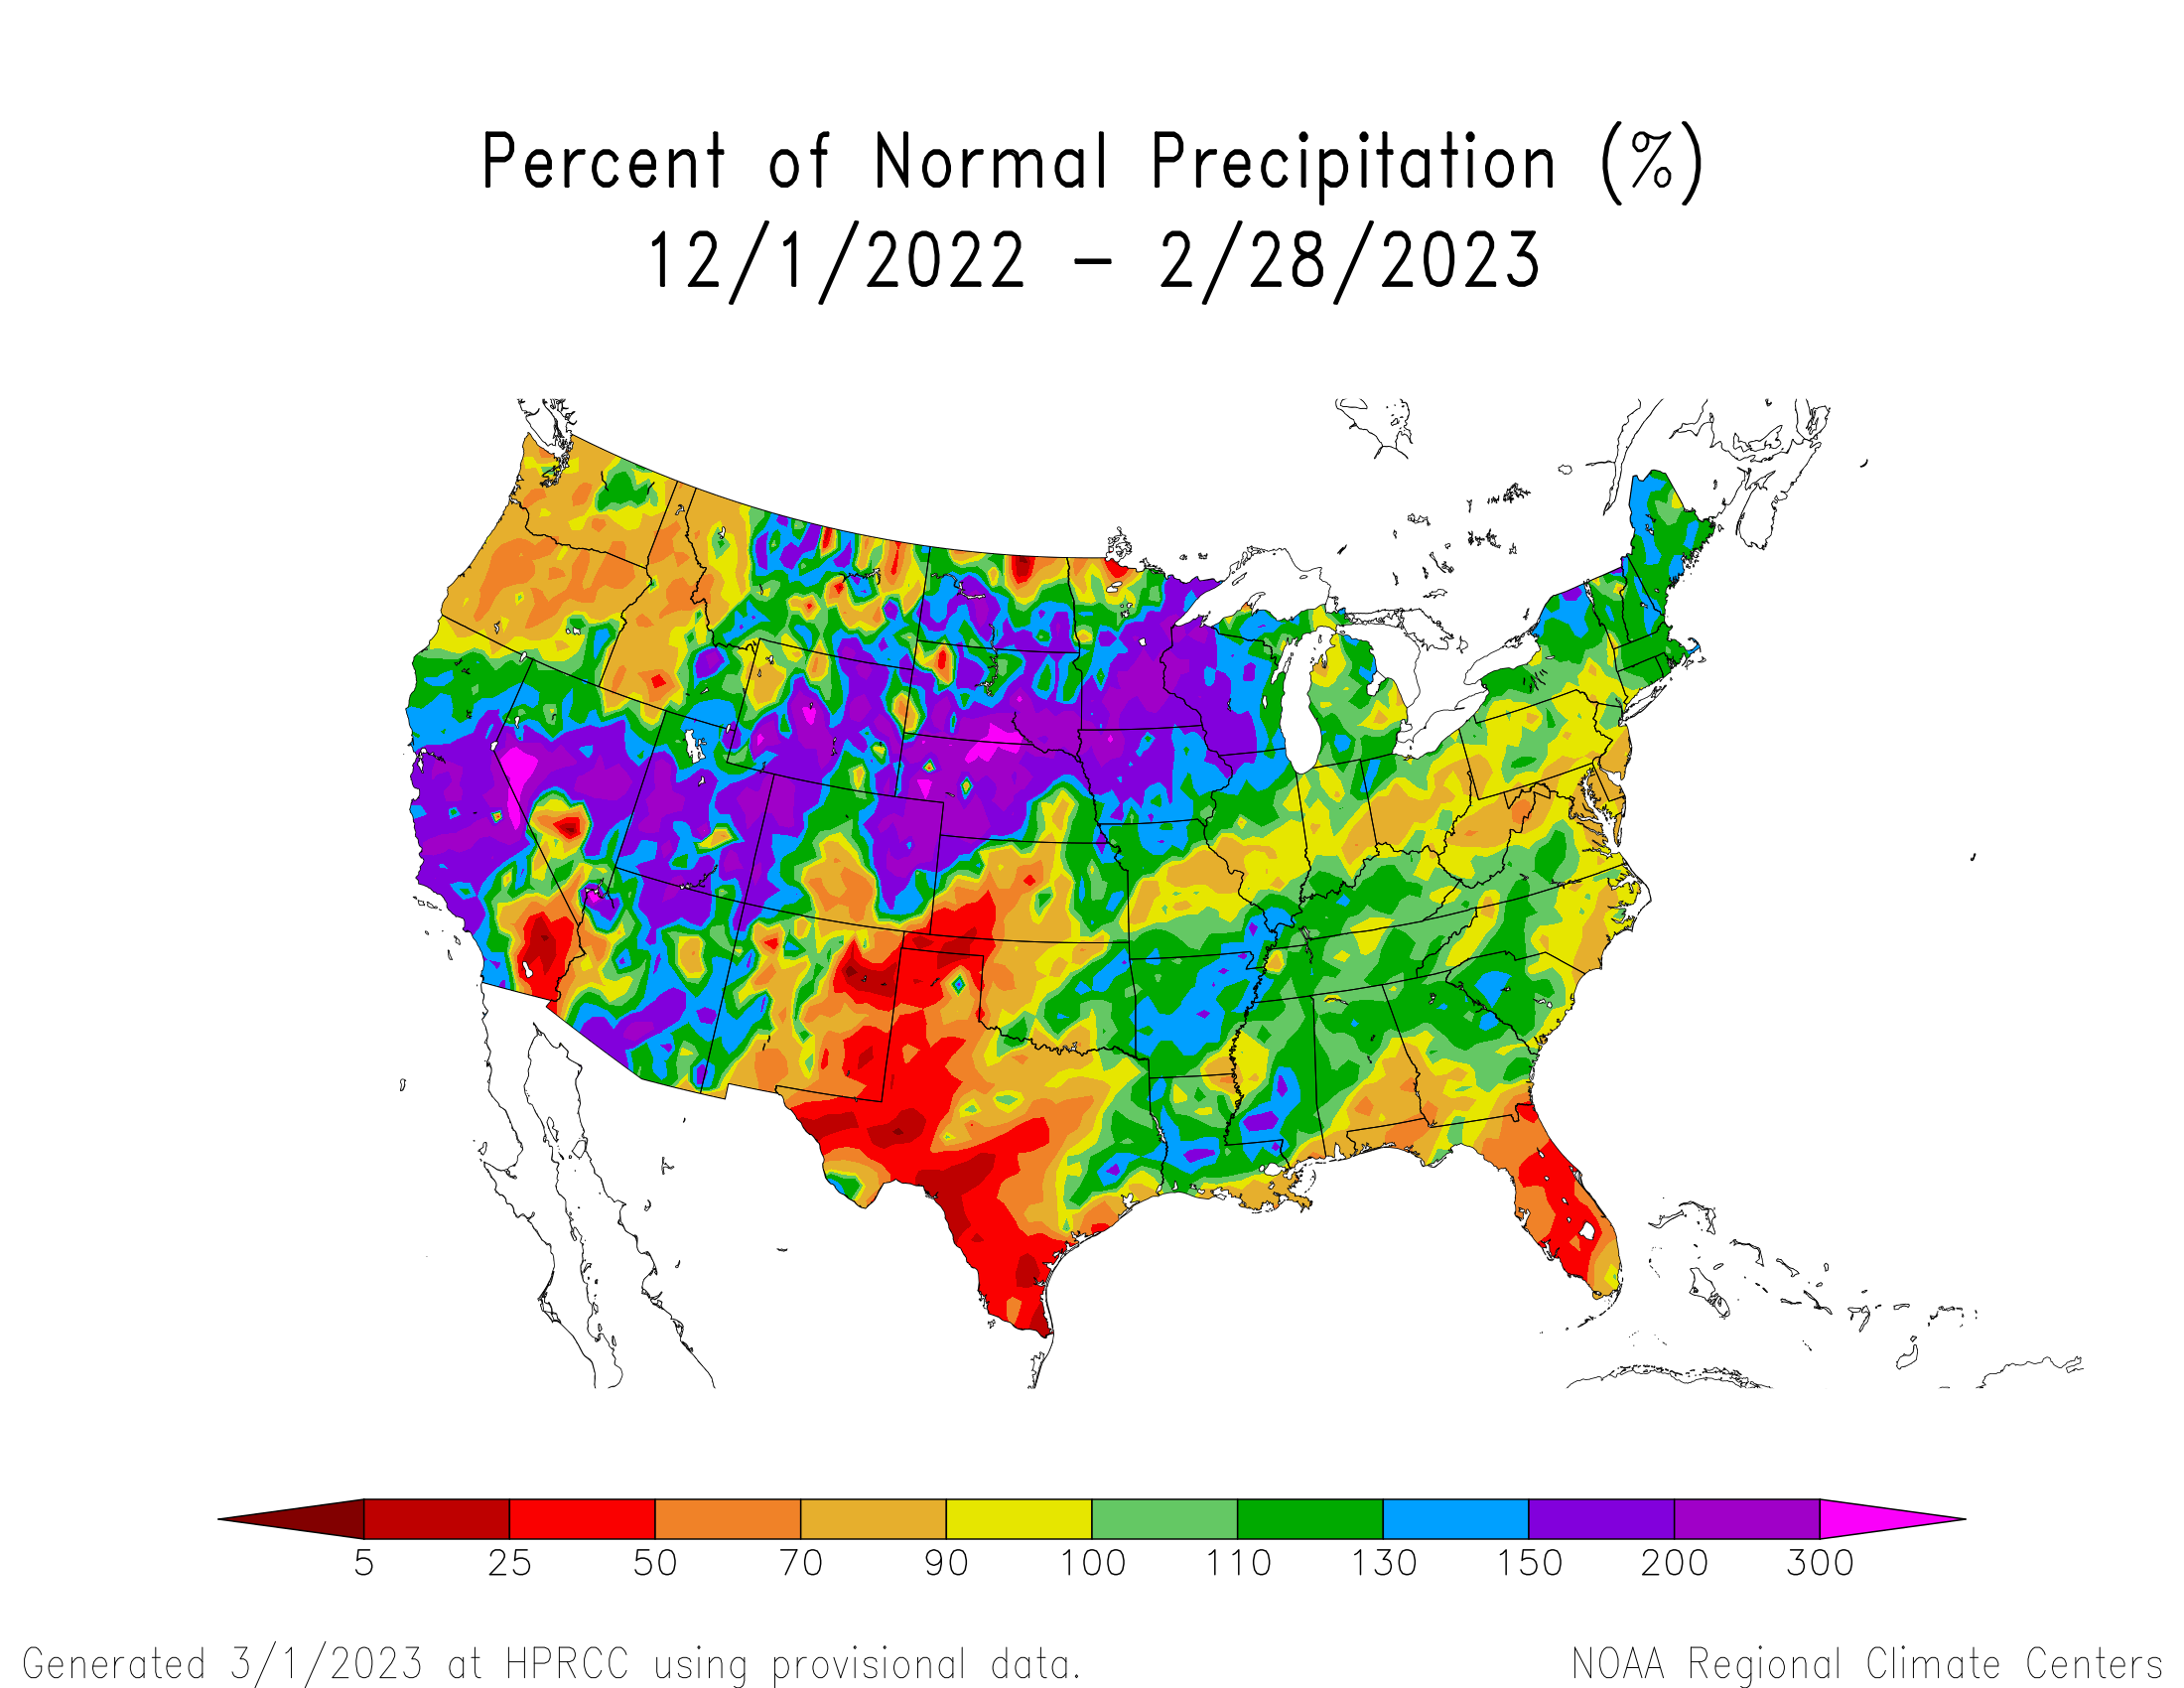
DERC “Average” SWE equals median +/- 10%, and deviation above and below those limits are assessed as having “high” or “low” SWE. As of March 1st, SWE % is in the “high” category in the Gunnison/Upper CO/Yampa/Upper Rio Grande/San Miquel/Dolores/Animas/San Juan River and in the “average” category for the Arkansas and South Platte. The basins listed below are classified according to the appropriate DERC classification.
Basin scale WY 2023 March 1 SWE conditions (NRCS data) classified using the Dust Enhanced Runoff Classification Scheme.
As described on the CODOS website, the DERC framework is utilized to identify prior years with similar patterns of dust-on-snow intensity, March 1st SWE, and spring precipitation conditions, and their associated hydrographs. March 1st SWE analyses have been performed for each CODOS site. From this, hydrographs from 2006-2022 with associated March 1st SWE conditions have been identified and included in the analyses.
An ‘exploded view’ of the Dust Enhanced Runoff Space, separated by March 1 SWE classifications.
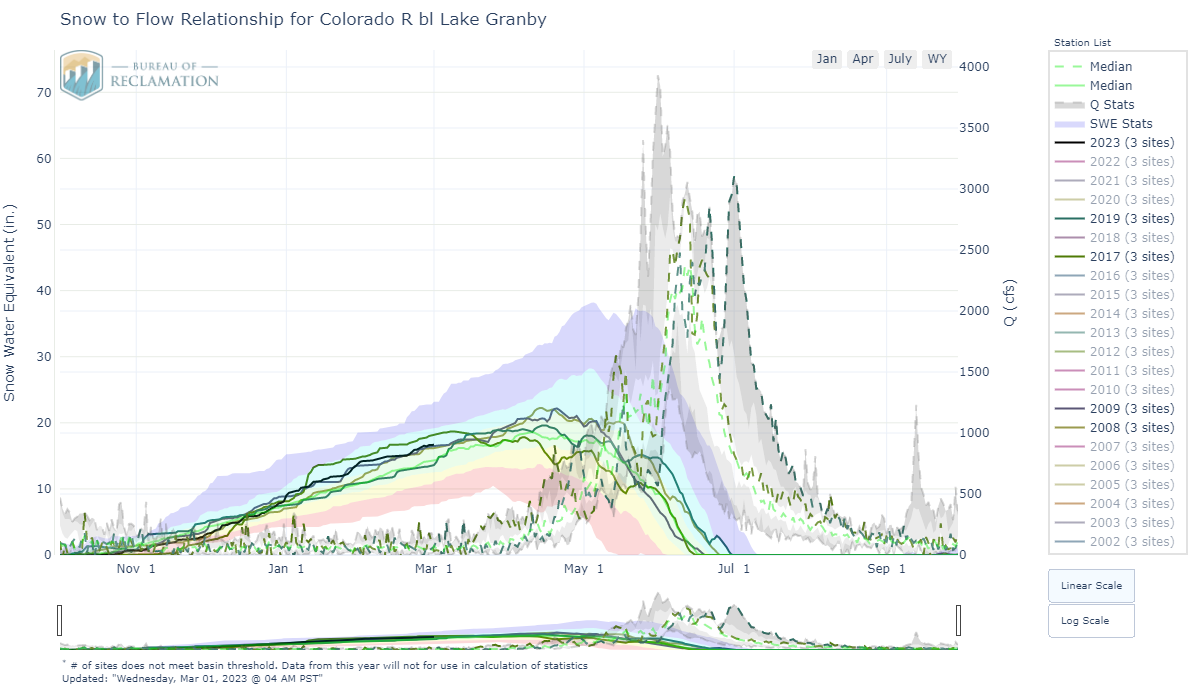
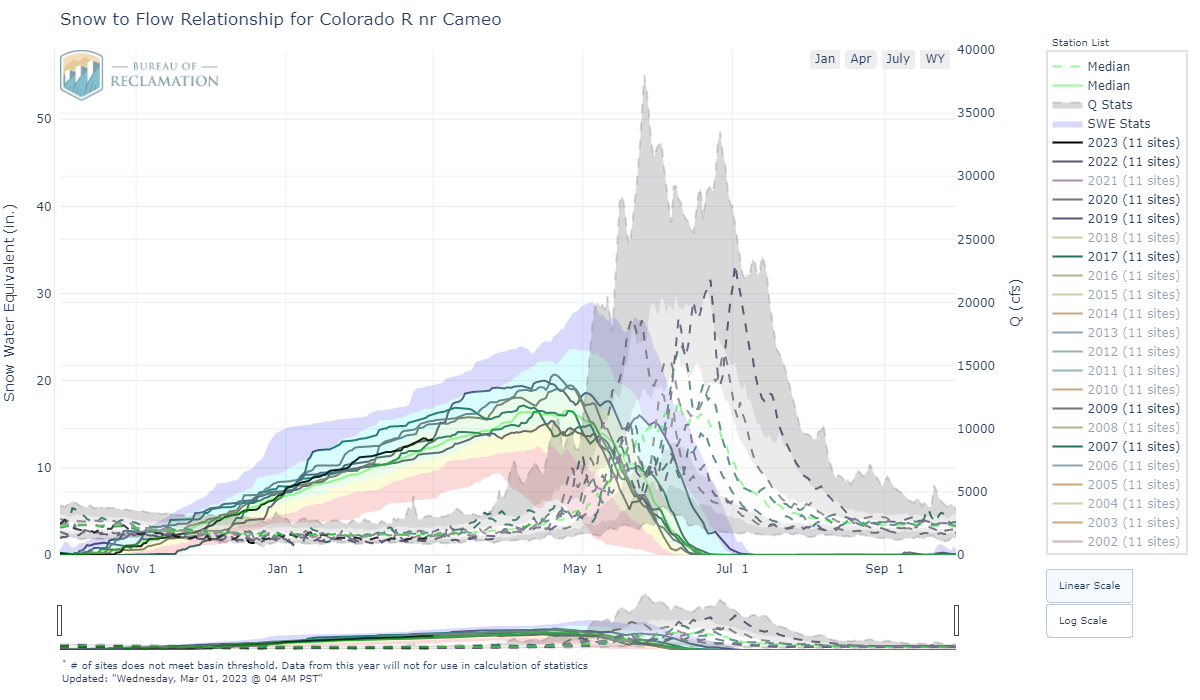
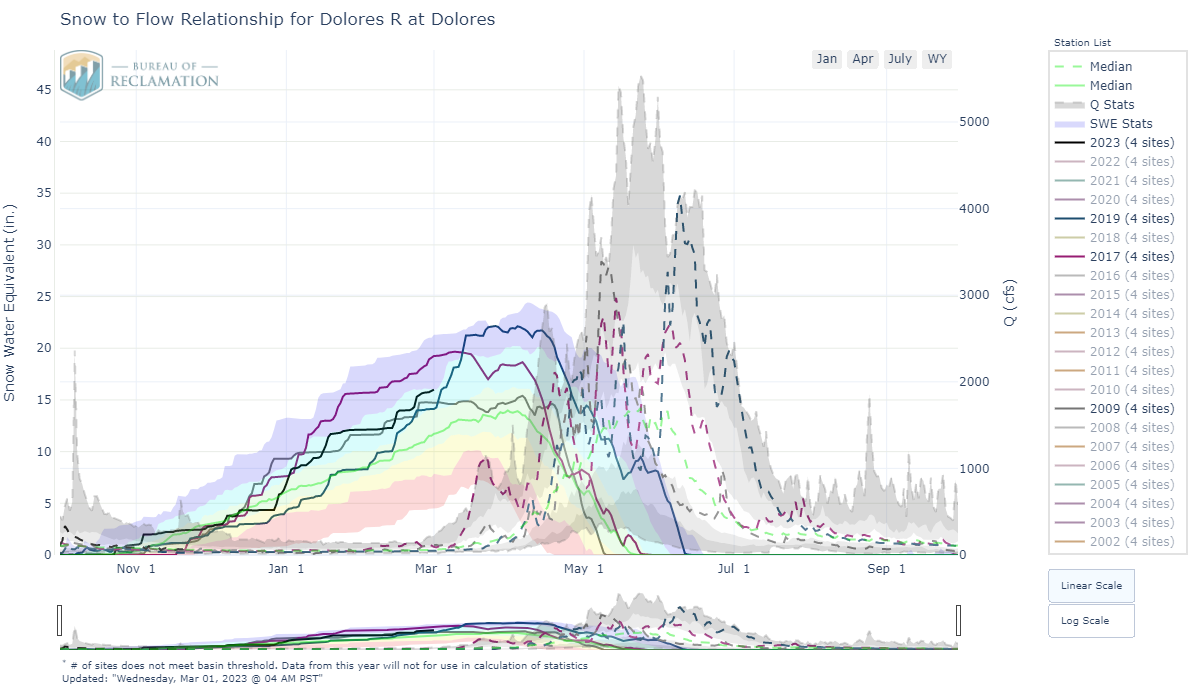
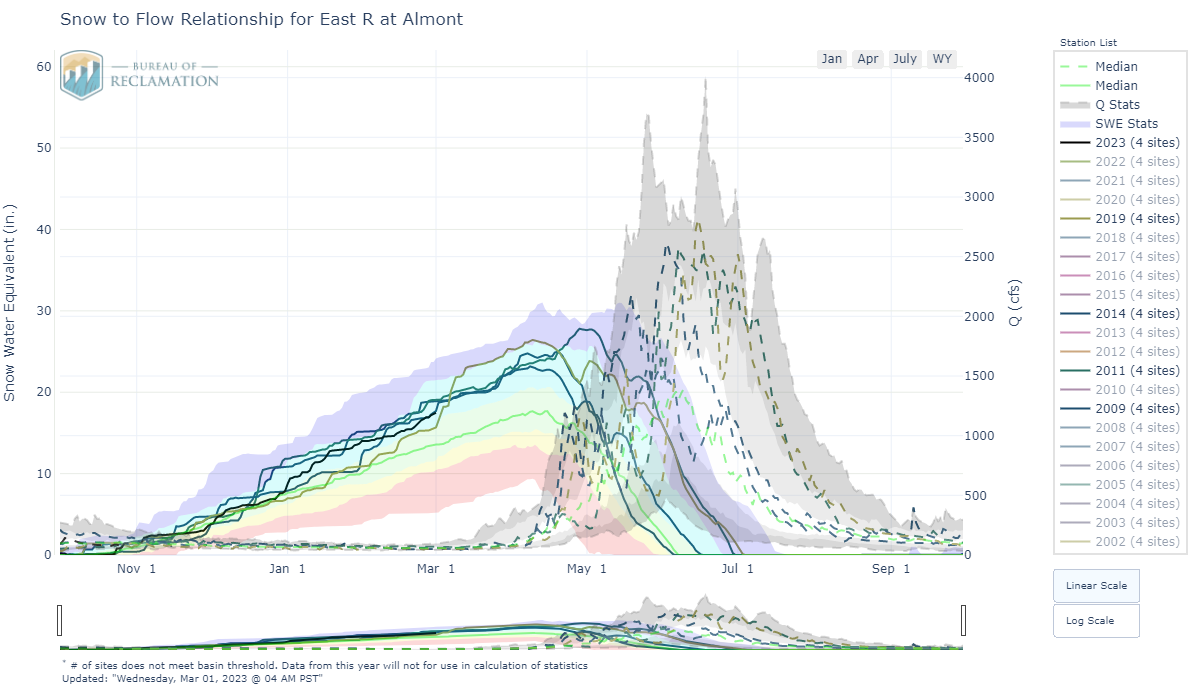
CODOS SITE-SPECIFIC ANALYSES

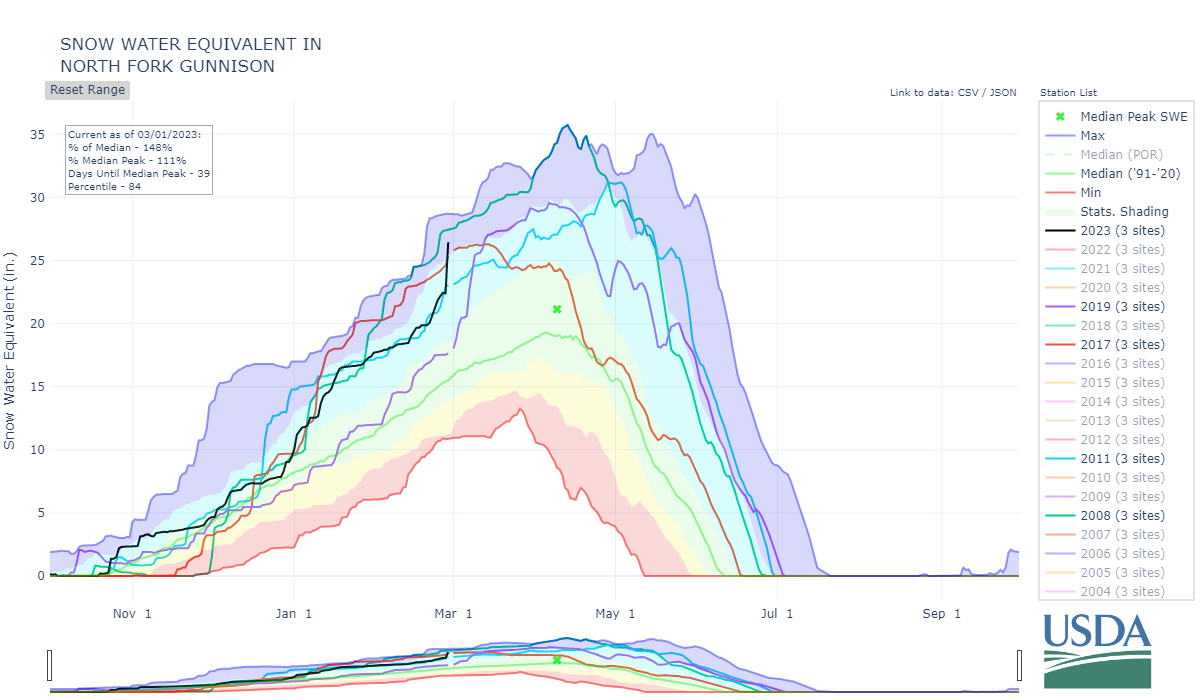
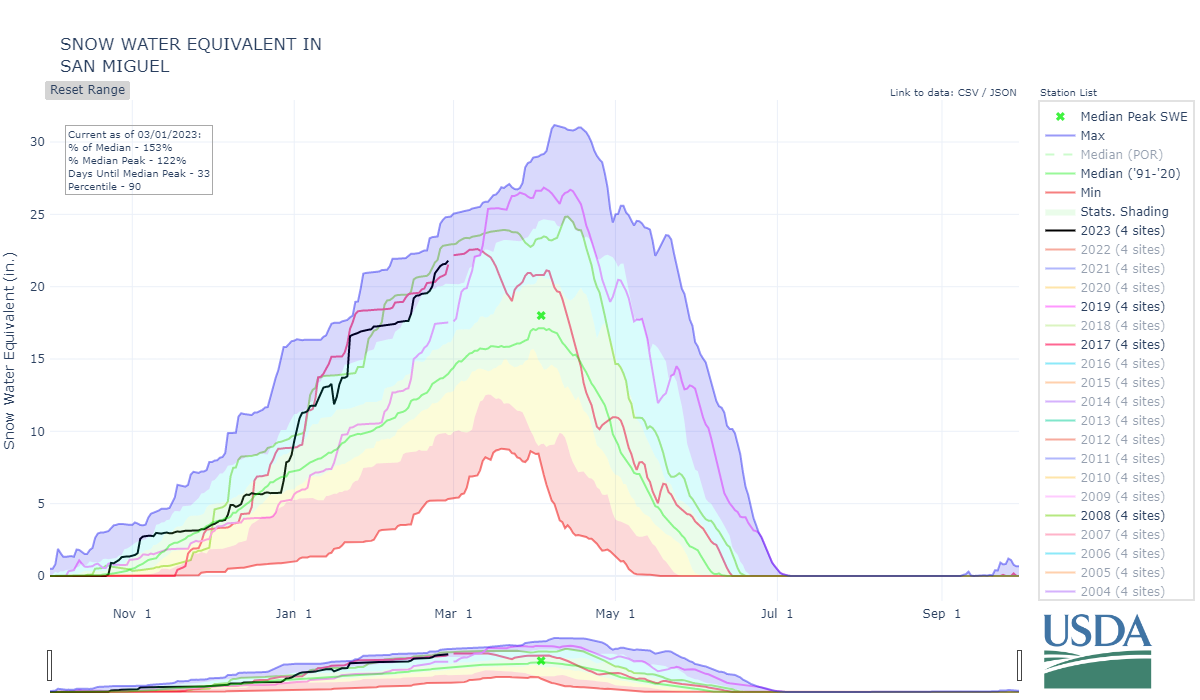
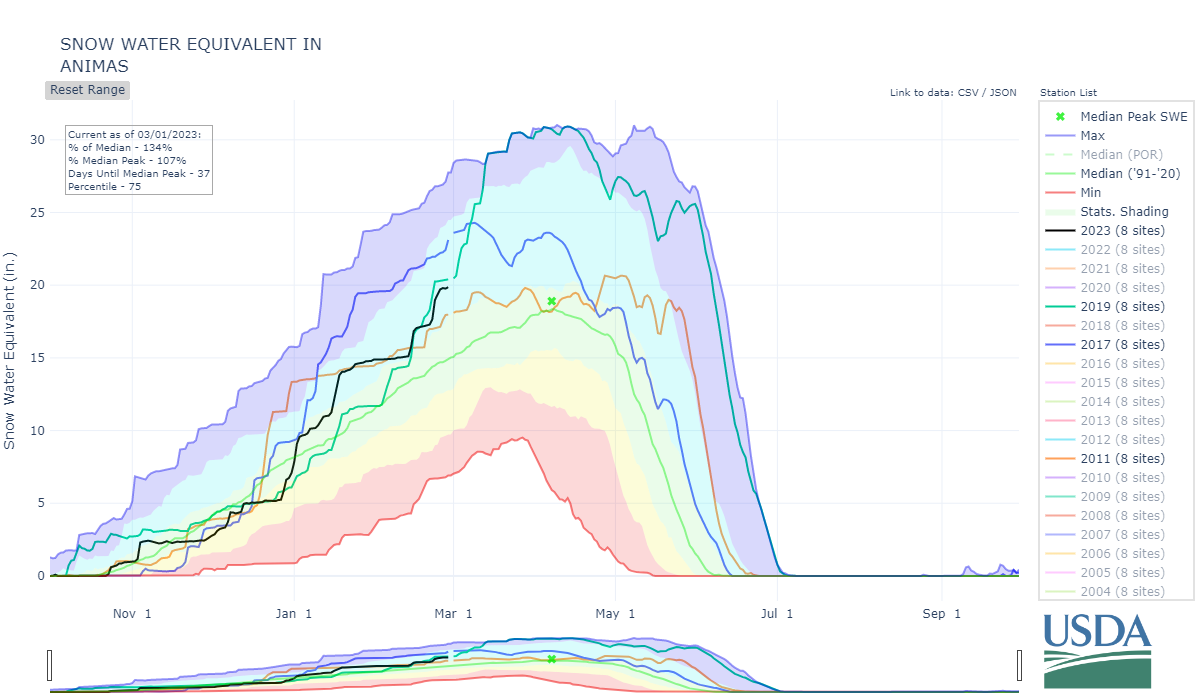
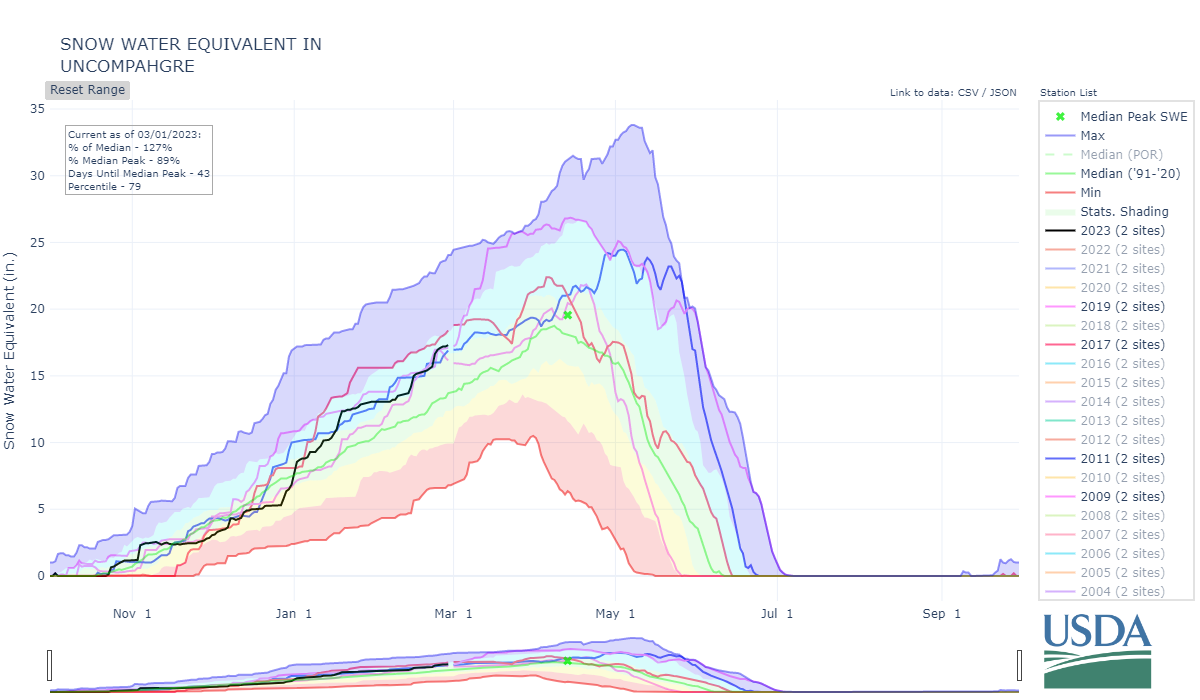
For individual SNOTEL stations associated with our eleven CODOS sites, March 1 SWE ranges from 82%-149% of median levels (using the new 1991-2020 metric). March 1 SWE conditions are classified by the SNOTEL station directly associated with each CODOS site, and also for select nearby SNOTEL stations. Prior seasons with similar March 1st conditions were identified and placed within the appropriate dust enhanced March 1st SWE space. Local watershed hydrographs (from 2006-2022) associated with those March 1st SWE conditions are presented as plausible examples of runoff behavior in spring 2023, with the understanding that these prior years exhibit a relative limited variety of 2006-2023 dust and spring precipitation conditions for each CODOS site.
These analyses are presented in PDF format and are available for the watersheds listed below. You can see the entire period-of-record hydrographs as it relates to dust conditions on our CODOS website.
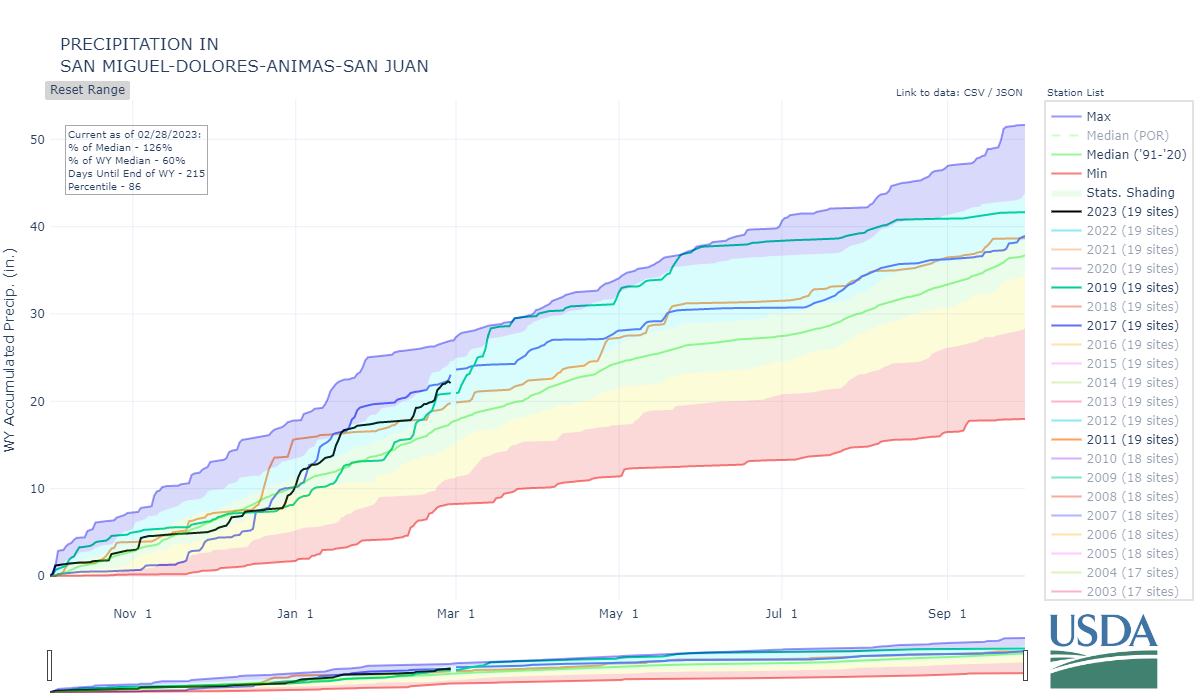
Below: In addition to the links to the pdf documents above the plots below show SWE and discharge for select watersheds for years with similar March 1 conditions. Explore this convenient tool on your own by following this link.

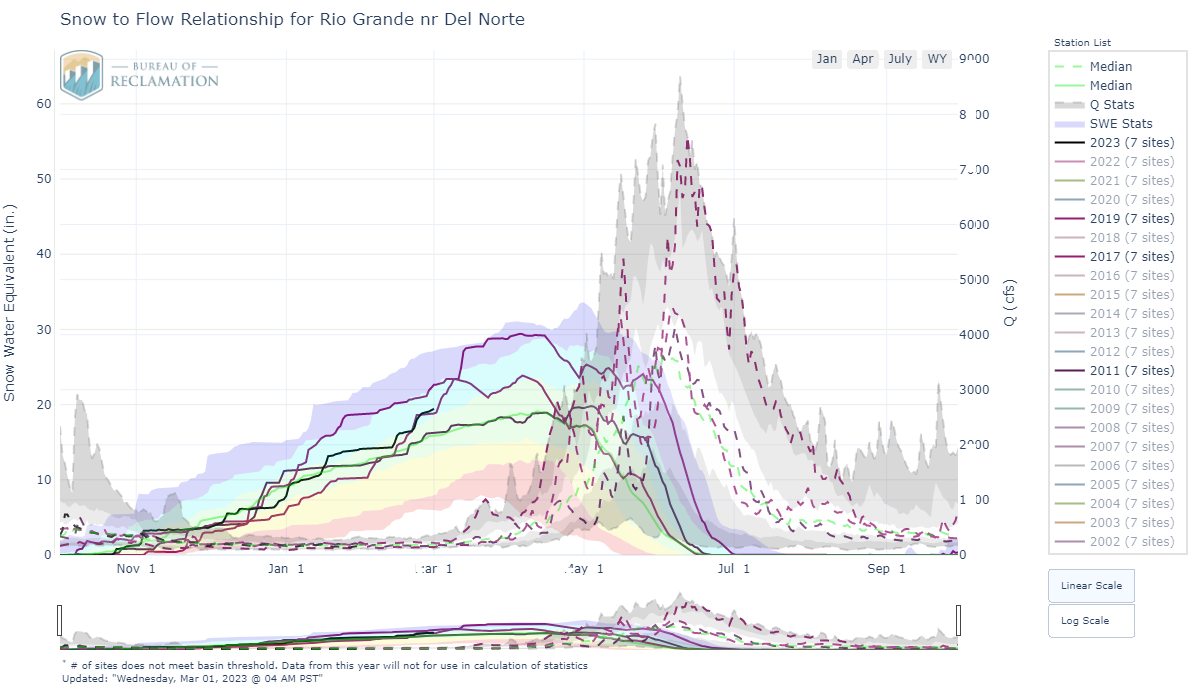
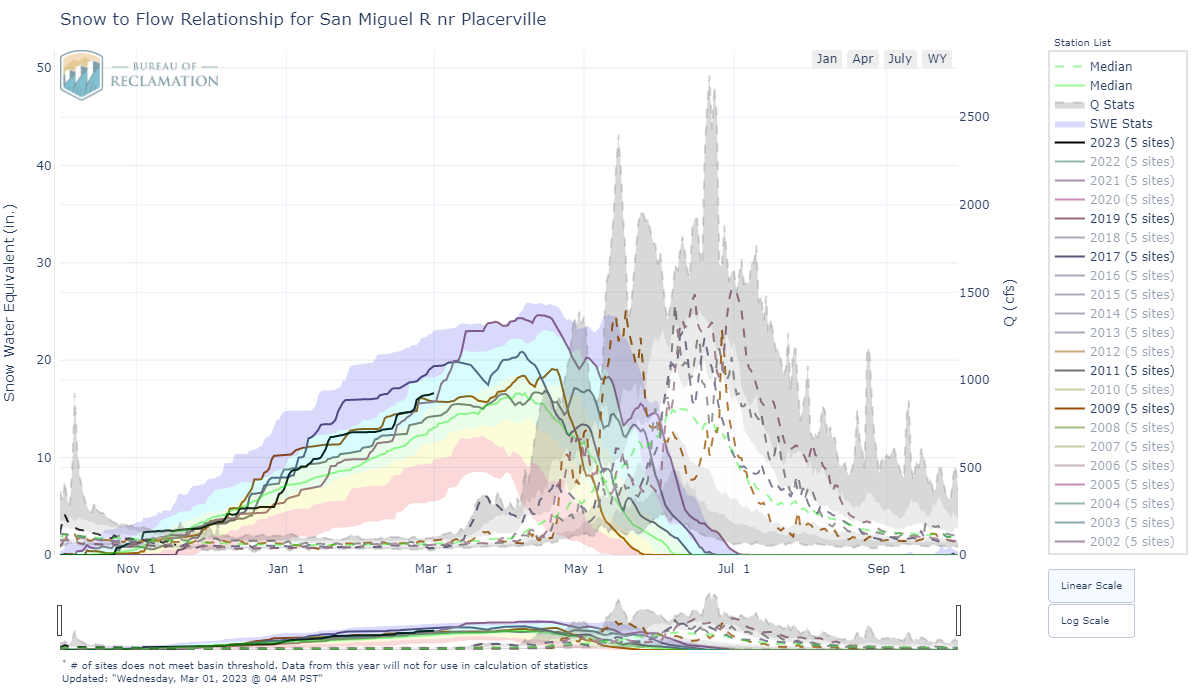
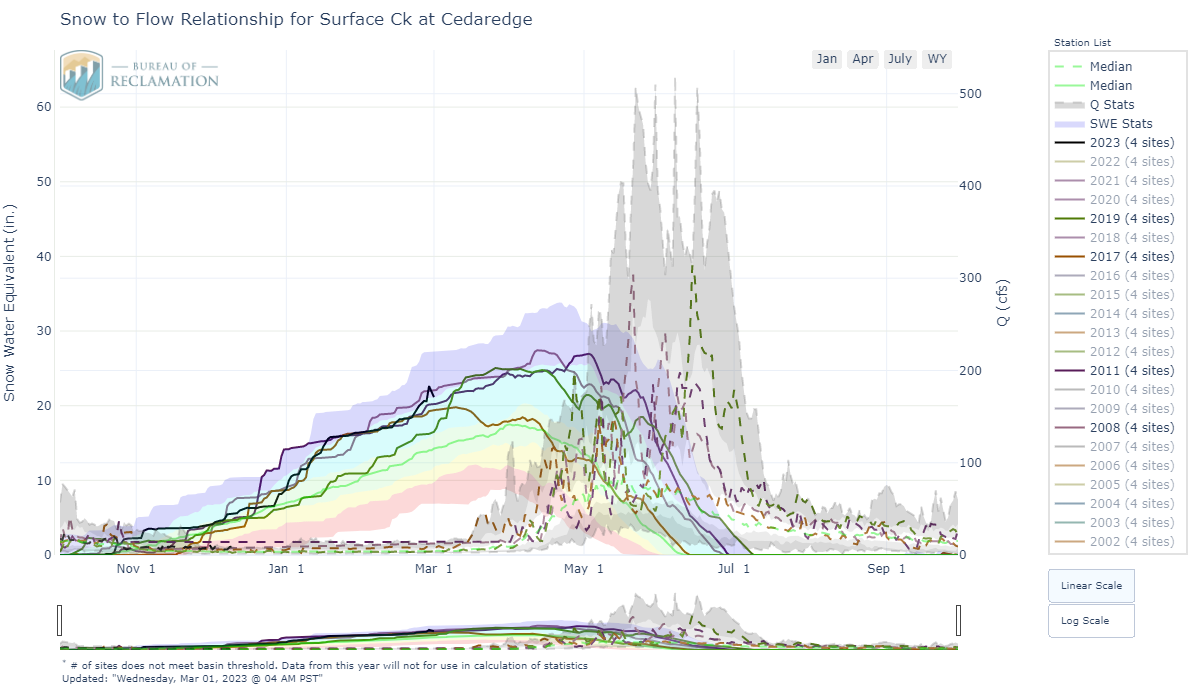
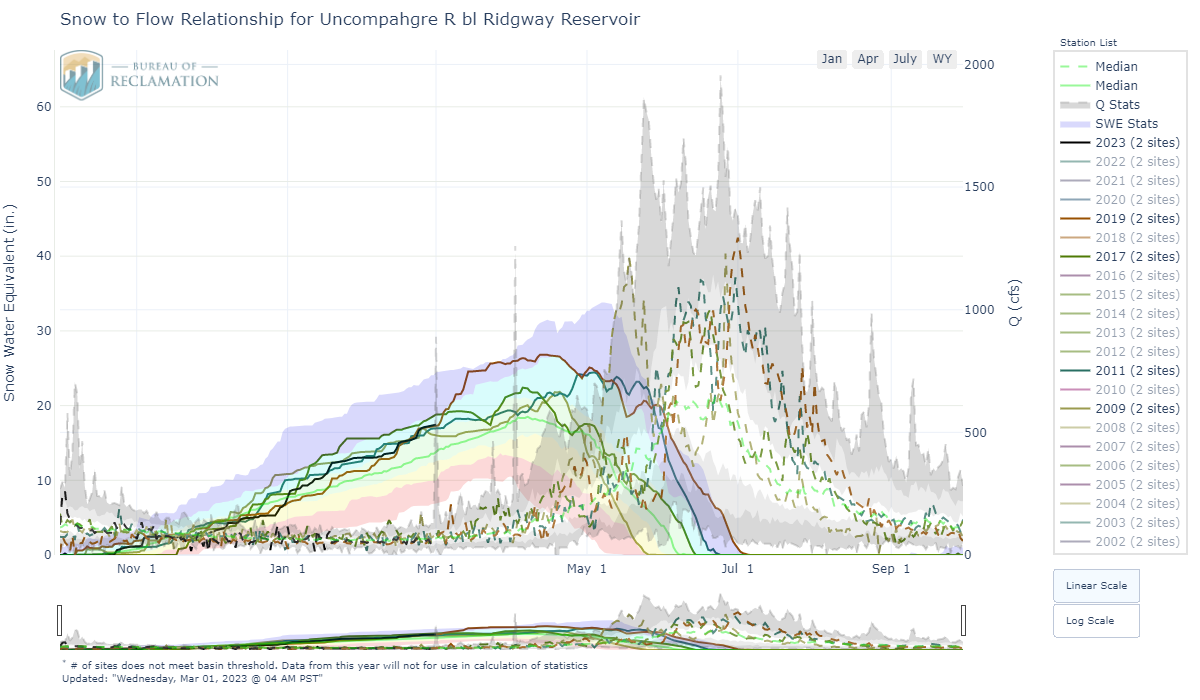
Bringing it all together: comparitive water years
The possibilities are limitless on how we could see the remainder of the snow season unfold. Considering the DERC pdf’s above, the combinations of our three-legged DERC model (March 1 SWE, Dust Severity, Spring Weather) suggest WY2017, WY2019, WY2011 (depending on the basin) have floated to the top in being the most similar to WY2023 thus far.
WY2017: WY2017 is most relevant as an analog year towards southwestern Colorado. As of now the two years have a lot in common. Cumulative precipitation is nearly identical. In WY2017 during the first half of winter the Four Corners region saw a good amount of precipitation that I believe tamped down dust mobilization, the first dust event did not happen until March 5, and it turned out to be an overall “average” dust year. WY2023 also sees a somewhat similar wetness in the dust source region, except for the worrisome “hot spot” in NW New Mexico. Even though WY2023 is currently considered “minimum” dust so far this winter, I believe we will see a few dust events that push us to the “average” category. Currently, we are behind a few inches of SWE compared to WY2017 but I think these current and upcoming storms will take care of that. Also, WY2017 was a dry spring, which I am thinking is the direction we will lean given that has been the case the last four out of five years.
I don’t think the southwest basins compare well with WY2019 simply because I don’t see us having a March like we did in WY2019 (but what do I know). Towards the central and northern basins WY2019 is more applicable as an analog season.
WY2011: One of the big differences between WY2011 and WY2017 is WY2011 had a wet spring and WY2017 a dry spring, which is obvious looking at the hydrographs. Both years were “average” in terms of dust severity. Like WY2019, WY2011 is more applicable in the central and northern basins. However, the wet spring in WY2011 (and WY2019) imply we will see a very wet spring this year. It can happen of course, but I feel WY2017 is more realistic - we’ll see how the forecasted wetter than normal month of March plays out. Conditions vary basin by basin, sub-basin by sub-basin, so depending on the basin you are looking at depends on how much weight you put into each historical year as a guide to WY2023 runoff.
Below: Soil moisture conditions compared to WY2017. This may not be the best soil moisture product to use for this example, but serves the point that current soil conditions are similar in the Four Corners region as WY2017, somewhat wet first half of winter that may have helped keep the lid on dust mobilization.
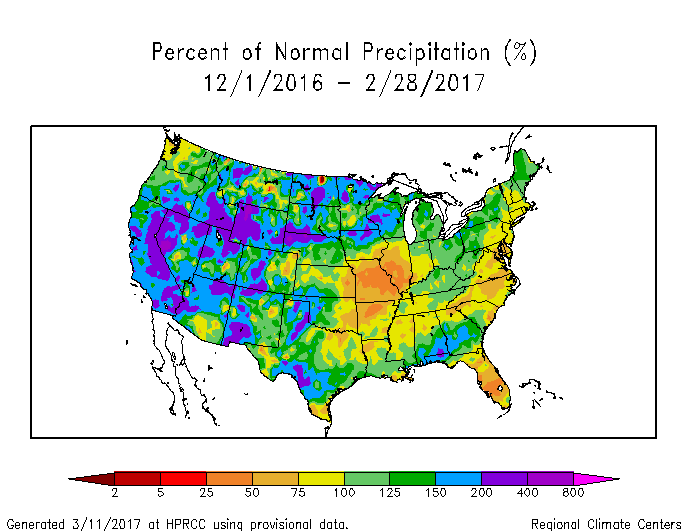
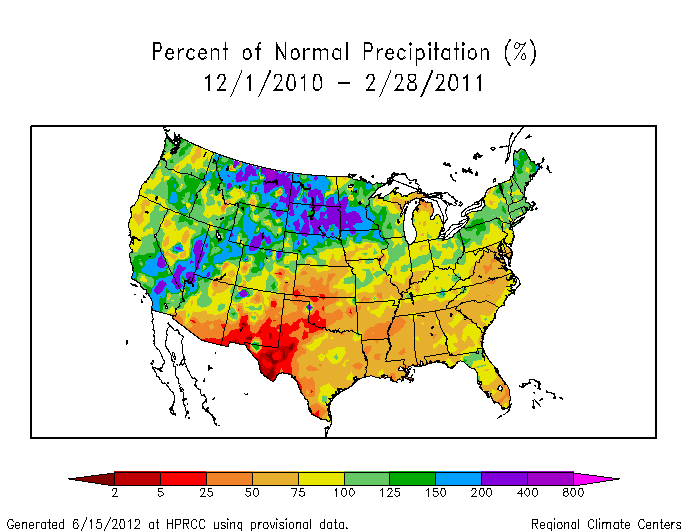
Below: Percent Precipitation for analog years WY2017 and WY2011
Below: Cumulative precipitation for southwest basins compared to WY2017, WY2011, and WY2019. In general, if we keep cruising the way we have been and dust conditions stay near average, then WY2017 appears to be the best indication of how events will unfold.

SENATOR BECK STUDY BASIN (SBB) DATA PLOTS
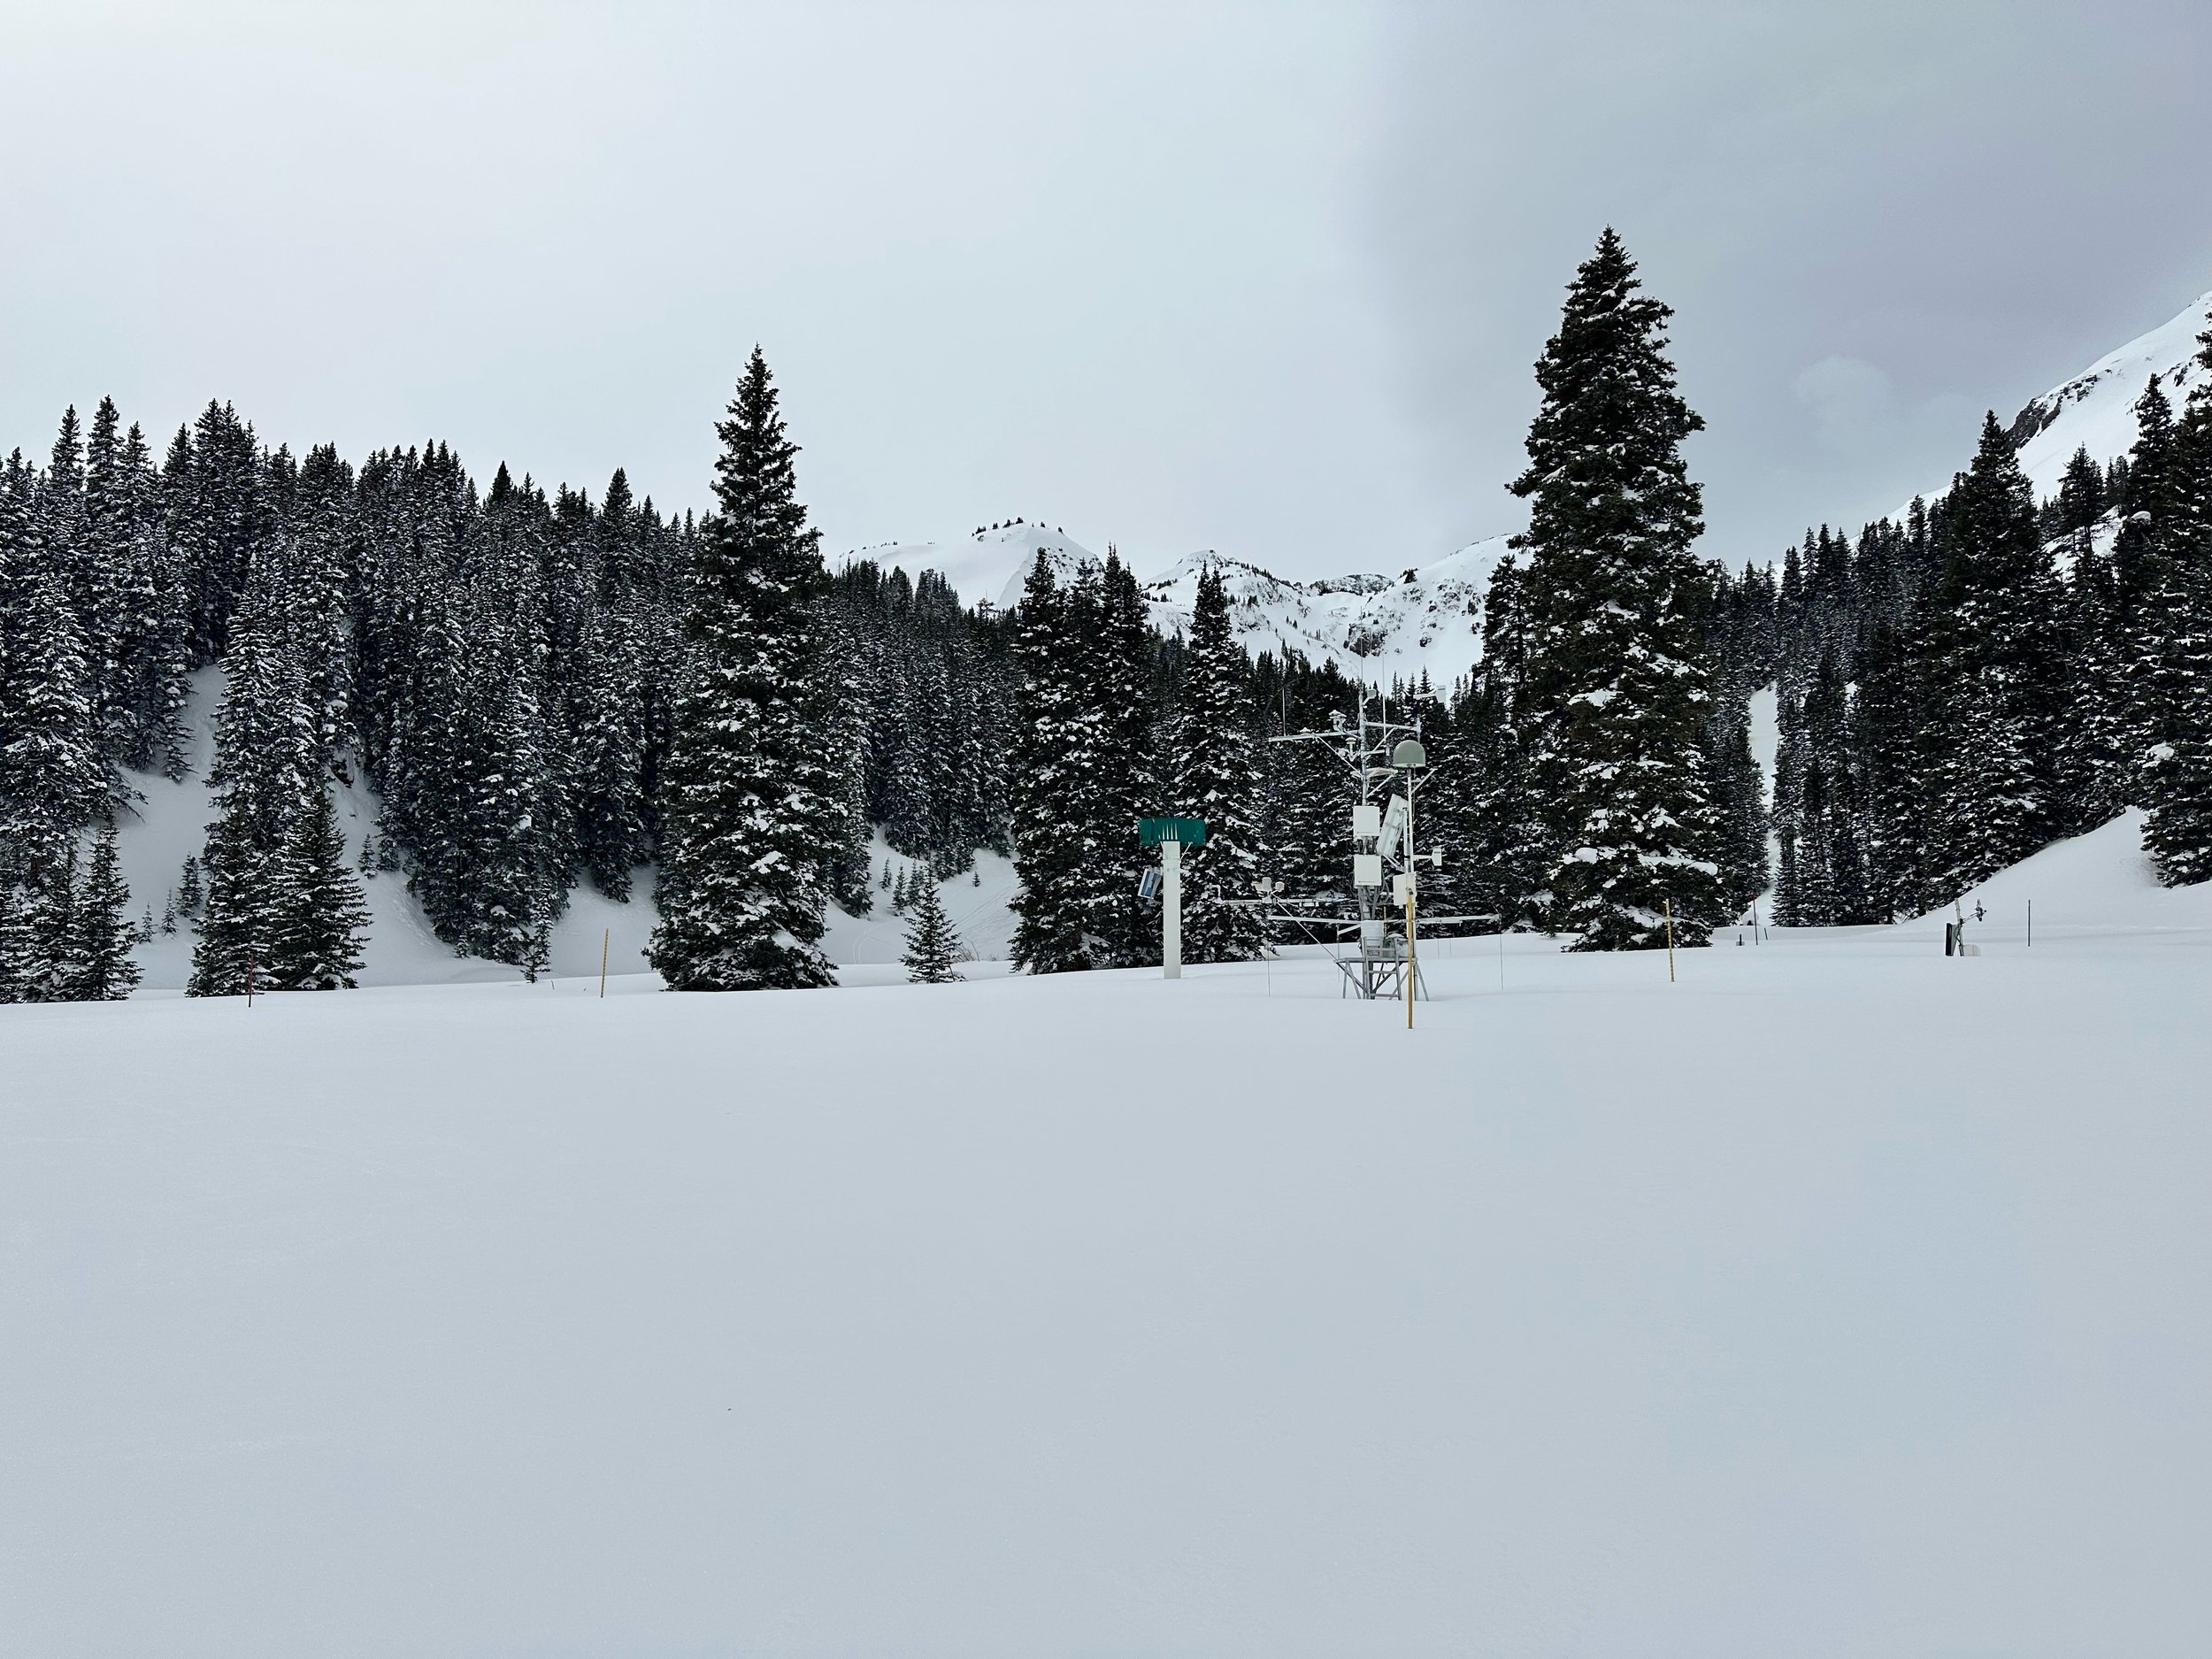
SBB is located at, or near, the headwaters of four major watersheds (Animas, Uncompahgre, San Miguel, and Rio Grande) and is the only high alpine study site in the region collecting comprehensive snowpack and information. We regularly dig snow profiles to assess snow/dust conditions, and our meteorological stations measure the entire energy balance of the snowpack. Being a headwater study basin, the elevations that we collect snowpack information and continue meteorological station monitoring is well above the highest of most SNOTEL stations.
Snowpack at the Swamp Angel Study Plot (SASP), located at 11,060’, is a few inches of SWE above average conditions. The same is true for the Senator Beck Study Plot (SBSP), which is at 12,200’ and is more exposed.


Below: Colorado will be leaning towards wetter than normal conditions over the next months. For a refreshing change, air temperatures are forecasted to be below normal.


Below: CODOS tour map. These locations are visited in March, April, and May to assess dust-in-snow conditions.

SENATOR BECK STUDY BASIN SETTING
Usually just before spring it is helpful to remind long-time CODOS subscribers and inform new subscribers where Senator Beck Basin (SBB) and it’s meteorological stations are located, so when we refer to data at SASP (Swamp Angel Study Plot) or SBSP (Senator Beck Study Plot) the reader understands the environment in which it was collected.
Senator Beck Study Basin location near Red Mountain Pass near Silverton, CO. Elevation of the Basin ranges from 11,030’ at the stream gauge to 13,510’ at the crest of the peaks. The blue line delineates watershed boundary. Senator Beck Study Plot and Swamp Angel Study Plot are the locations of highly instrumented meteorological stations and are also where snowpack data is collected. This picture was taken from our Putney station, where we collect “free air” wind speed and direction.
