SUMMARY
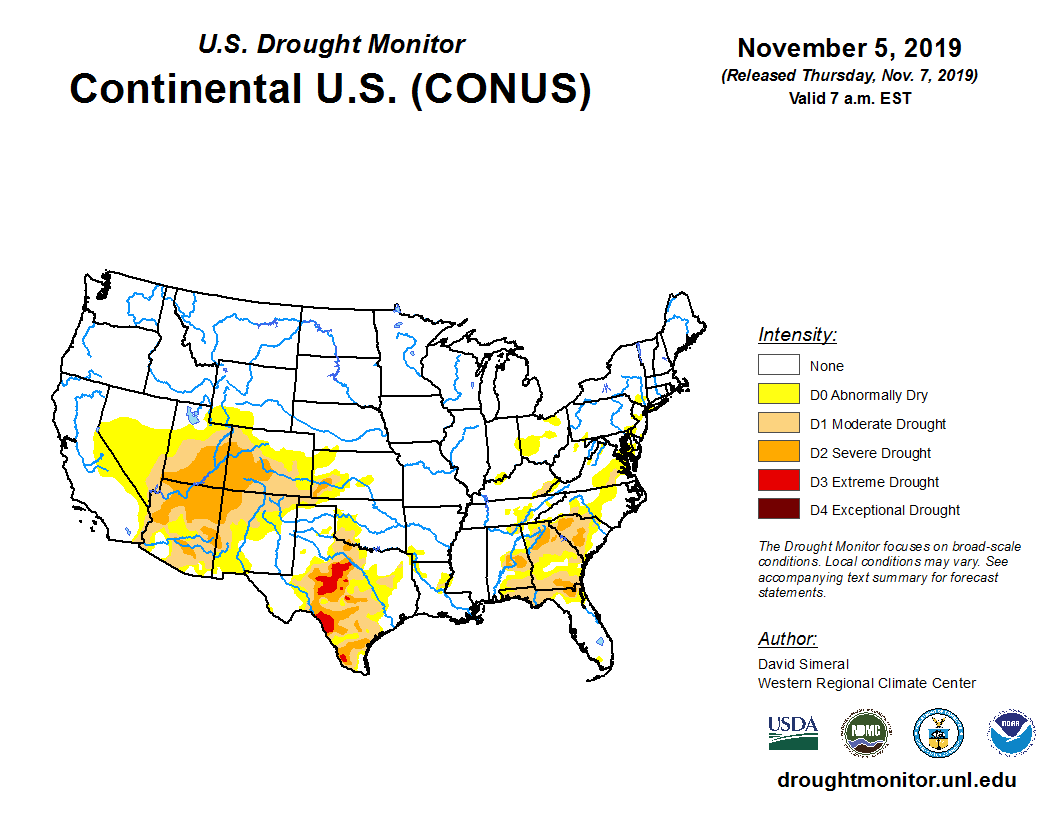
The 2020 monsoons failed Colorado another summer which helped feed very hot and dry conditions that led to widespread and intense forest fires that went into early Autumn, nowadays it seems October is just a continuation of summer. That was mostly the case the beginning of the water year until October 24-26 when a significant snow hit the mountains and valleys that began building of the WY2021 snowpack even though it largely ablated in many areas. This storm also brought very low temperatures but October overall was still drier and warmer than normal in Western Colorado. November was hit and miss throughout the state. At Senator Beck Study Basin (SBB) it was wetter than average by about and inch of precipitation, we received 4.9” for the month. Other regions that did well in November was the Rio Grande and northwards towards Leadville. A dry stretch prevailed latter November thru the first part of December that eventually gave way to an active weather pattern that produced two official back-to-back storms. December closed out with many Colorado River Basin SNOTEL stations below the 20th percentile for water year precipitation. January saw another long period of dry/warm conditions with the first 15 days of the month seeing only 2 days of precipitation at Swamp Angel Study Plot (SASP). The latter bit of January brought hope with four storms, nonetheless precipitation for the month was below normal. The fortunate green spot on the precipitation map was the Rio Grande and Arkansas Basins that managed to hold onto near median snowpack while the rest of Colorado struggled. A productive week of active storm systems in mid-February benefitted all of the Colorado Mountains. Over 6 days at Swamp Angel we observed 2” precipitation as 20” snow accumulation. Western Colorado in general saw 2”–4” of precipitation. March was respectable with four winter storms and near normal precipitation for the month at SBB but varied throughout the rest of the state. The Arkansas and South Platte Basins really shot up in snow accumulation while other basins held onto a steady increase, albeit still below normal.
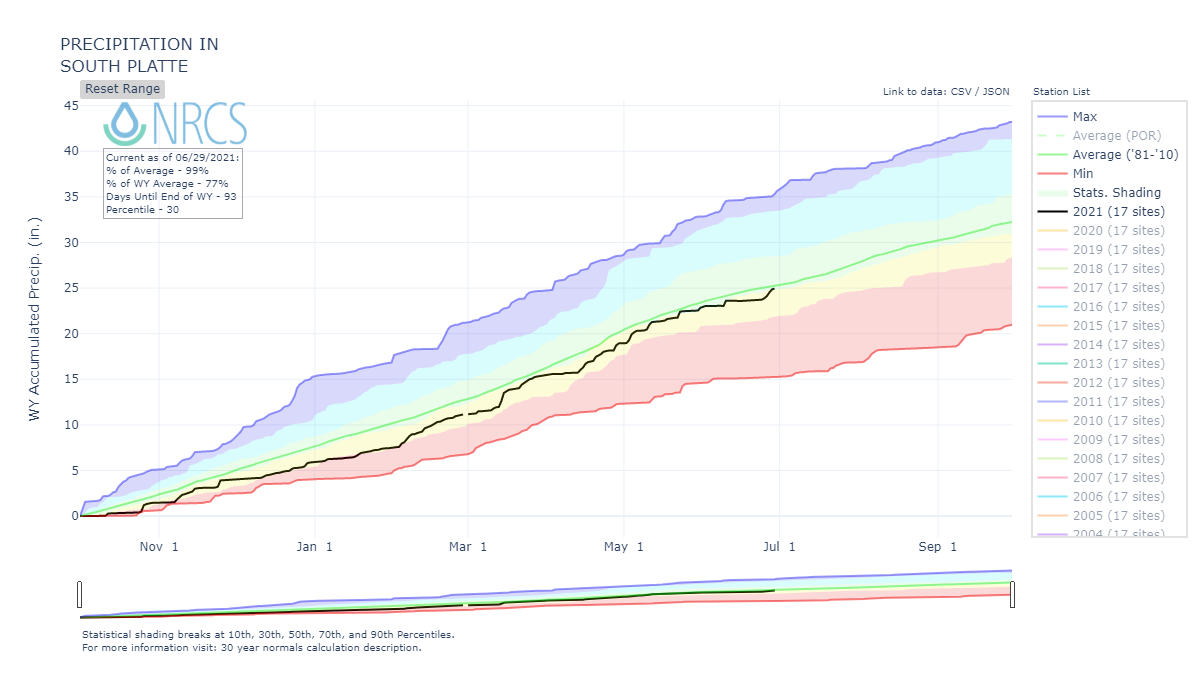
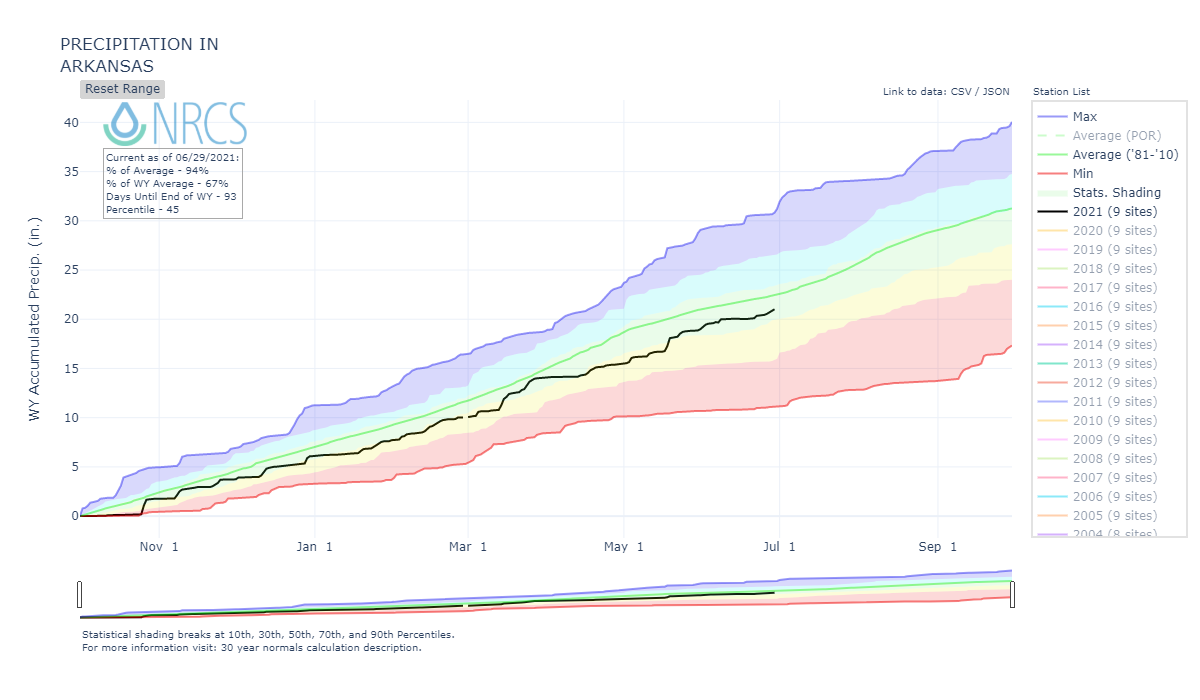
Beginning of April, at the time of normal peak accumulation, the majority of basins were well below normal SWE. The Arkansas and Rio Grande hit a slightly above normal peak SWE that was about 10 days before the usual time of peak. The South Platte was the real winner, hitting a near normal peak SWE right at the normal timeframe (April 25), but here is the crucial differentiator, the South Platte kept getting significant precipitation until mid-May which kept adding to the snowpack and delaying snowmelt to slightly past the normal ablation onset. In April, northeast Colorado was the only near normal part of the state and in May it expanded to the entire eastern half of Colorado (and San Luis Valley), while the rest of the state was intensely dry and hot.
These conditions, plus significant dust-on-snow across the state resulted in increased ablation (with high sublimation rates) of the snowpack. We witnessed above peak SWE conditions deteriorate rapidly with the decimation of the snowpack. Add to this soil moisture conditions in the Upper Colorado being generally in the bottom 5 worst years over the last 40 years, and the San Juan and Dolores in the bottom 3 of record dry years. A very large fraction of snowmelt went towards replenishing soil moisture conditions. Especially the first part of snowmelt season, runoff efficiency was very poor for the amount of snow in the Rio Grande and Arkansas particularly. Hydrographs in southern Colorado, and predominantly throughout the state, peaked when the mid-elevations (~11,000’) had almost completely melted out while the high elevations (>12,000’) kicked in, releasing it’s pulse of snowmelt. Peak discharge could have been about a weak earlier than what it ended up being, but a storm on May 21 delivered 1’ of snow at SBB and plentiful precipitation in the southern and eastern mountains.
Dust-on-snow events occurred October 25, March 9, March 20, March 29, April 14, April 21, and May 22. The first event (D1) was early season and entrained in a storm track that was kicked up in the Four Corners Region and when it arrived at Red Mountain Pass we recorded gusts over 100 mph at our Putney station. The second event on March 9 appeared to be a moderate event was relatively discreet in the snowpack. The next event D3 was 10 days later and was immediately covered with 6” of snow. Dust event number 4 was a dry event - occurring without precipitation - and sat about 12” above D3 when it was deposited. D5 was a significant event that covered the entire state. April 21 dust was not really notable as it was deposited during a very windy period of springtime where light dust may have arrived at various times unnoticed. The May 22 event was a very noticeable dirtying of the snow surface in southern Colorado, sustained high winds for over 18 hours brought plentiful dust to the remaining snowpack - it covered cars and all else in the Four Corner region going as far north as Montrose. In a rather rare event that did not include the Four Corners region, on March 13-14 the Front Range was hit with a snow storm that included dust from Mexico that many people noticed and documented. This dust came straight up the Front Range and curled west, hitting the front range mountains and swinging to the northwest as far as Steamboat.
MONTHLY WEATHER CONDITIONS
October Weather Summary
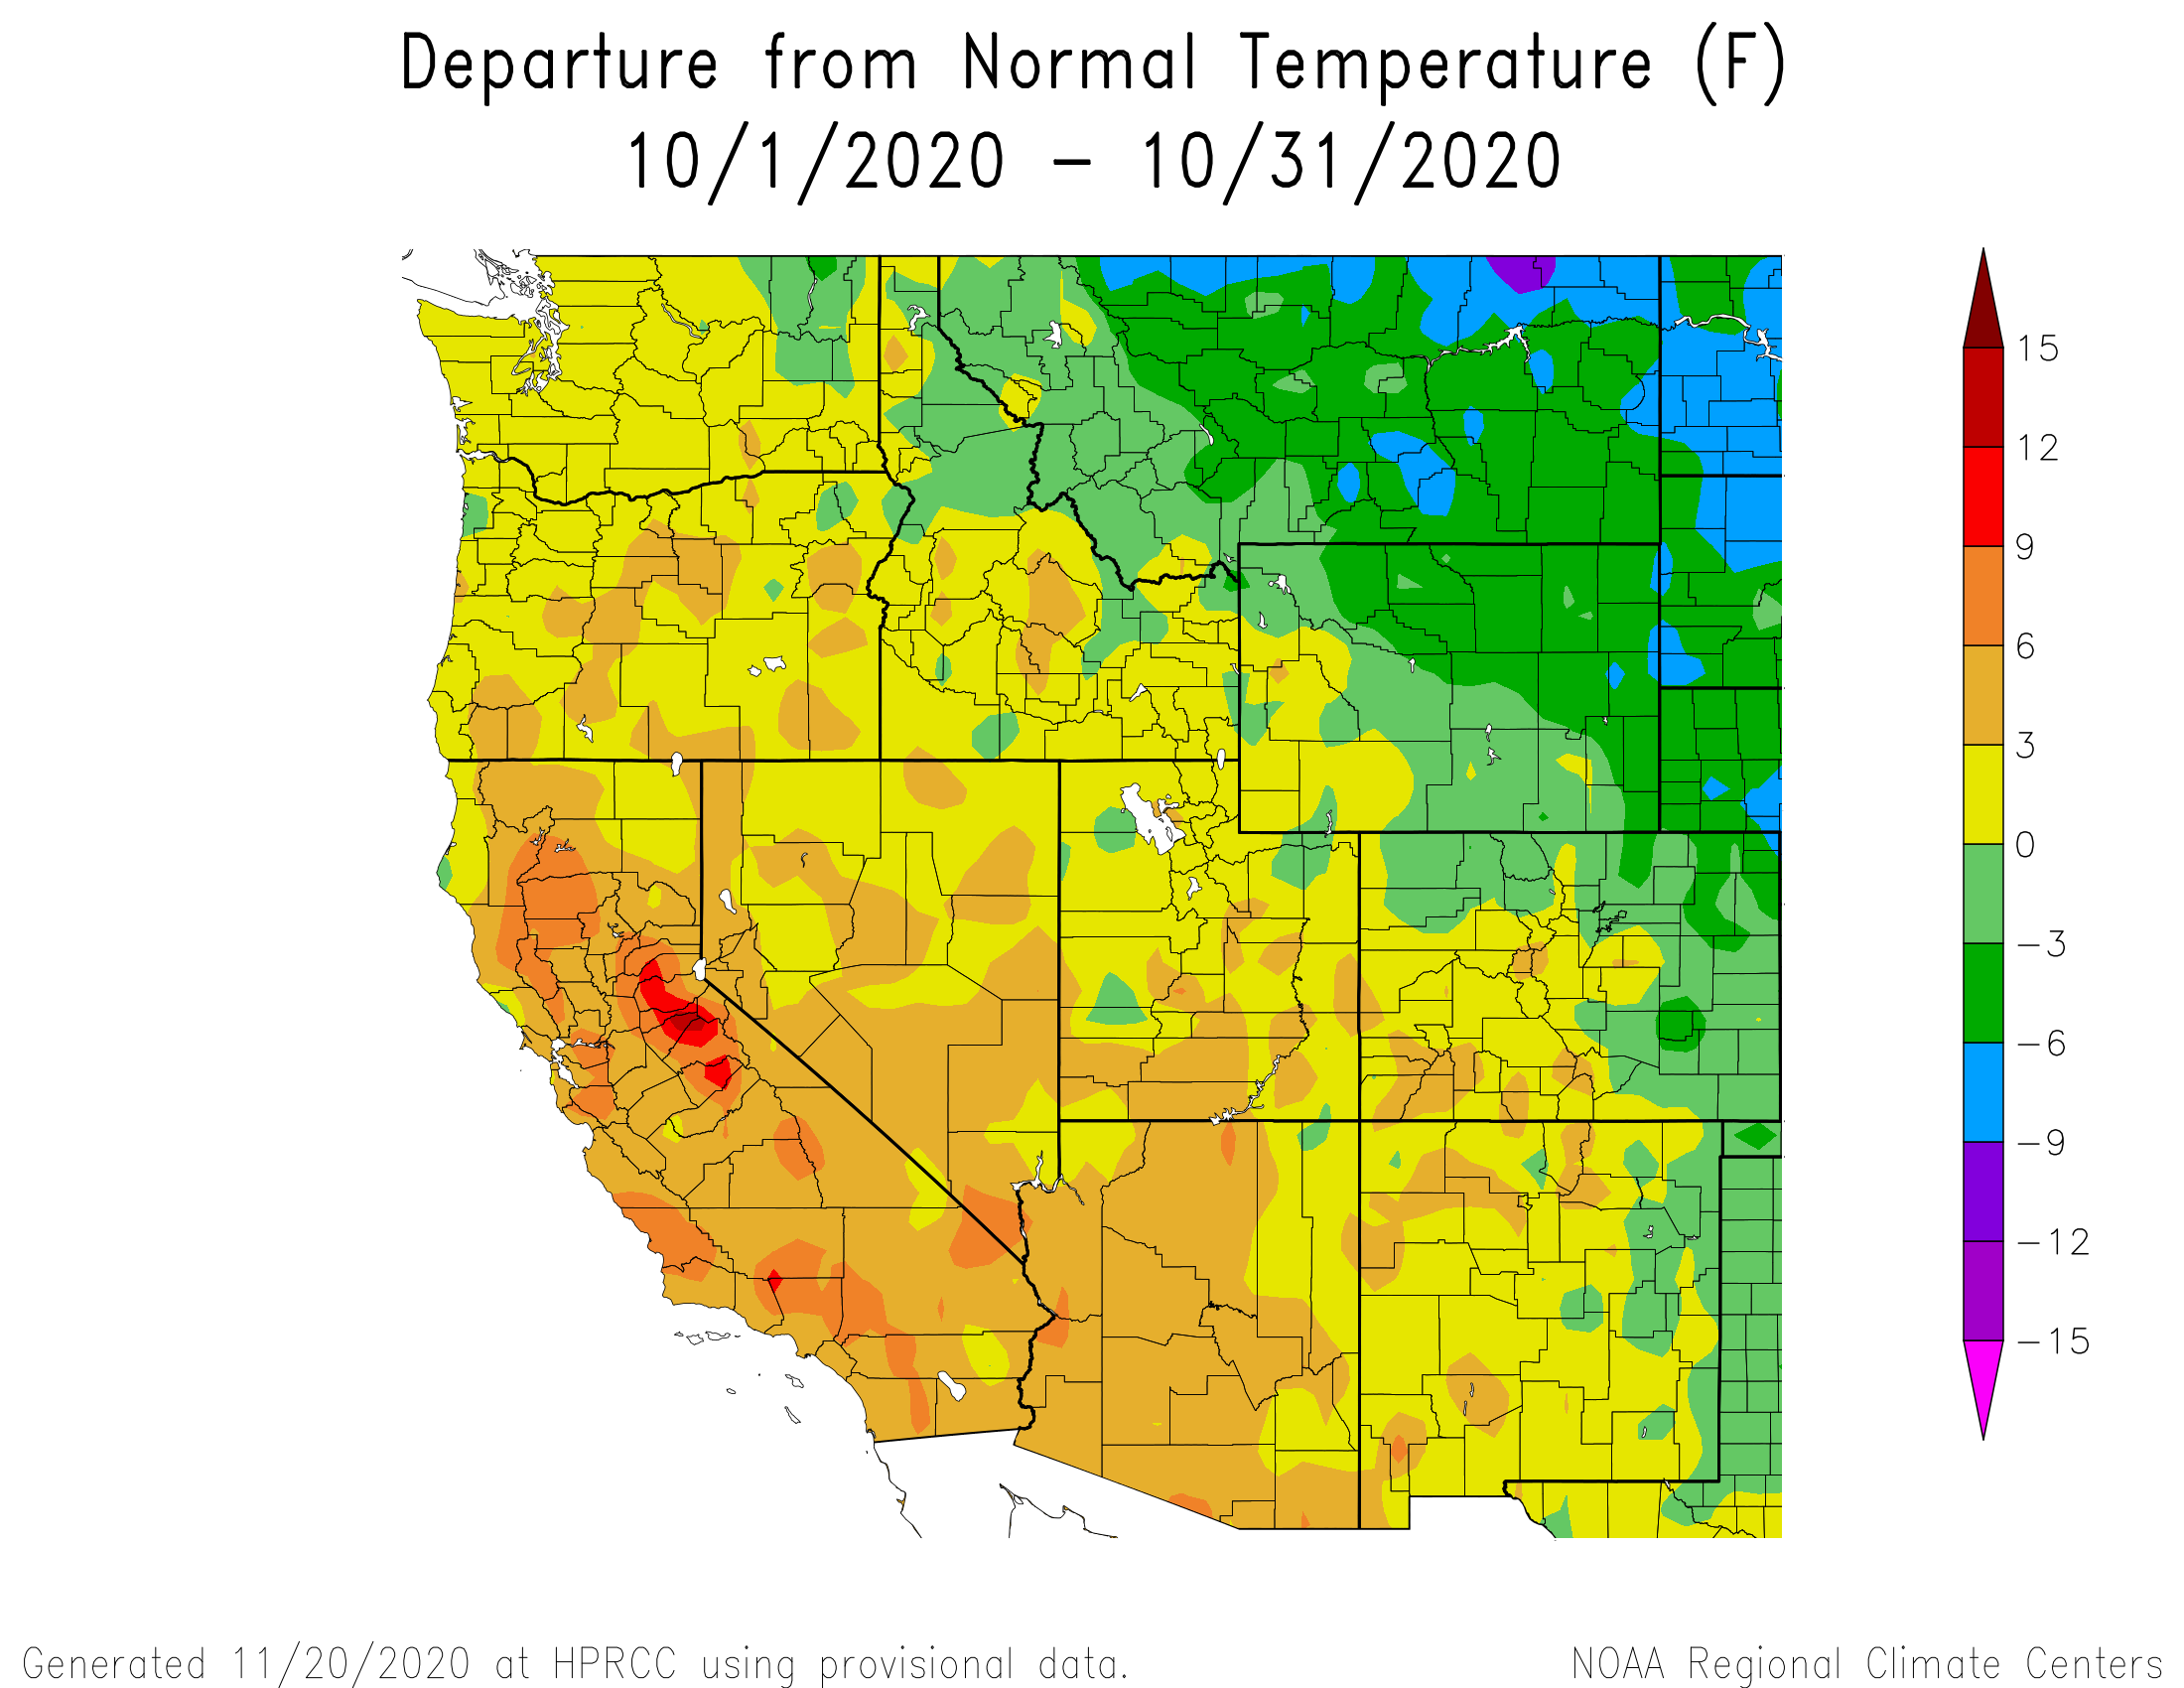
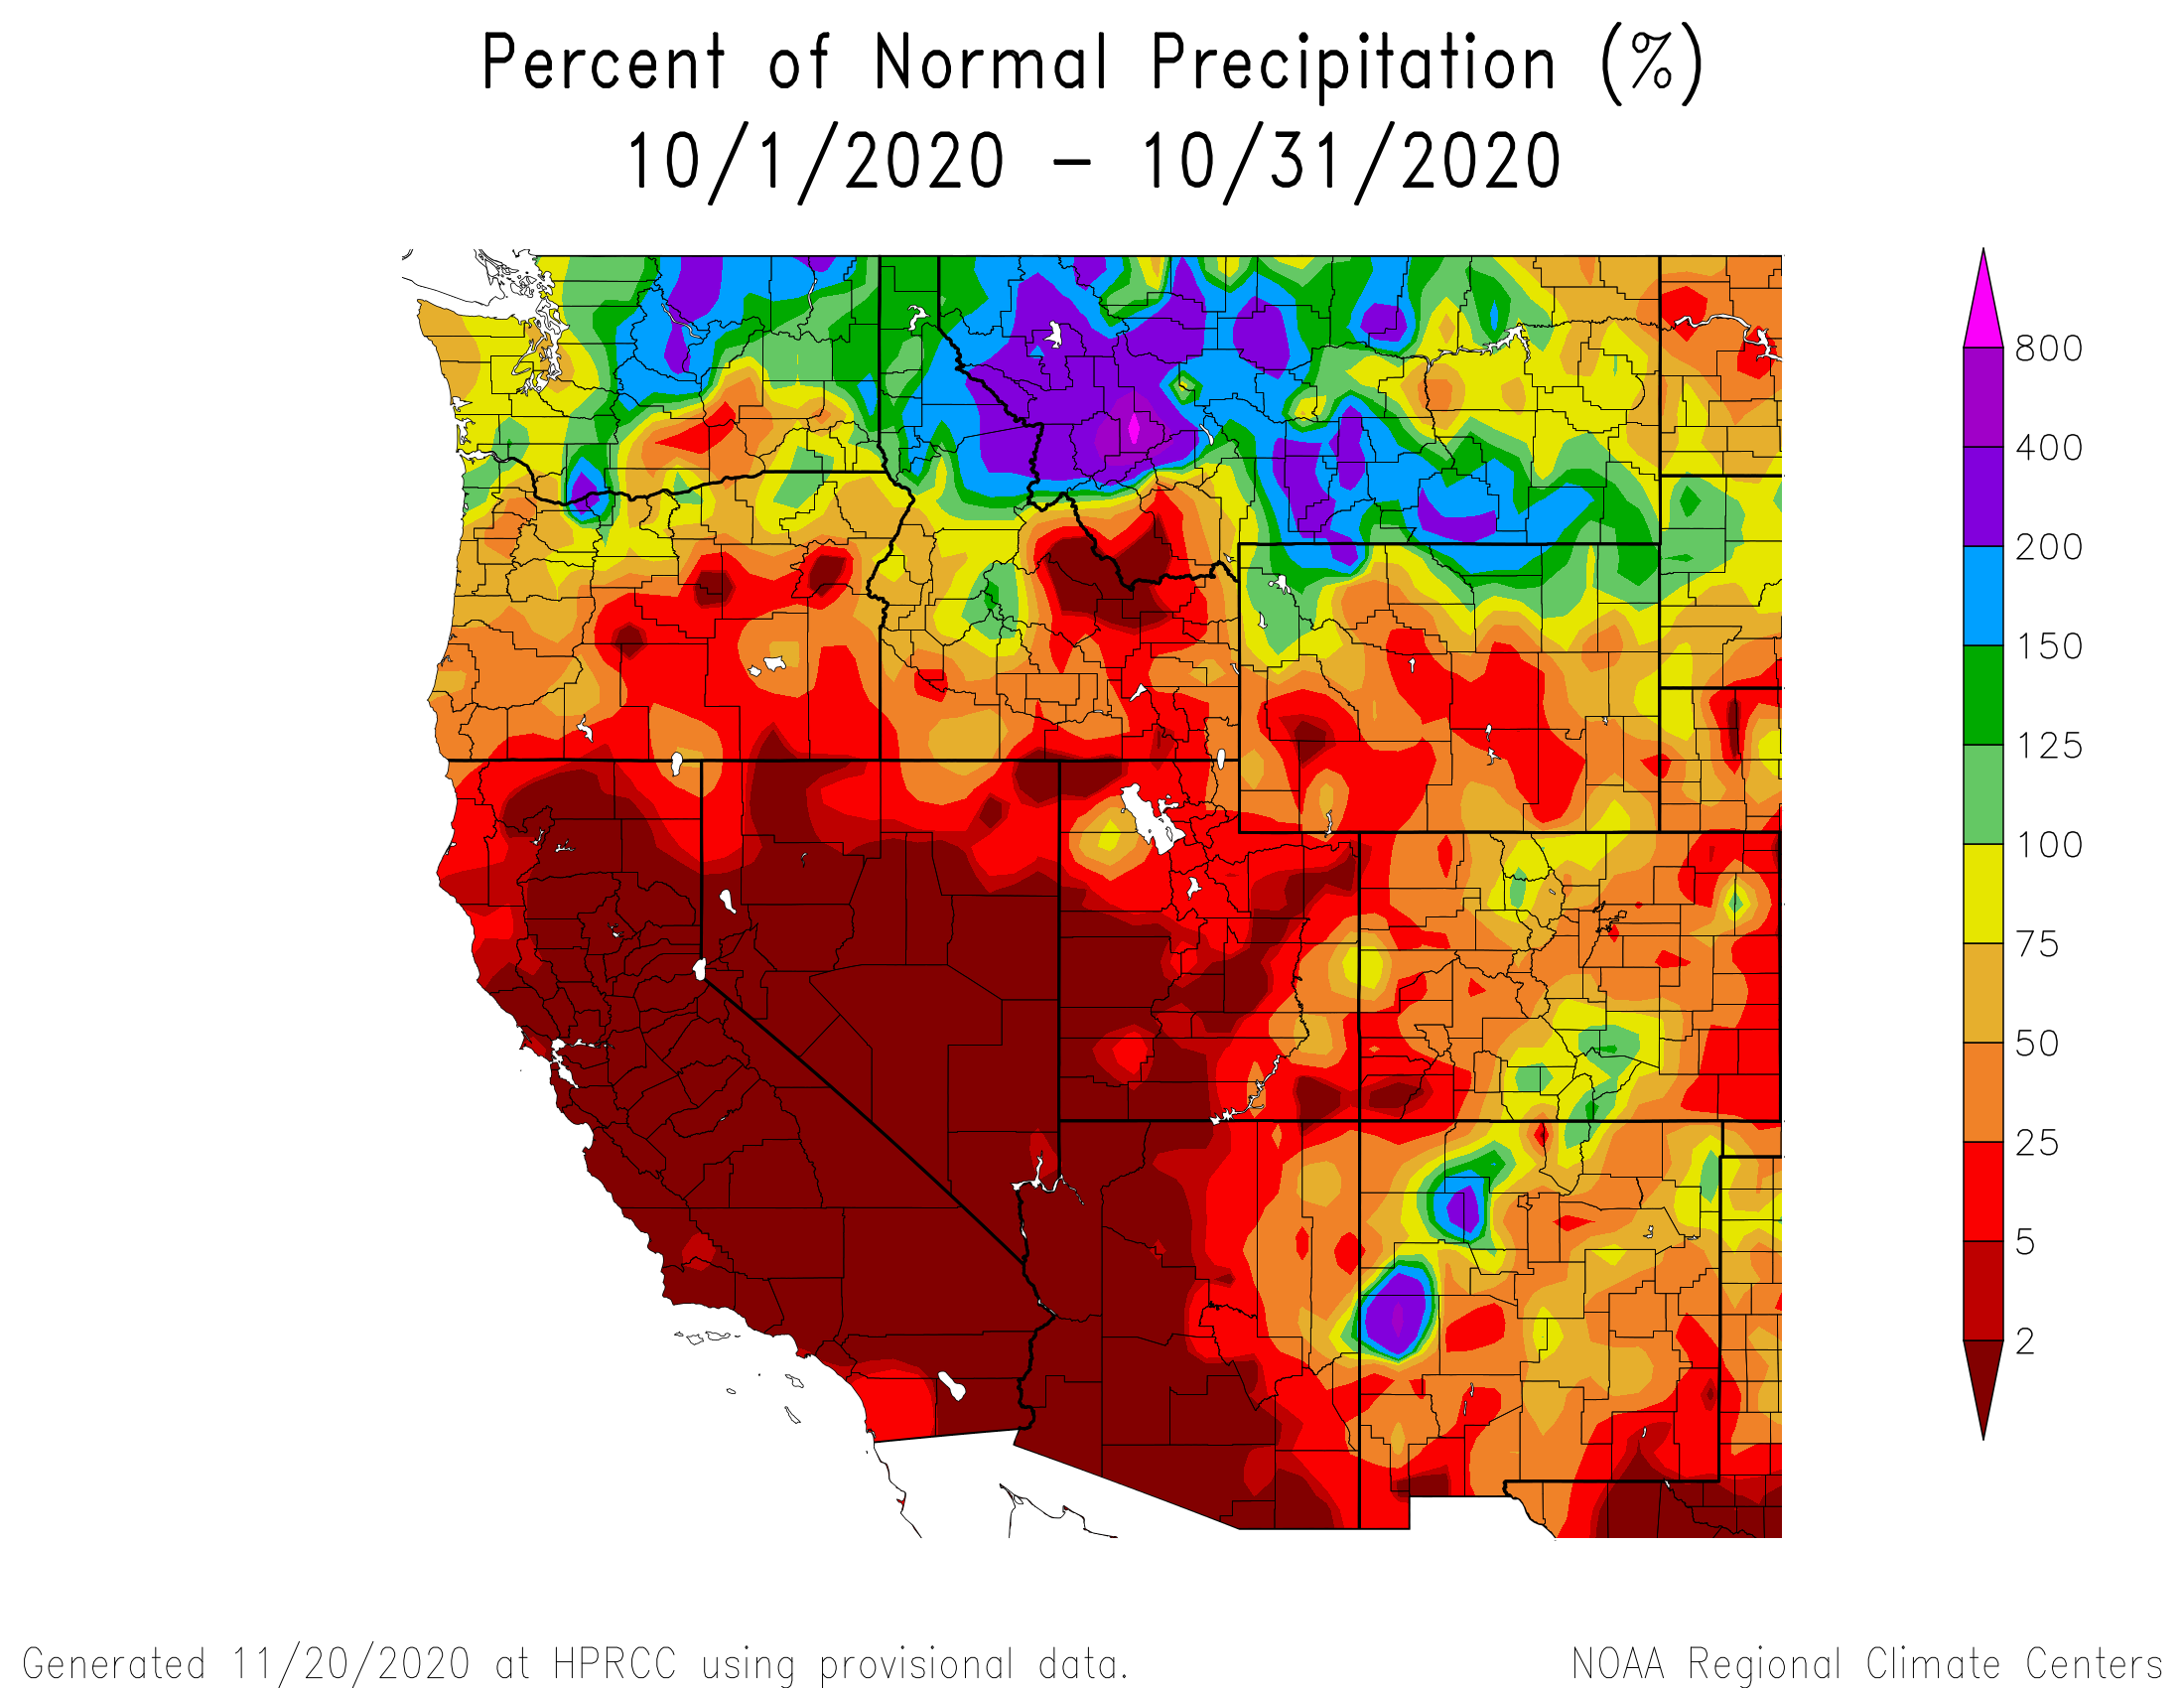
The first two-thirds of October was the usual continuation of summertime, hot and dry, before a storm and dynamic cold front moved through the region on October 24-26. This was the beginnings of the snowpack (0.7” at Swamp Angel) as significant snow fell in the mountains and some valleys. As this storm passed cold temperatures moved in breaking low records and abruptly ended valley agriculture. A warming and dry trend closed out the month. It was hotter (0.5 – 3.0 degrees) and drier than normal overall.
November Weather Summary
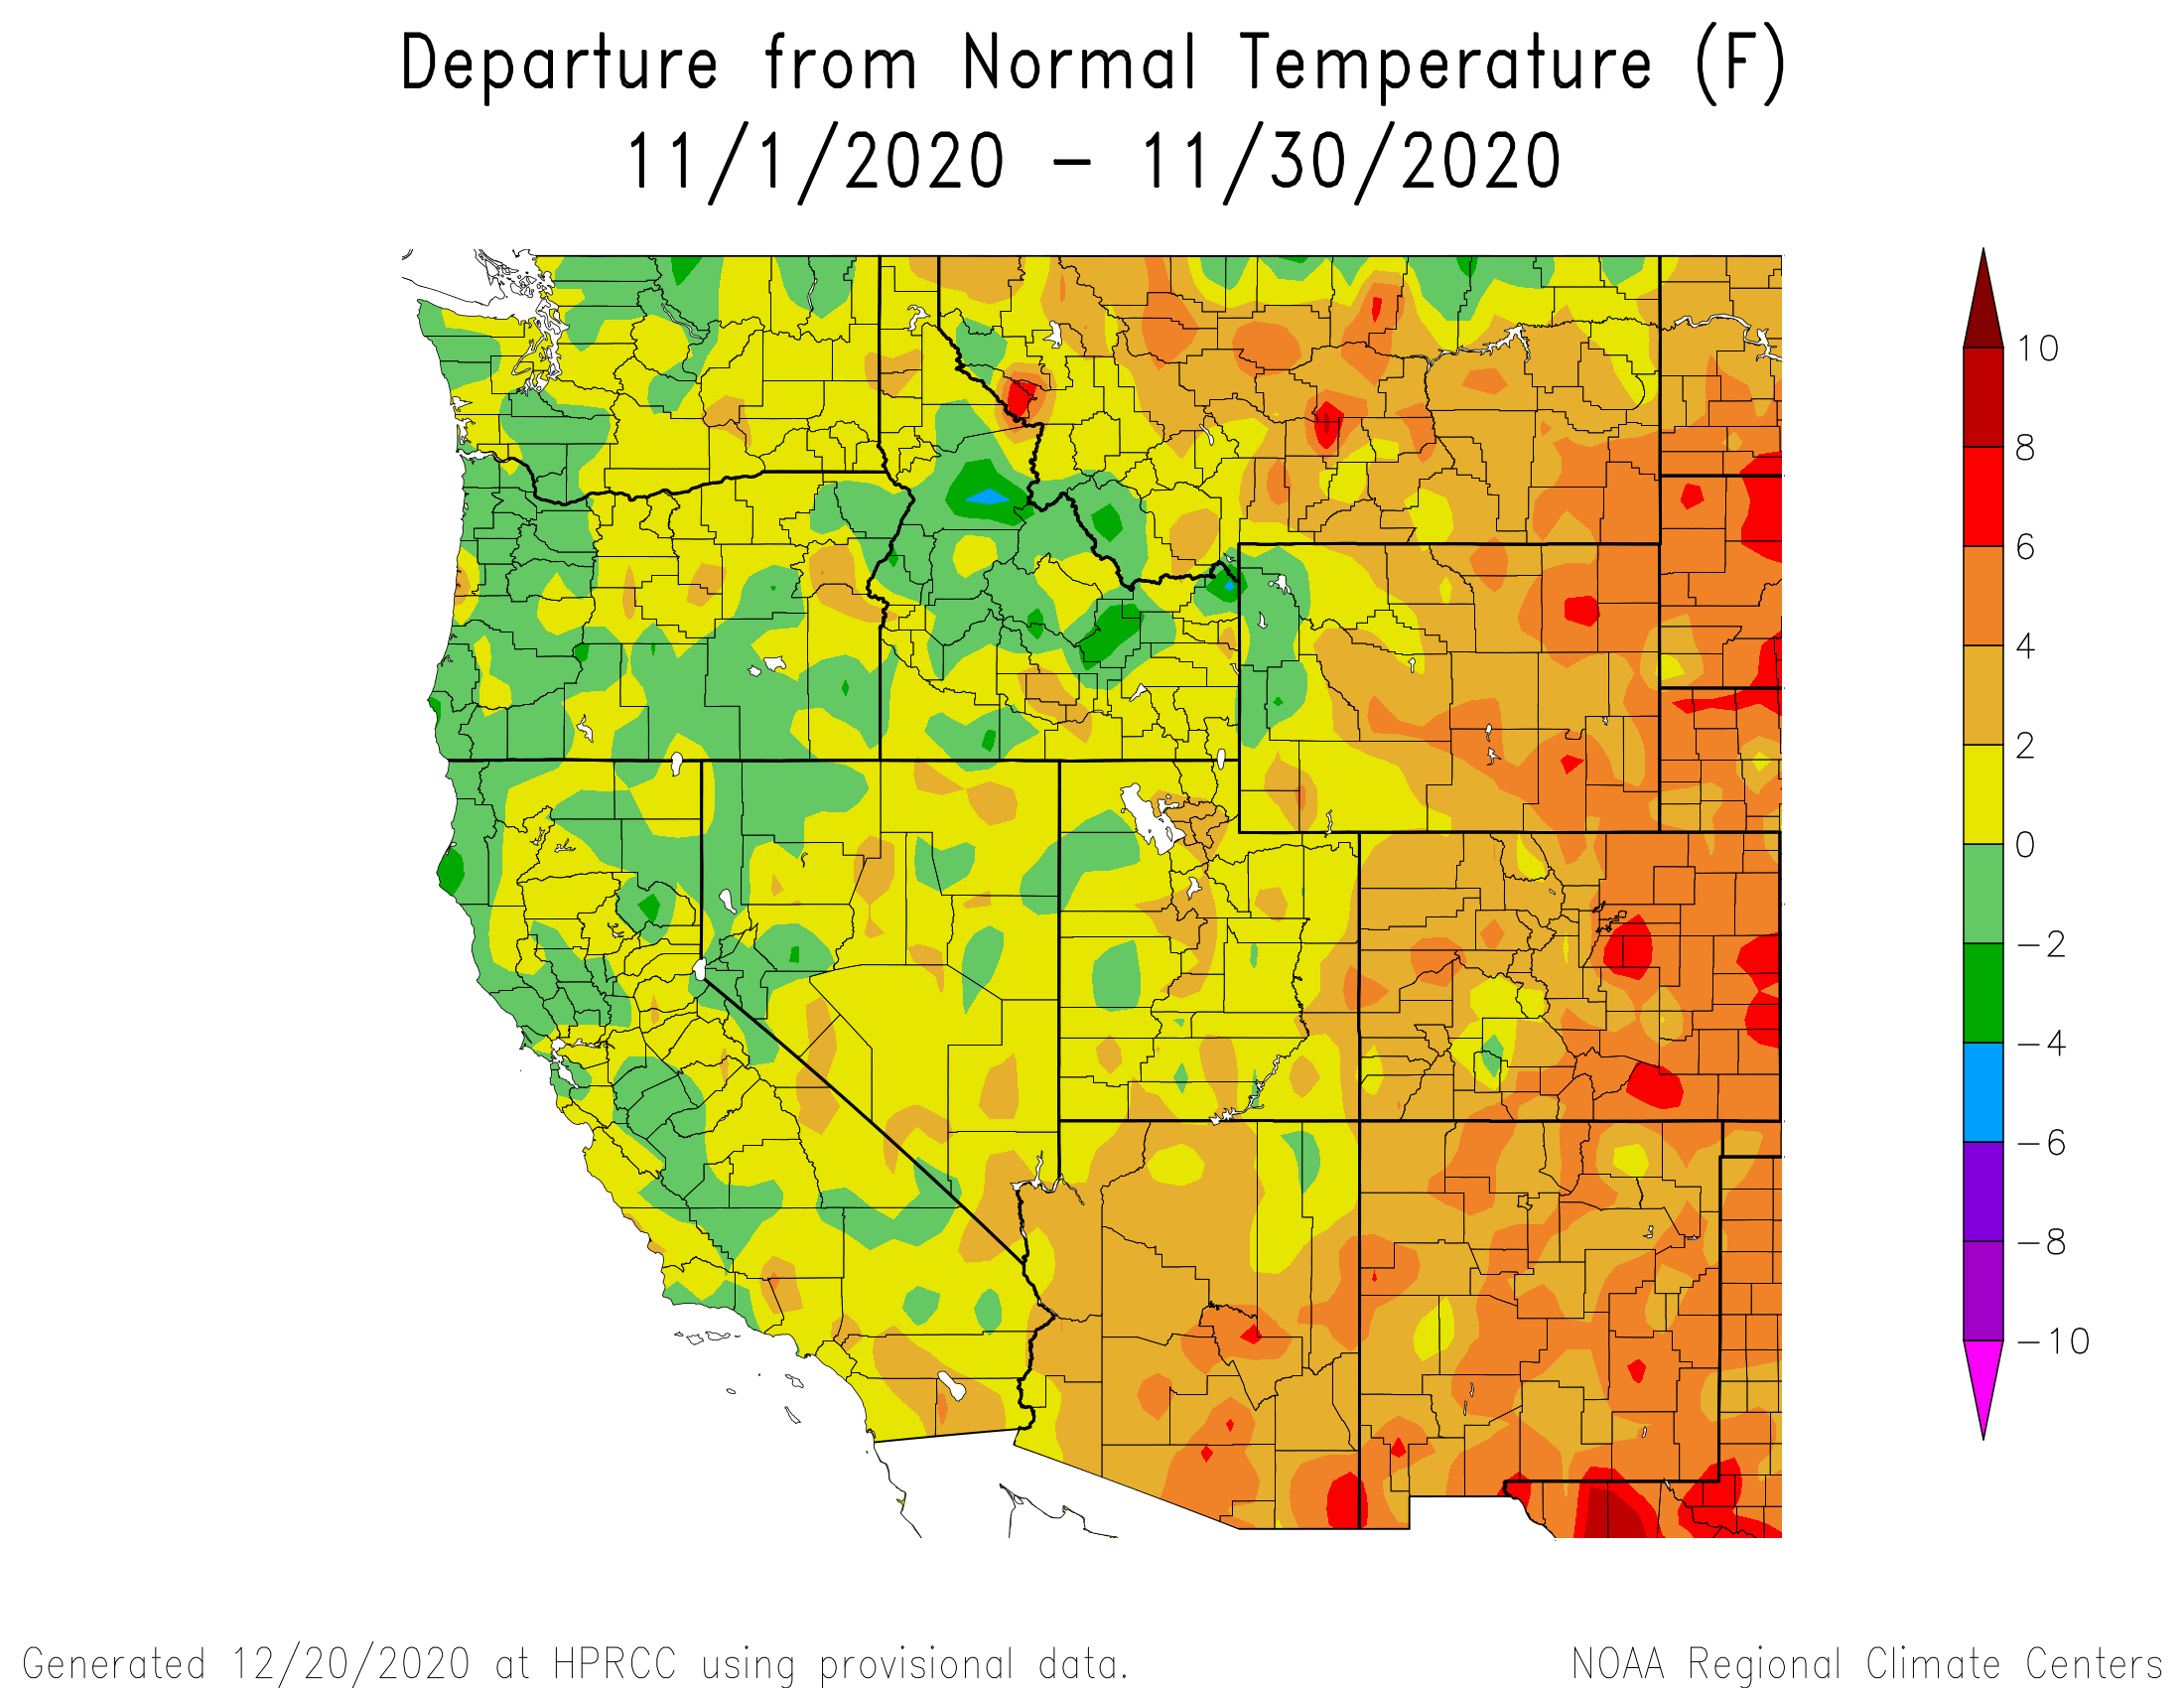
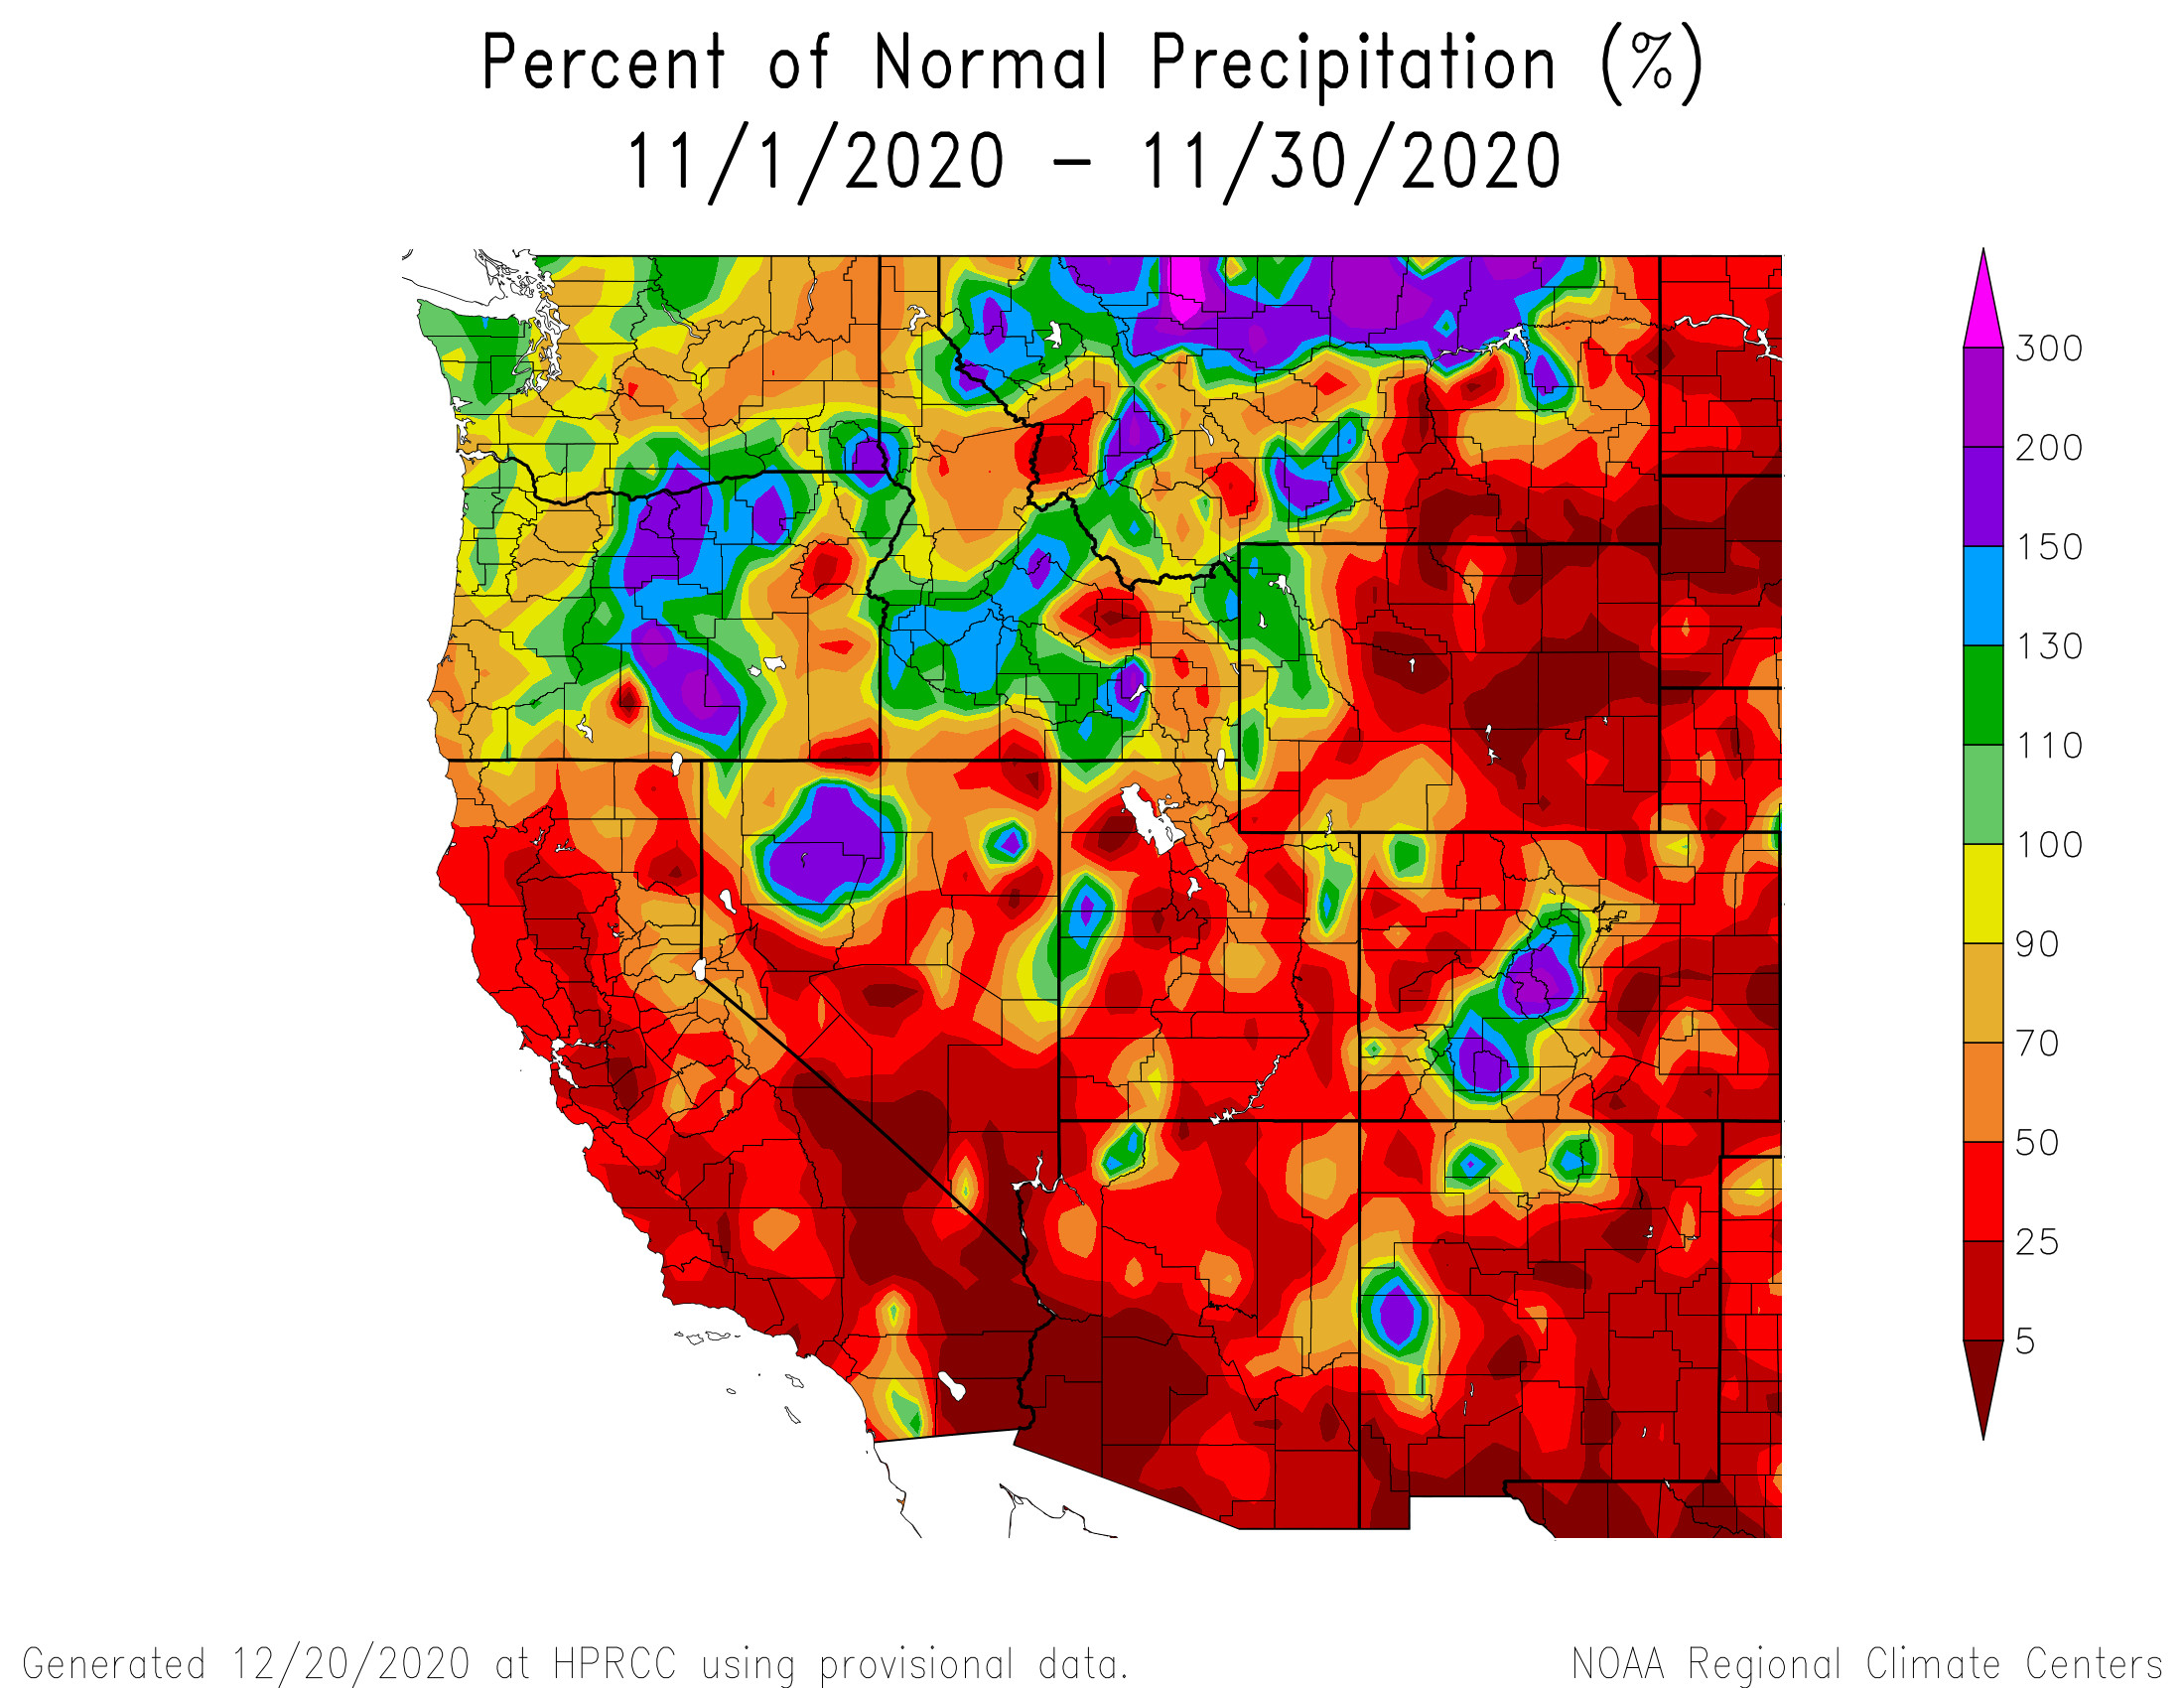
The first week of November continued the warming trend carried over from the end of October. November 8 started off a week that delivered 3.1” precipitation as 16” snow accumulation at Swampy. Warm and dry conditions prevailed for another week until Nov 22-24 when decent accumulation across the Colorado mountains occurred, at Swampy that meant 1.1” precipitation.
December Weather Summary
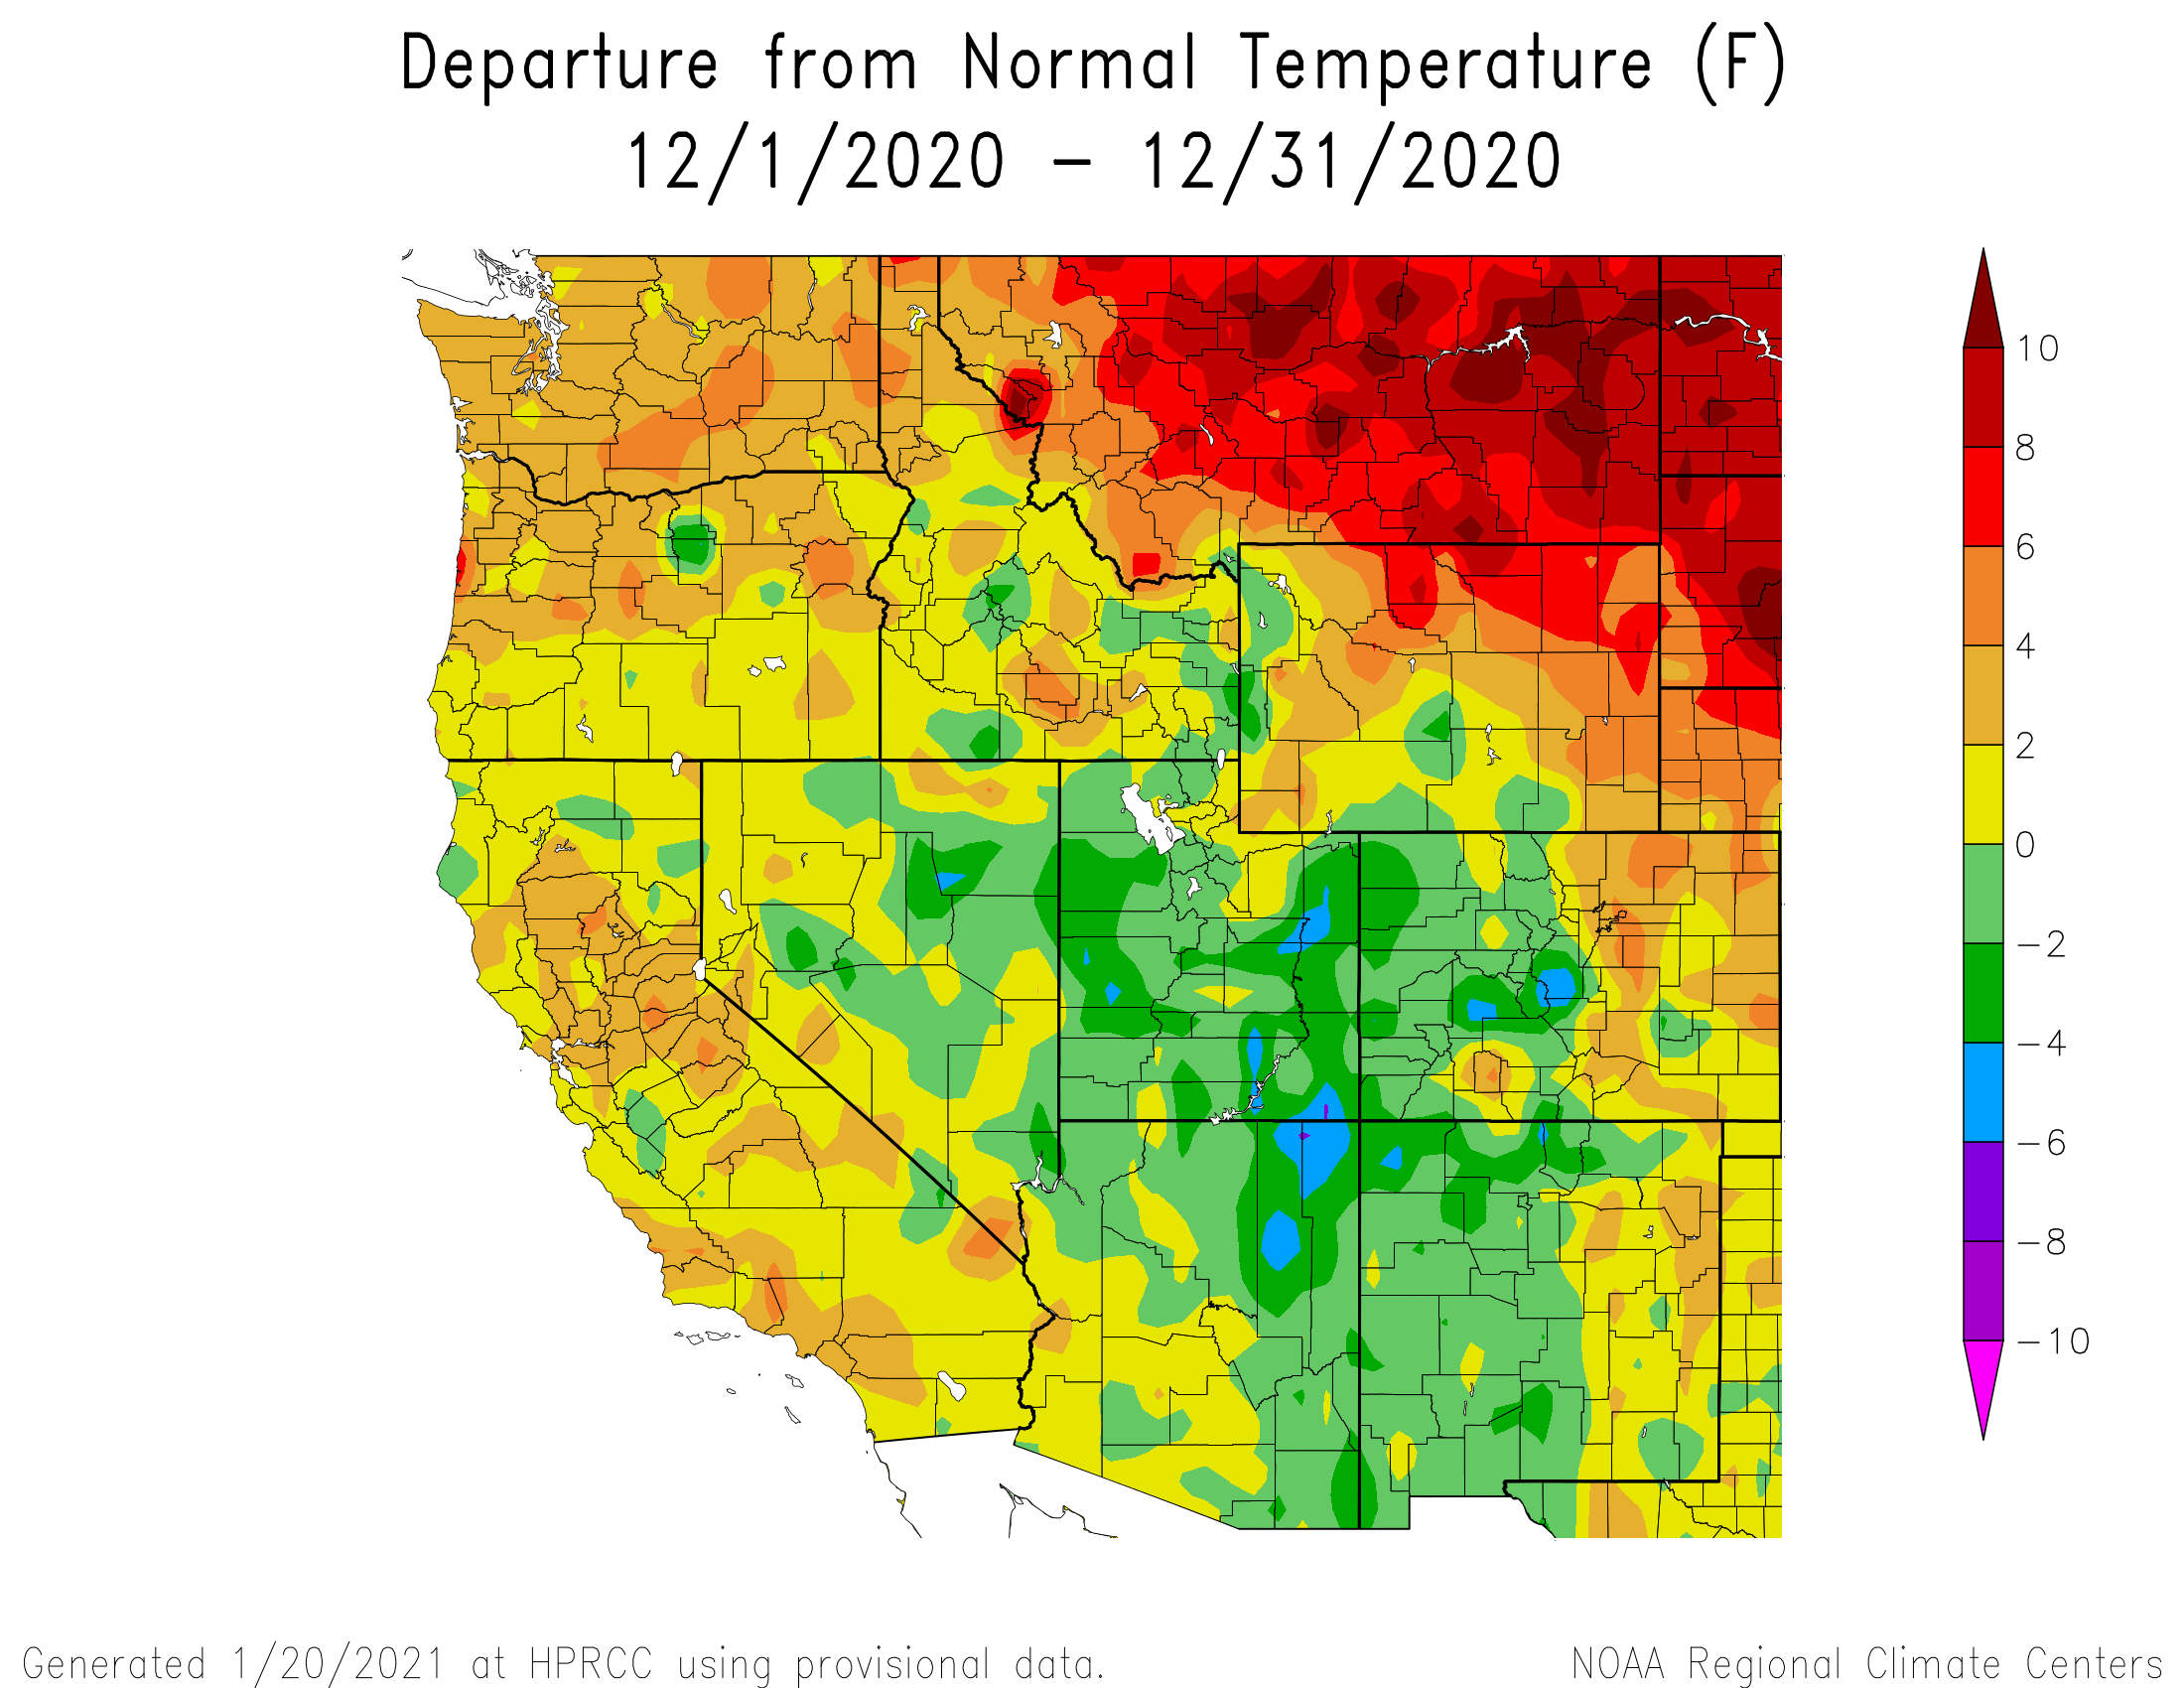
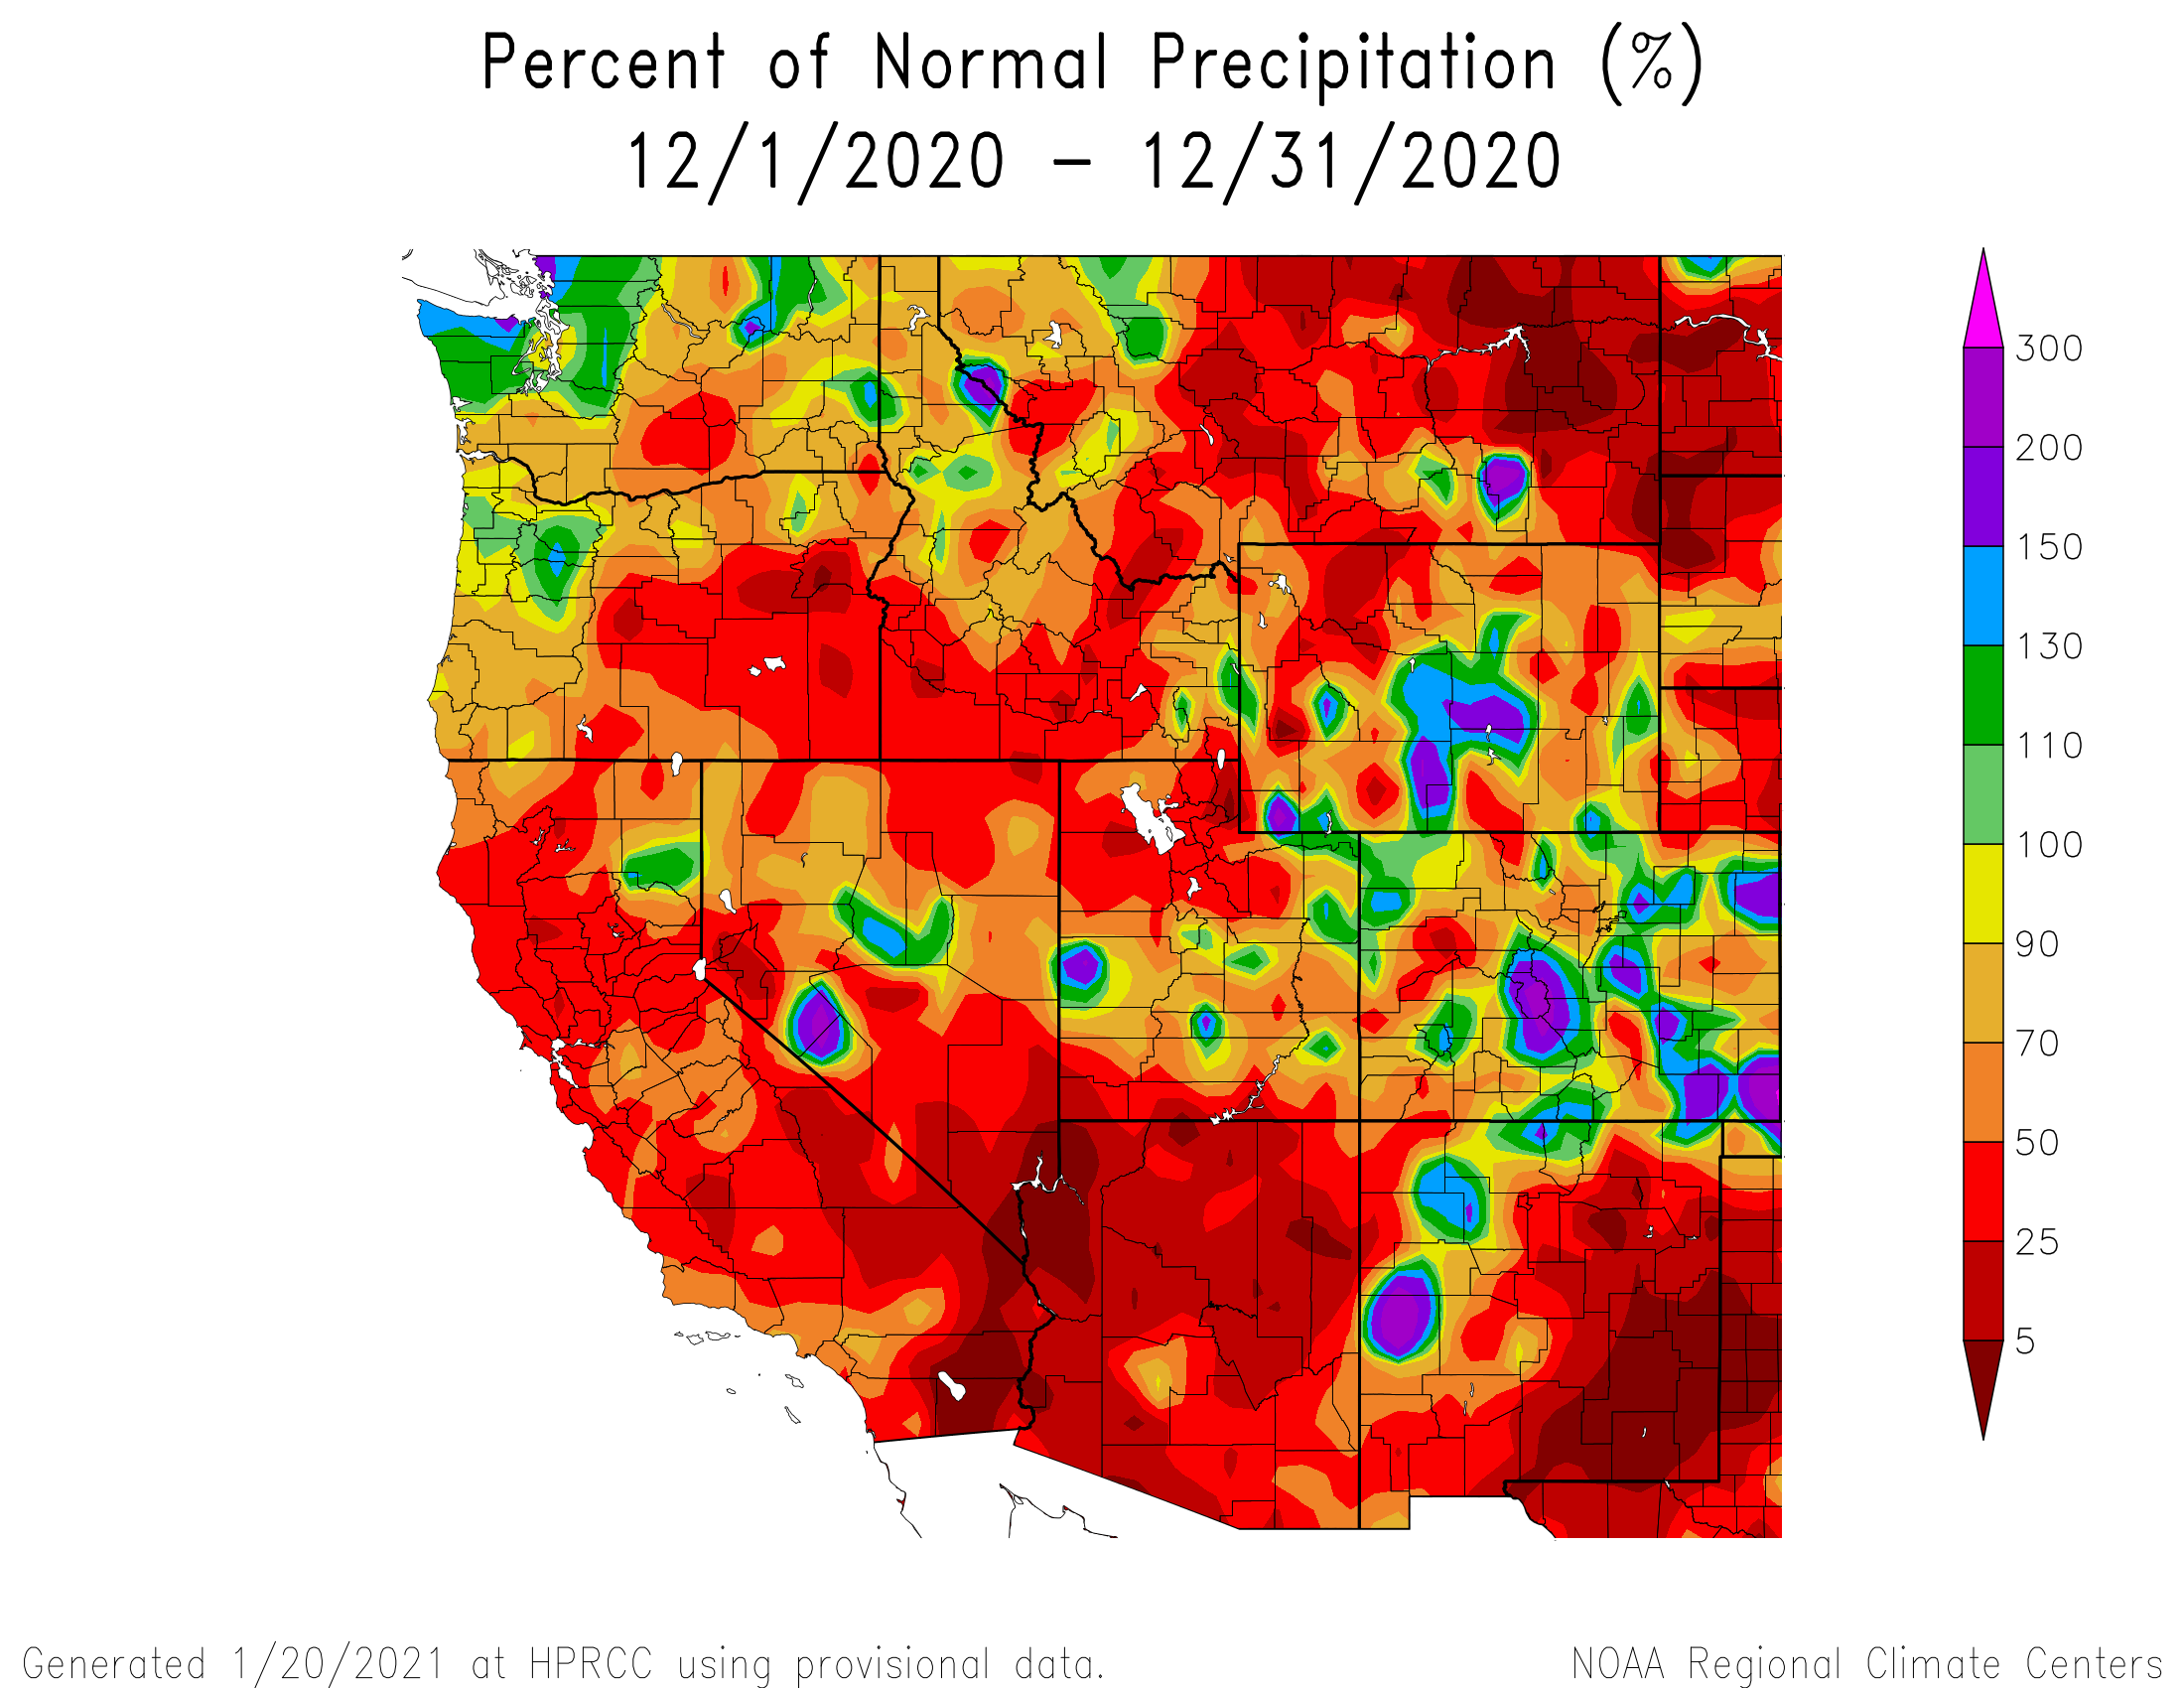
Another dry and warm stretch with only 3 days of measurable precipitation from Nov 25 – Dec 11. A fortunate period of active weather ensued but it only amounted to two official storms at SBB for the entire month of December. By the end of the month many SNOTEL stations in the Colorado River Basin were below the 20th percentile for water year precipitation. The period from April-December was one of the driest on record.
January Weather Summary
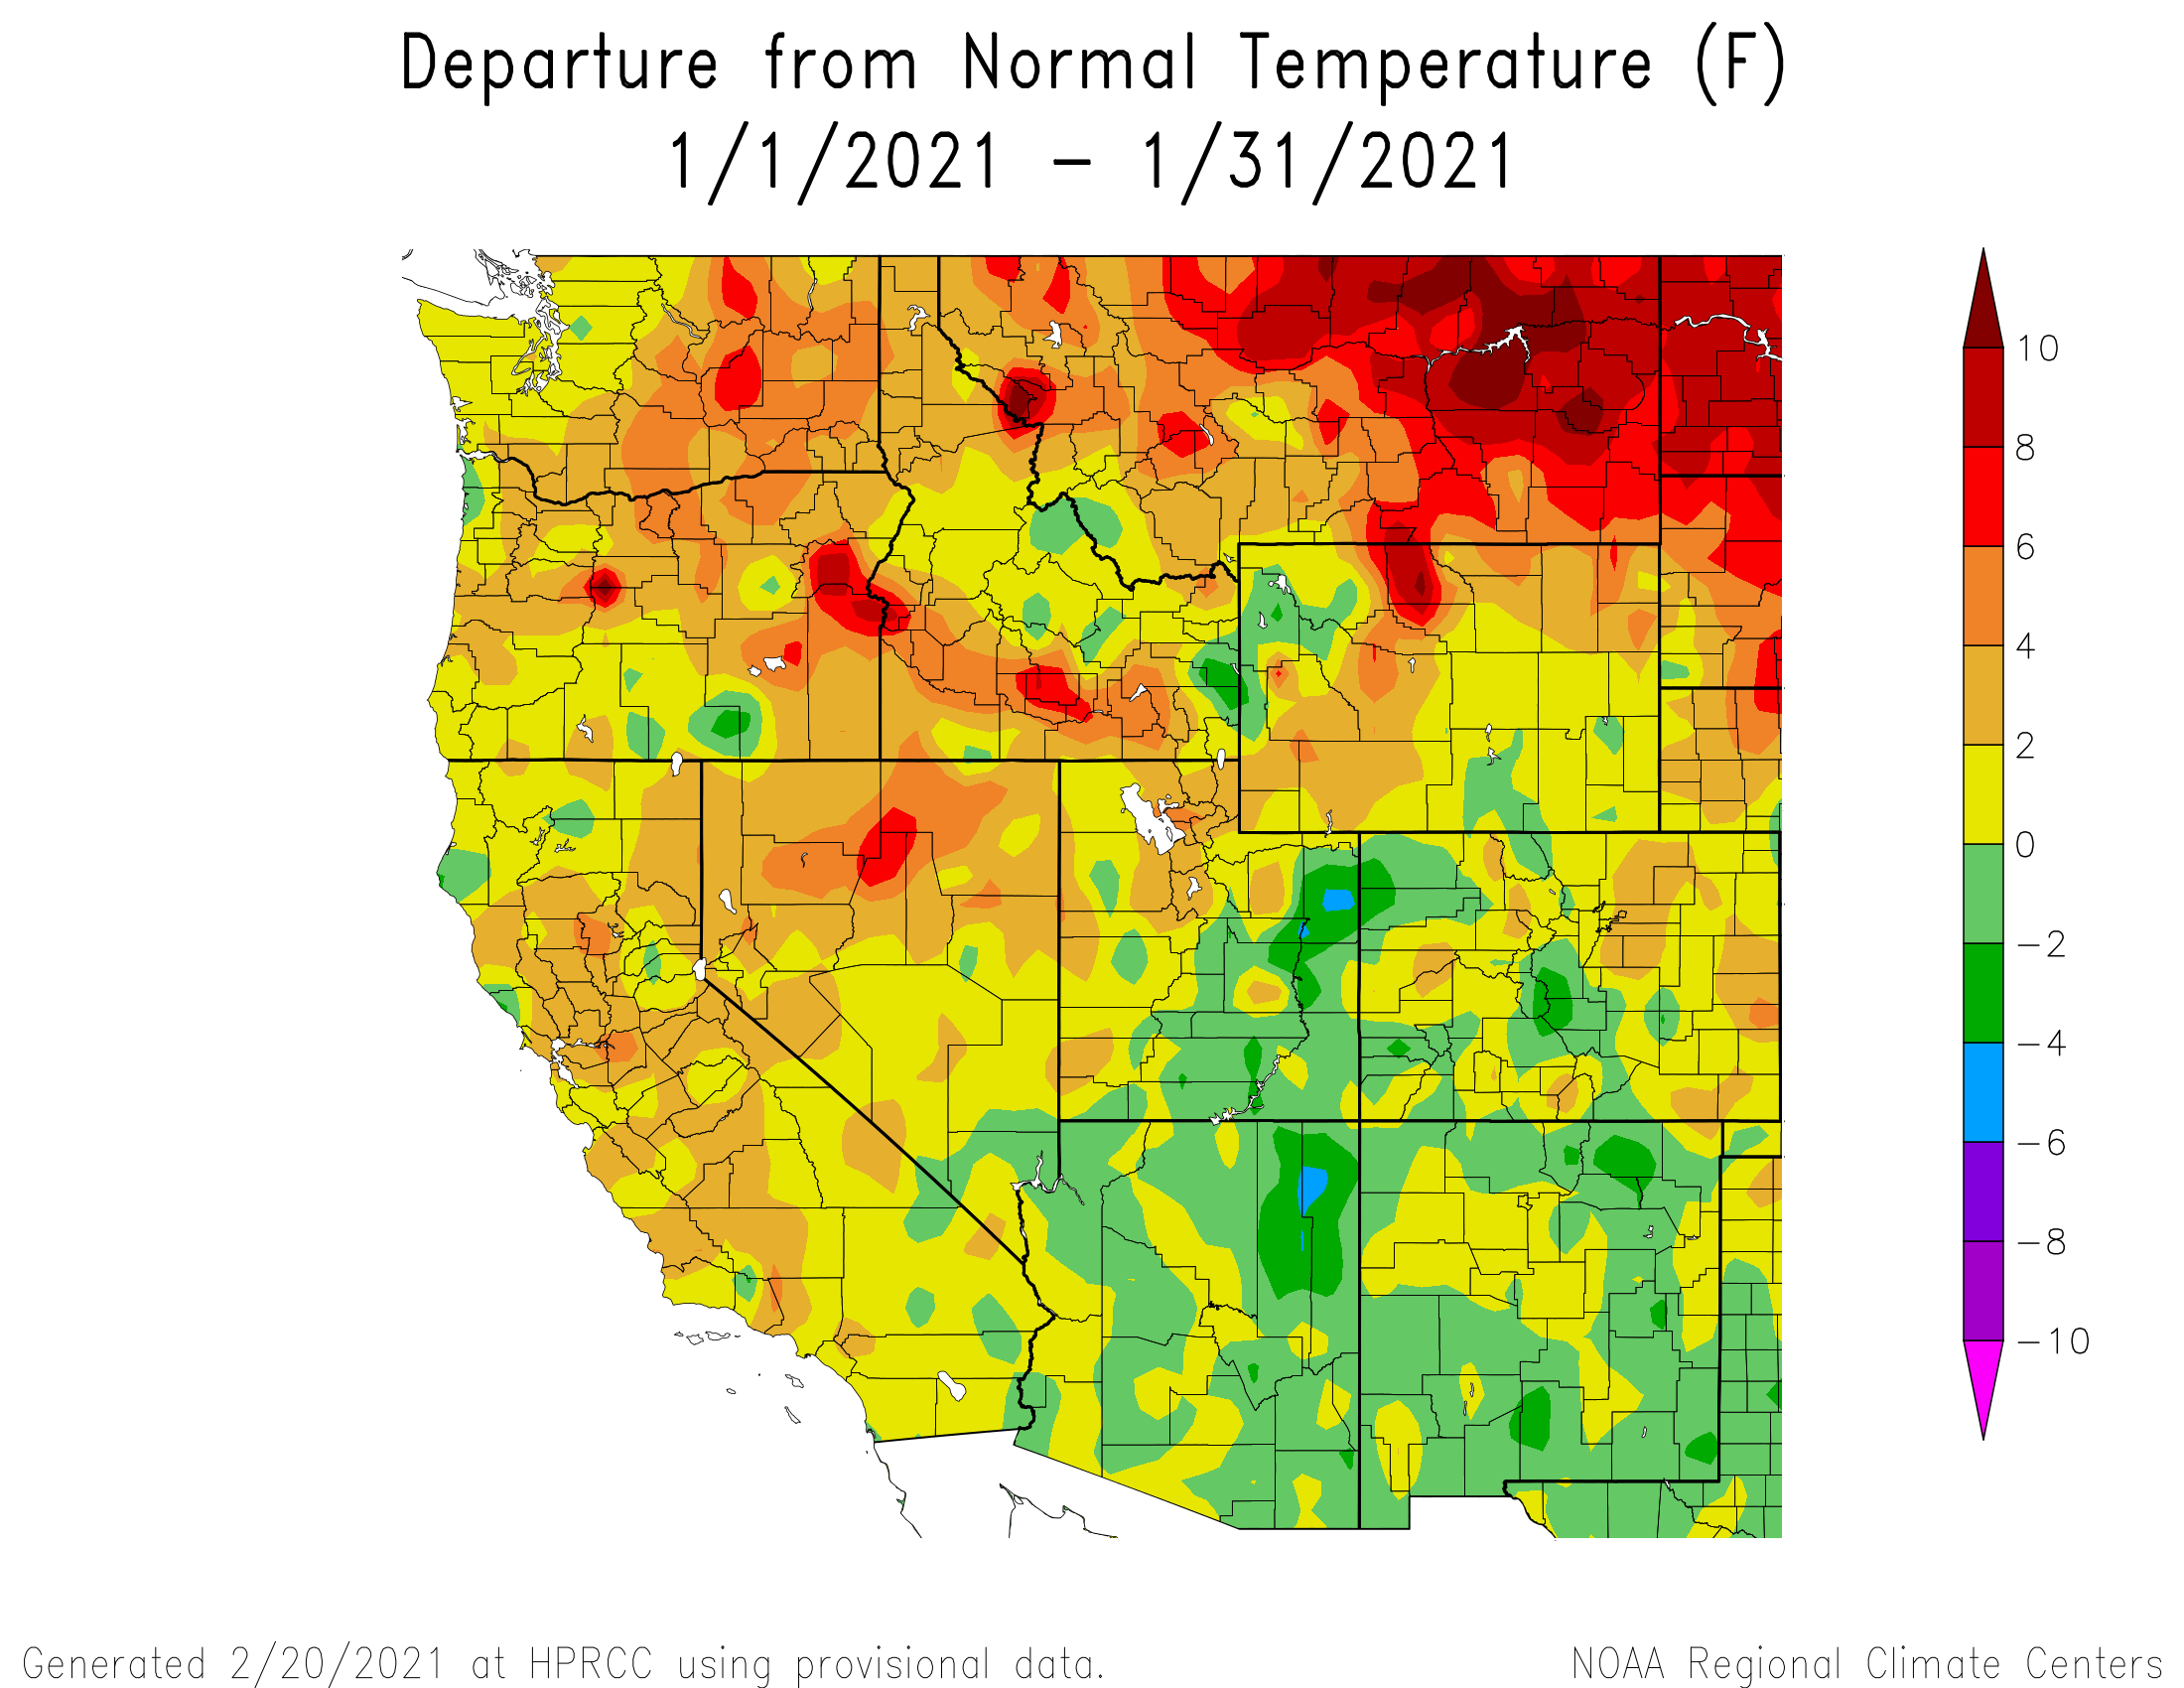
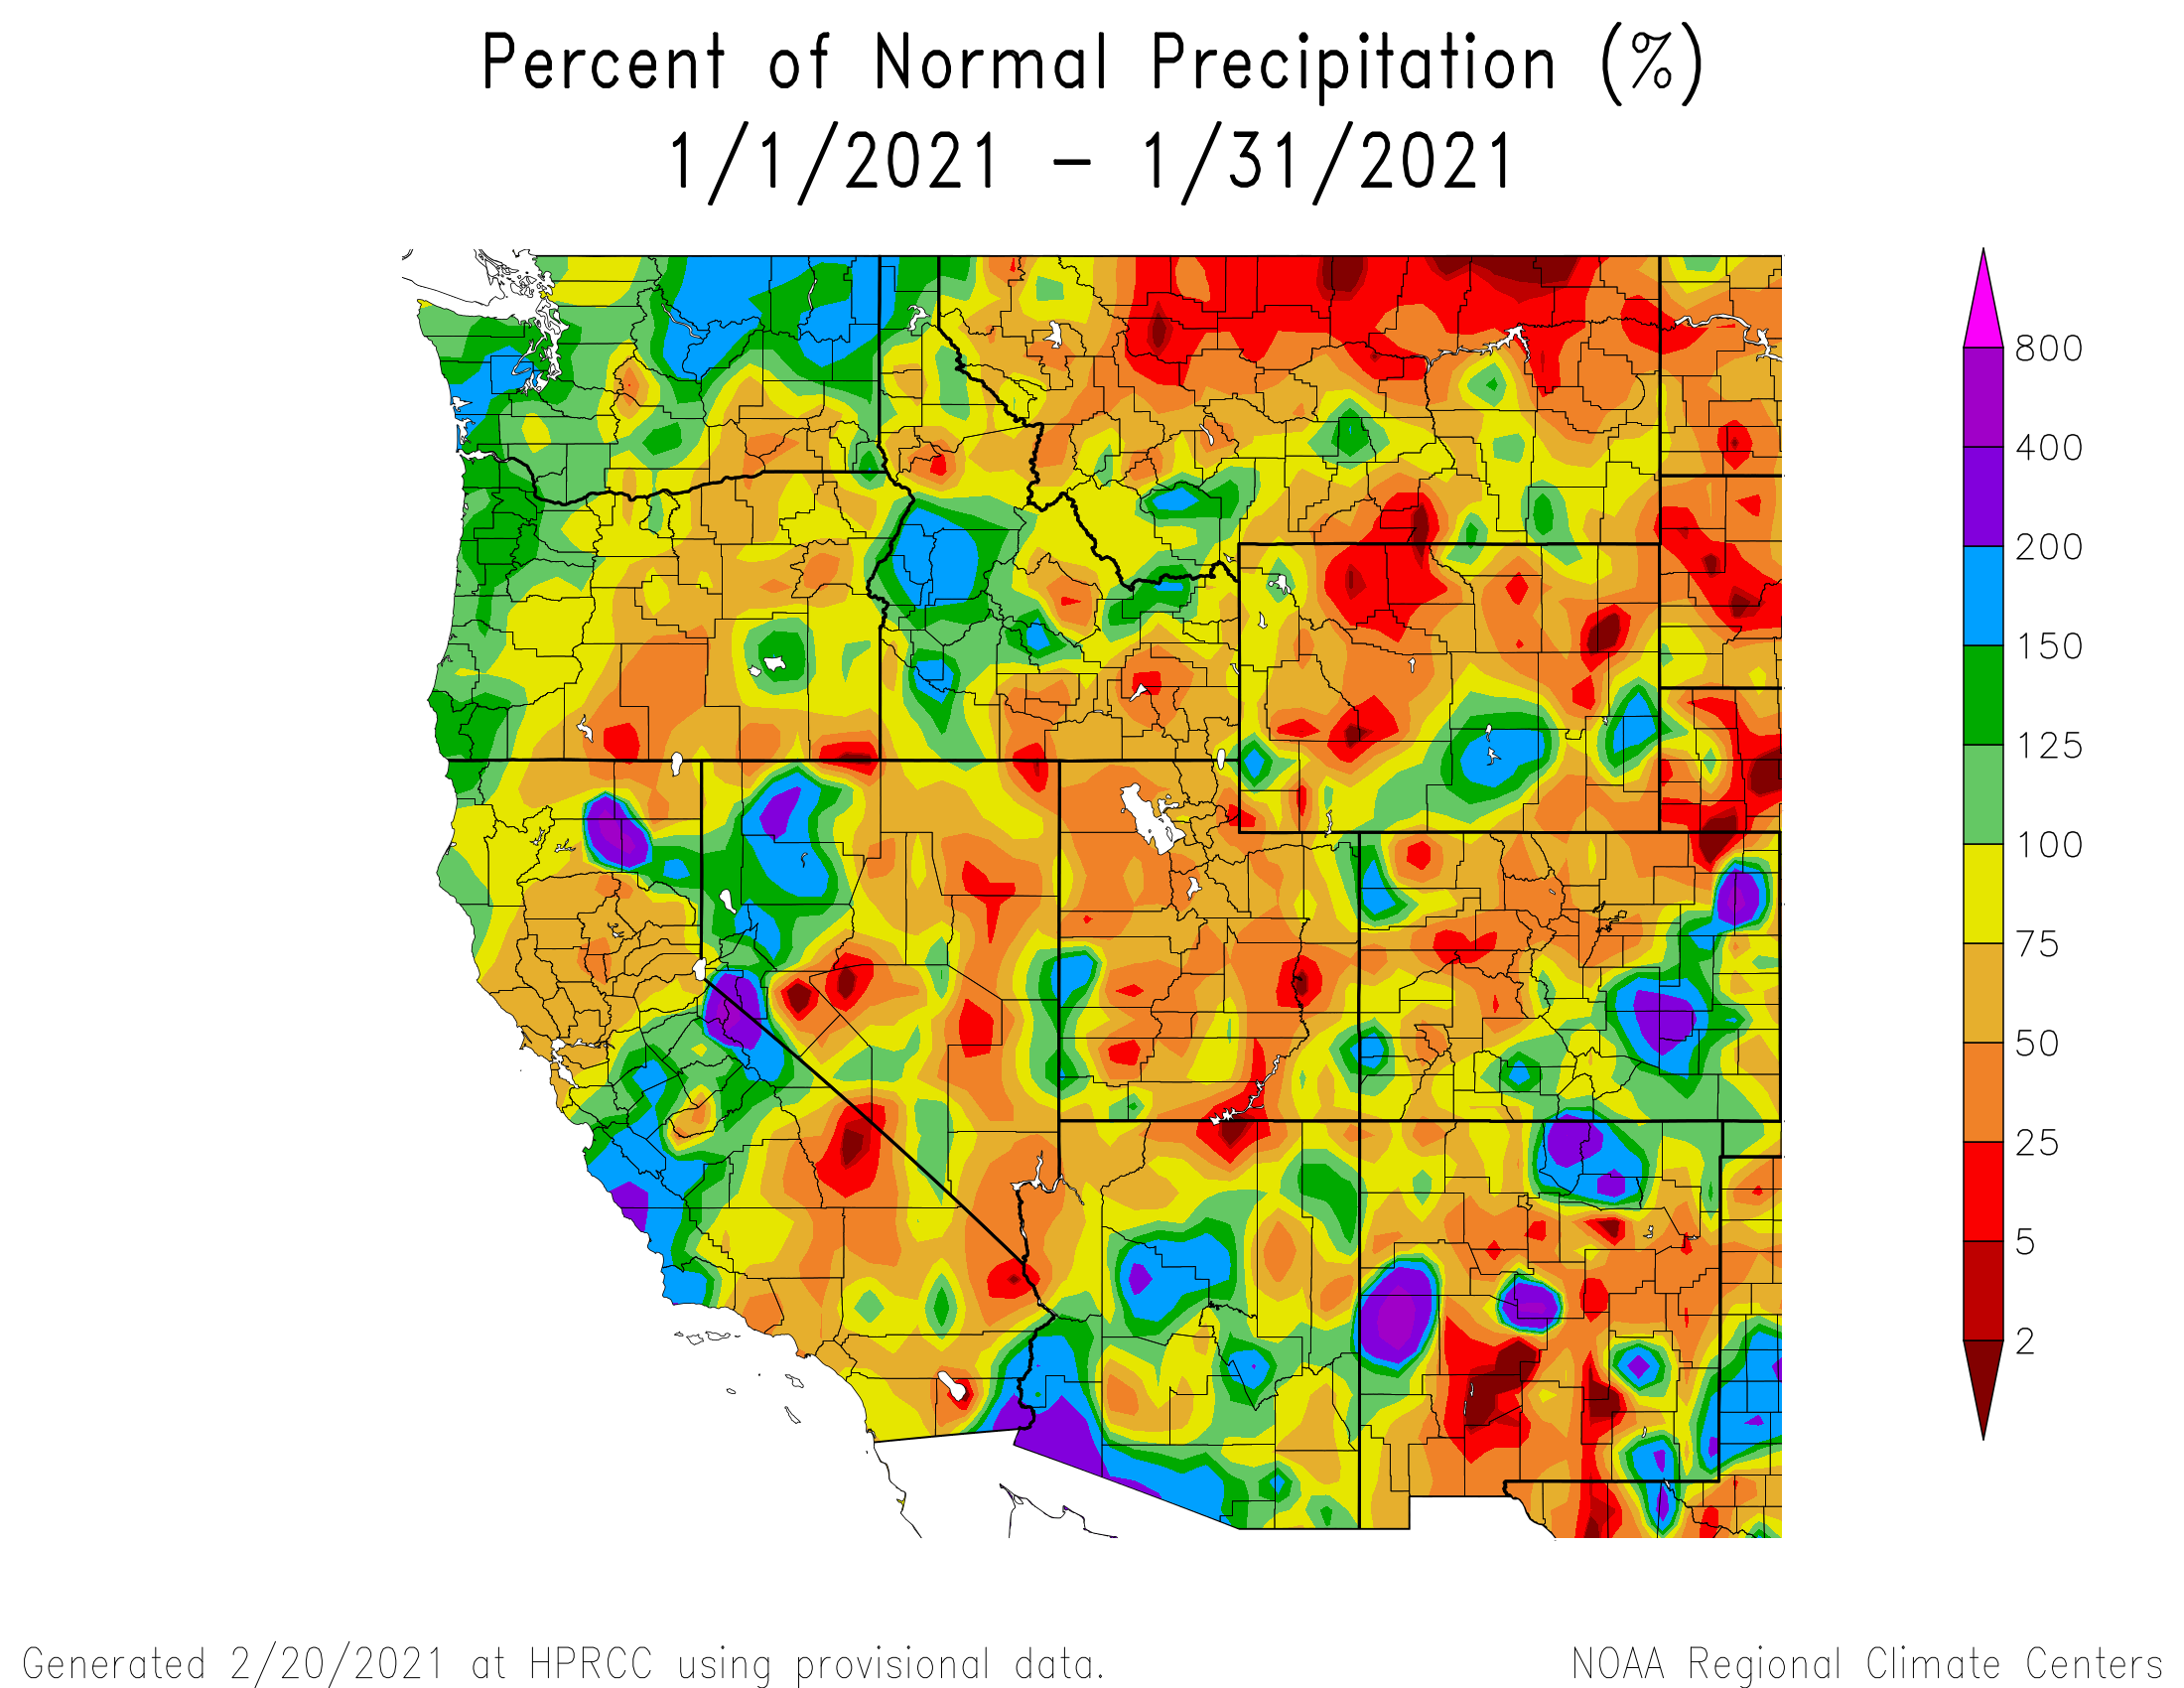
The month was active but variable. Early January SWE conditions started below to much below normal throughout Colorado and continued the trend for the month. January saw another long period of dry/warm conditions with the first 15 days of the month seeing only 2 days of precipitation at Swamp Angel. The latter half of January four storms hit SBB as the weather pattern transitioned to a deep trough with multiple cold storm systems impacting the area. The storms produced widespread precipitation over the entire region and especially favored southwest Colorado. January precipitation came in mostly below normal across the majority of Colorado.
February Weather Summary
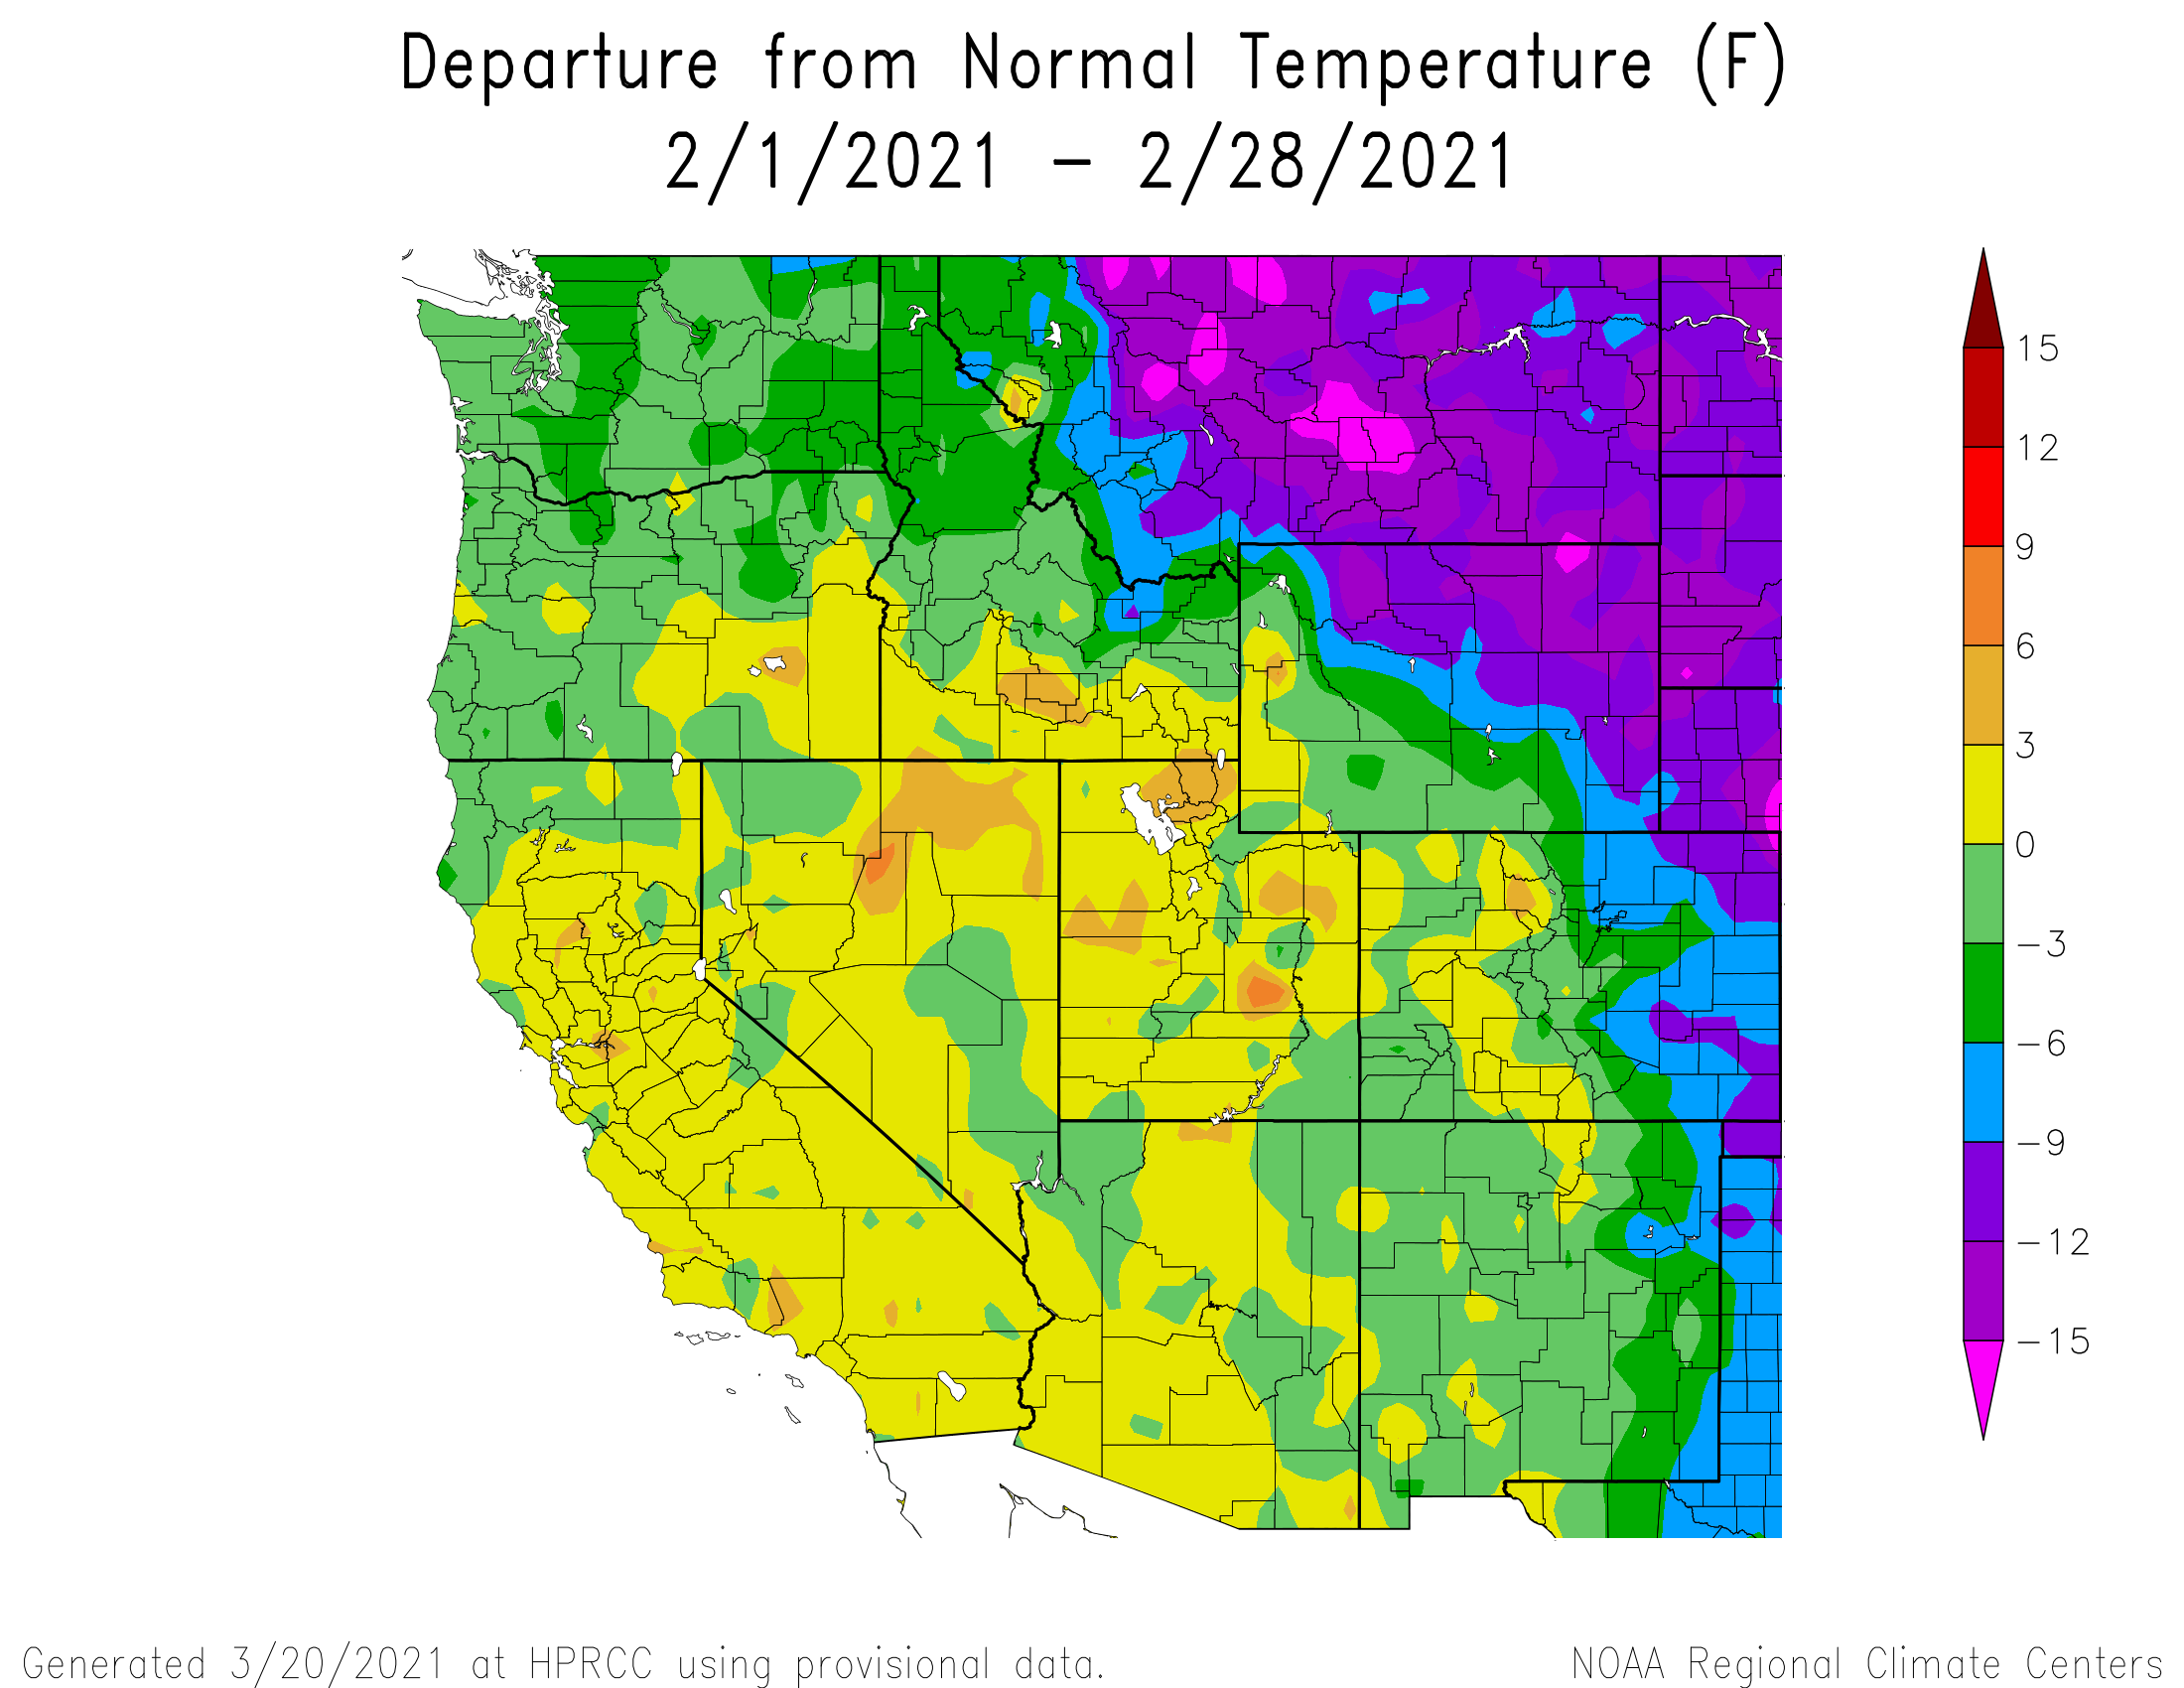
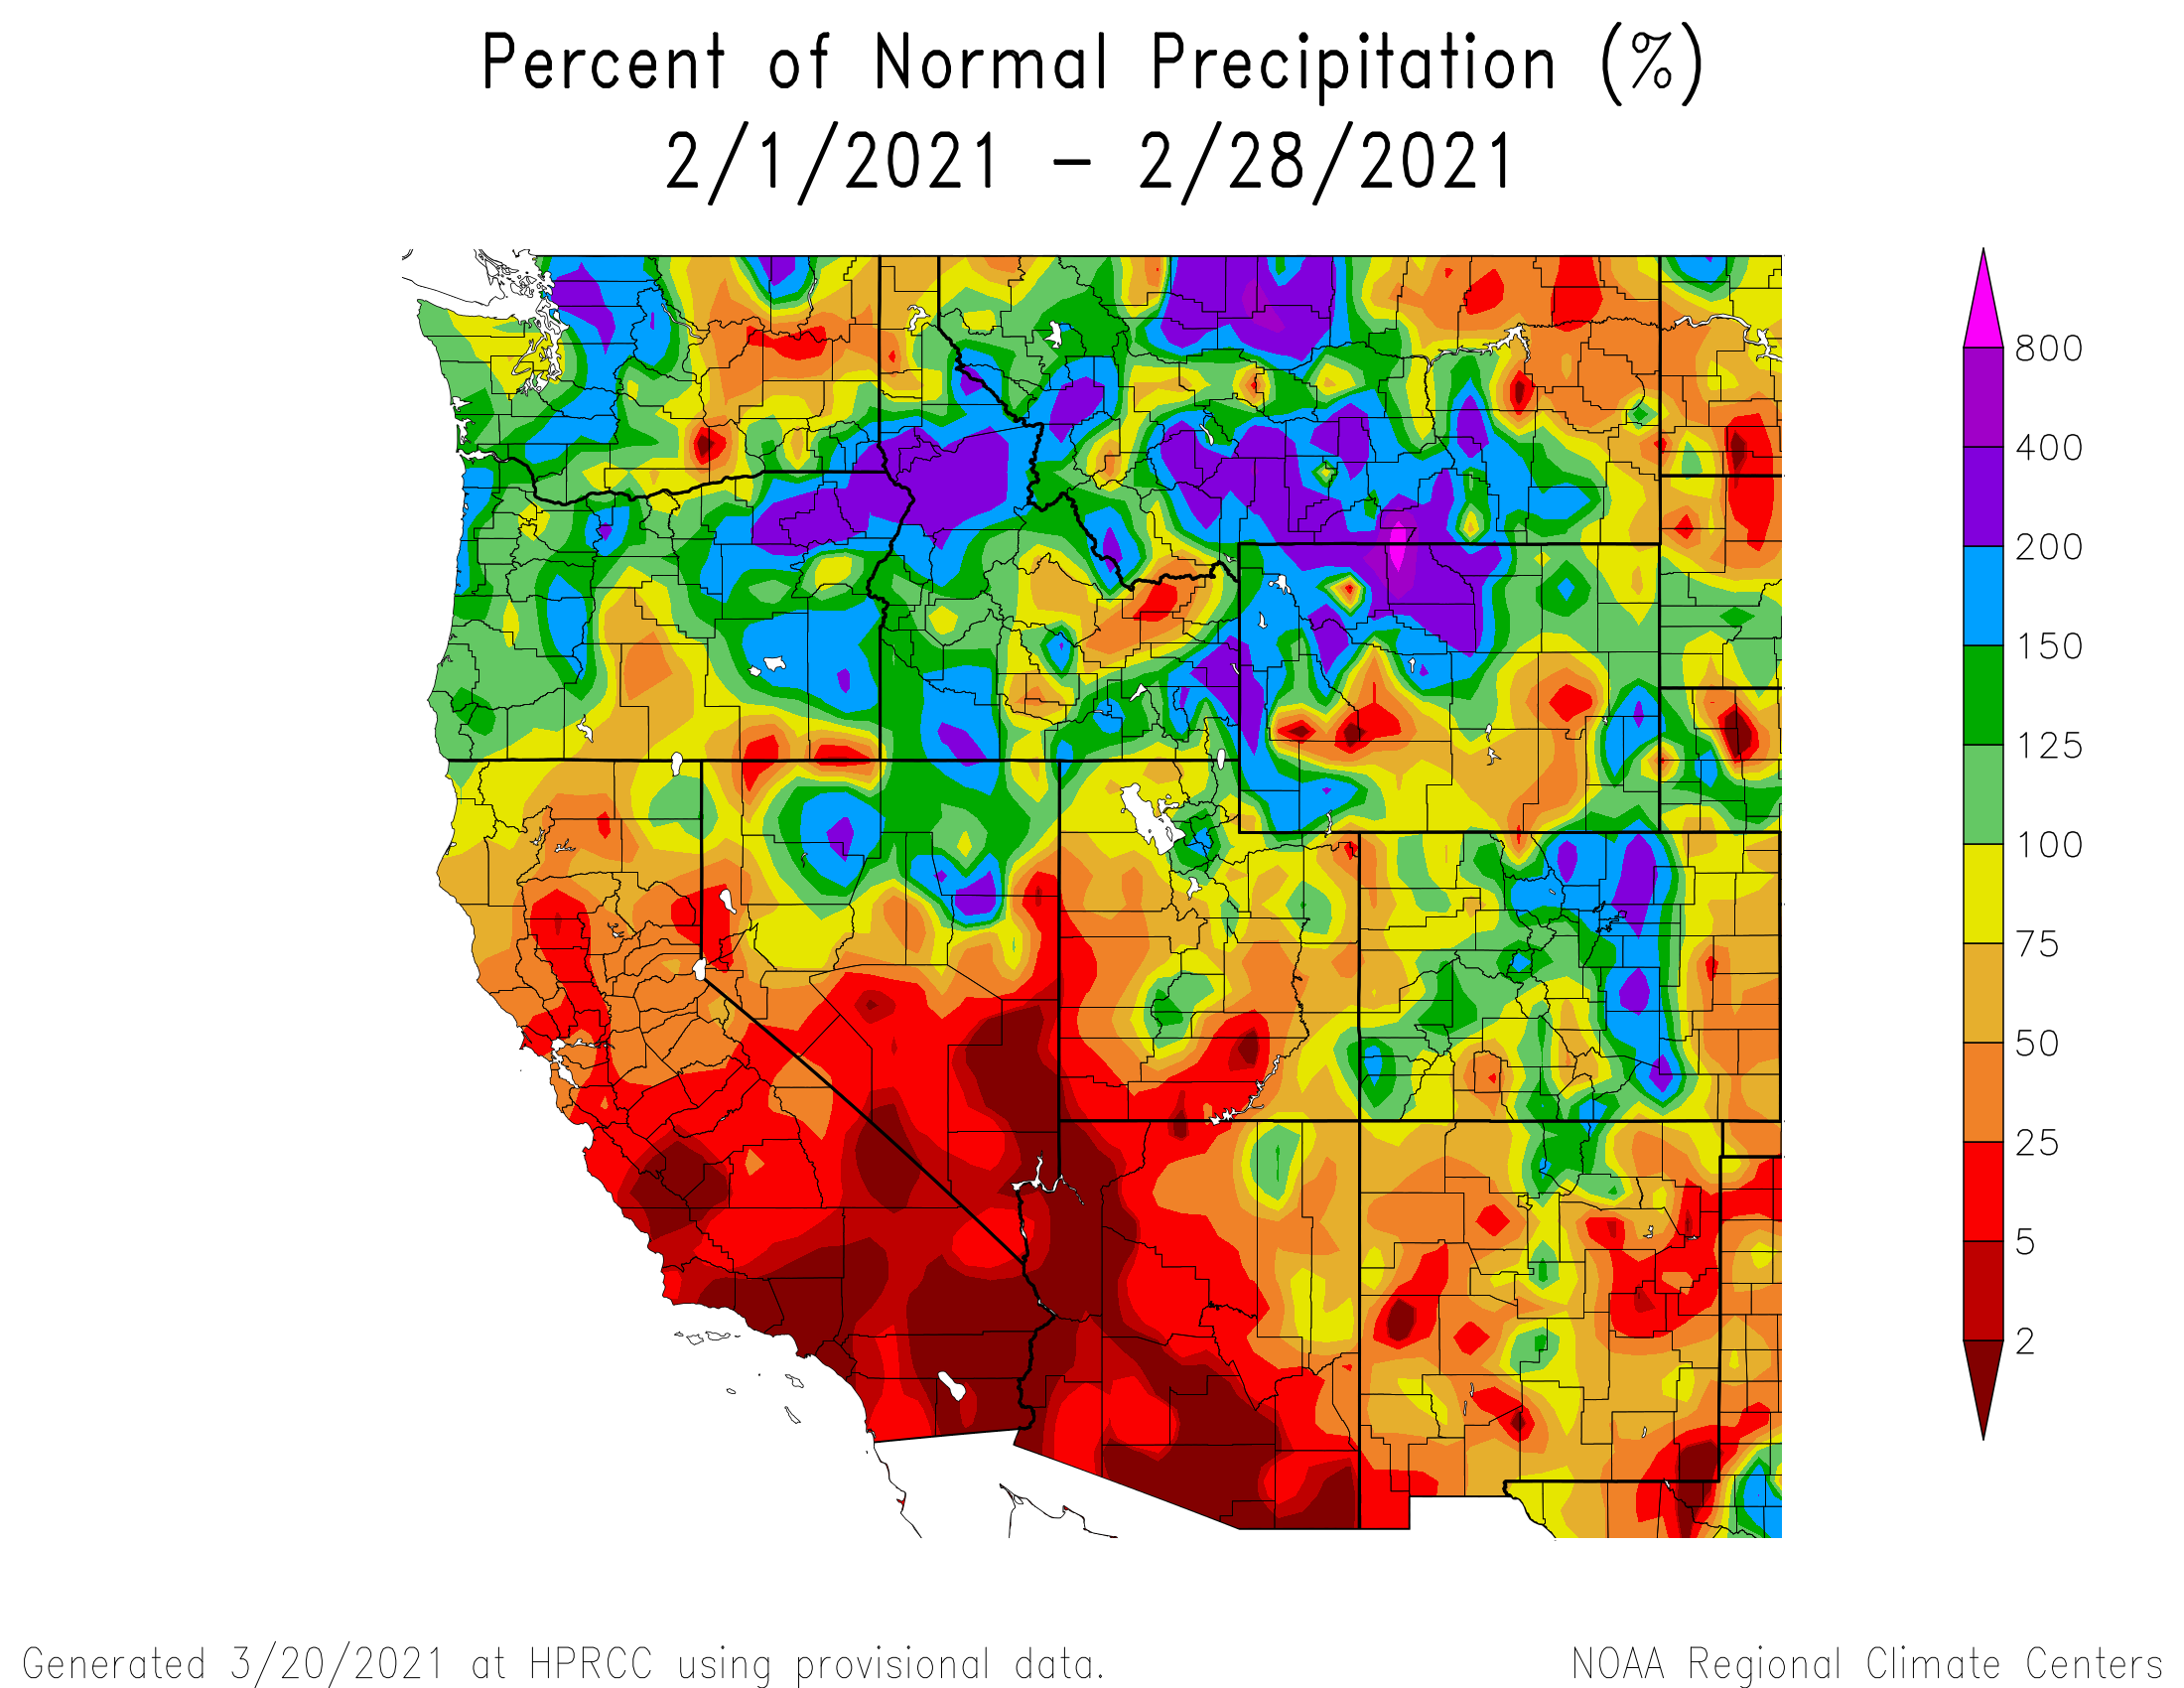
Going into February snowpack conditions generally ranged from 72-75% of the 1981-2010 historical median in the central and northern basins and 81-106% in the southern basins. Fortunately a productive week of active storm systems in mid-February benefitted all of Colorado Mountains. Over 6 days at Swamp Angel we observed 2” precipitation as 20” snow accumulation. Western Colorado in general saw 2”–4” of precipitation. By the end of the month Colorado basins sit at 80-100 % of normal snowpack. Please see graphs below.
March Weather Summary
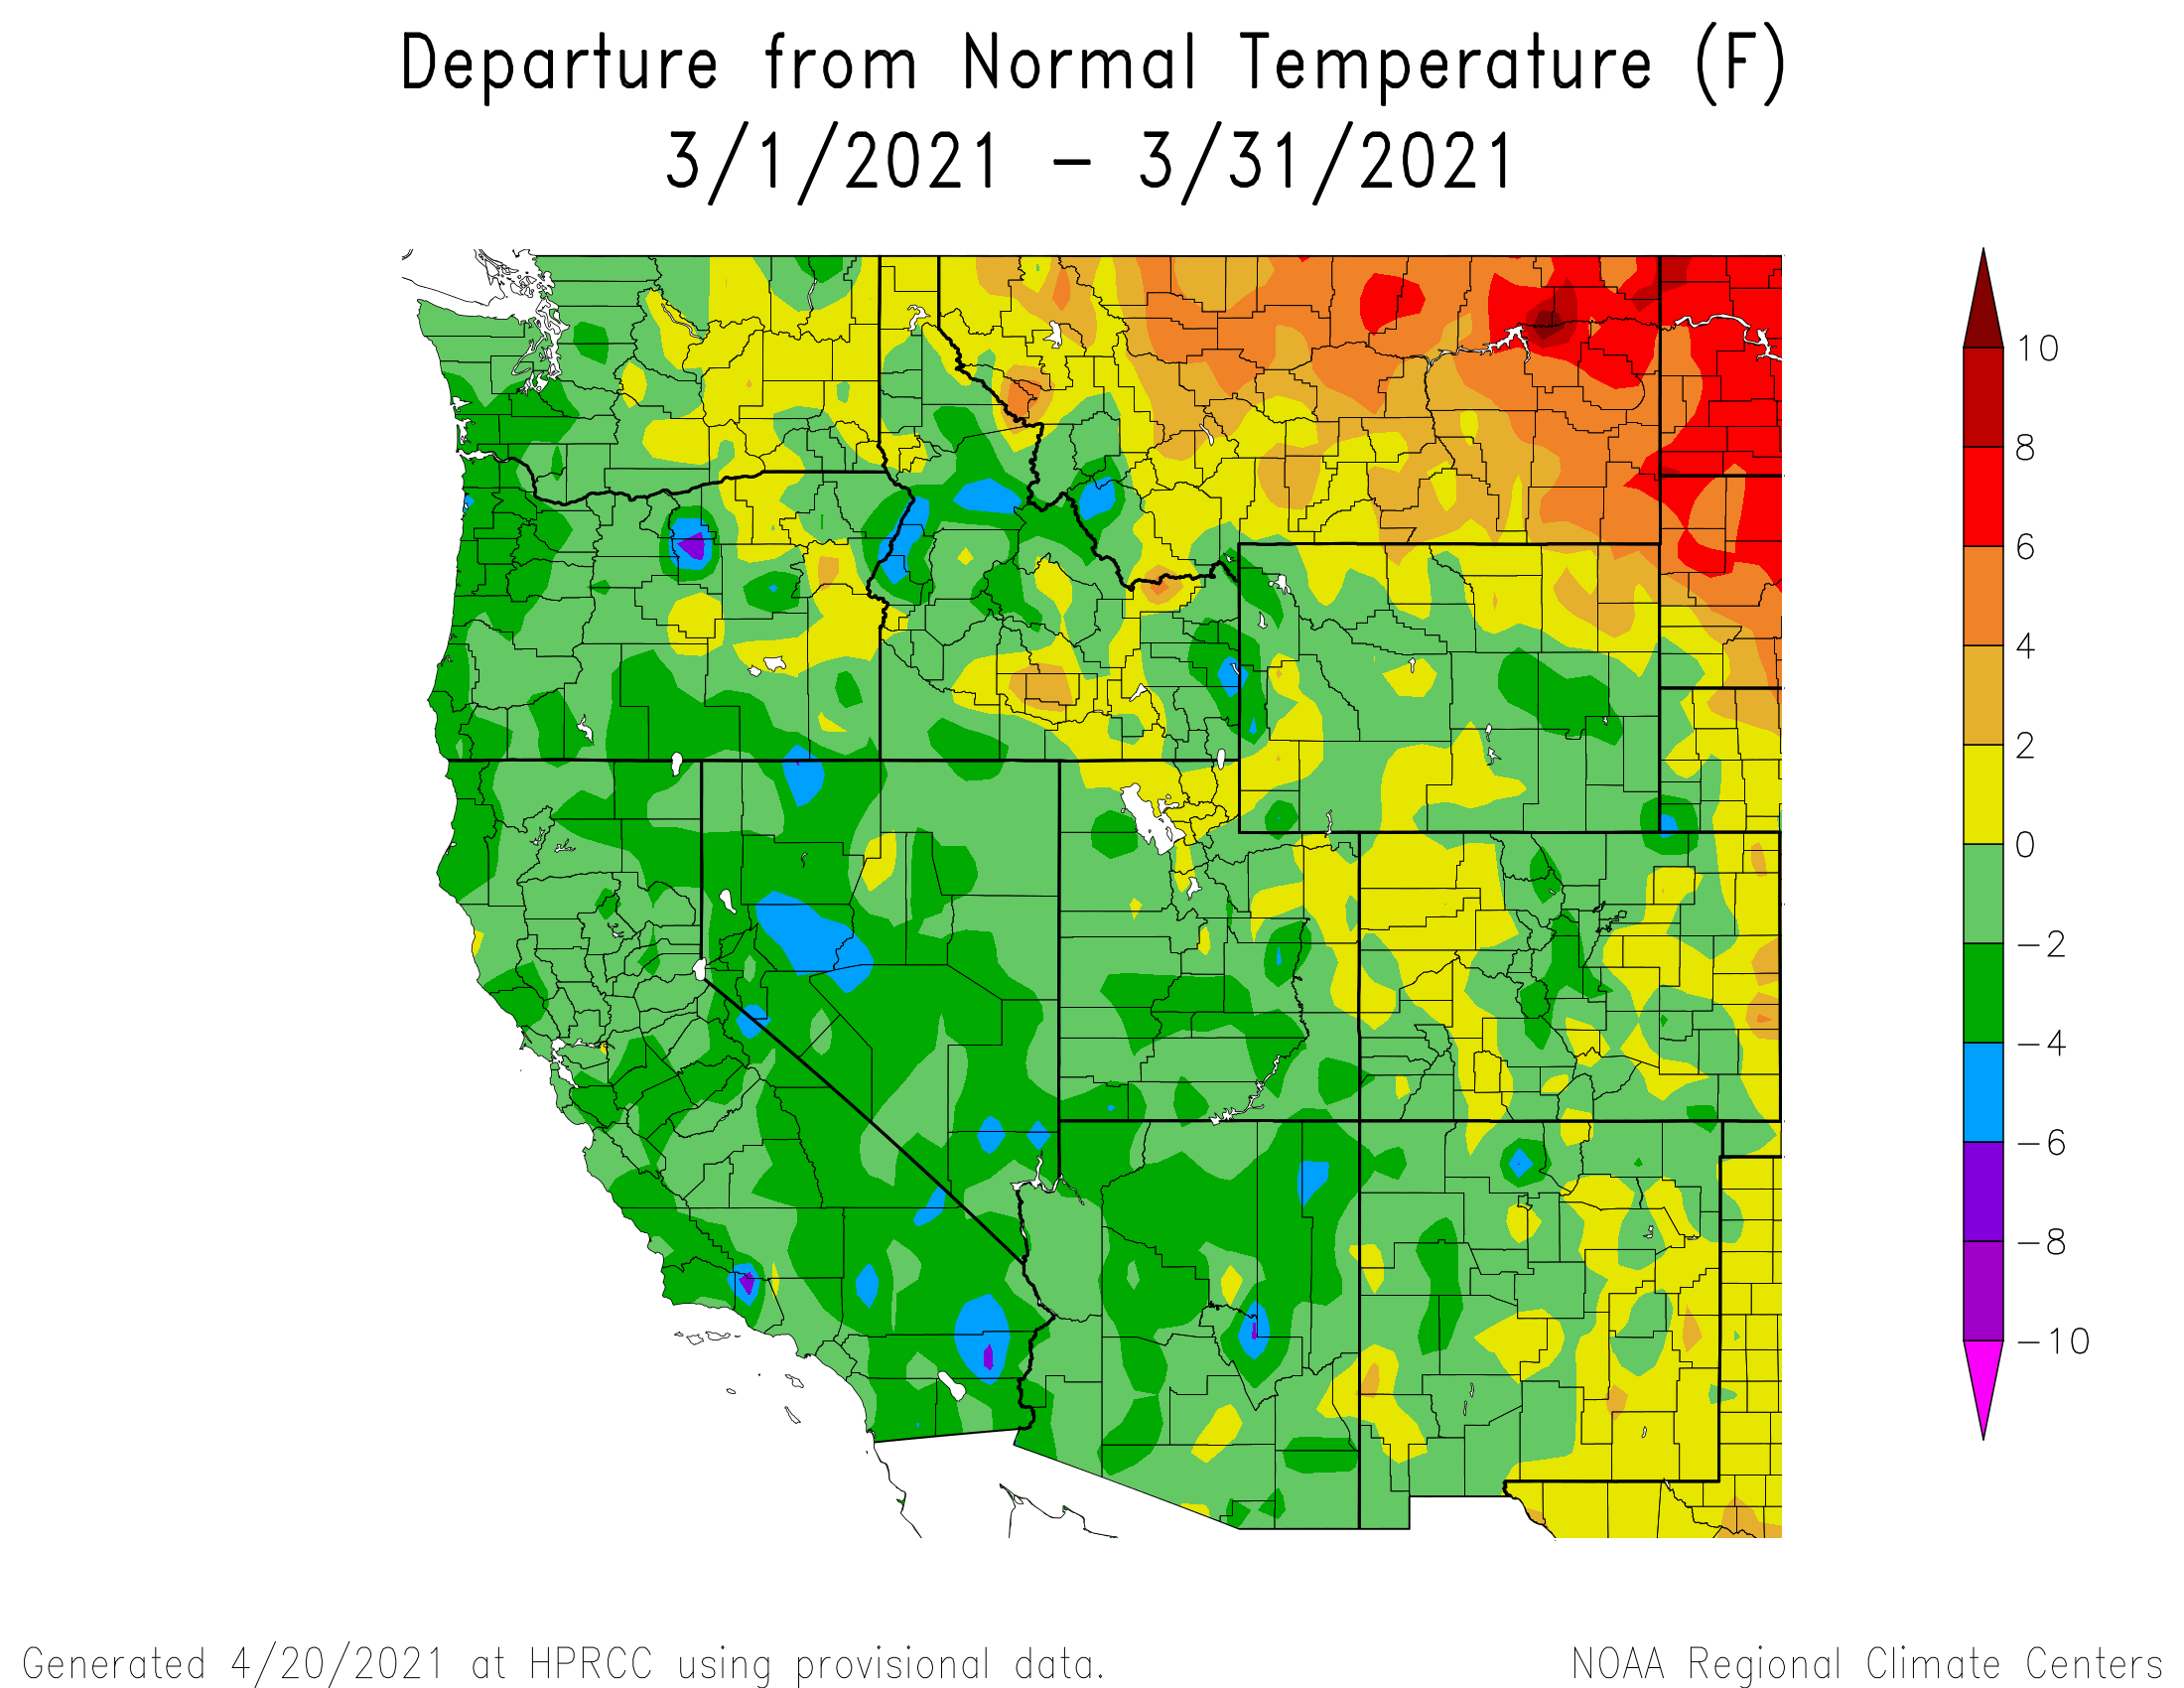
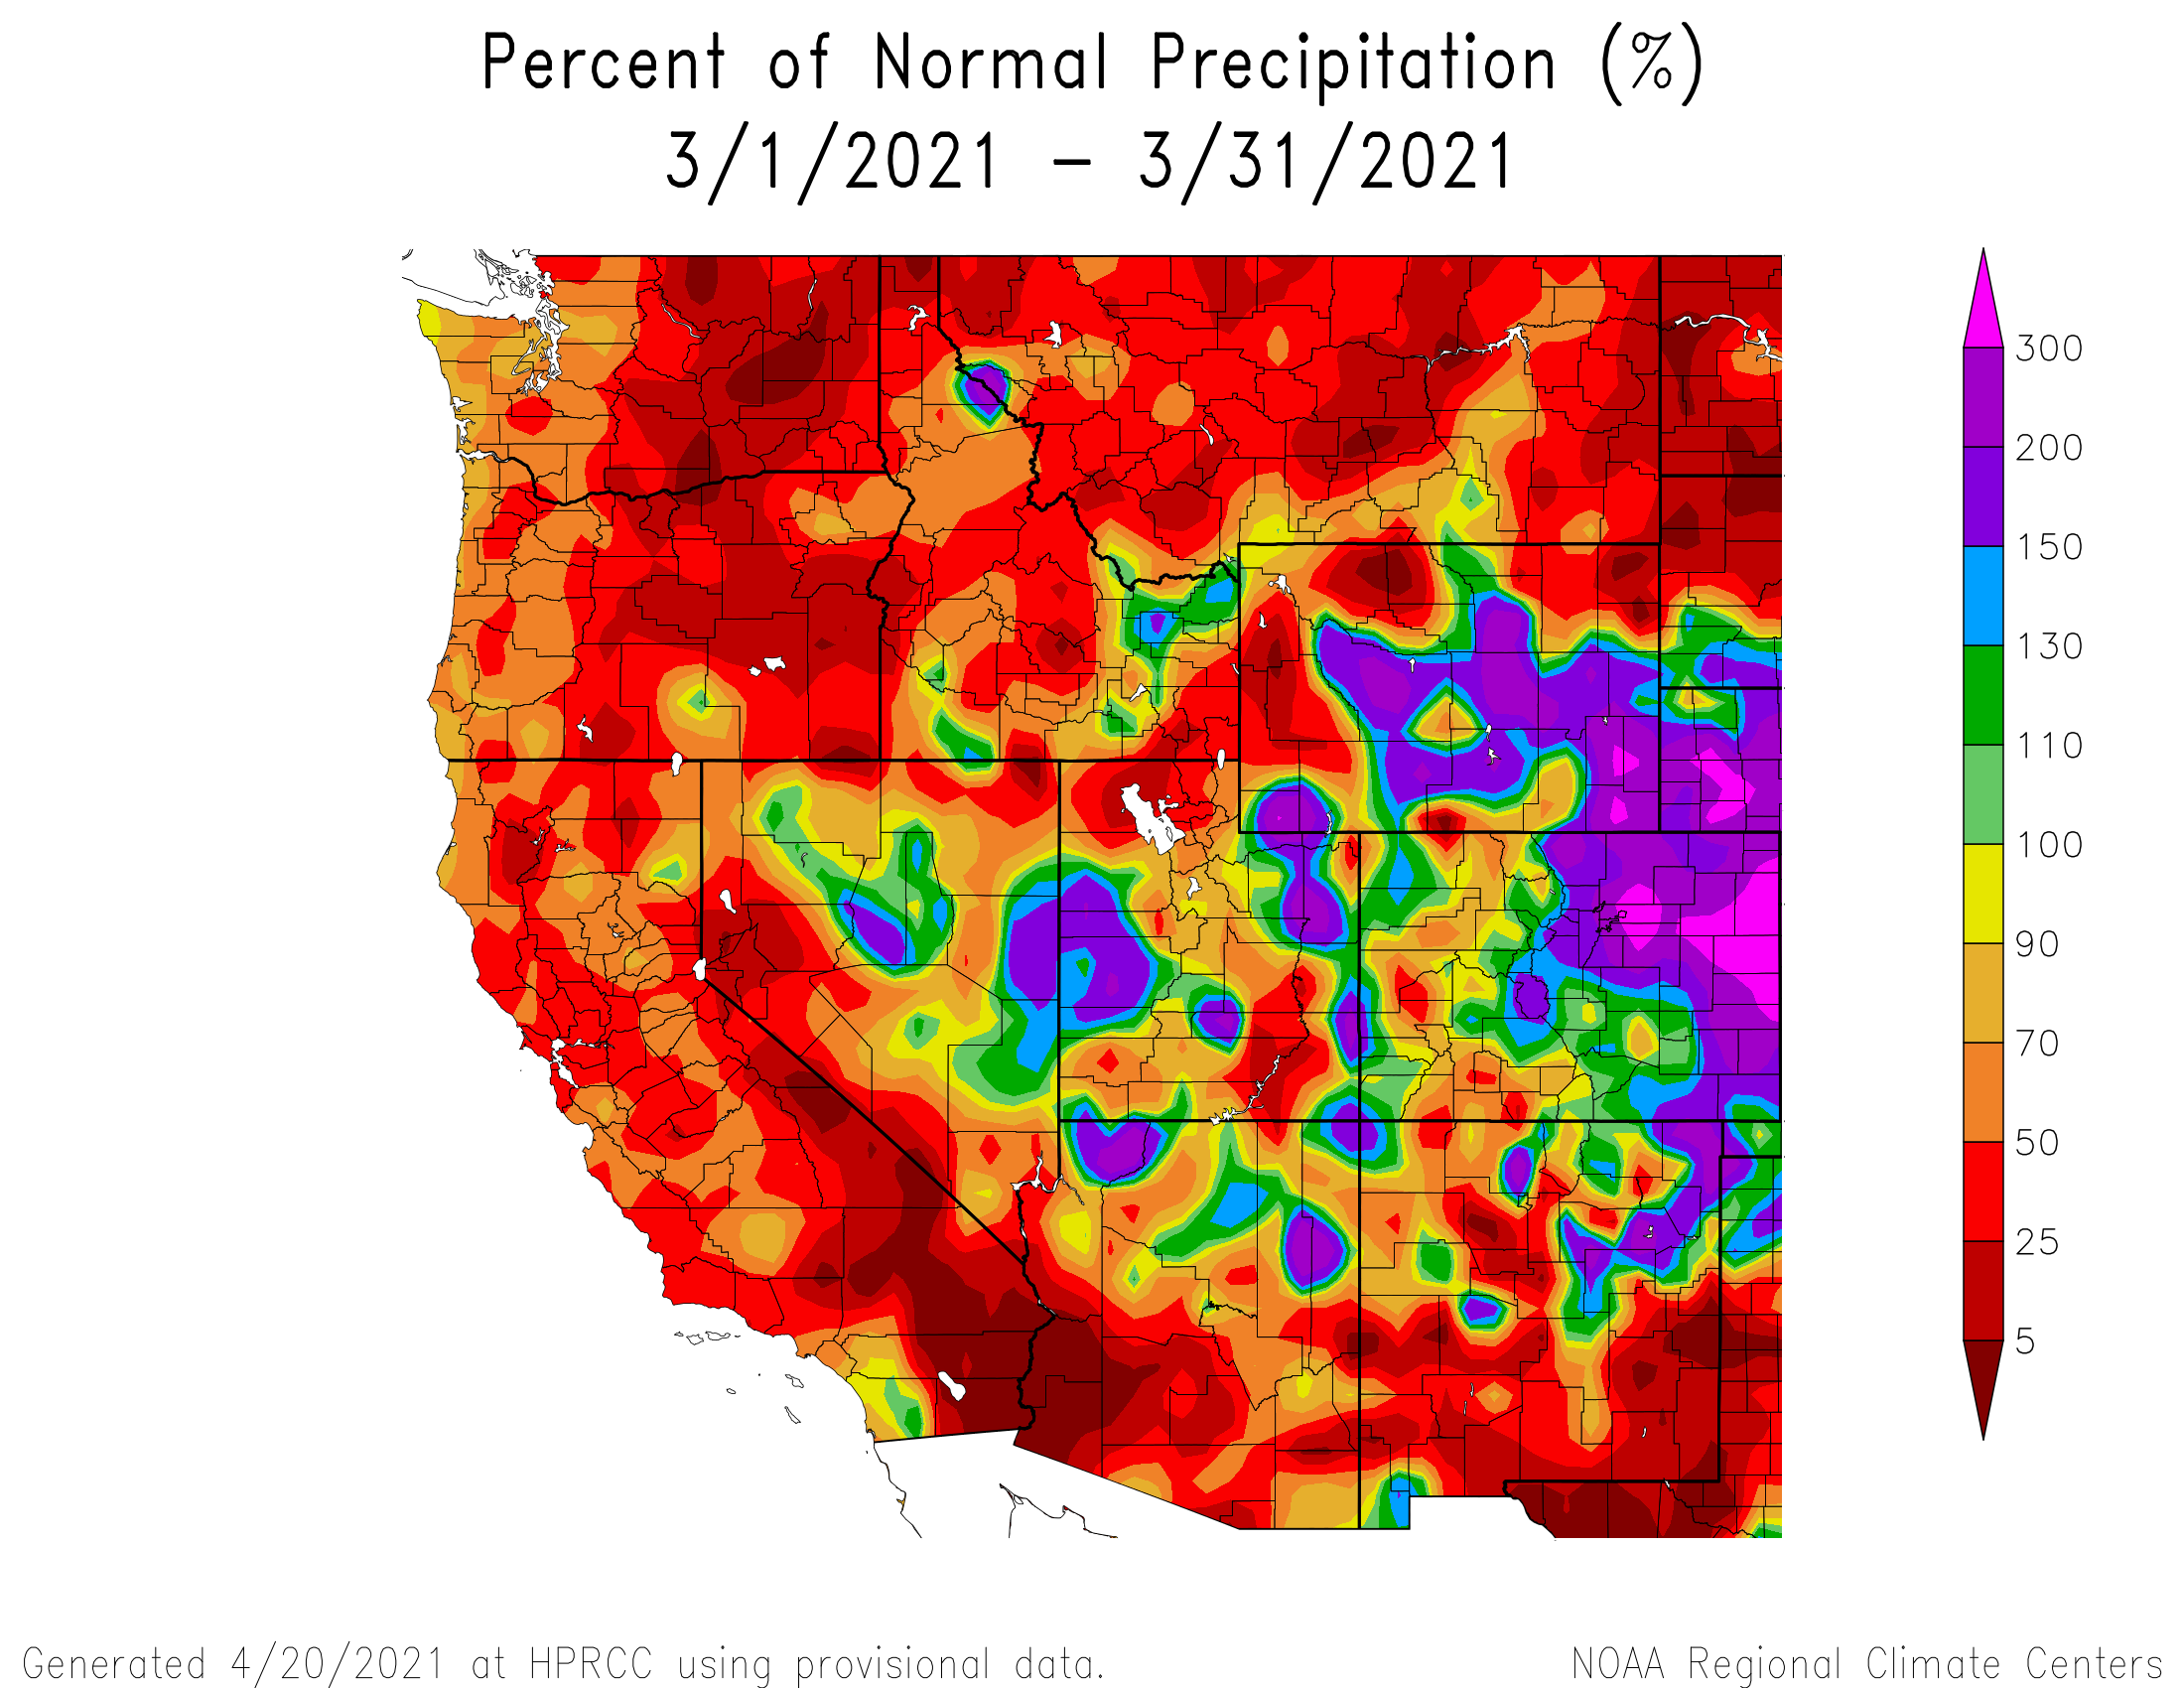
March was notably wet and cool in the eastern half of Colorado that really gave associated watersheds (South Platte, Arkansas) a boost. A big storm hit the Front Range delivering 18”-40” accumulation The storm extended Colorado Springs to Cheyenne and west to the continental divide. The storm also brought significant and notable dust from the Chihuahuan Desert in Mexico. For the western mountains it was mostly drier and warmer than average. At Swamp Angel precipitation was near normal for the month, resulting in a steady increase in snow accumulation.
April Weather Summary
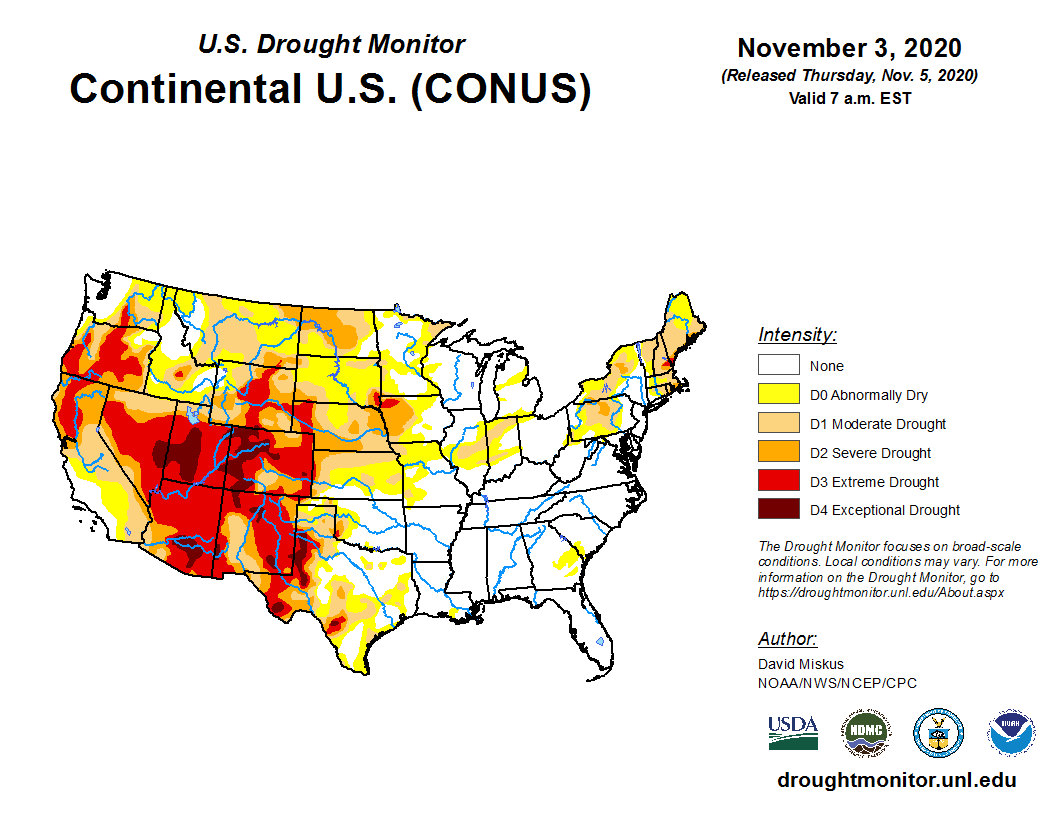
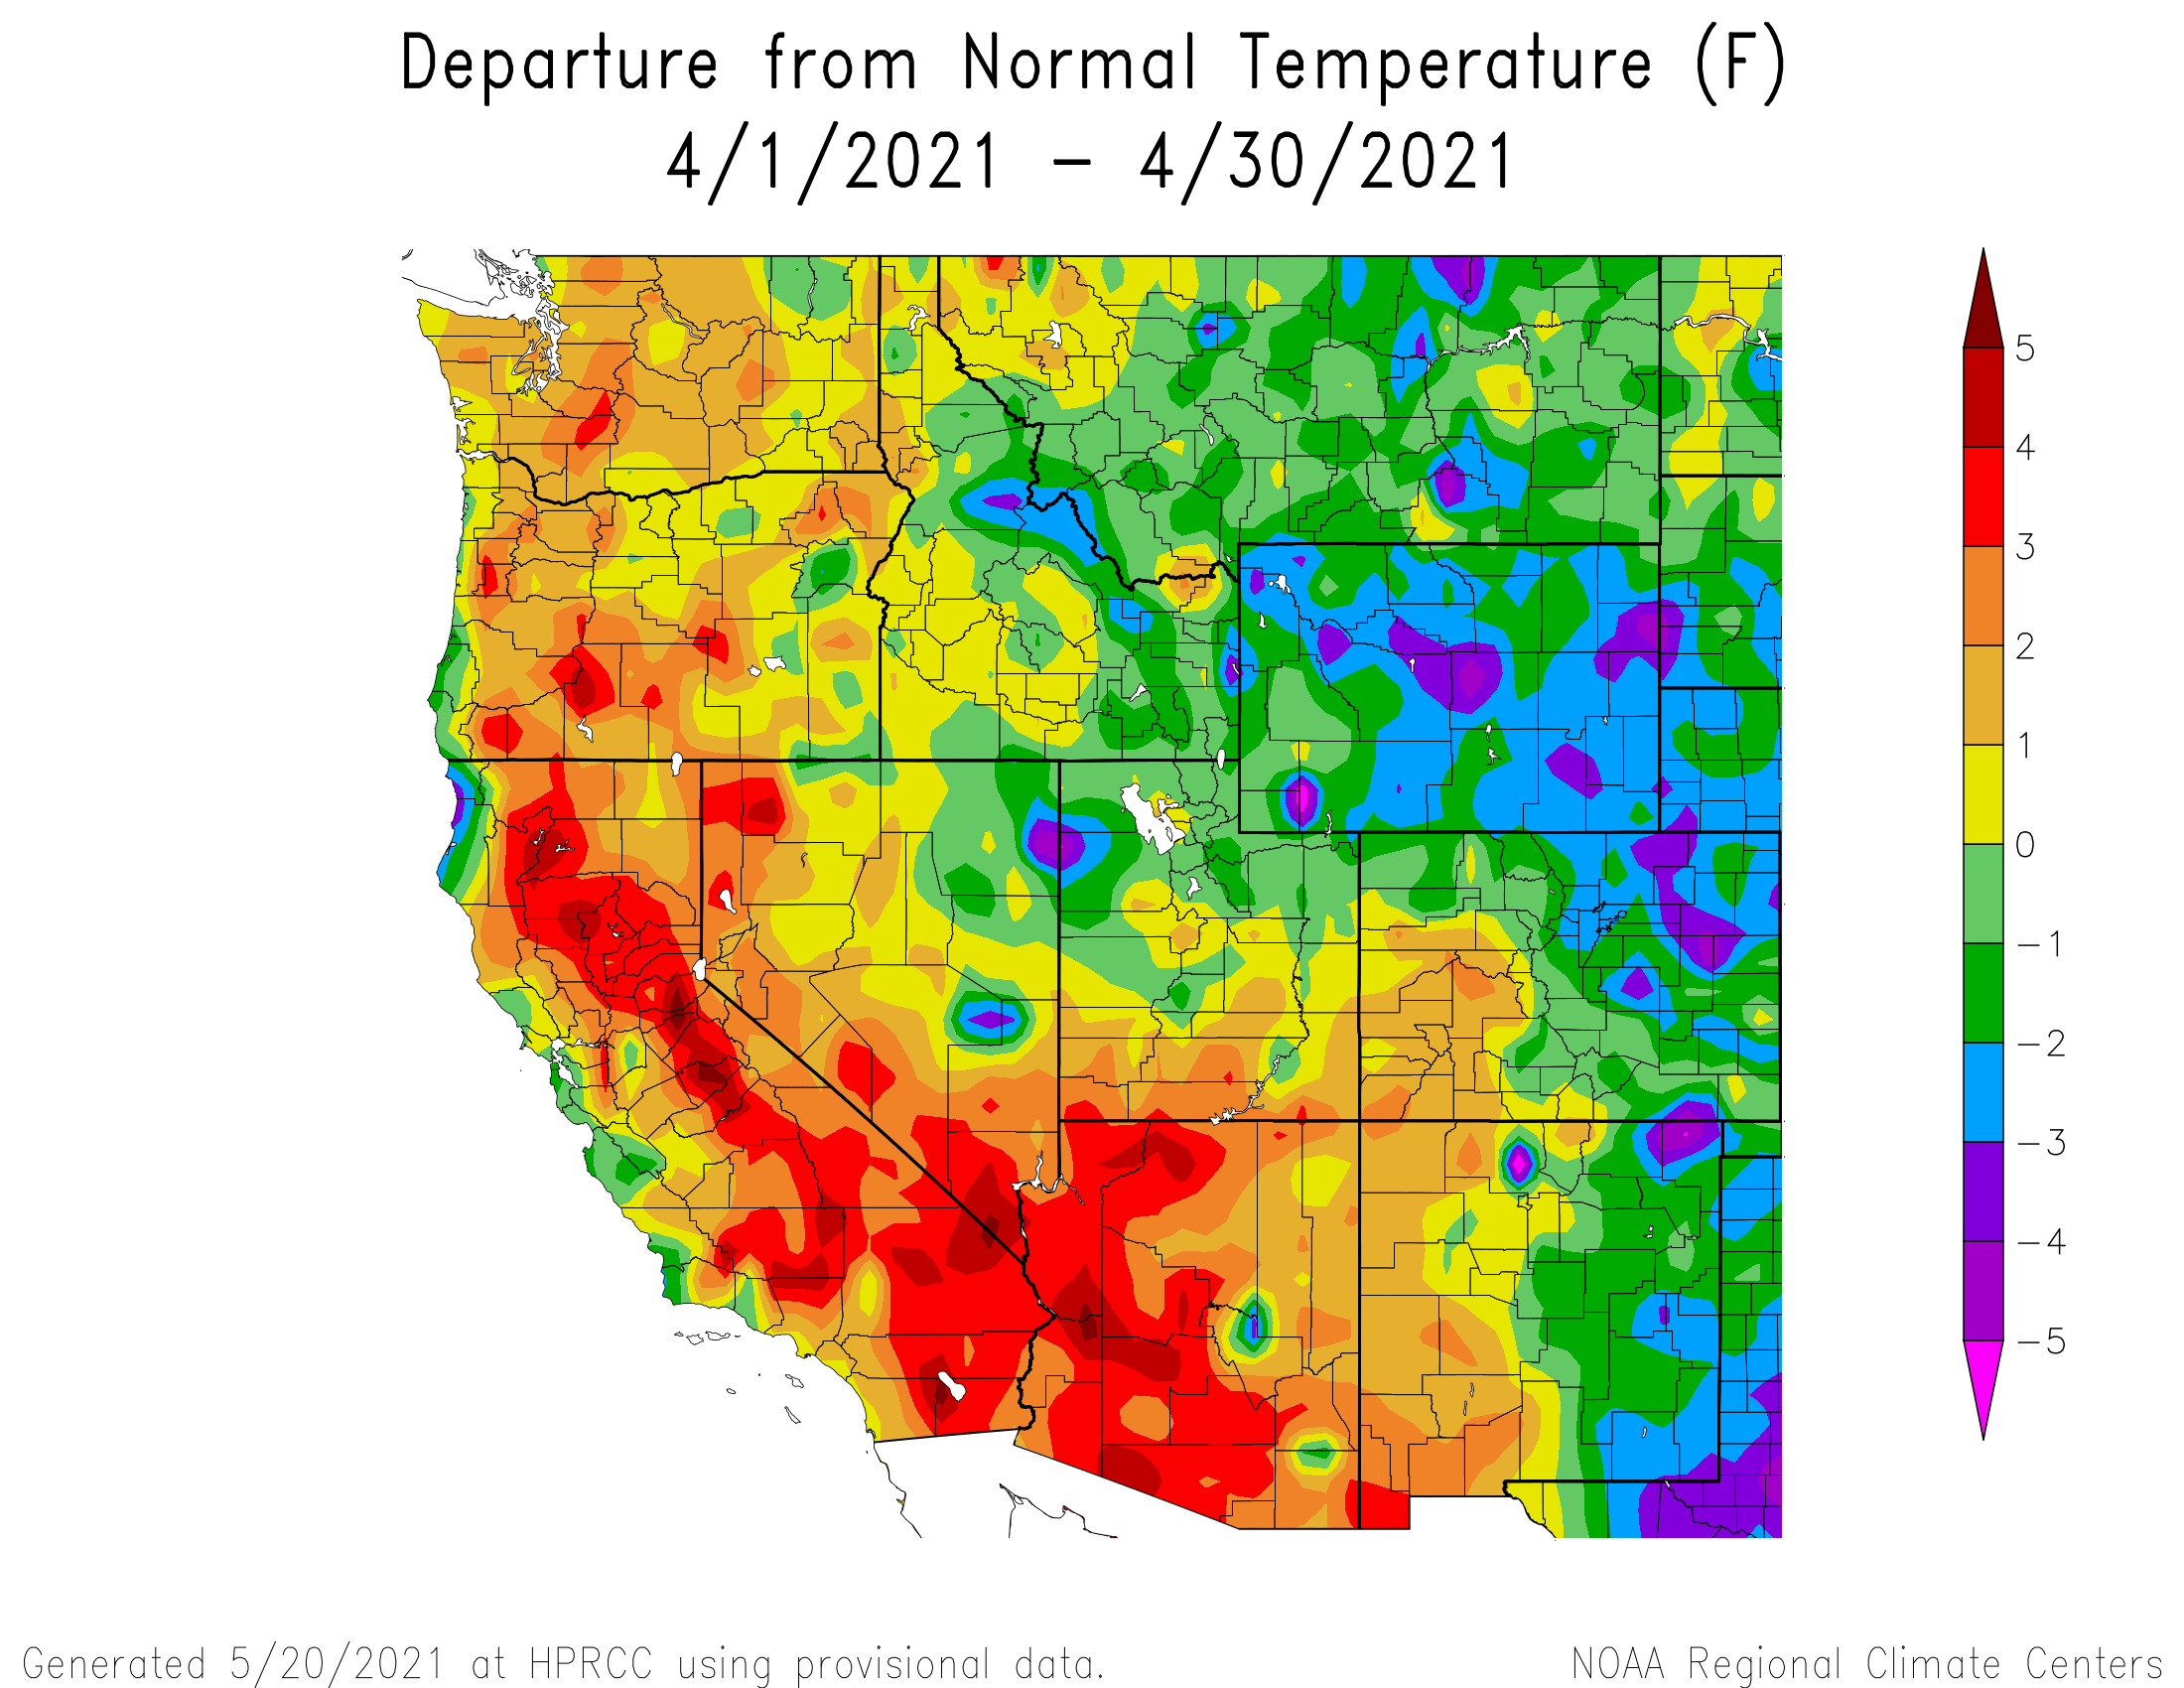
Very similar to WY2020, once April arrived conditions took a turn for the worse. Precipitation was a fraction of normal save for the furthest northeast corner of the state. Rather surprisingly the entire eastern half of the state was cooler than average. The Four Corners and Western Mountains never got a break and remained both hot and dry, record dry in some areas. Hot, dry, with very notable dust on snow surface, the snowpack rapidly ablated (seeing high sublimation rates) to where basins that were above normal peak accumulation quickly fell well below normal. At SBB precipitation was less than half of normal for the month.
May Weather Summary
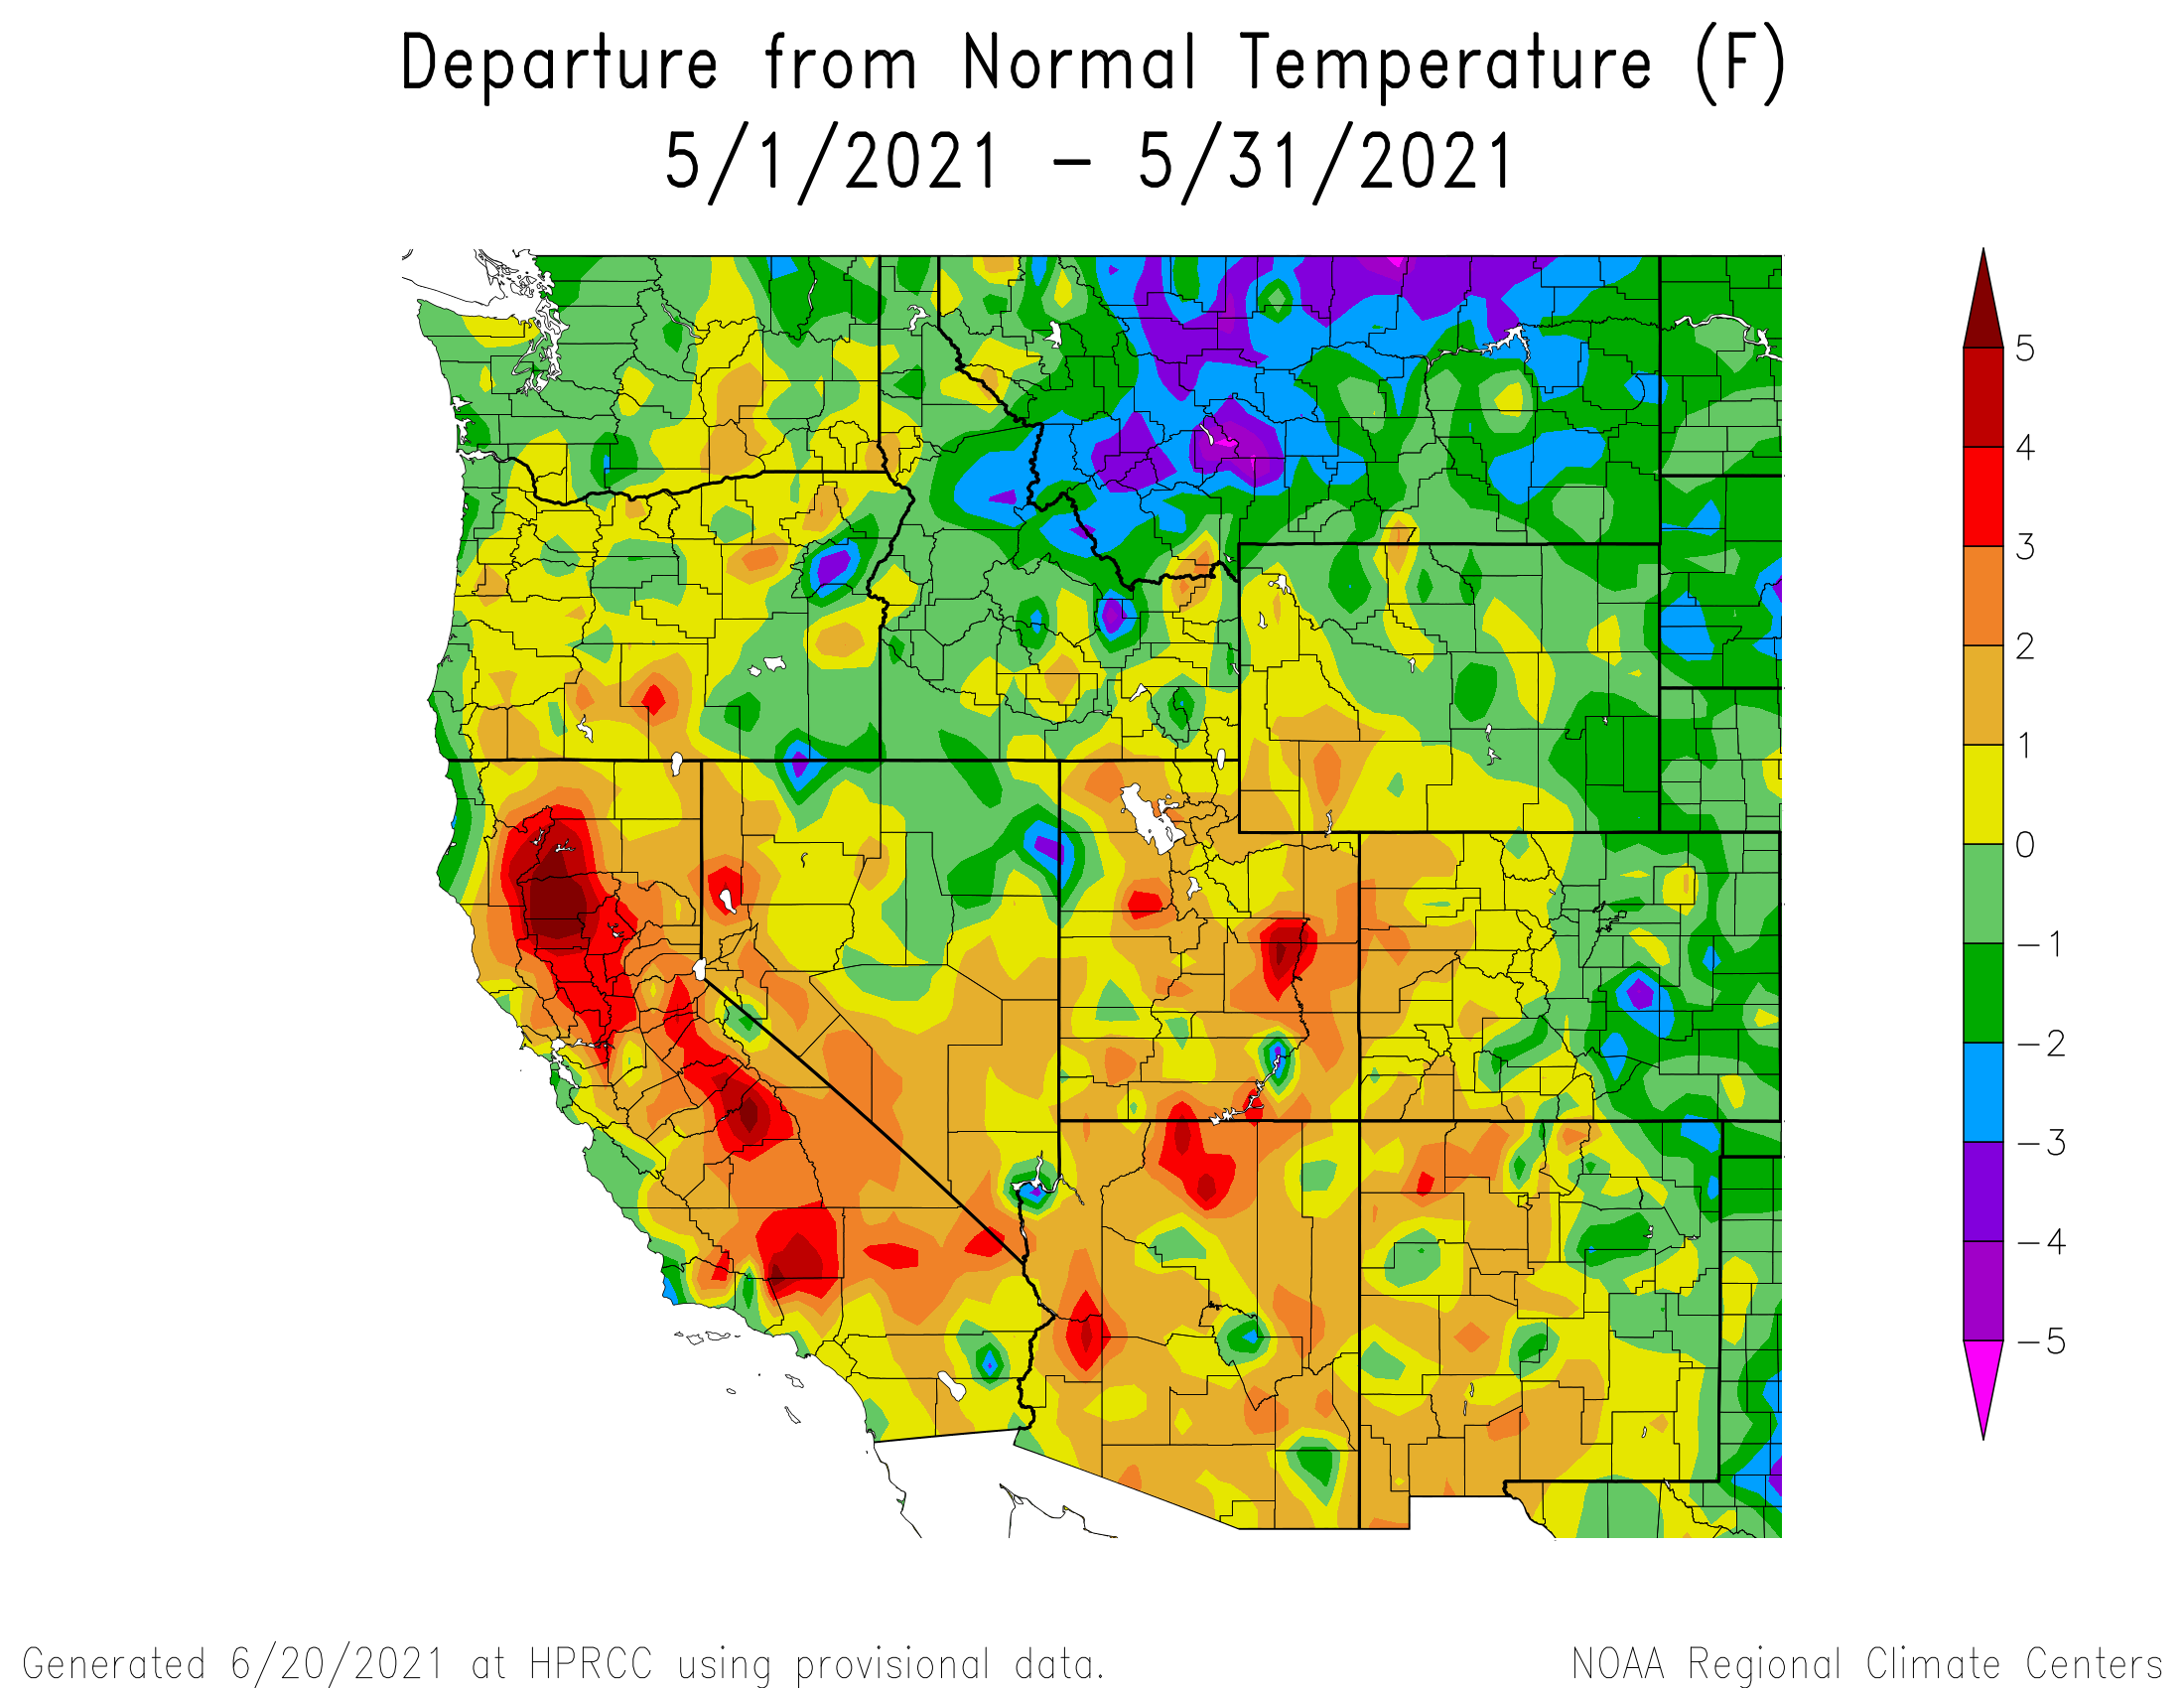
The pattern witnessed in April continued in May; wet and cool for the eastern half of Colorado and just the opposite on the western half. At SBB we received slightly more precipitation than average, but that was an anomaly to the greater surrounding area, most of that precipitation came from one storm that favored southern Colorado (1’ snow accumulation delivered at SBB). Fortunately, combined with the previous months performance, the eastern half of Colorado was declared drought free. The western half remains under extreme/exceptional drought conditions. A stark difference.
June Weather Summary
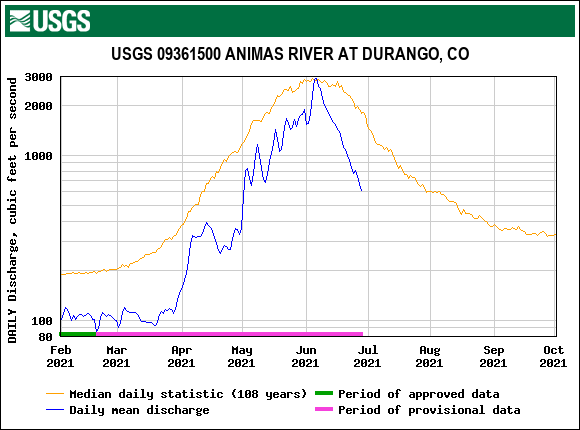
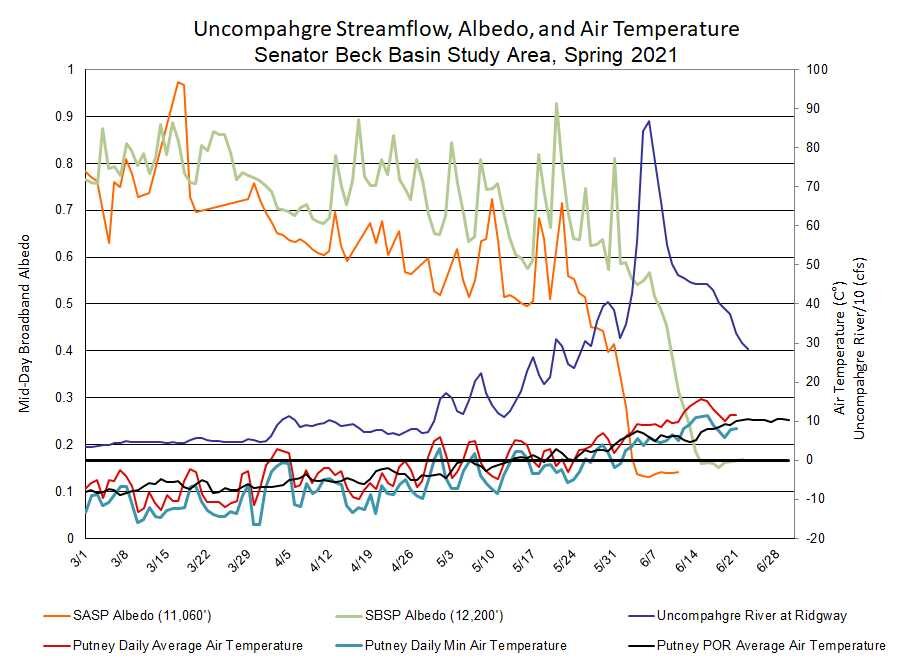
Snow was gone at Swamp Angel Study Plot (11,060’) on June 4, exactly on the average date. Snow was gone at Senator Beck Study Plot (12,200’) on June 11, roughly 3 days earlier than normal. Snow ablation and peak streamflows would have been about seven days earlier had it not been for the storm on May 21 that delivered about 1’ of snow at SBB and elsewhere.
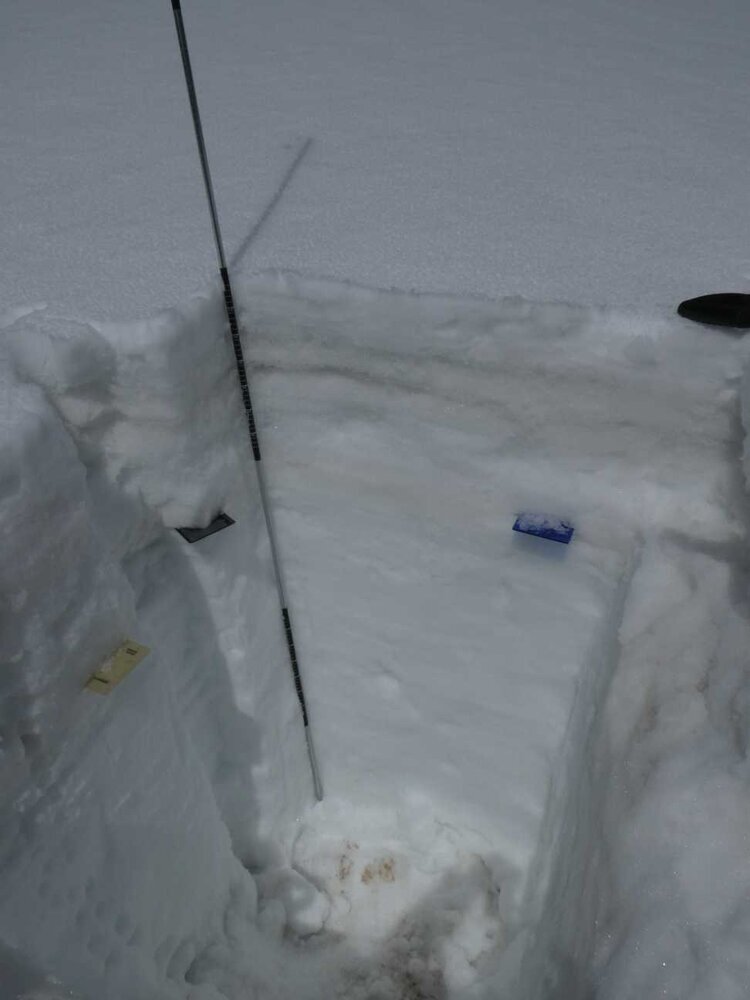
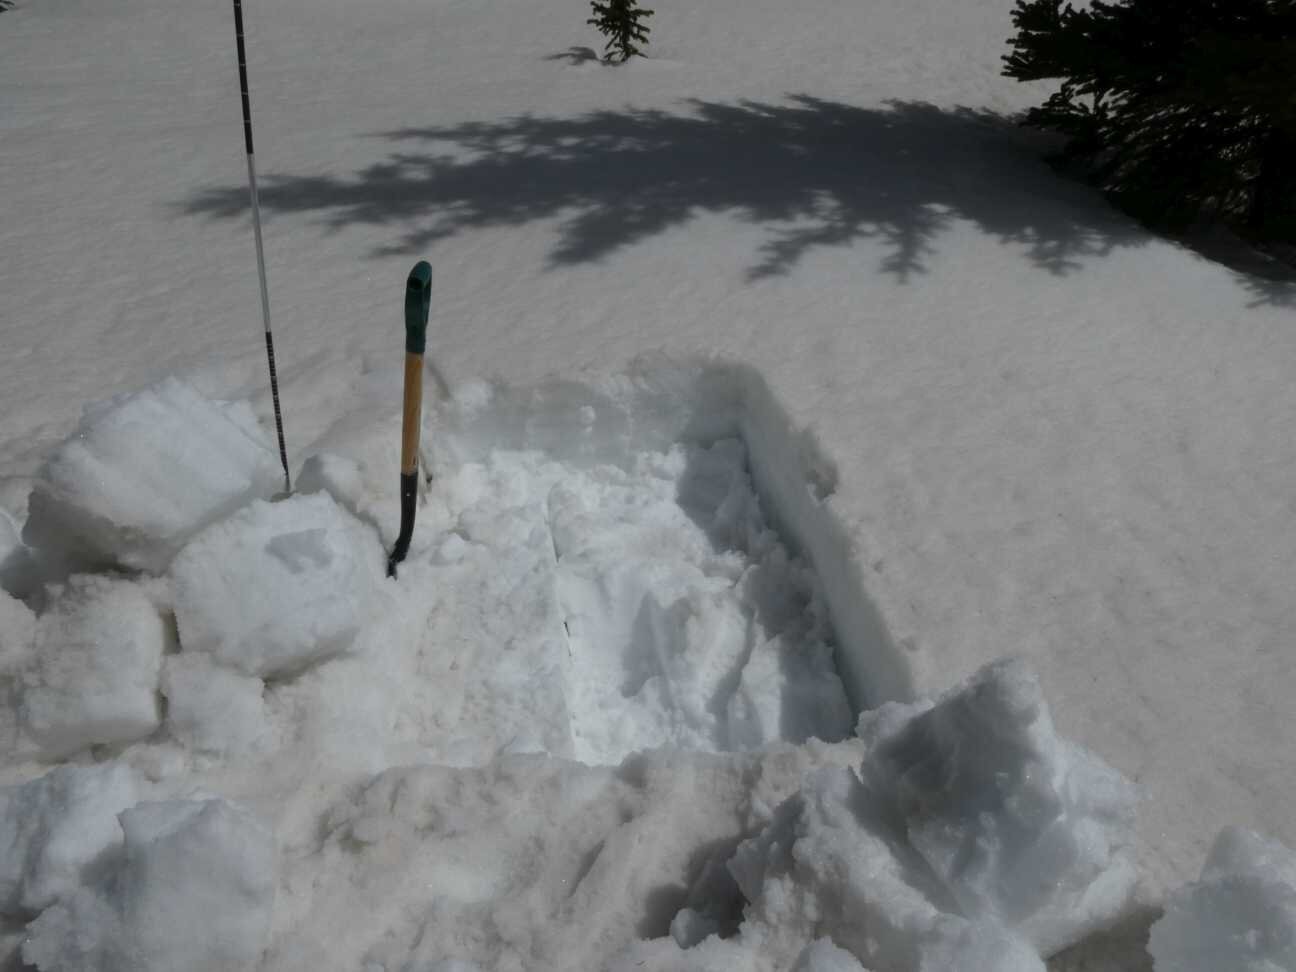
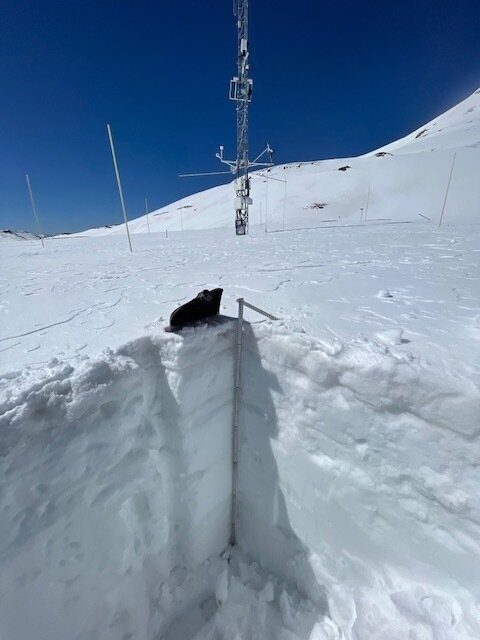
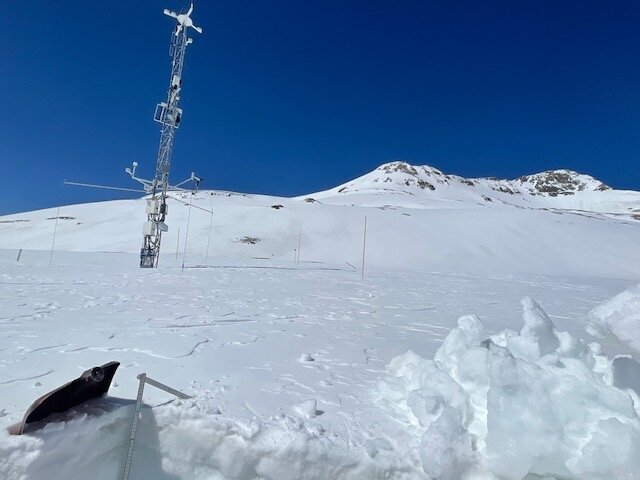
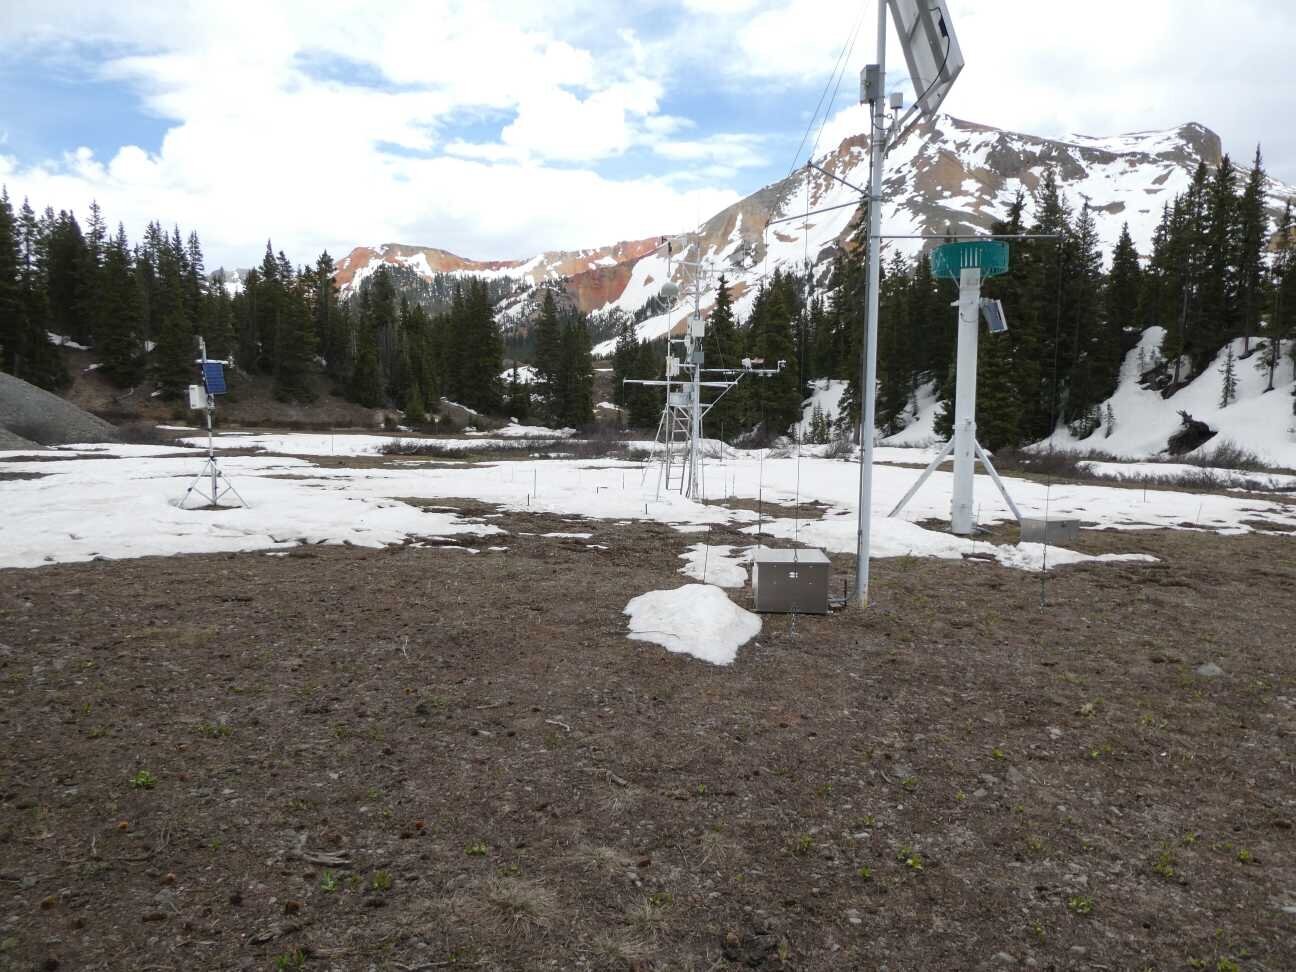
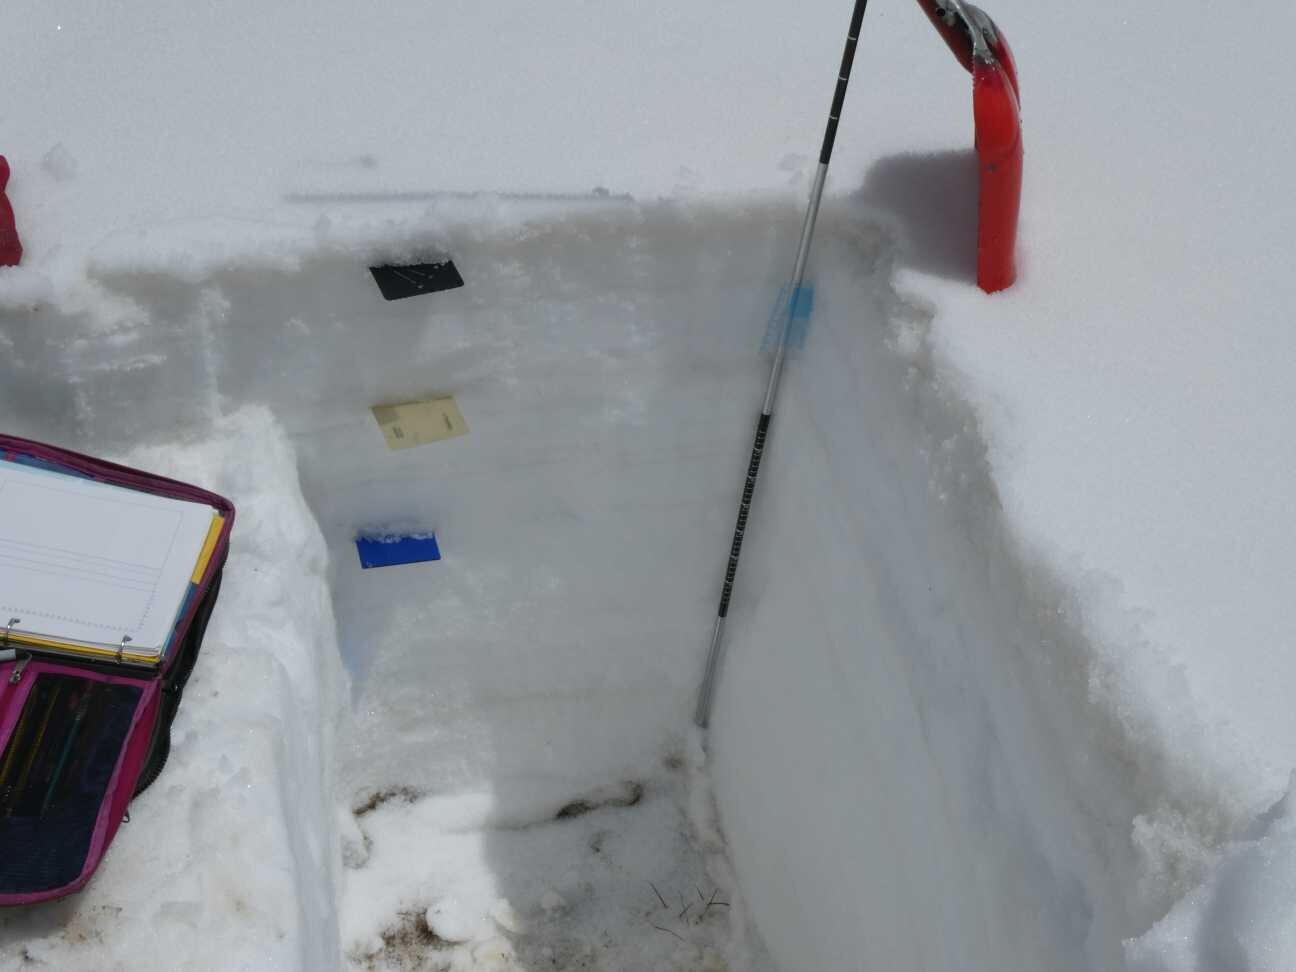
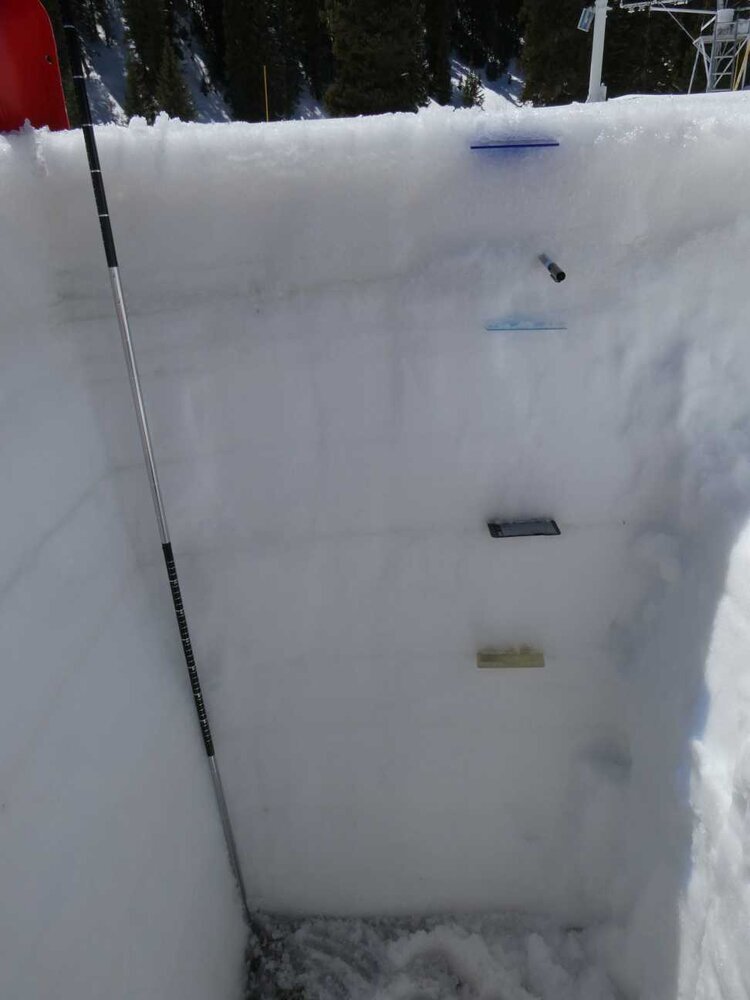
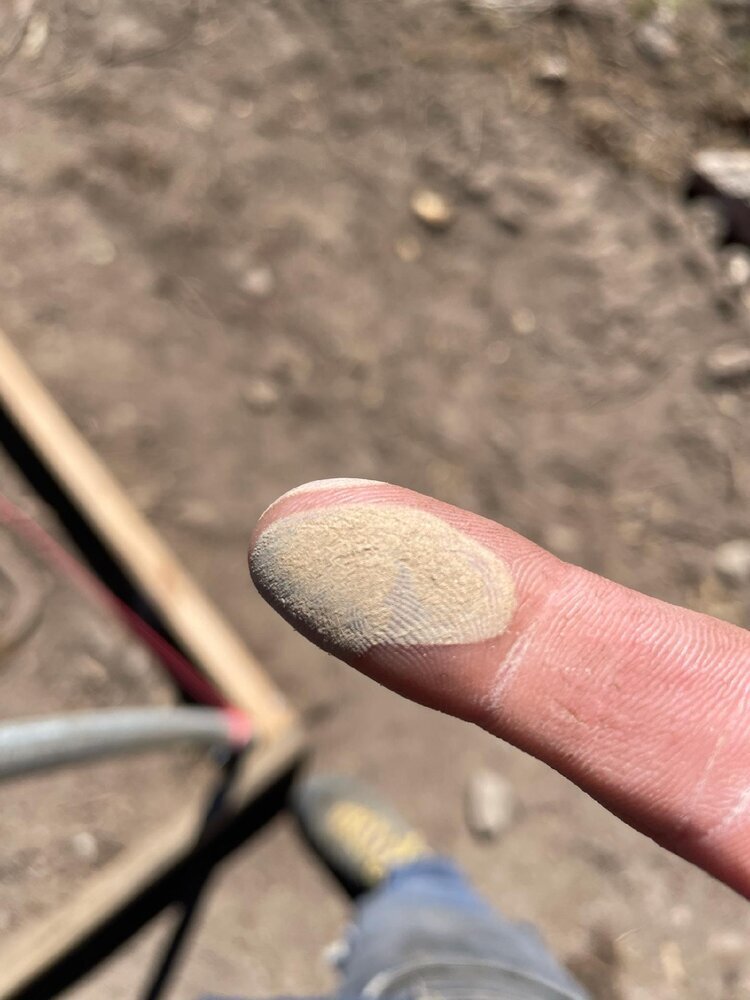
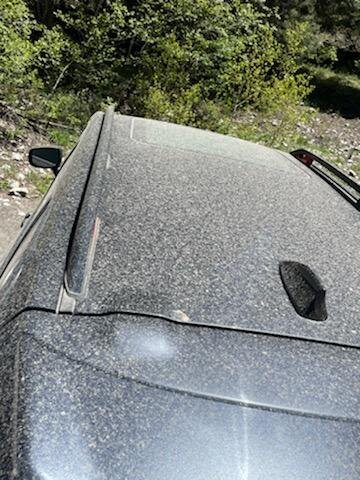
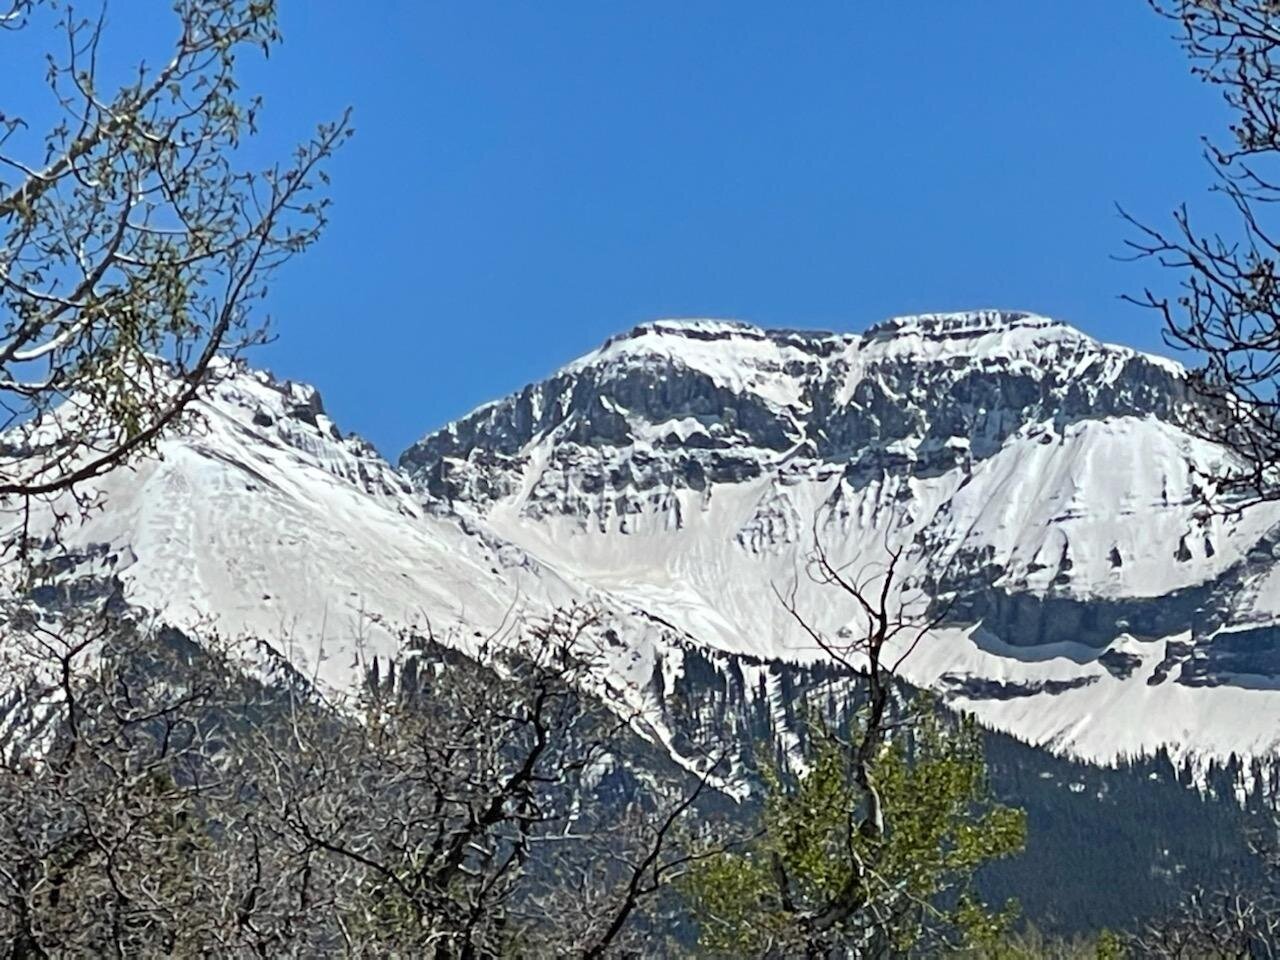
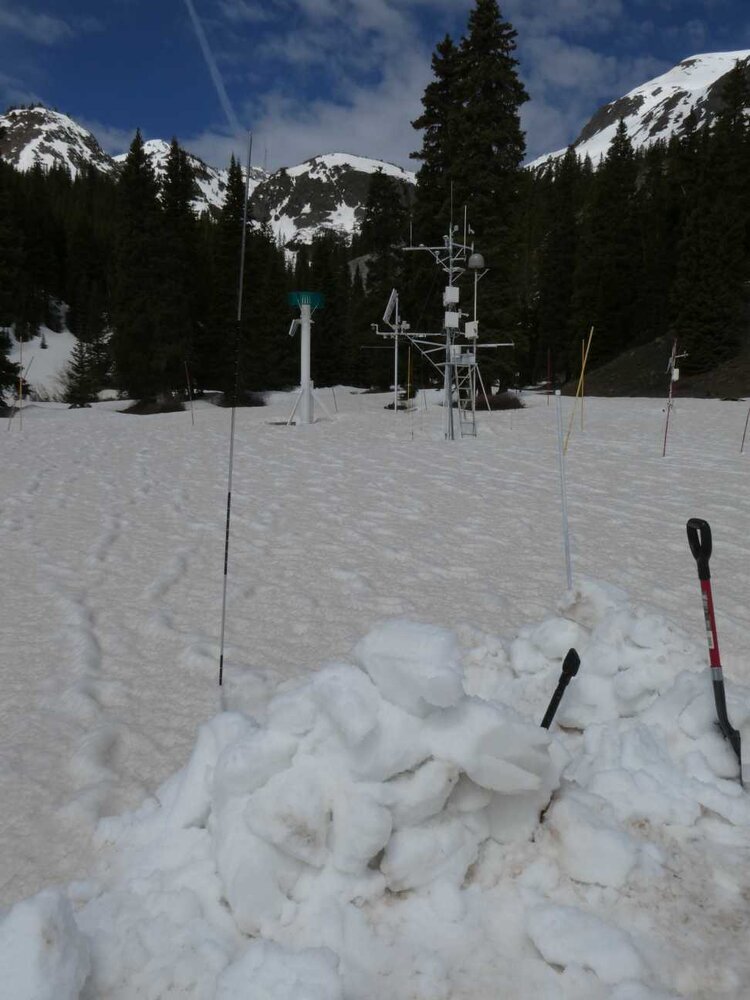
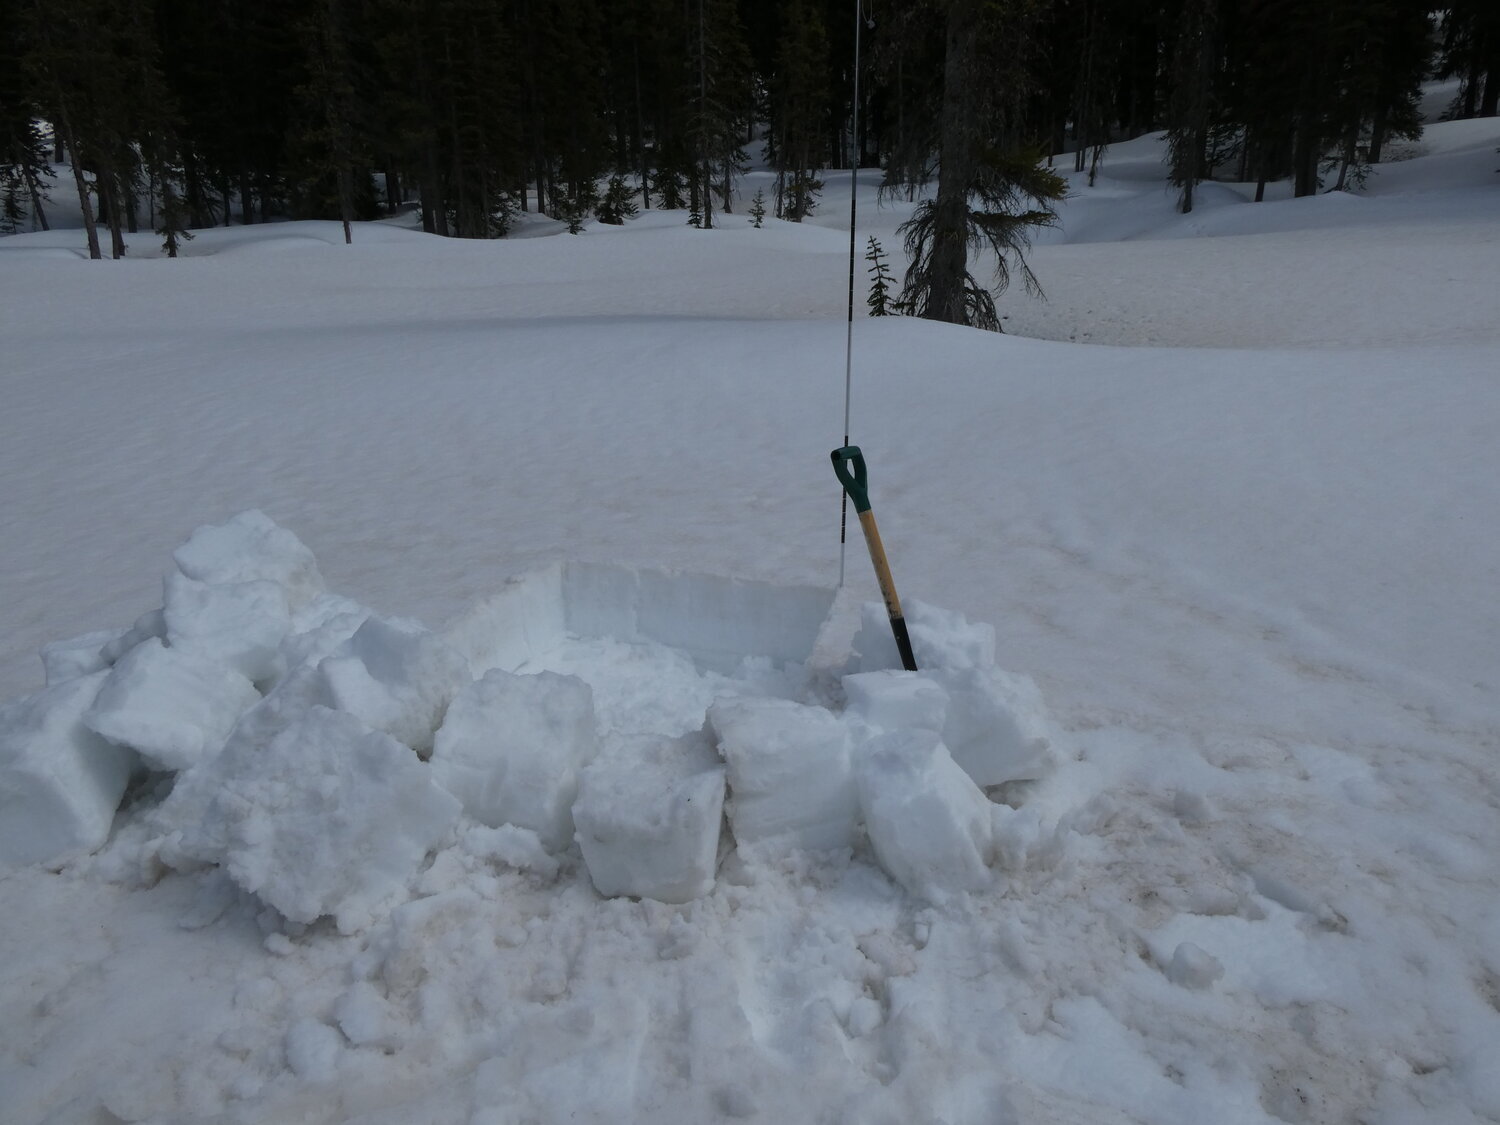
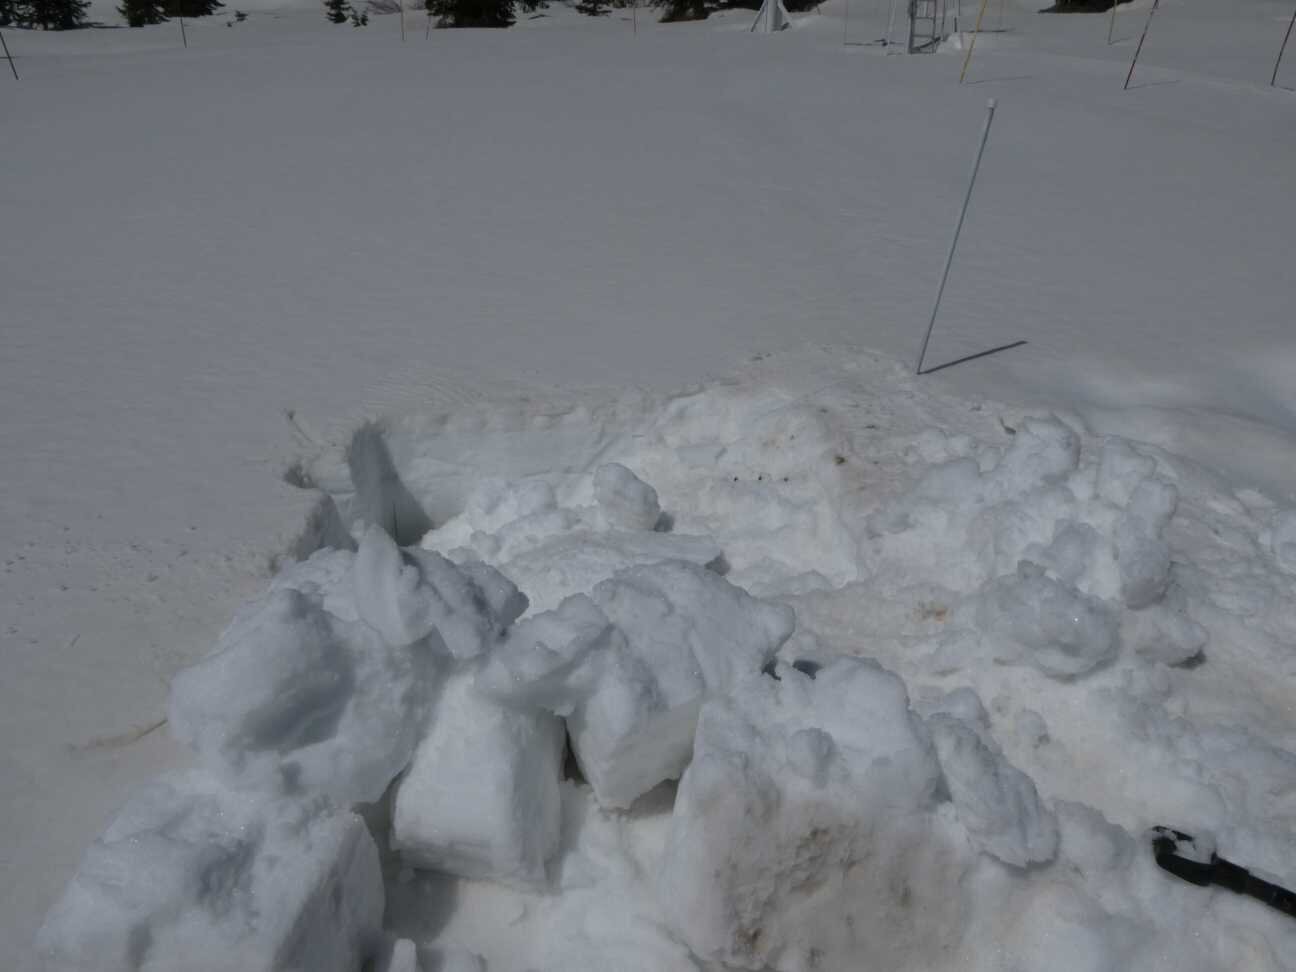
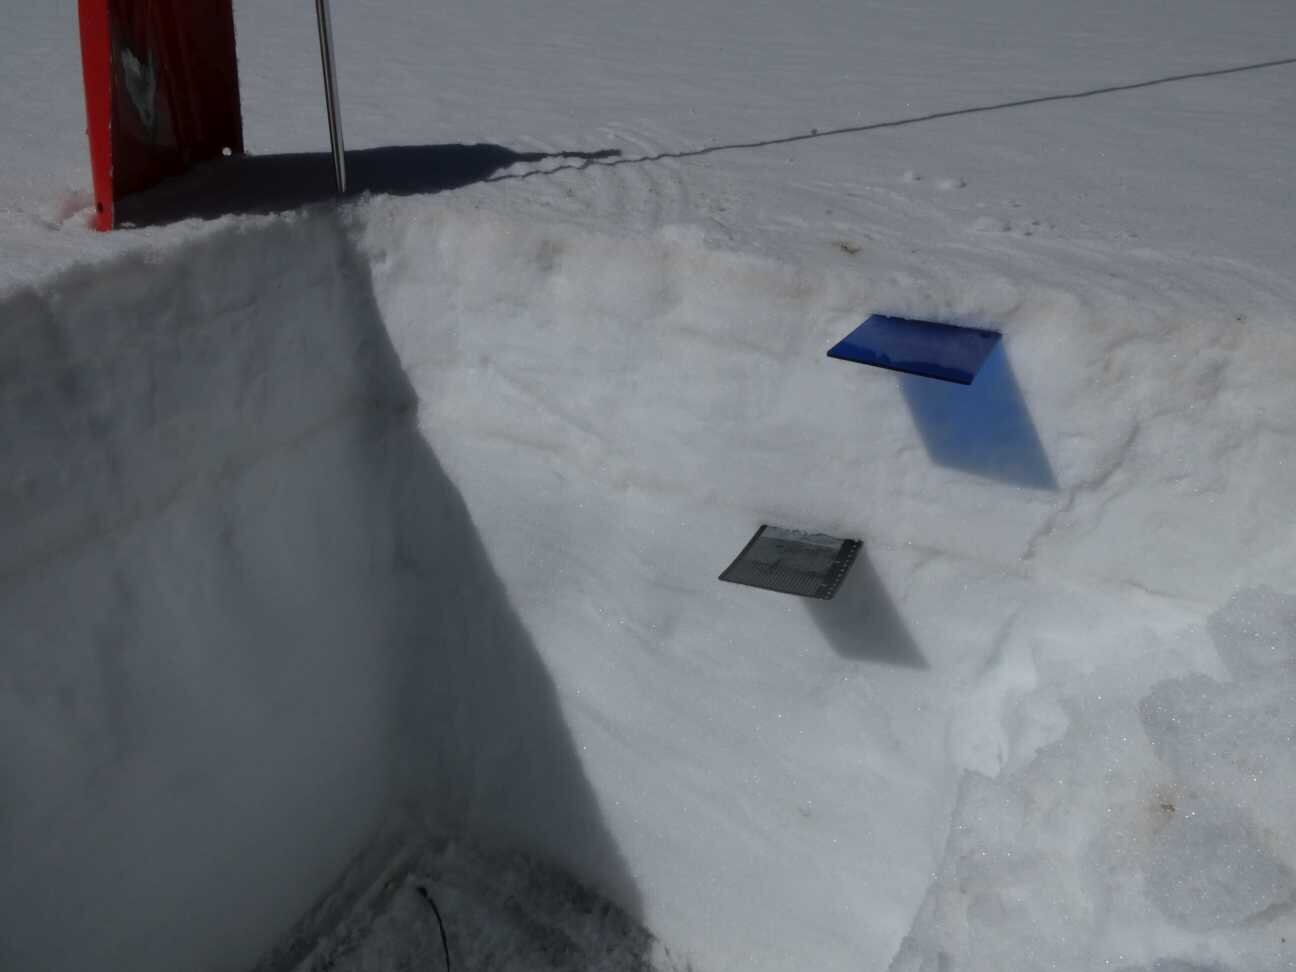
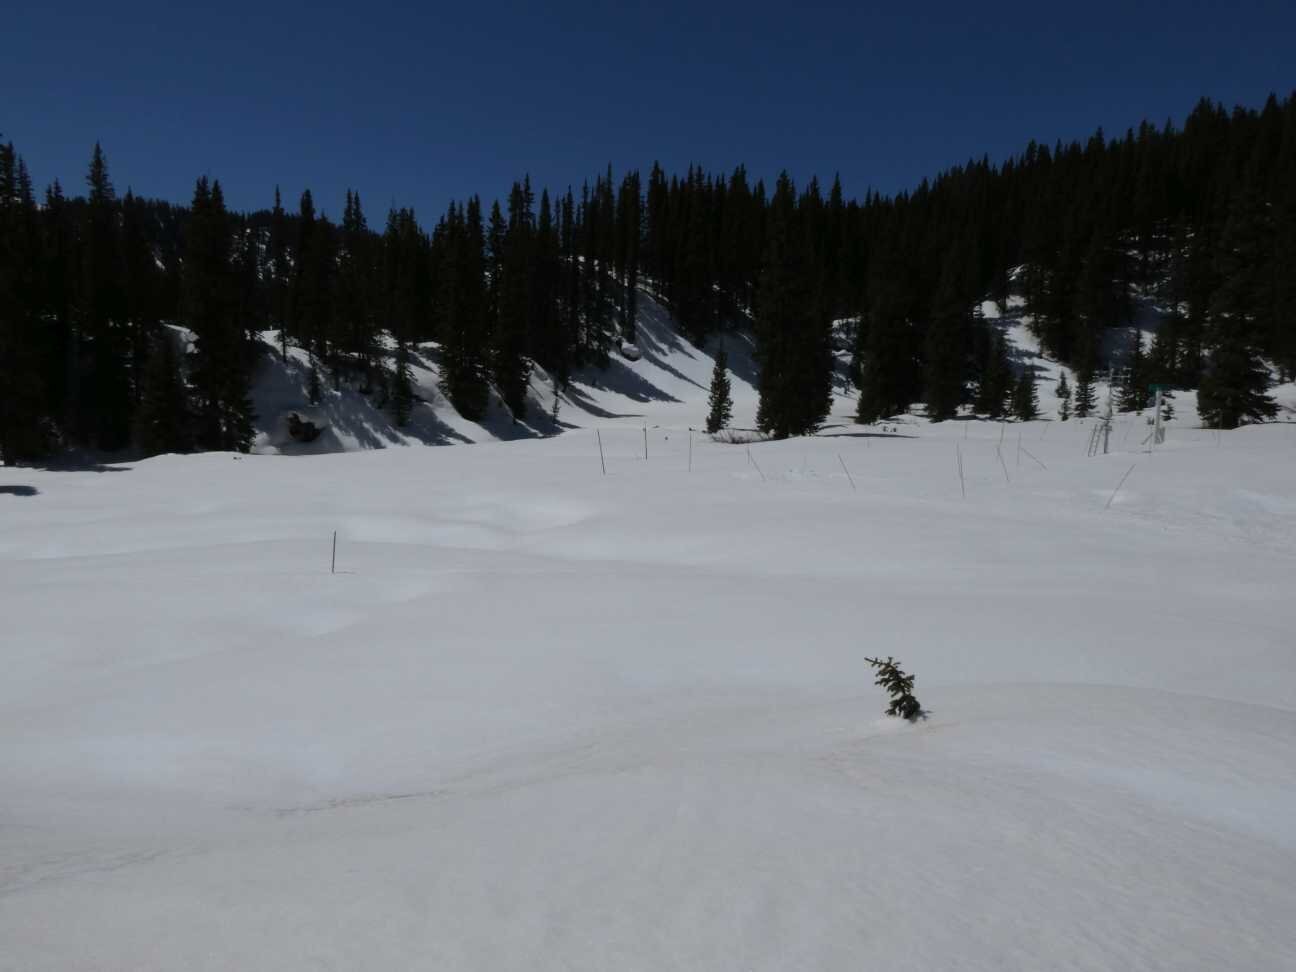
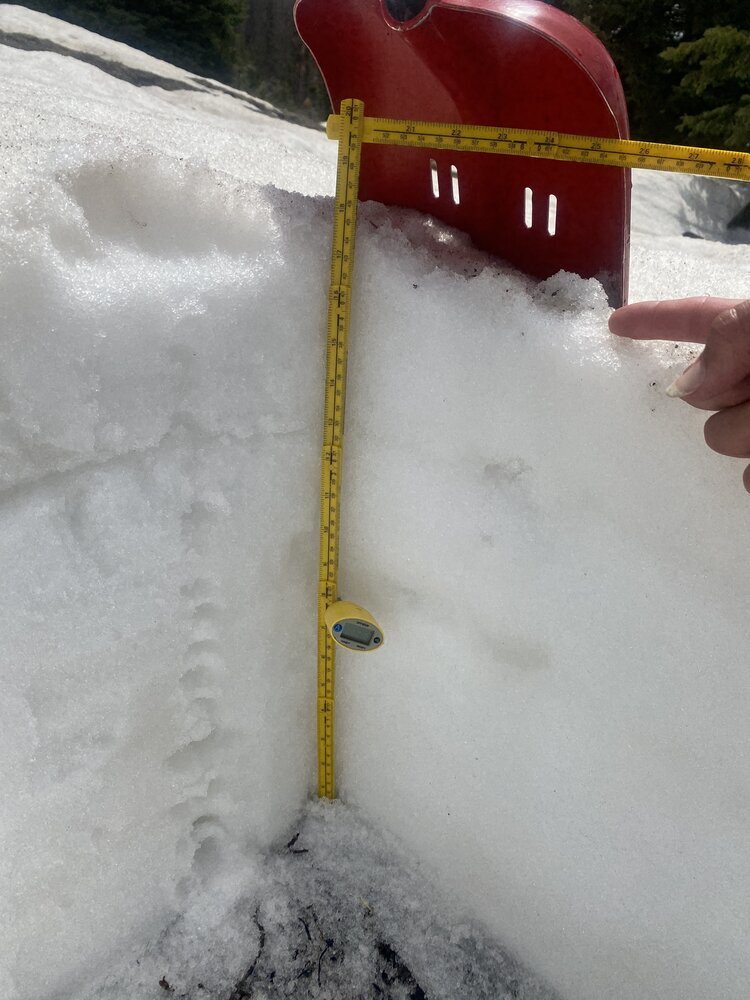
Above: Select photos of dust-on-snow and snowpack conditions for winter WY2021.
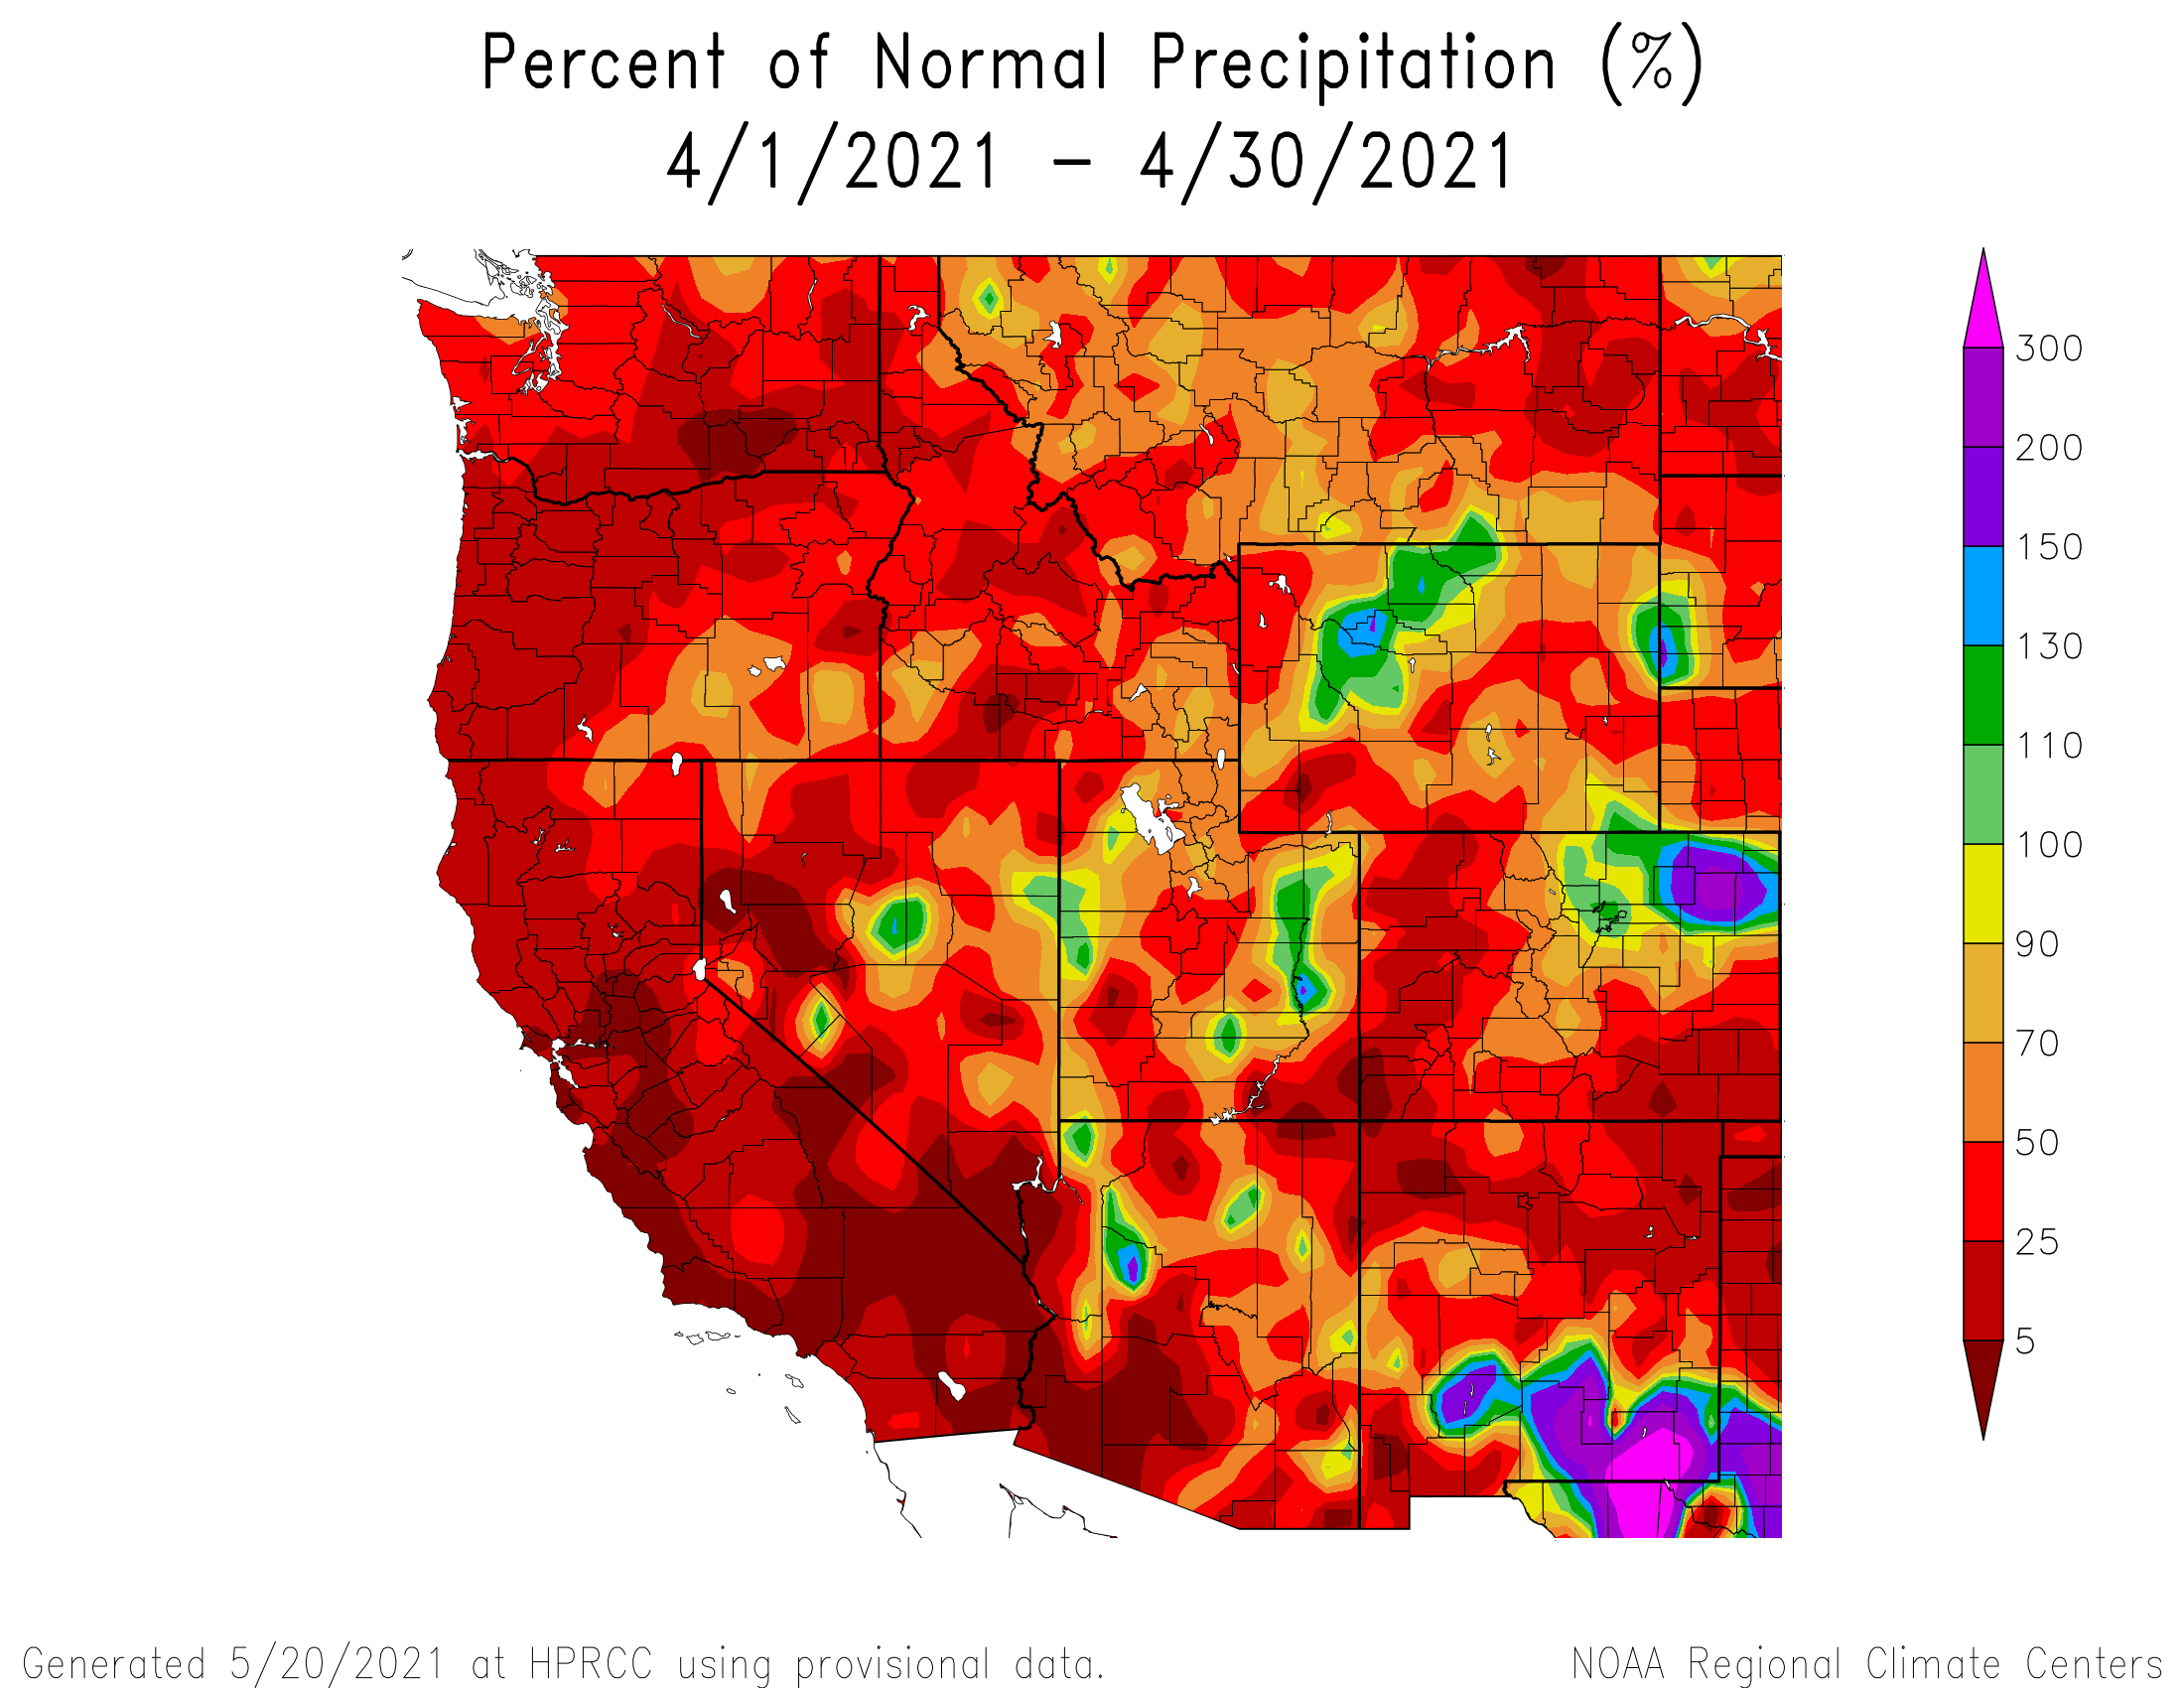
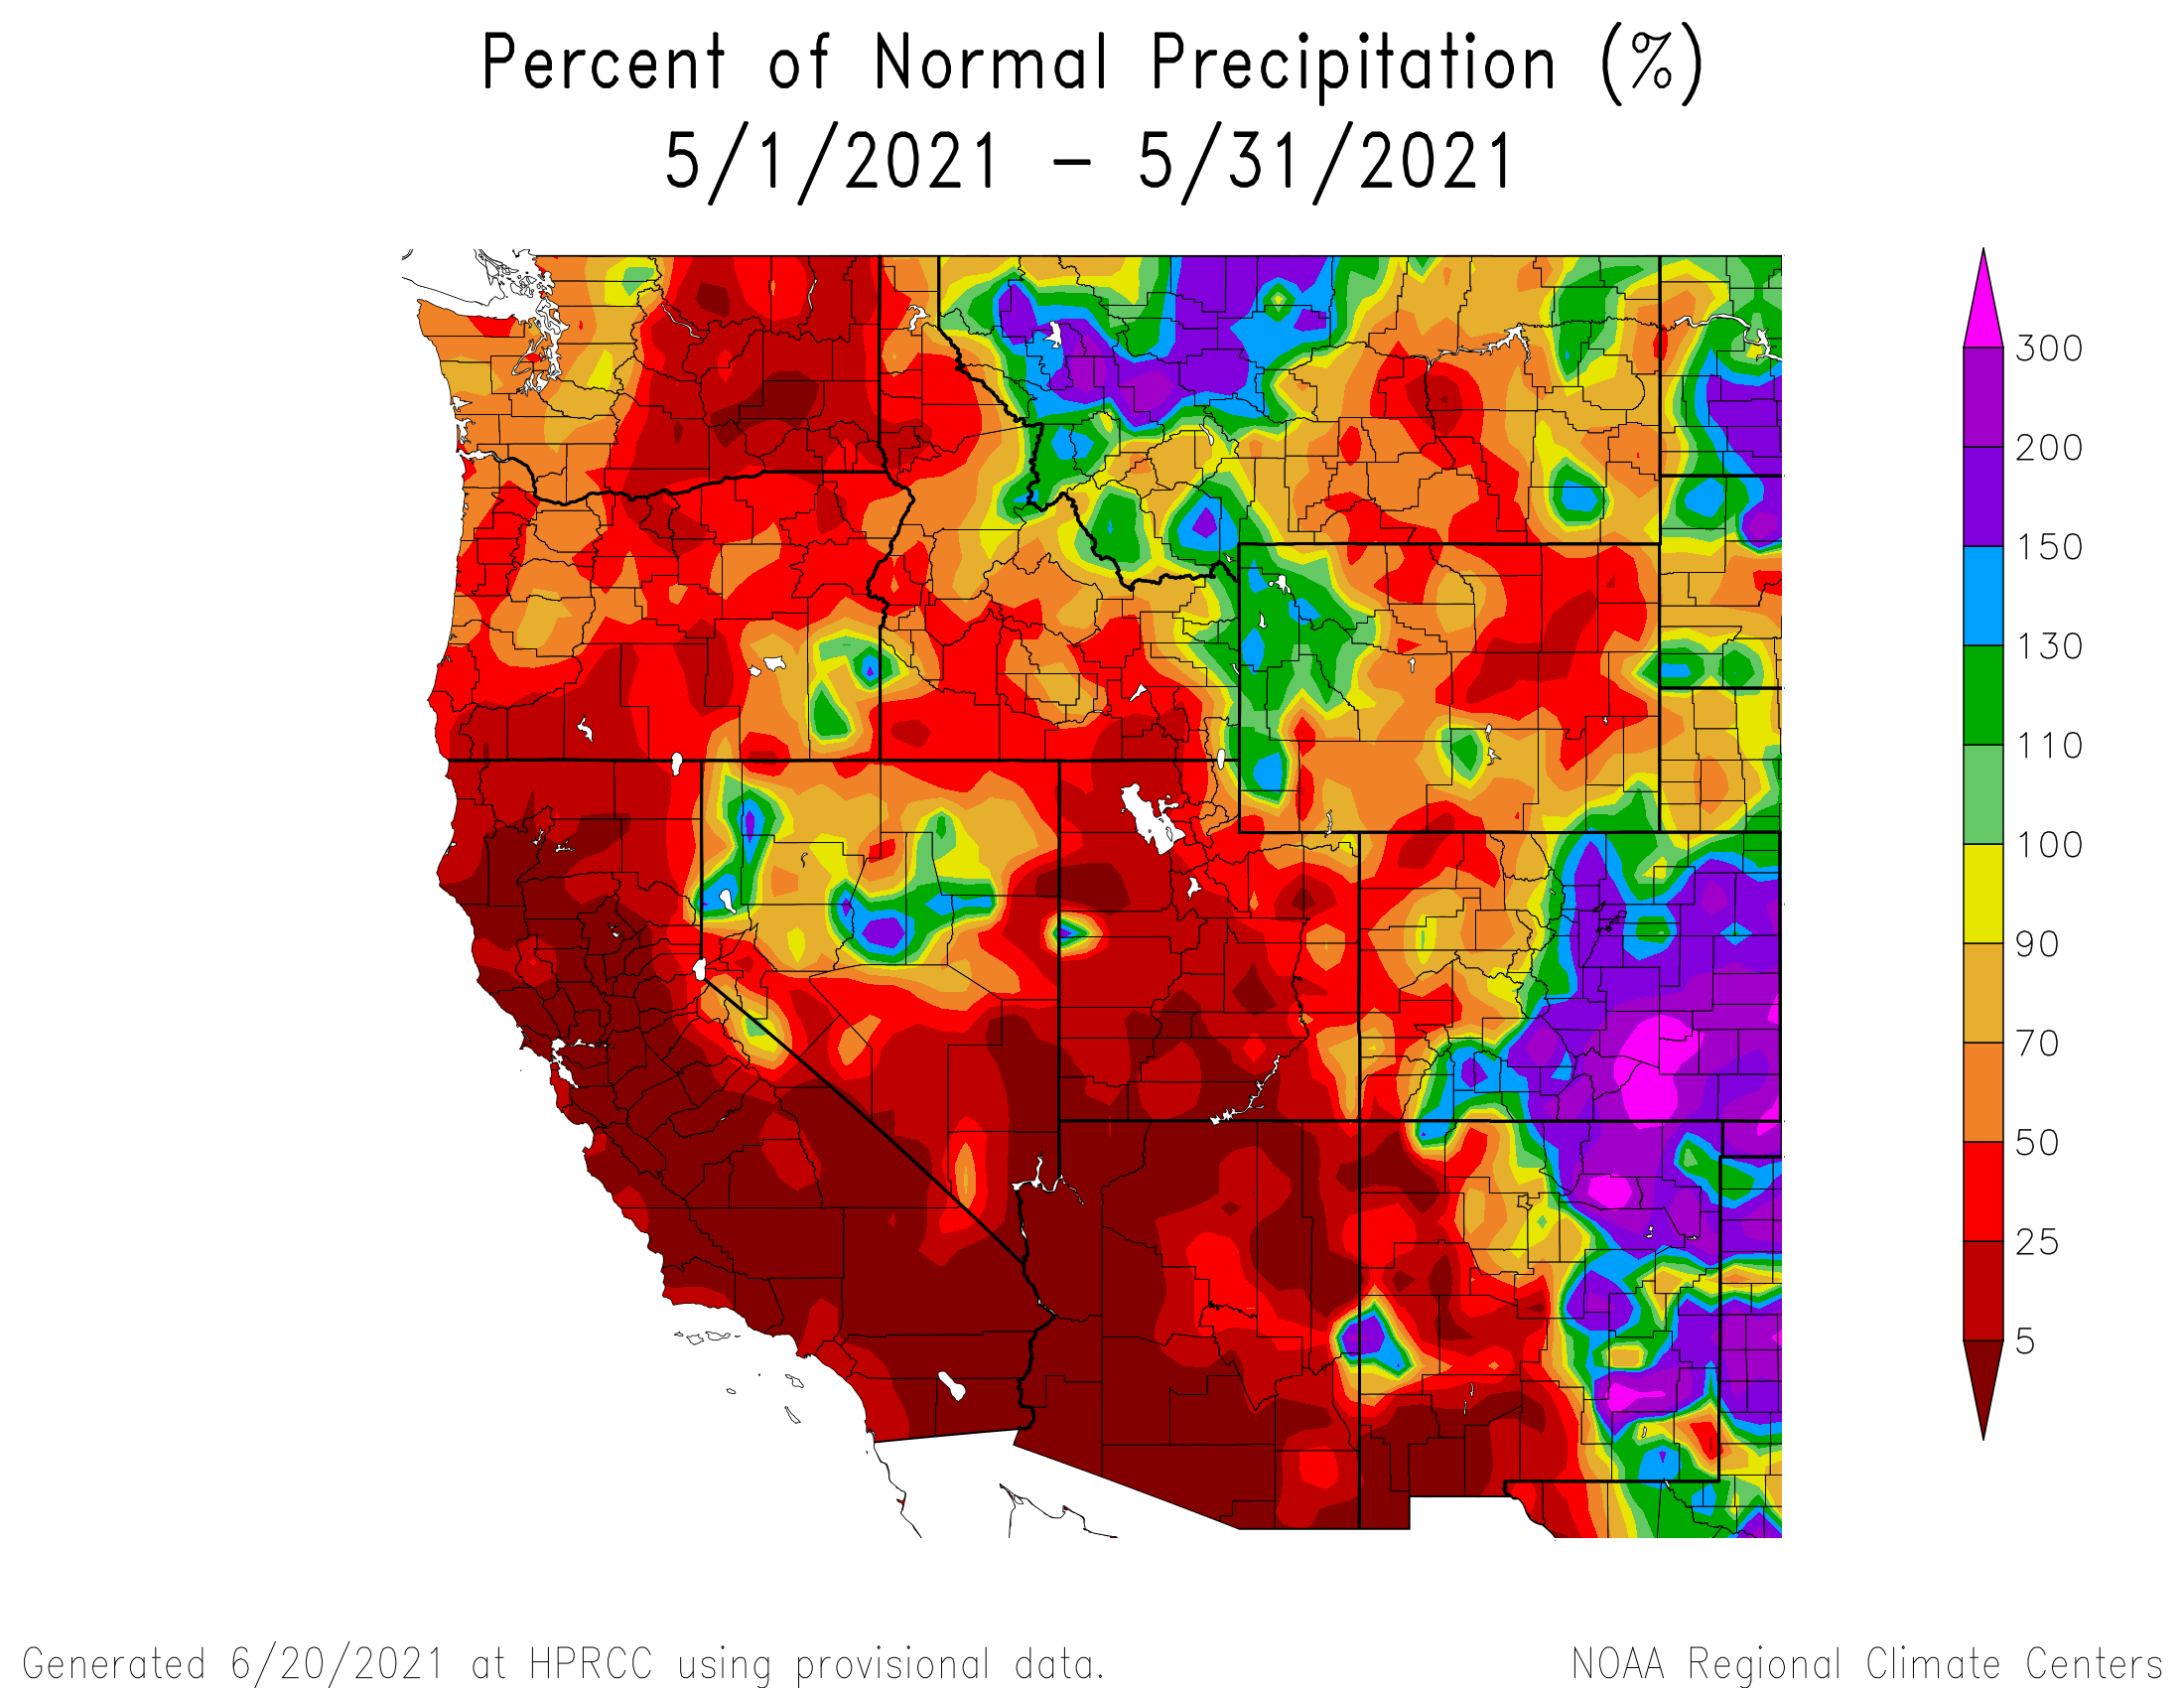
Above: Another mostly dry and hot spring in the mountains. April was very dry with many SNOTEL stations reporting 25% of normal precipitation or less. The northeastern mountains fared a little better being largely in the 75th percentile. May was dismal as well for the western mountains. It was good to see the South Platte, at least one major basin, maintain near normal conditions.
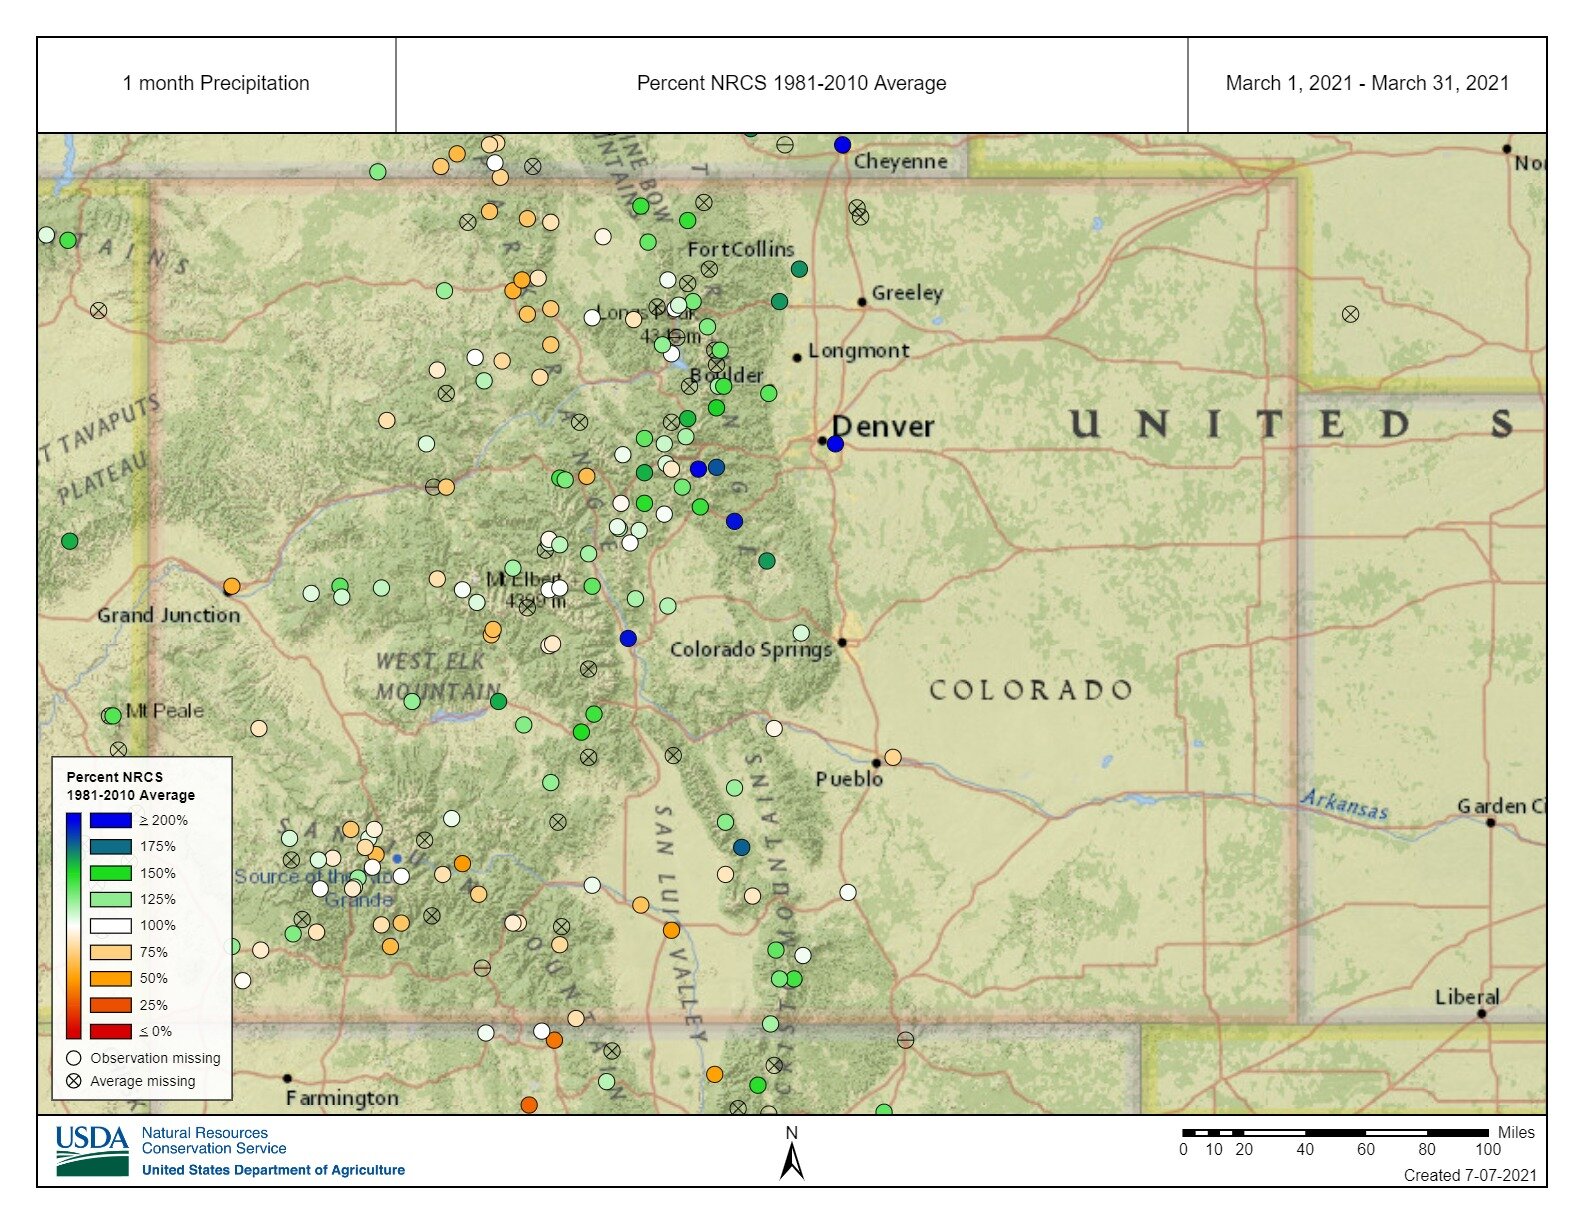
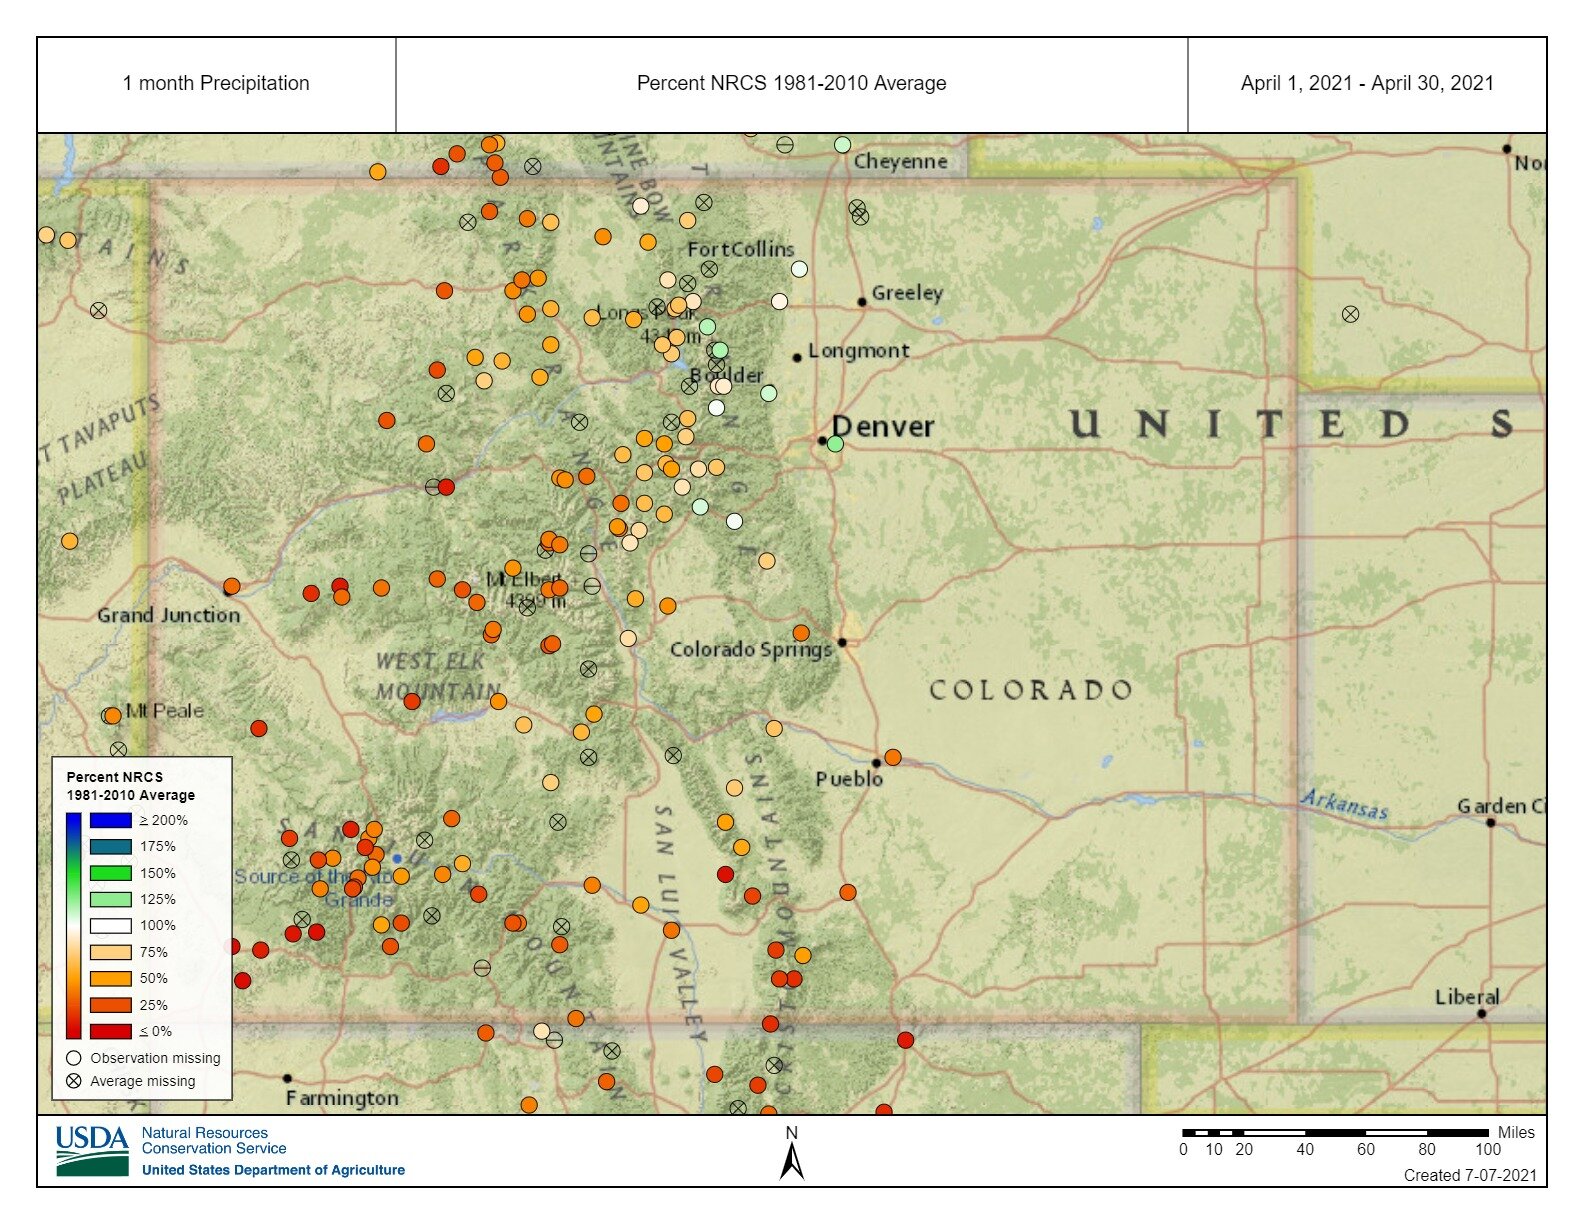
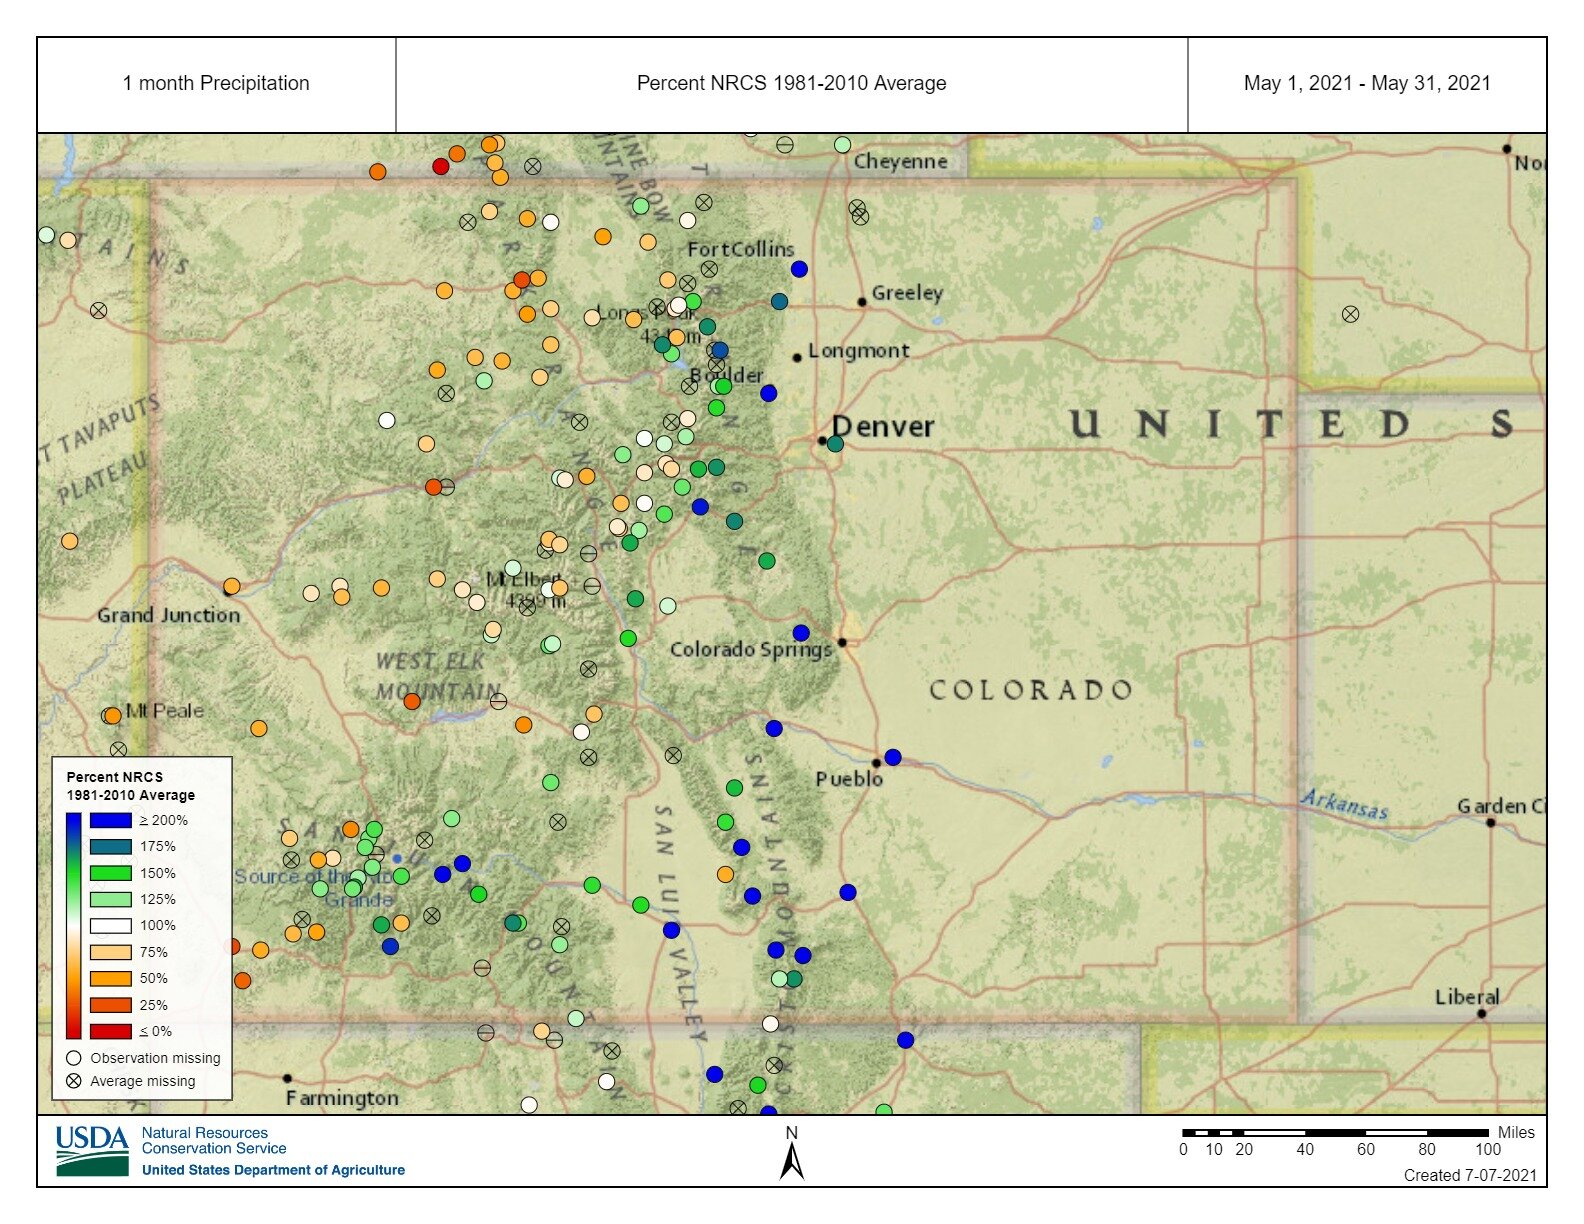
Above: Precipitation at SNOTEL stations for March, April, May. April was very dry statewide. May particularly was very spotty as to which station saw moisture but the Front Range mountains, Rio Grande and northeast mountains benefited most.
SENATOR BECK STUDY BASIN DATA
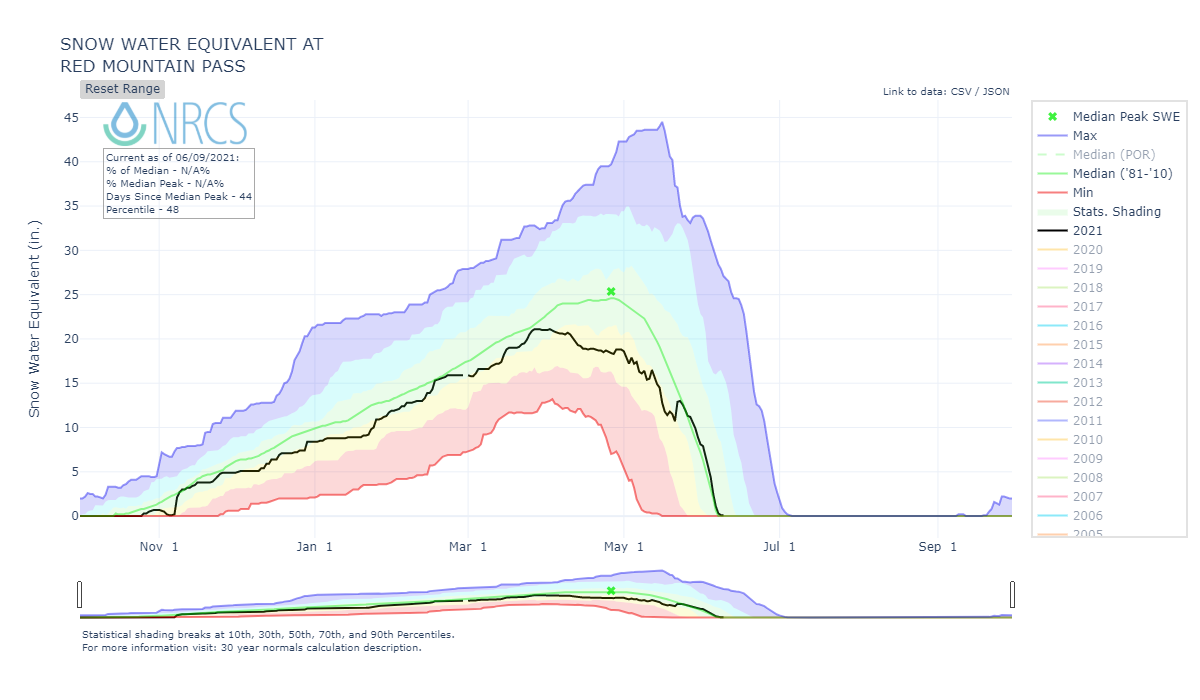
This section describes conditions and data collected by the Center for Snow and Avalanche Studies at our Senator Beck Basin Study Area (SBB) at Red Mountain Pass under our Mountain System Monitoring program, which includes the Colorado Dust-on-Snow Program (CODOS). At SBB, snowpack, weather, soils, and radiation conditions are monitored and measured at the well-sheltered subalpine Swamp Angel Study Plot (SASP, 11,060’) and at the more exposed, alpine Senator Beck Study Plot (SBSP, 12,180’). Nearby, wind speed, wind direction, air temperature, and humidity data are collected at the Putney Study Plot (PTSP, 12,323’), located to minimize the influence of local terrain on those measurements. Finally, SBB streamflow discharge is continuously measured at the SBB pour point at the Senator Beck Stream Gauge (SBSG, 11,030’), in a broad-crested, notched weir.

Winter got off to a decent start but then started falling behind in the storm count a bit. The lack of spring storms, productive storms, really took its toll. The above storm count plot looks a lot like the cumulative precipitation plot below, as storms tapered off in spring so did any additional snow accumulation. All total we received 19 storms this winter, the average is around 24. A storm is defined as receiving 12 mm or more of precipitation with no break in precipitation greater than 12 hours. April and May each observed only 2 winter storms. This winter we had a total 4 more storms than we did in WY2018, a notoriously dry year. Winter storm reports can be viewed at the snowstudies.org website.

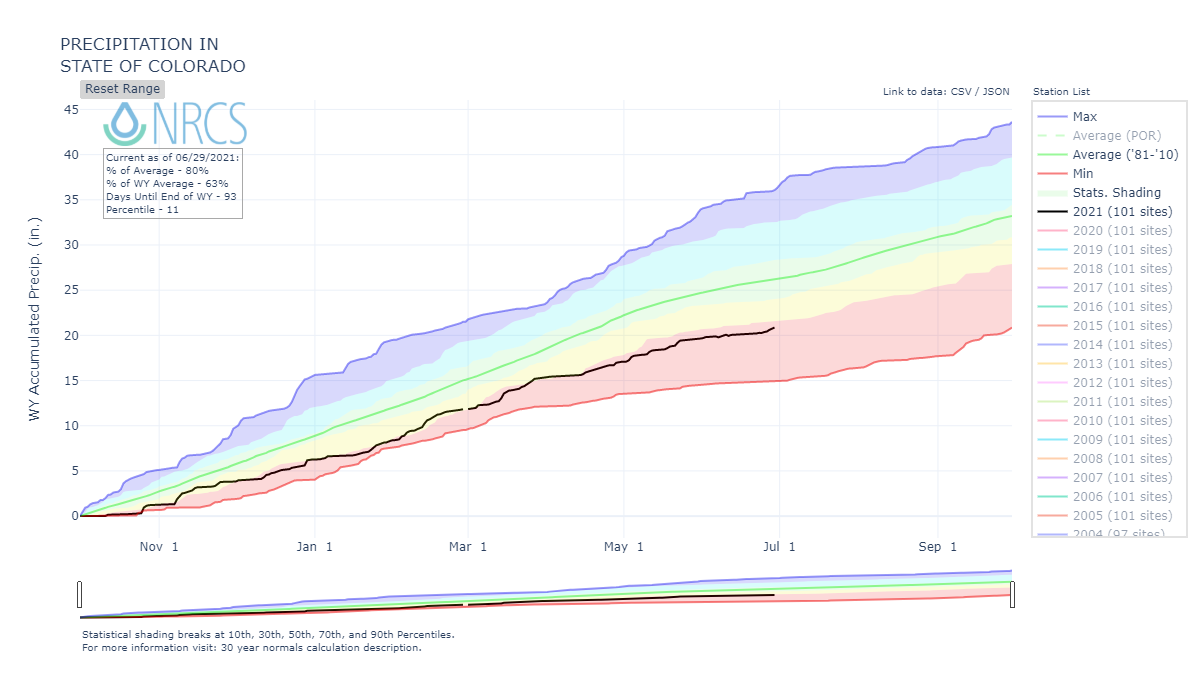
The above graph shows precipitation at SASP with snow depth at SASP and SBSP. After an early and encouraging start to the season, it turned largely dry mid-November thru first part of December. The winter up until April had some good storms but nothing earth shattering and struggled overall. After steady but below normal accumulation most of winter the crucial spring season turned even drier and hotter. One good storm occurred on May 21.

Above: Water Year 2021 cumulative precipitation, in April we received 2.0” precipitation and in May we received 4.0”. The average is closer to 4.4” and 3”, respectively.
SNOWPACK CONDITIONS
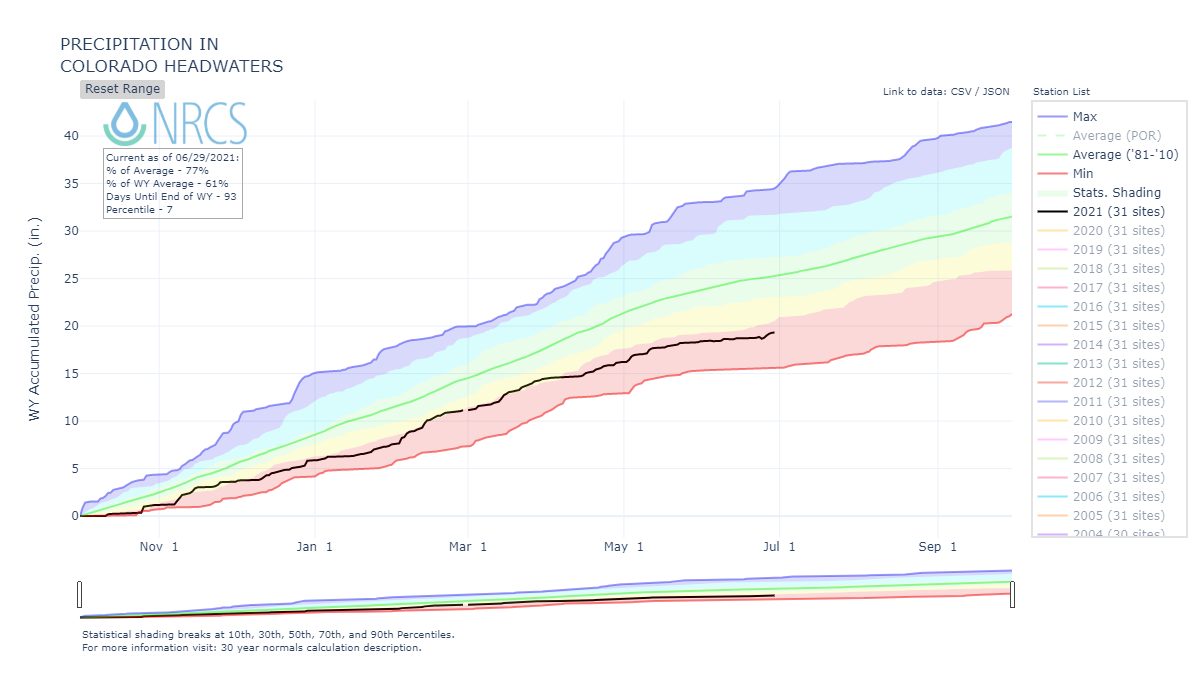
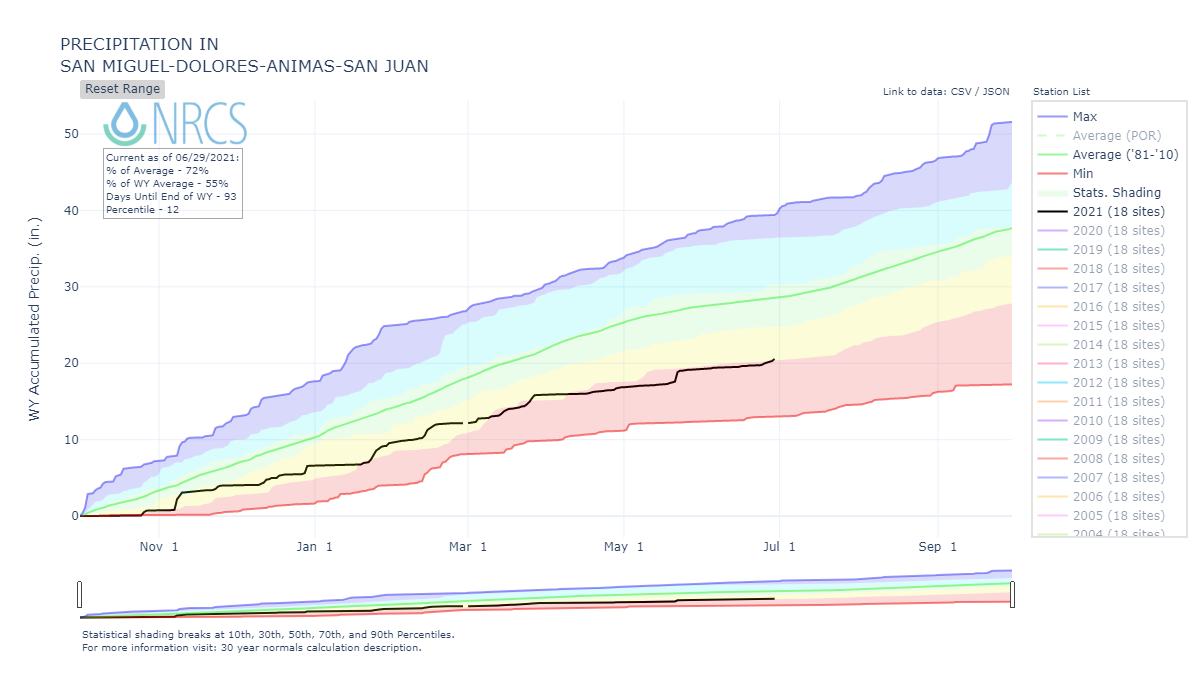
We went into winter already struggling with a failed monsoon leaving Colorado in extreme/exceptional drought conditions. We saw a glimpse of winter October 24-26 when a significant snow storm hit the mountains and valleys which started the WY2021 snowpack even though it largely ablated in many areas. This storm also brought very low temperatures but October overall was nonetheless drier and hotter than average. Actually, pretty much the majority of the mountain regions were below normal precipitation the entire winter season. This of course varied but it was really hit and miss as to which region found itself in the middle of a storm track. In a bit of a reversal from the norm, the central and northern mountains did not benefit to the usual degree from storm tracks out of the Pacific Northwest, putting them in a persistent deficit scenario.
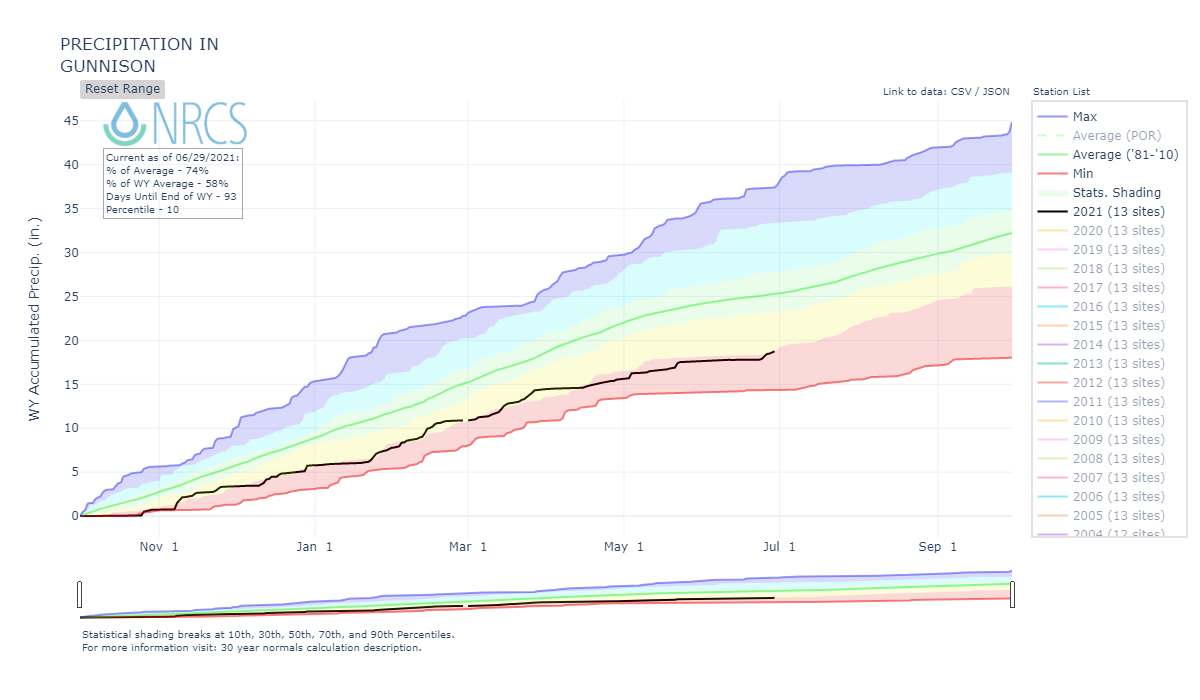
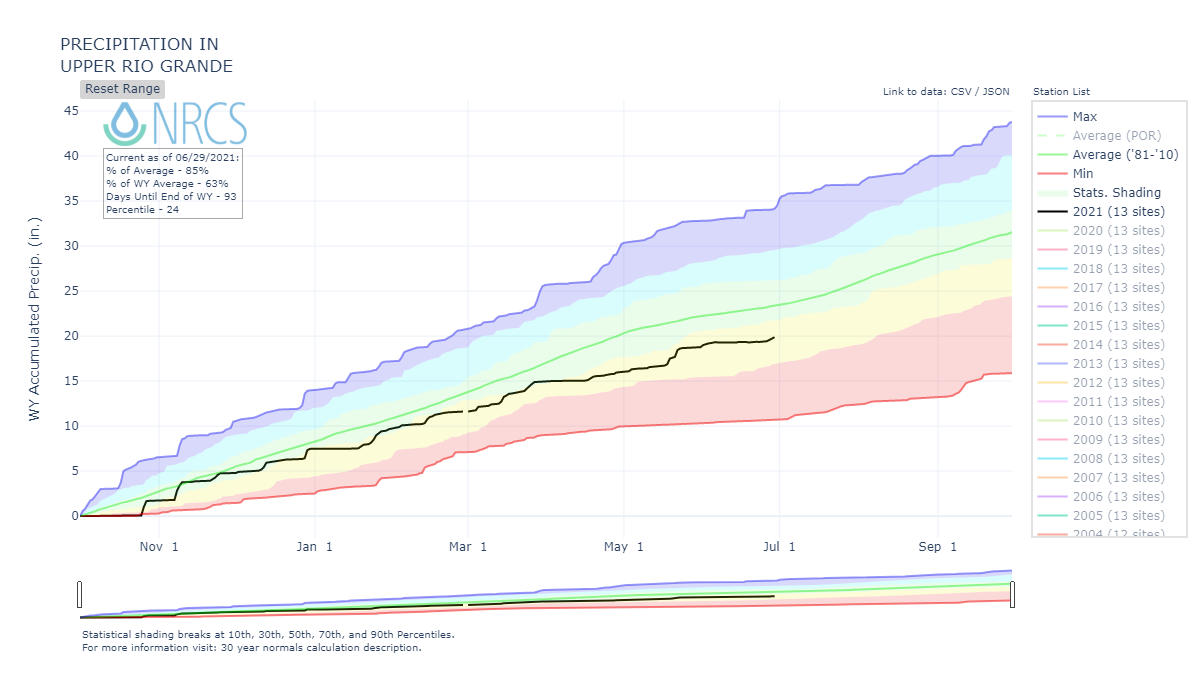
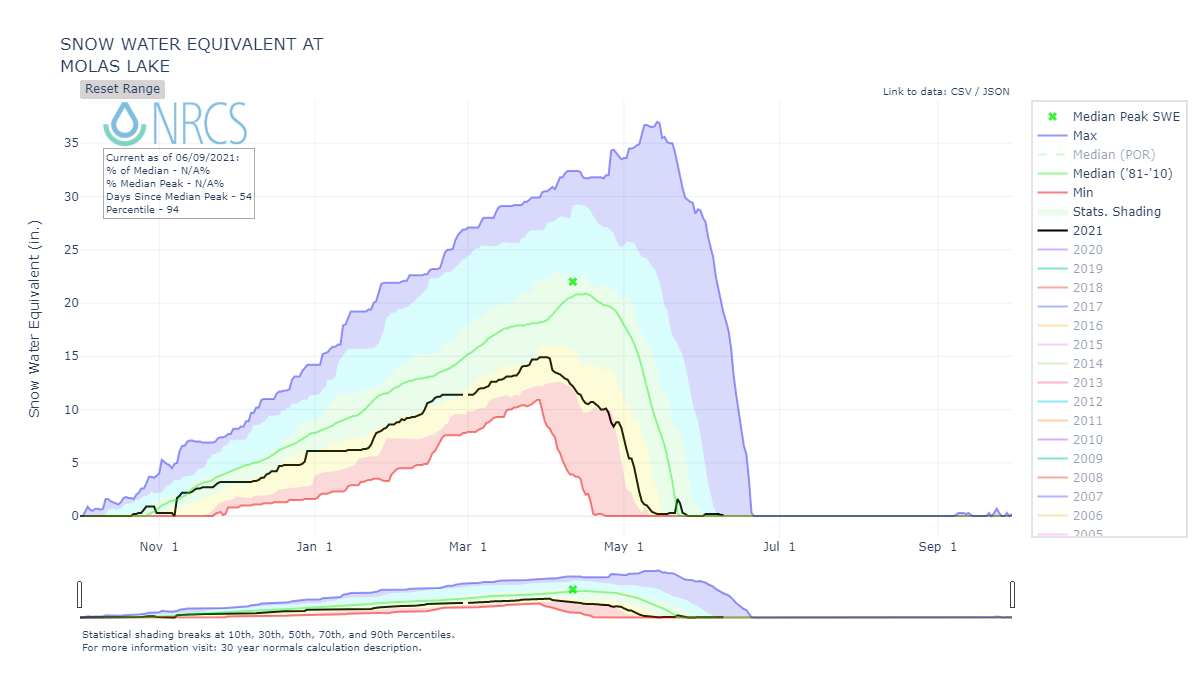
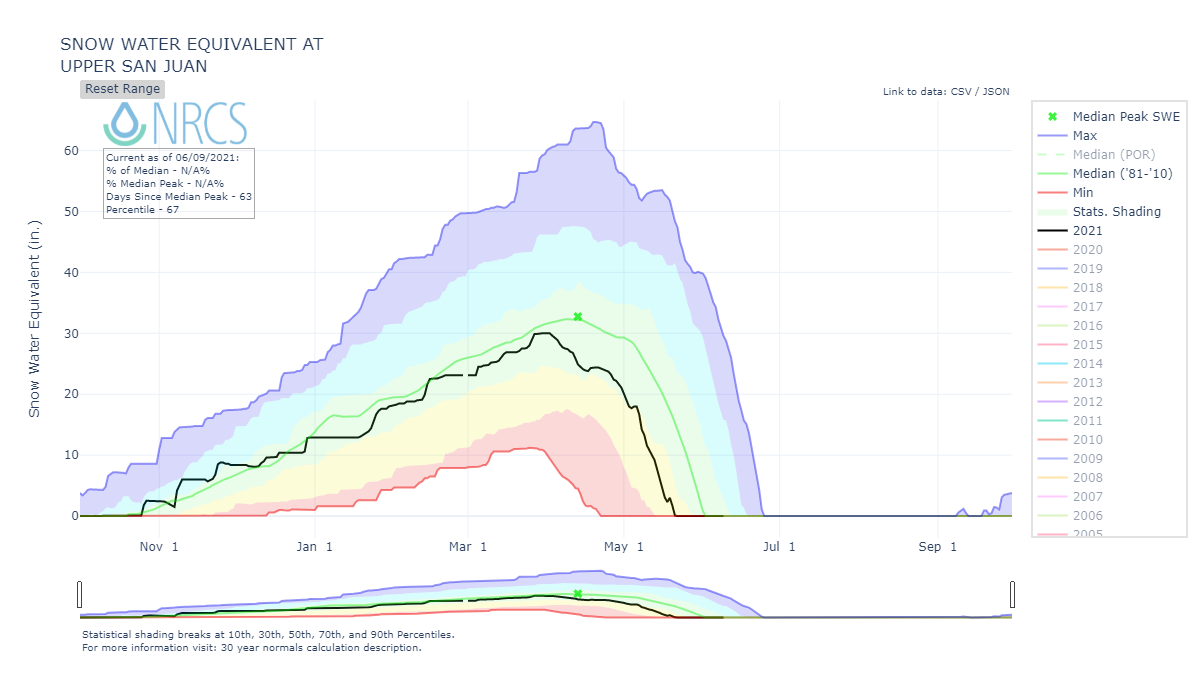
The majority of basins saw a steady but below average increase in snow accumulation from October-April 1, around April 1st it appeared the winners were the Arkansas and Rio Grande Basin with near normal SWE conditions as reported by SNOTEL stations. Then very similar to last year, starting right near April 1st, hot/dry conditions intensified rapid snowpack ablation around the state including the Arkansas and Rio Grande. A few storms allowed for a brief slowdown (SBB received 2 storms in April and 2 in May), but not enough to repair the season-long deficit to any real degree. A May 21st storm provided a nice boost that delayed full snow ablation by about a week at the ~11,000’ elevations and higher, otherwise snow-all-gone would have been even earlier.
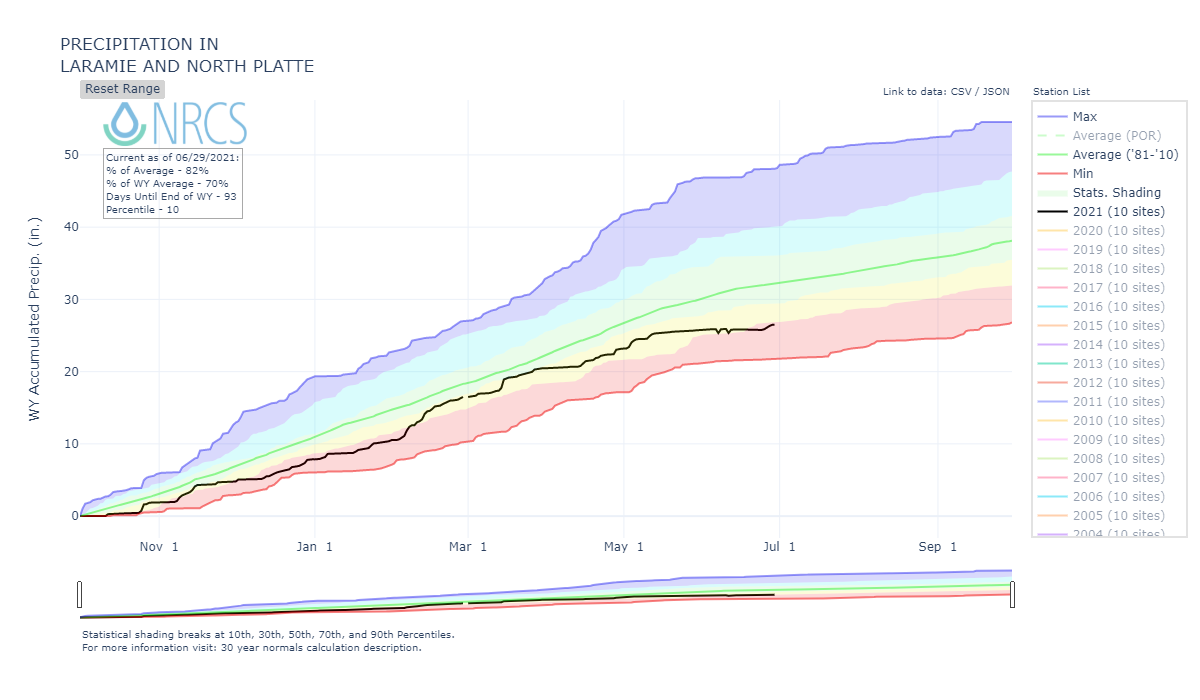
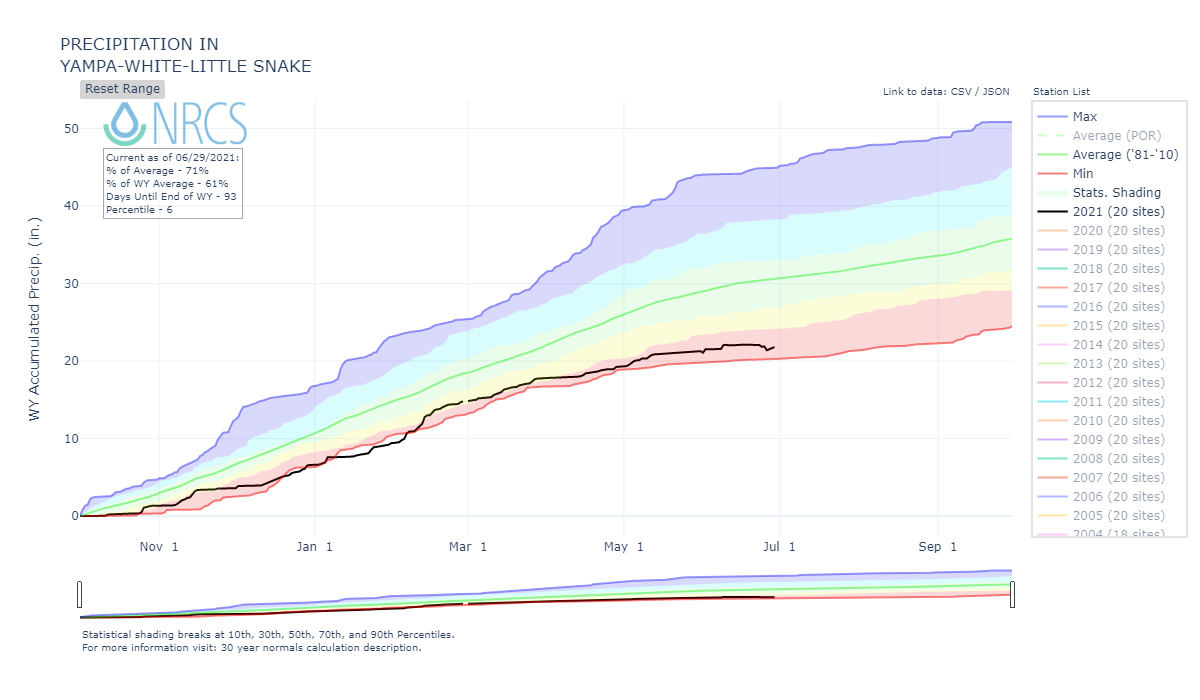
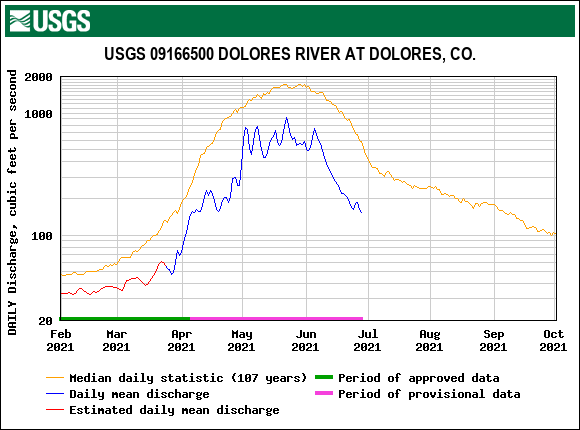
Snow was gone at Swamp Angel Study Plot (11,060’) on June 4, exactly on the average date. Snow was gone at Senator Beck Study Plot (12,200’) on June 11, roughly 3 days earlier than normal. the Upper Rio Grande SNOTEL stations melted out a couple weeks early (June 5 vs June 20 median). The San Miguel/Dolores/Animas/San Juan Basins SNOTELS’s melted 11 days early (the Dolores May 7 vs May 27 median). The Gunnison held onto a near normal snow-all-gone date. The northwestern basins melted out earlier by about 10 days.
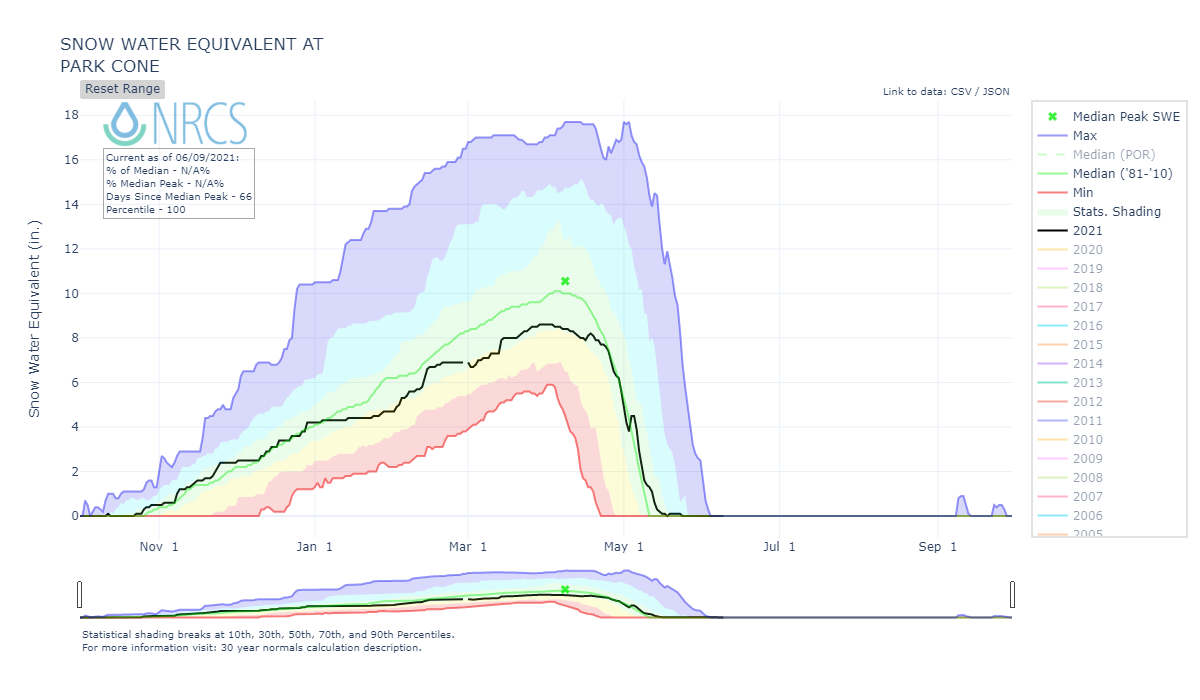
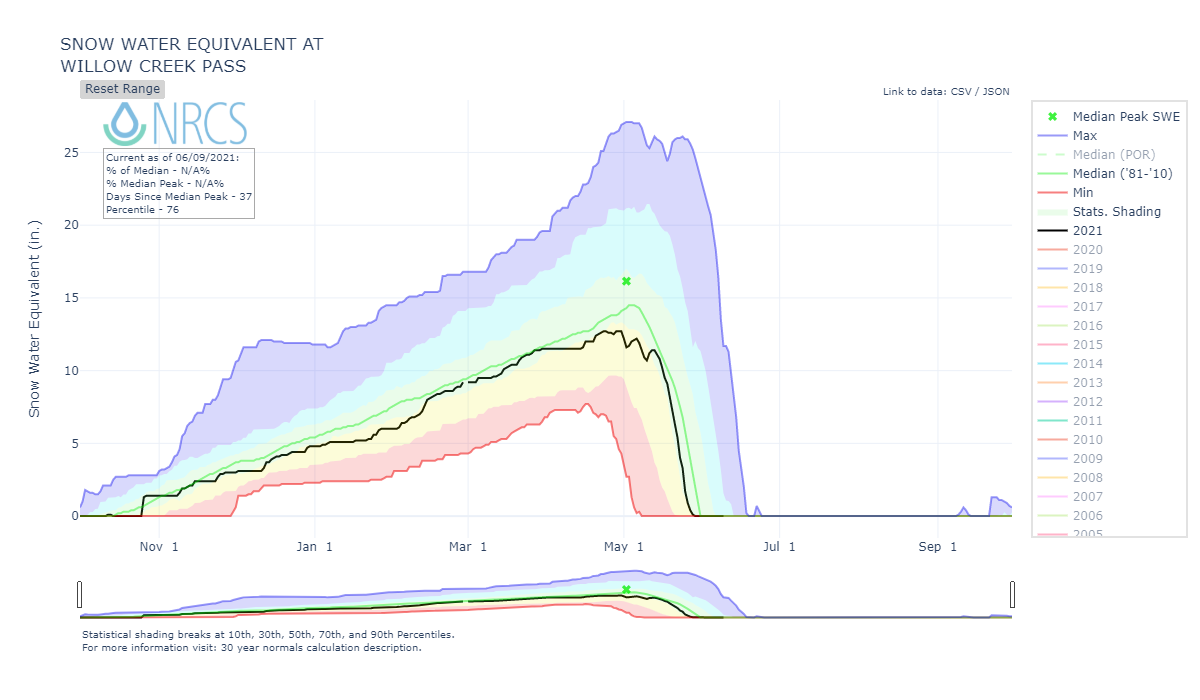
The South Platte was the anomaly. April 1st the Basin was right at median snowpack and started to see rapid depletion similar to other Colorado basins, but the middle of April starting seeing productive storms that continued through the middle of May. This kept boosting the snowpack as well as covered surface dust thereby allowing the snow to stick around longer than usual for most of the bulk of snowmelt season.
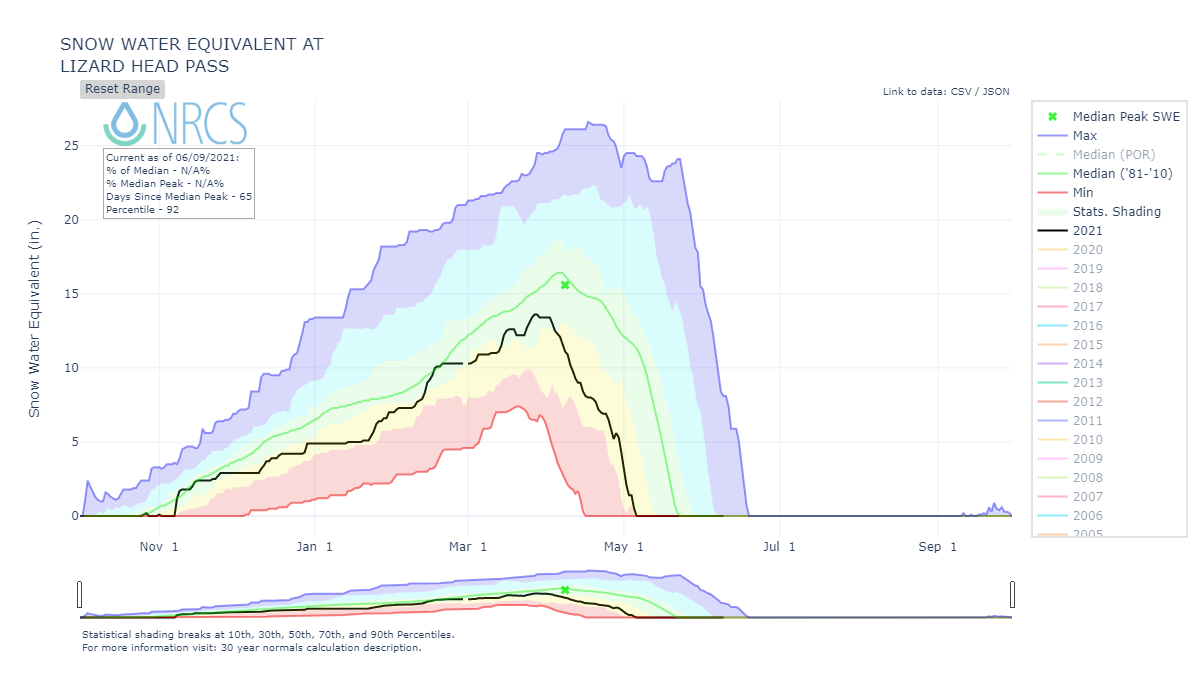
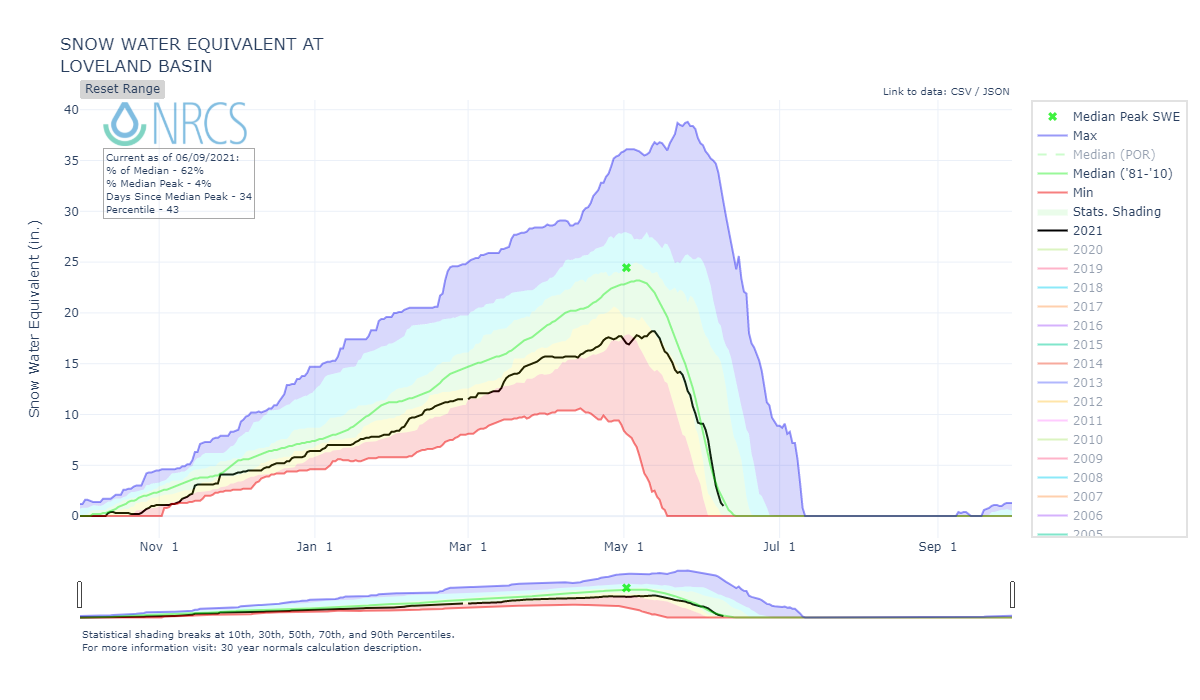
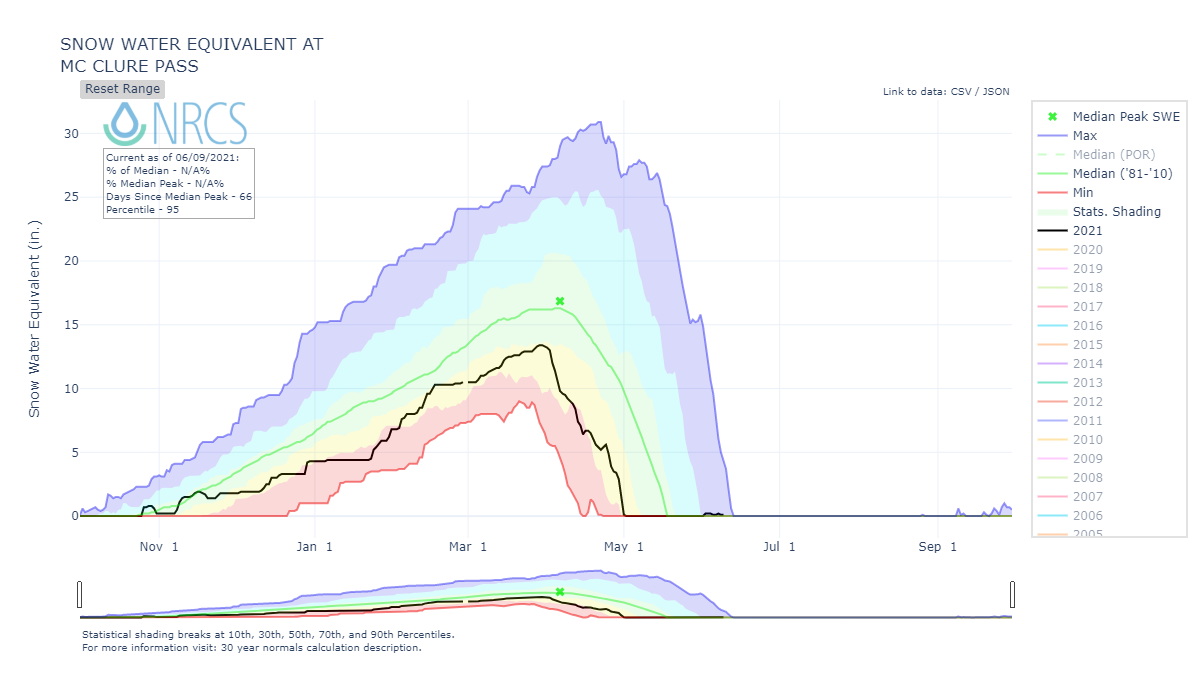
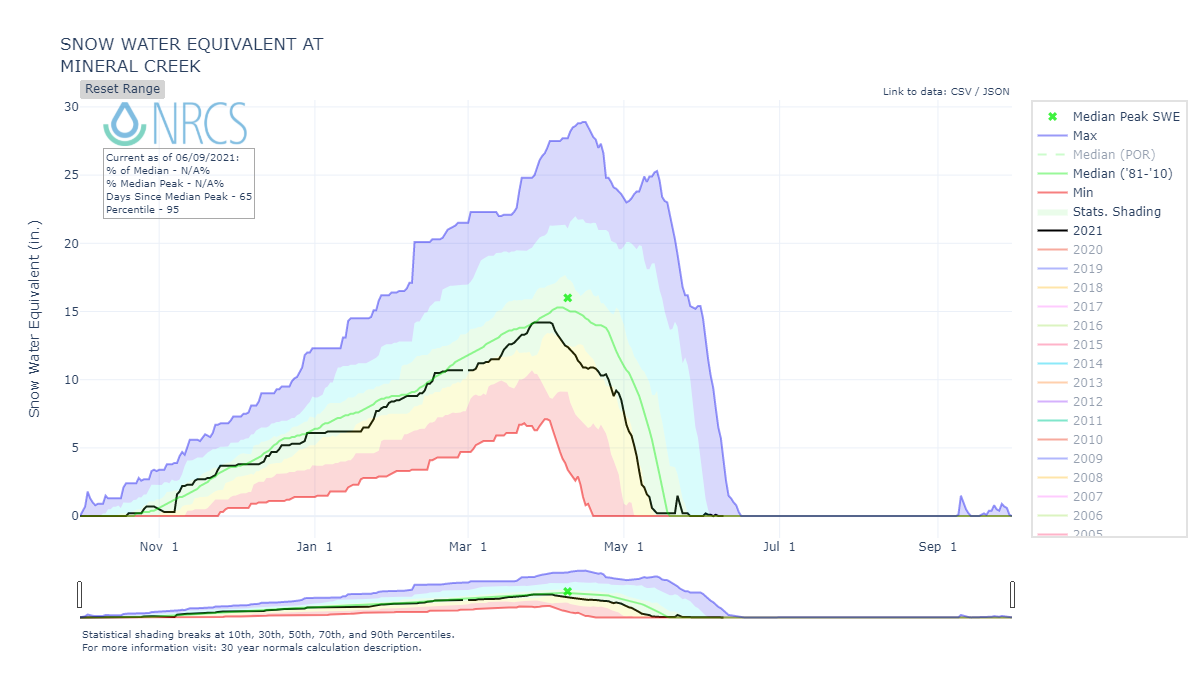
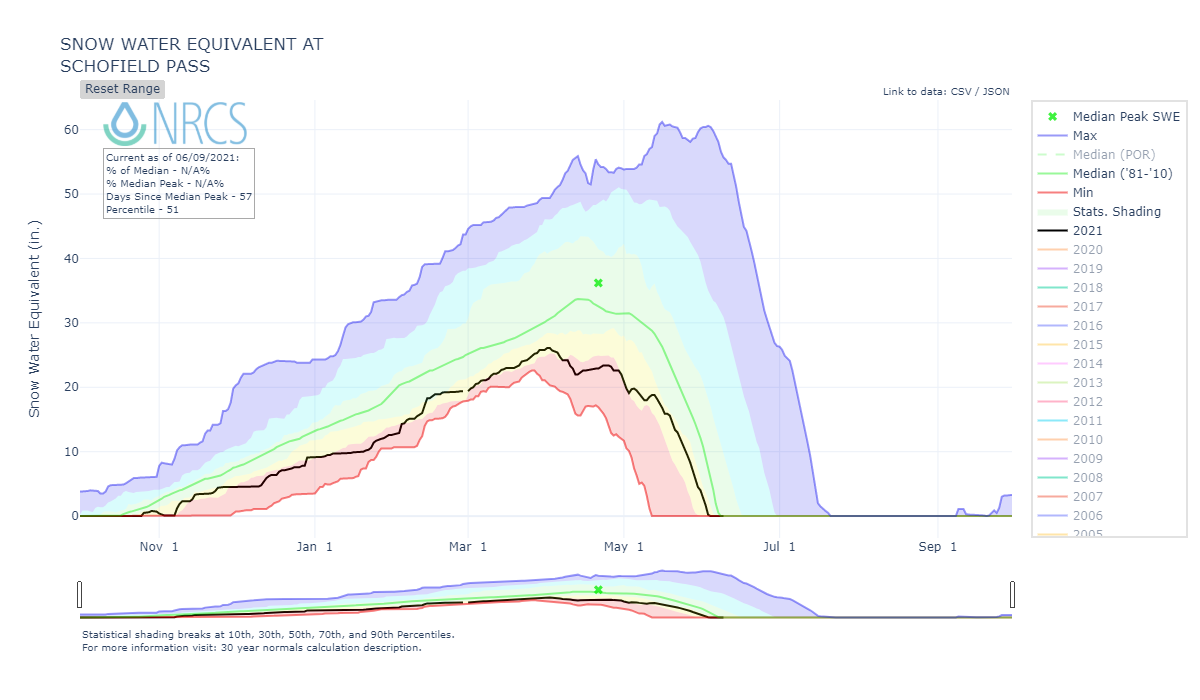
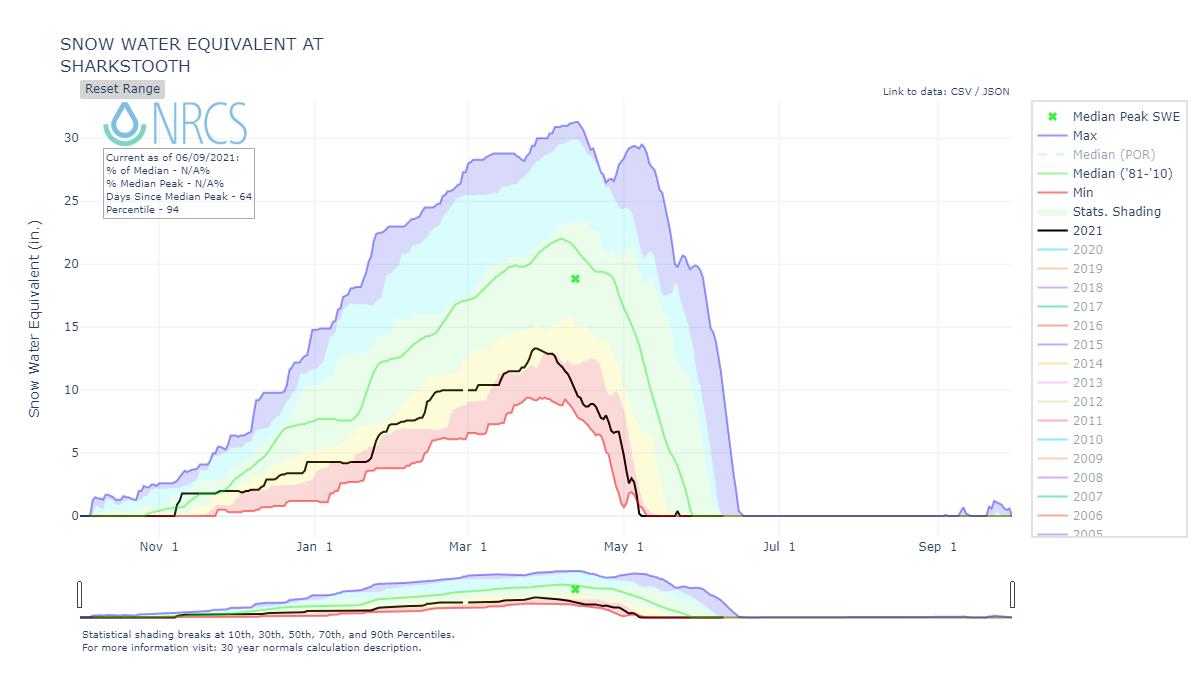
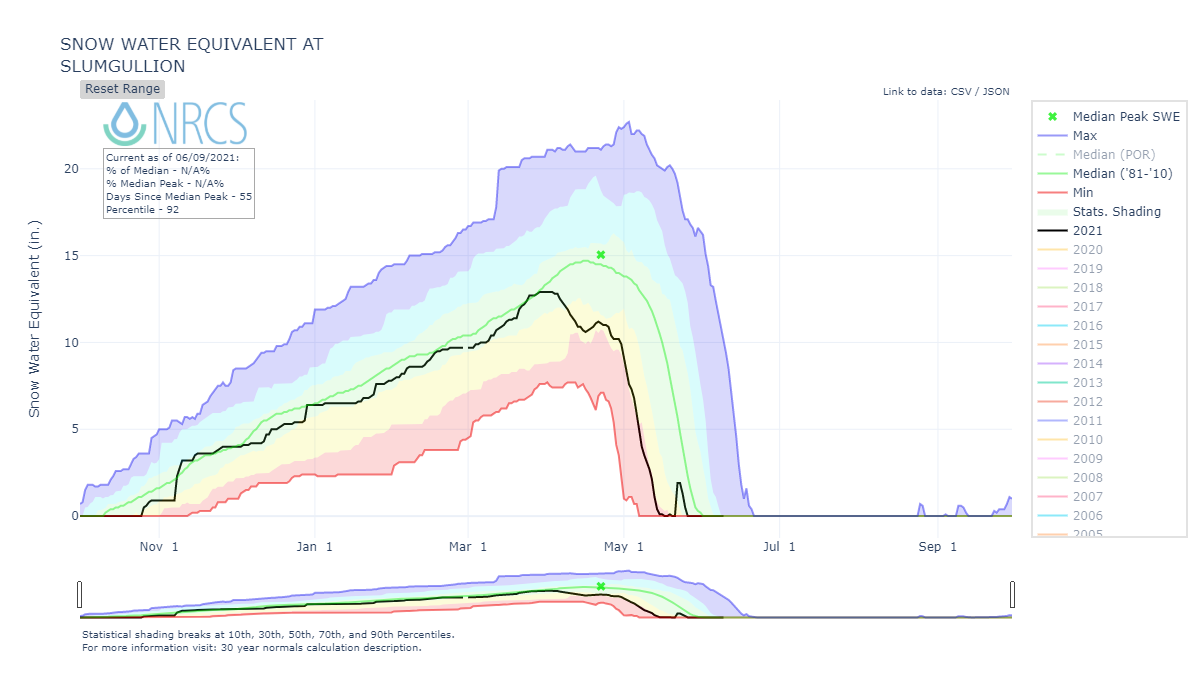
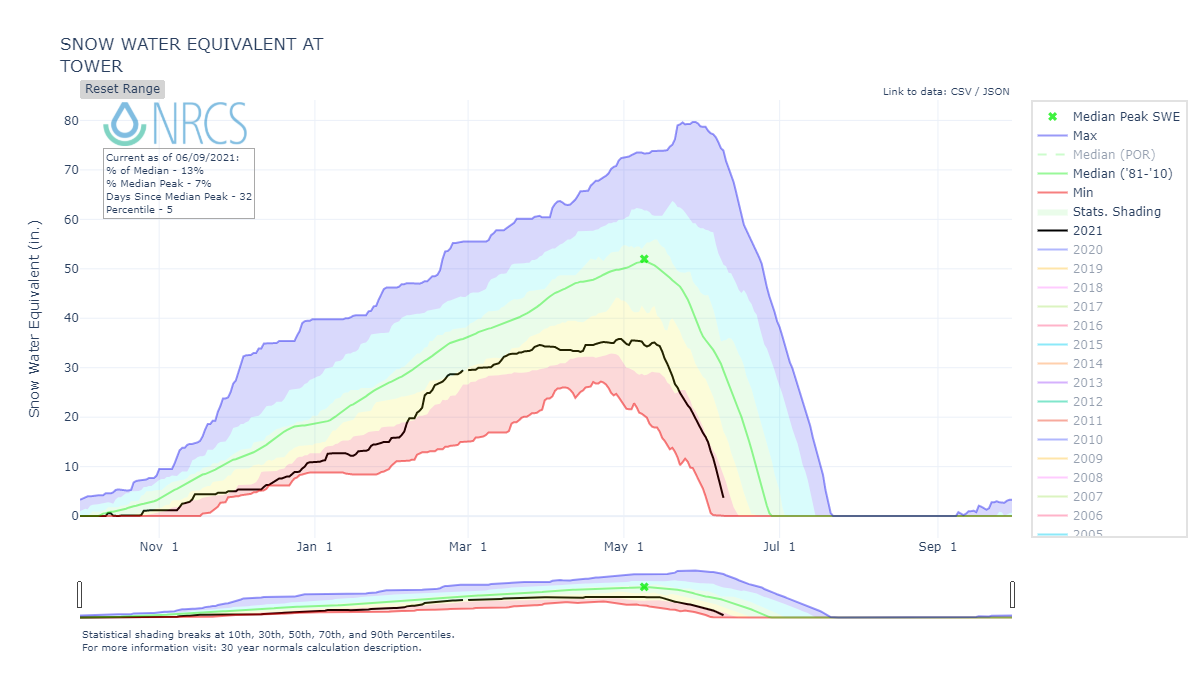
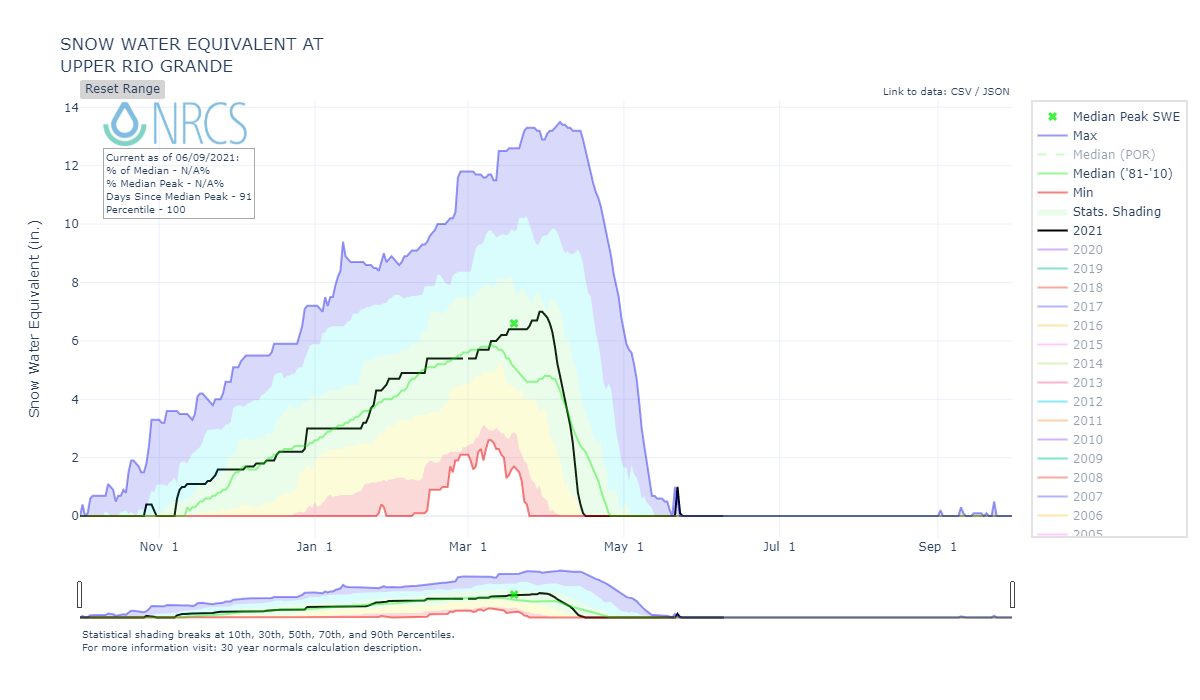
Above: Around April 1st the snowpack was near normal for the South Platte, Rio Grande, and Arkansas Basins. Remaining Colorado basins were well below average. For all basins, besides the South Platte, snowpack ablation was very rapid starting the first of April.
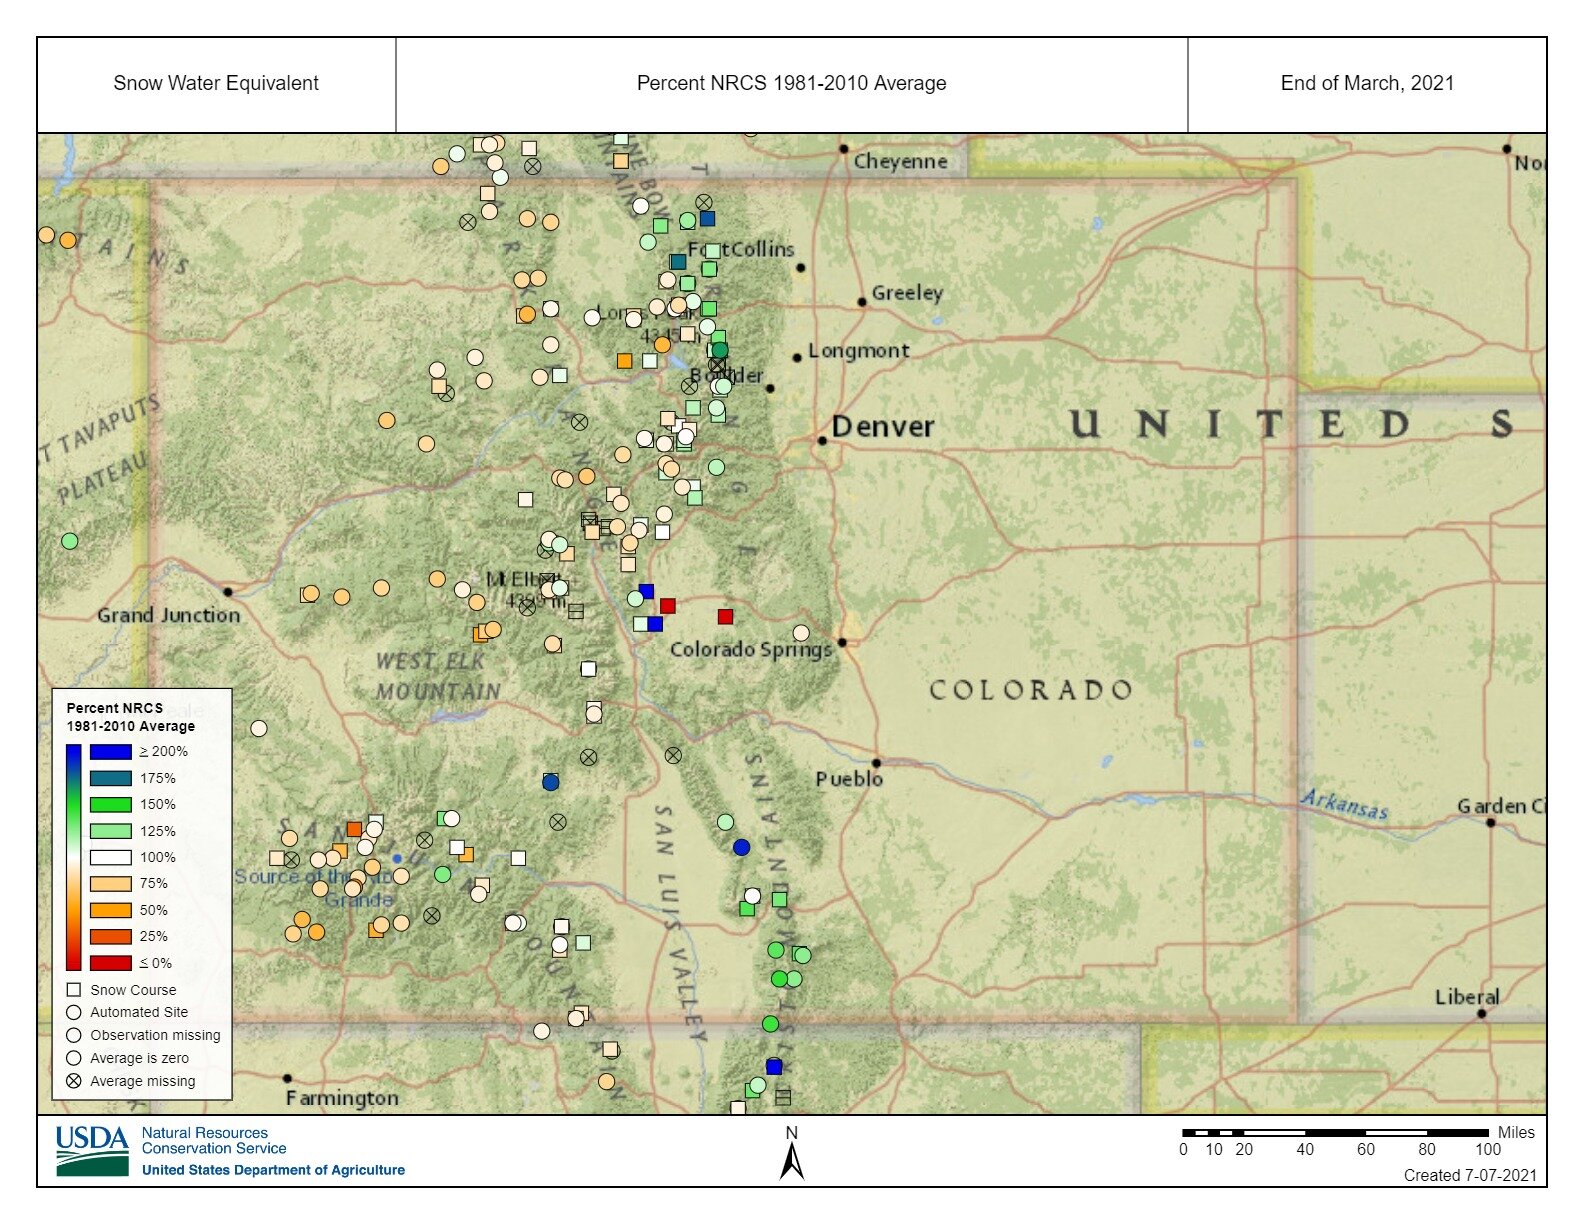
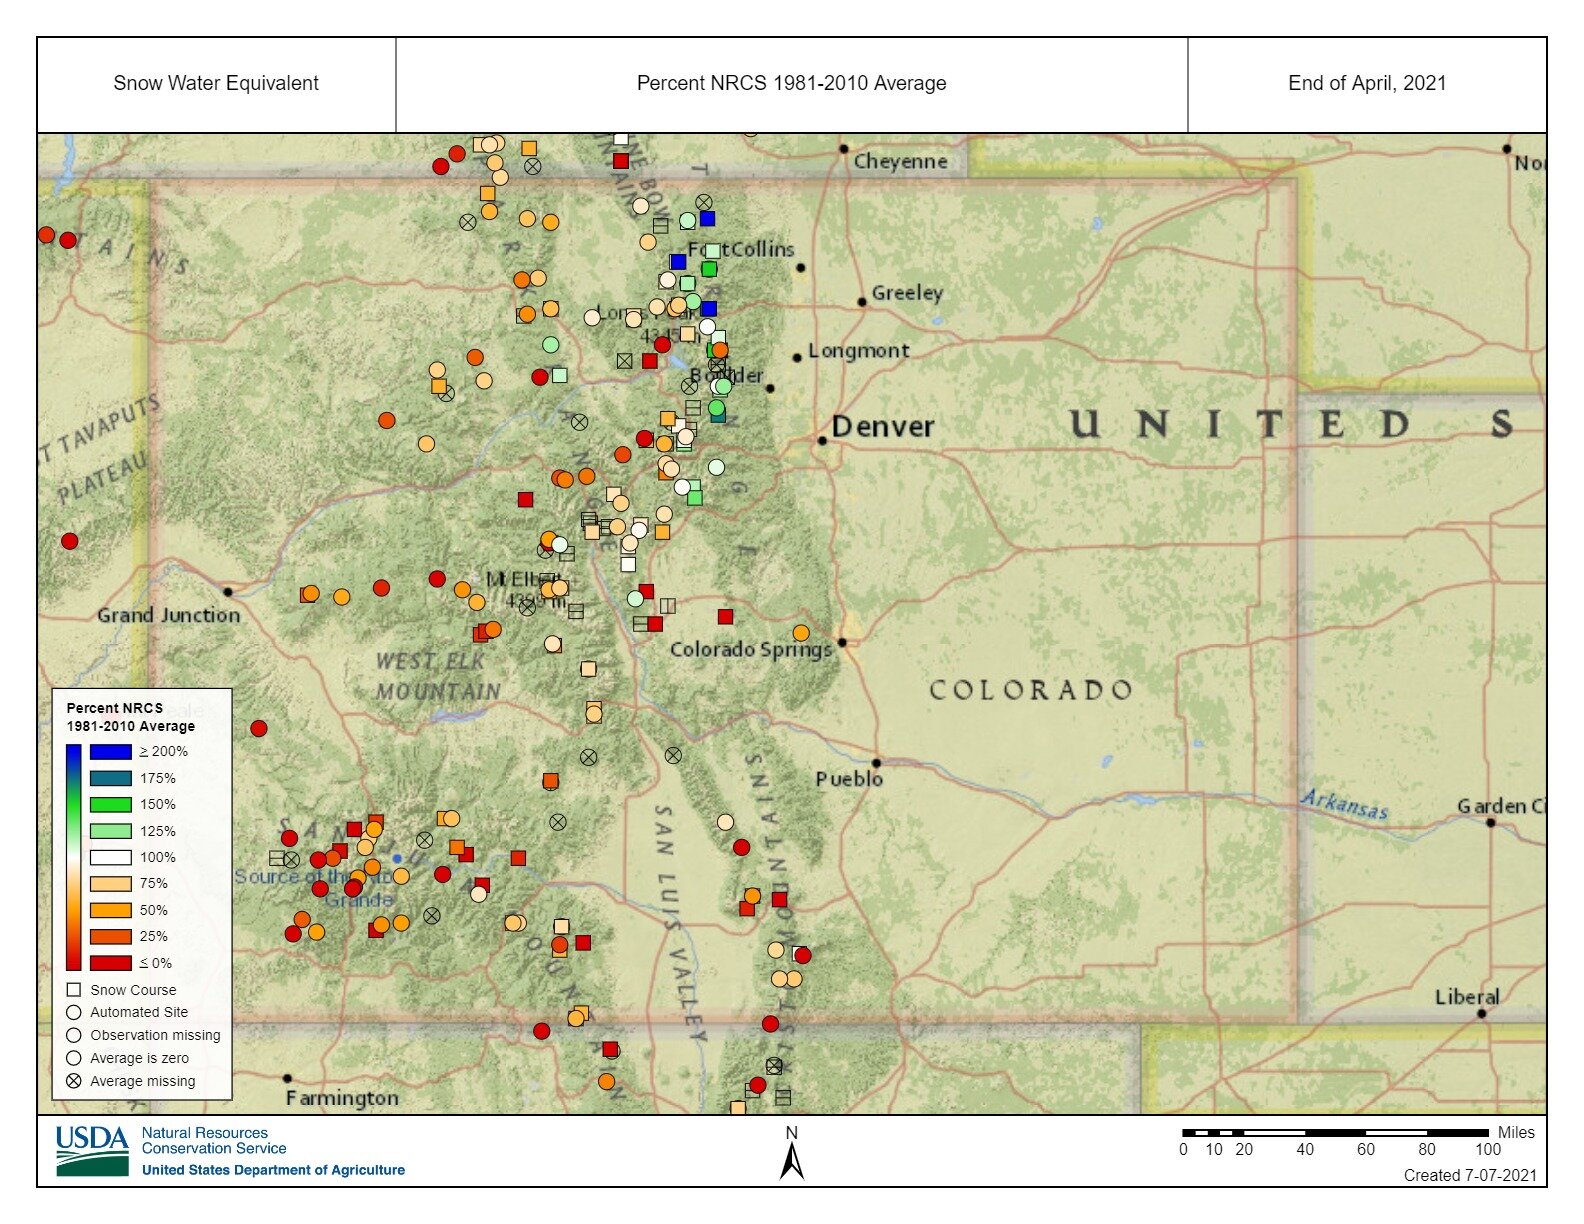
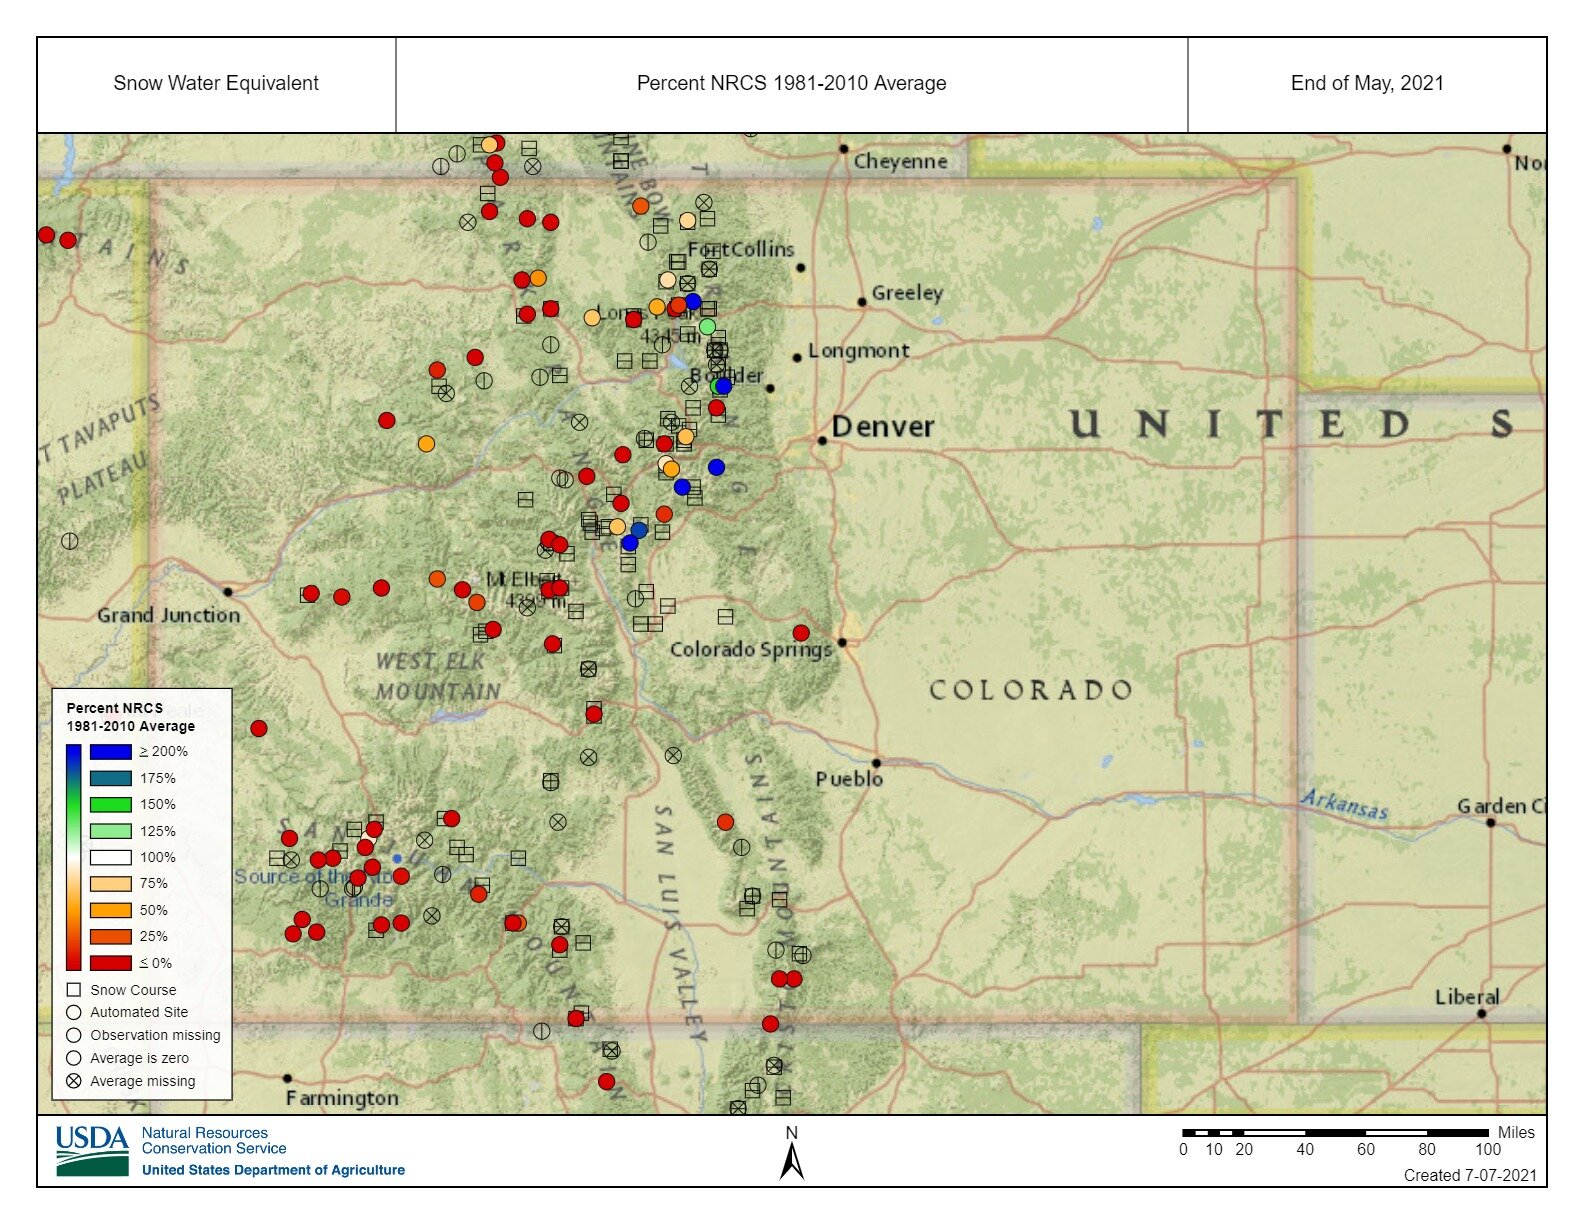
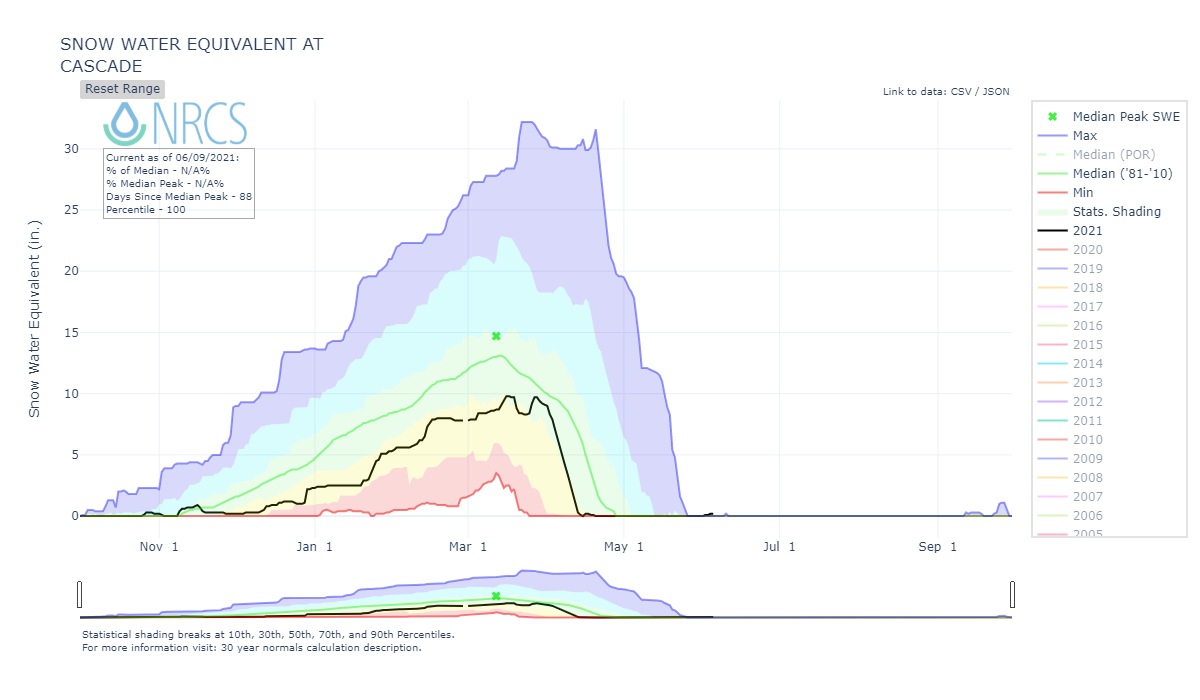
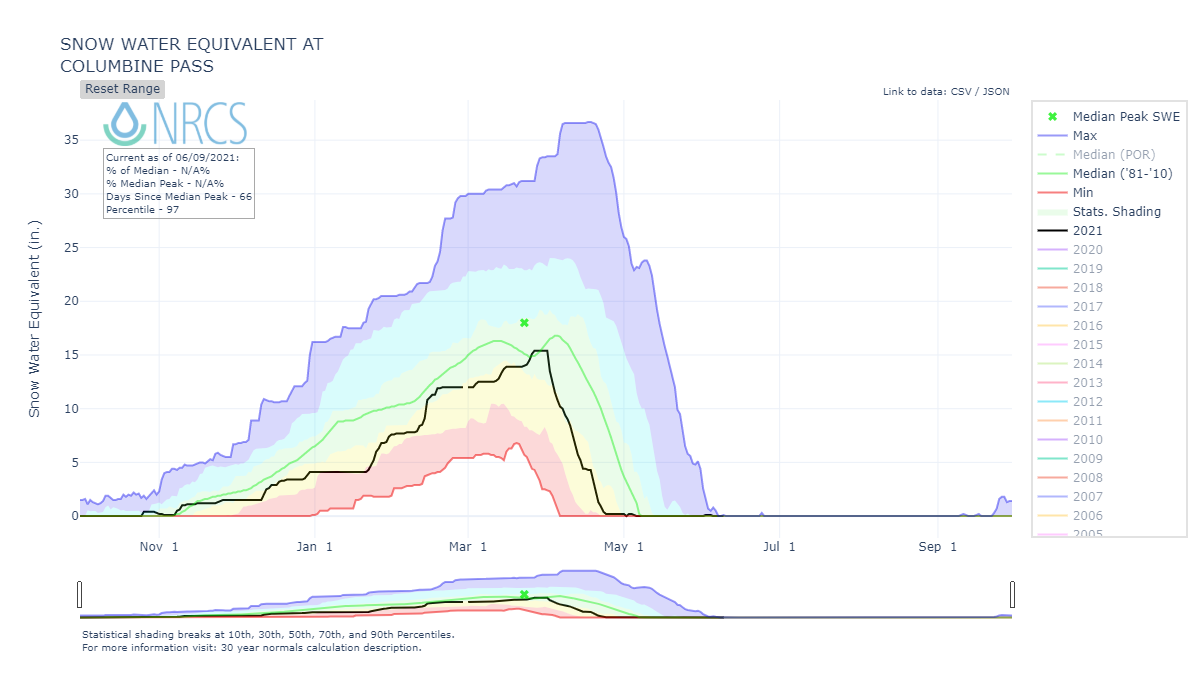
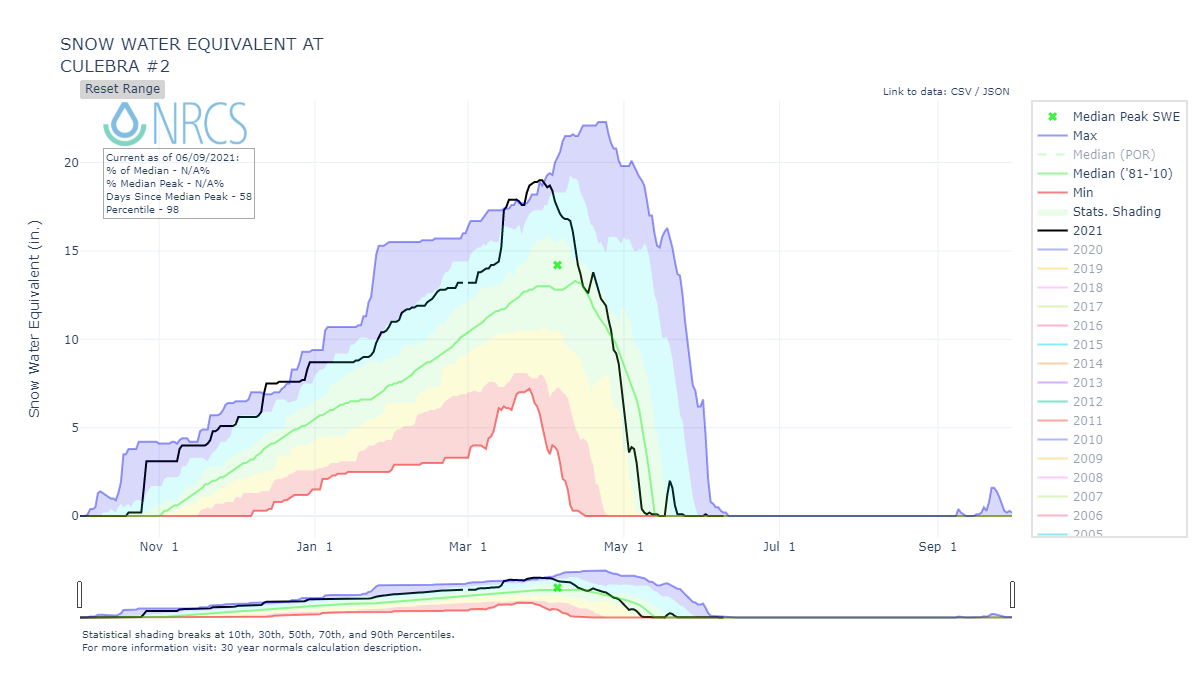
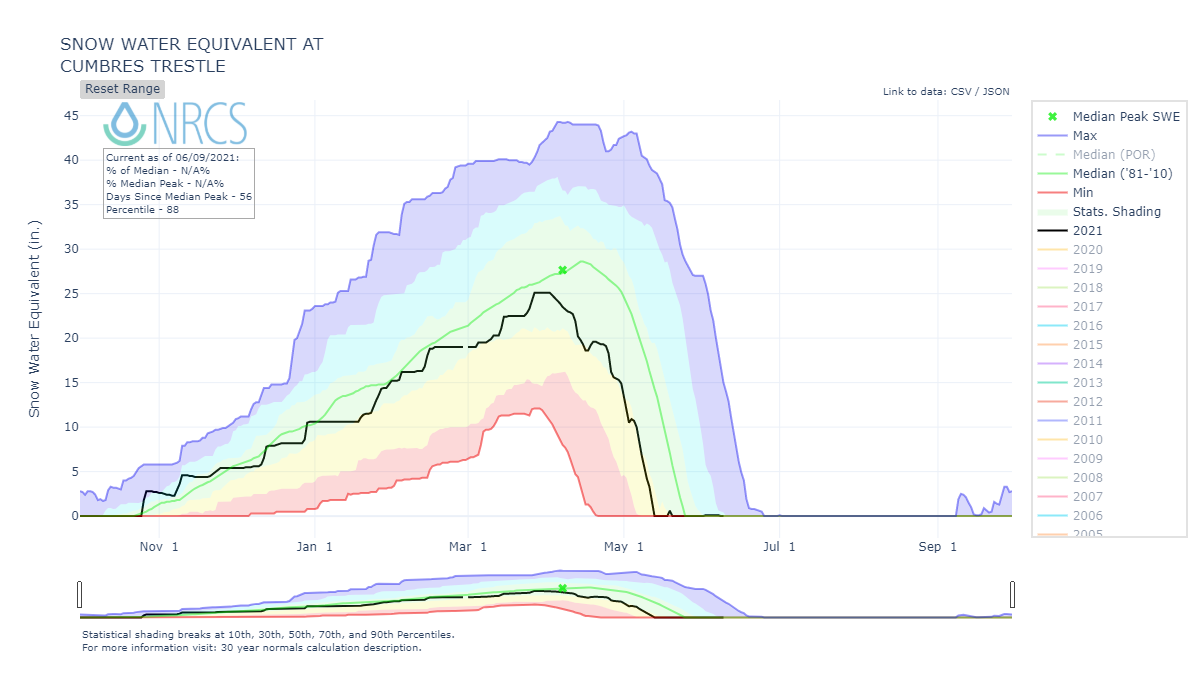
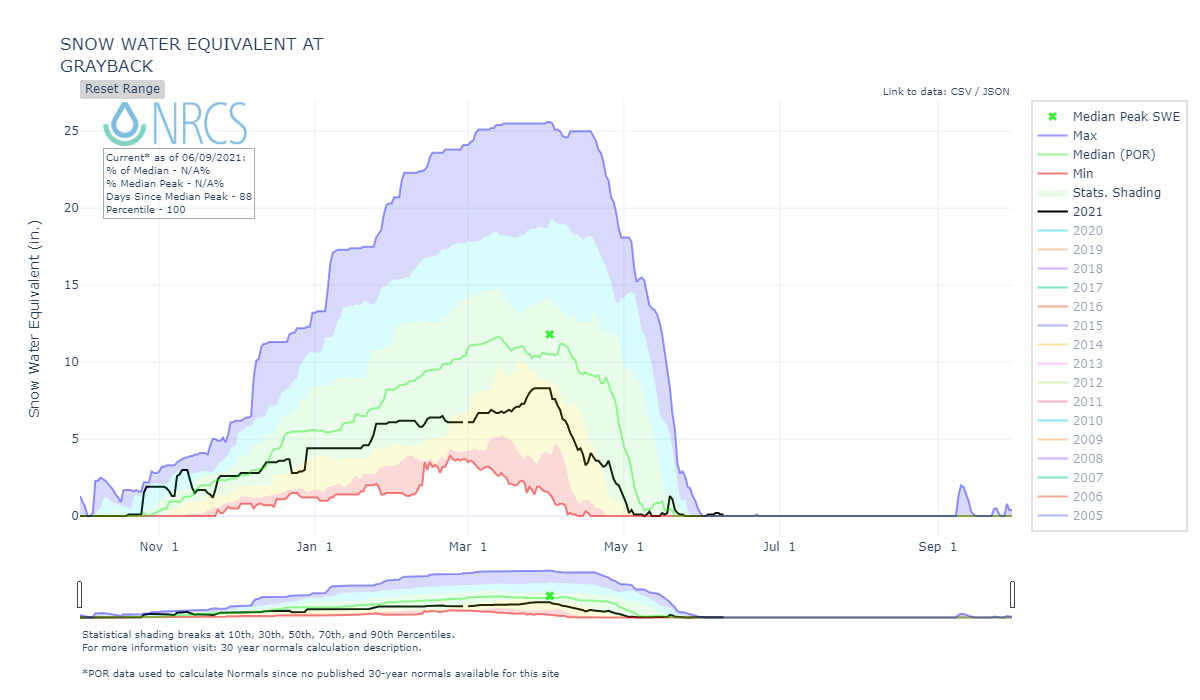
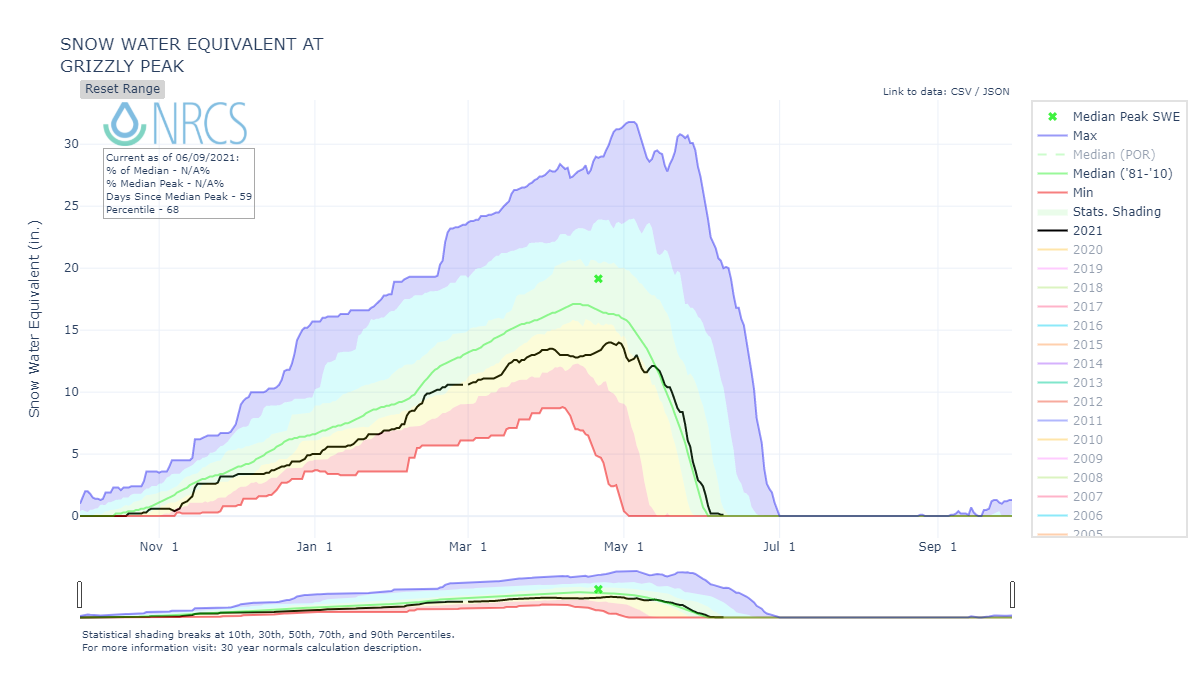
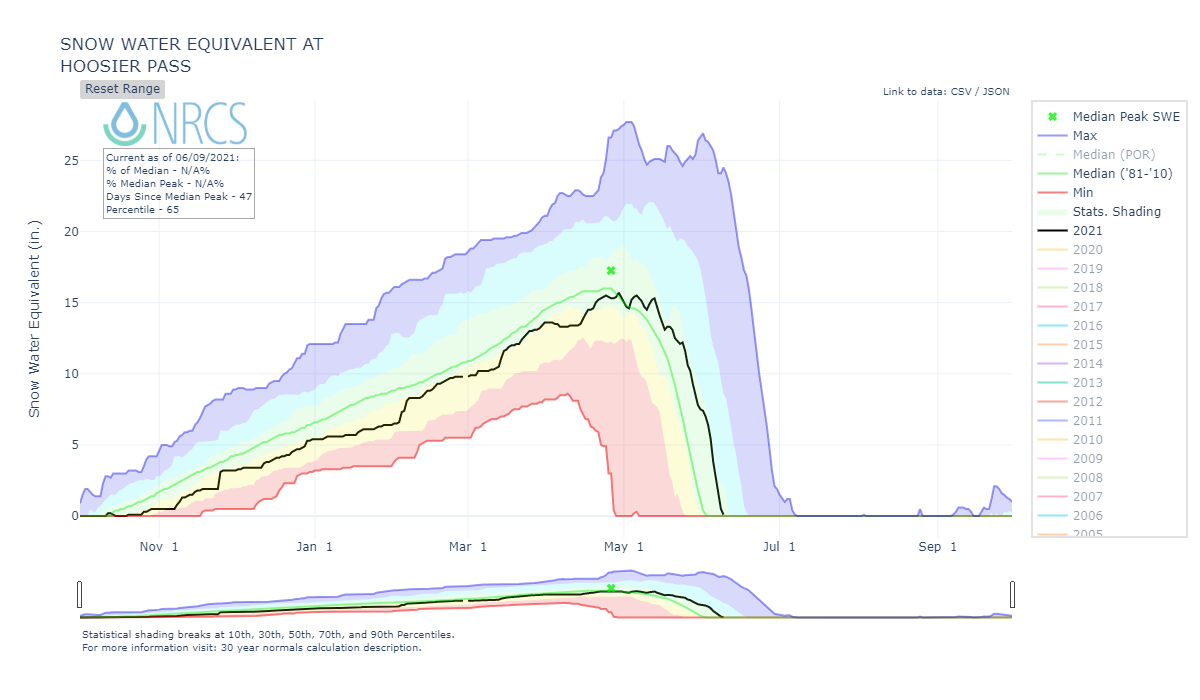
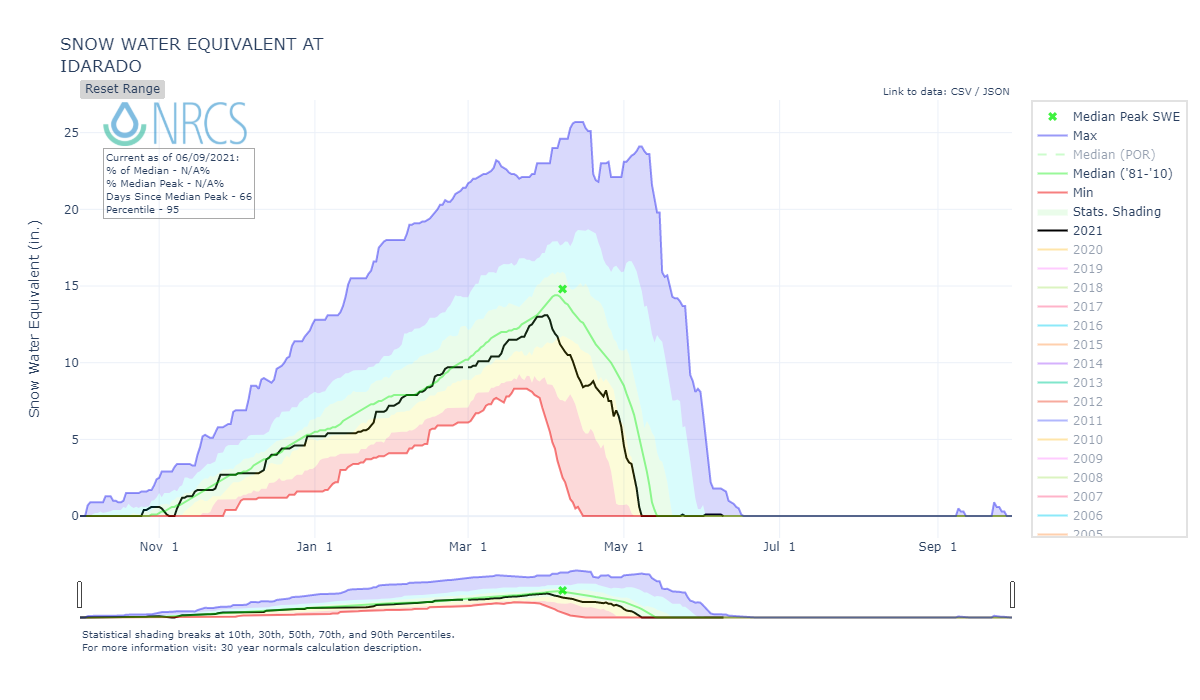
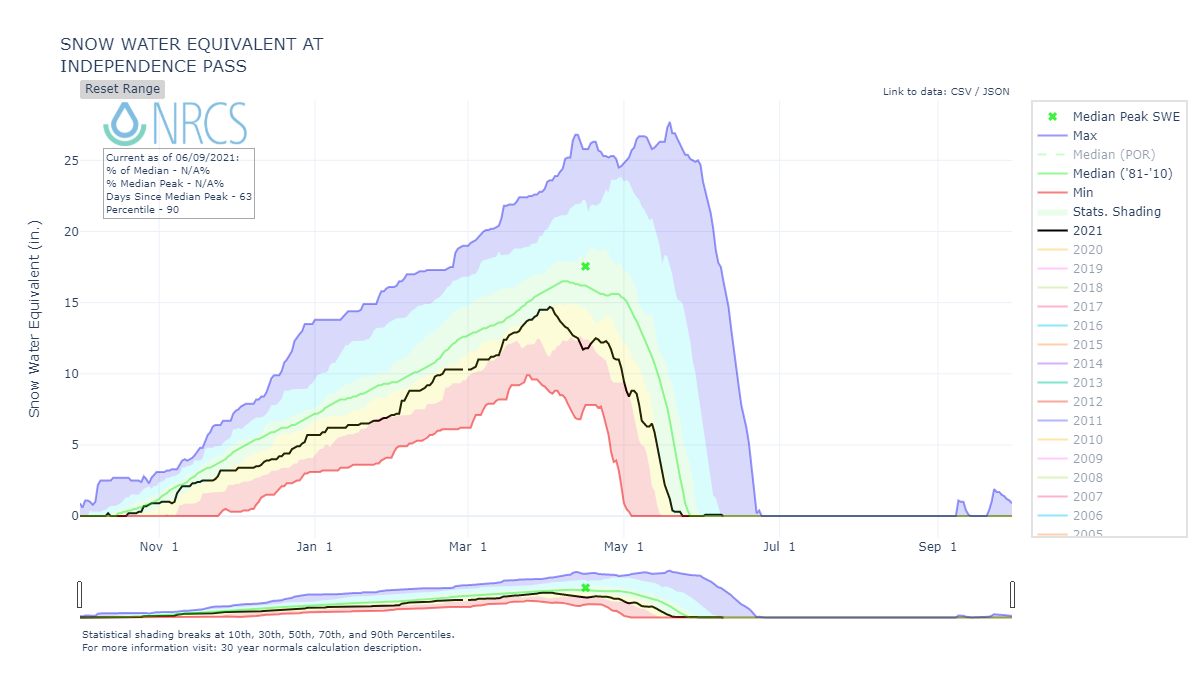
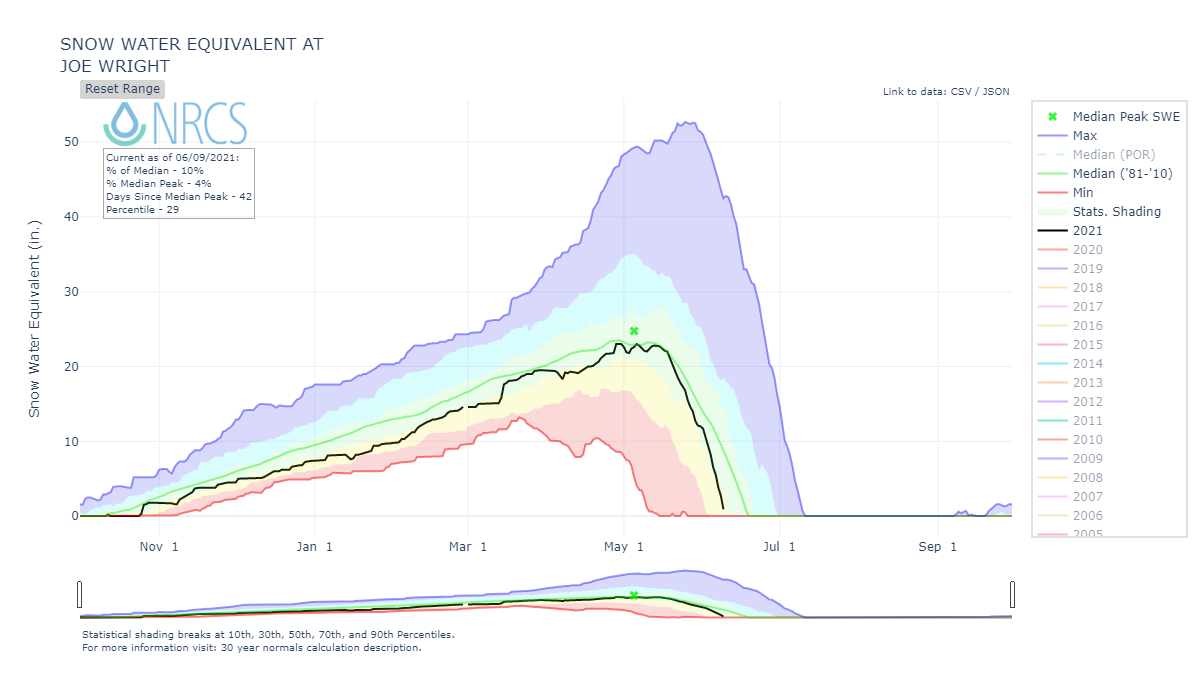
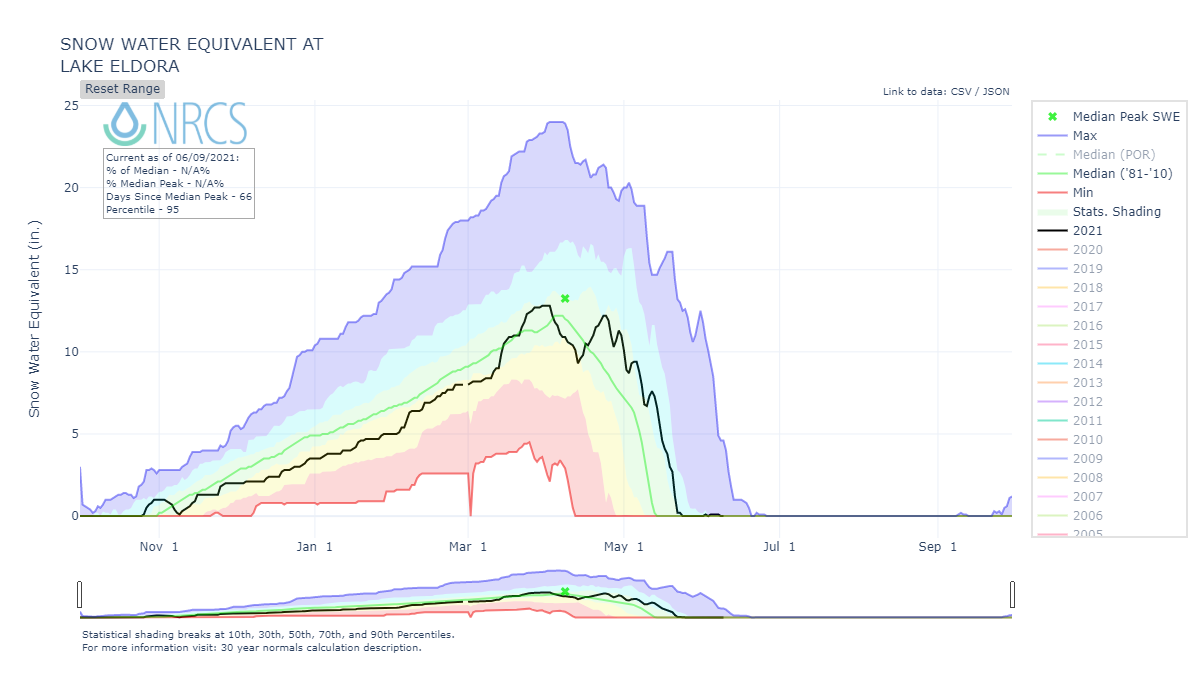
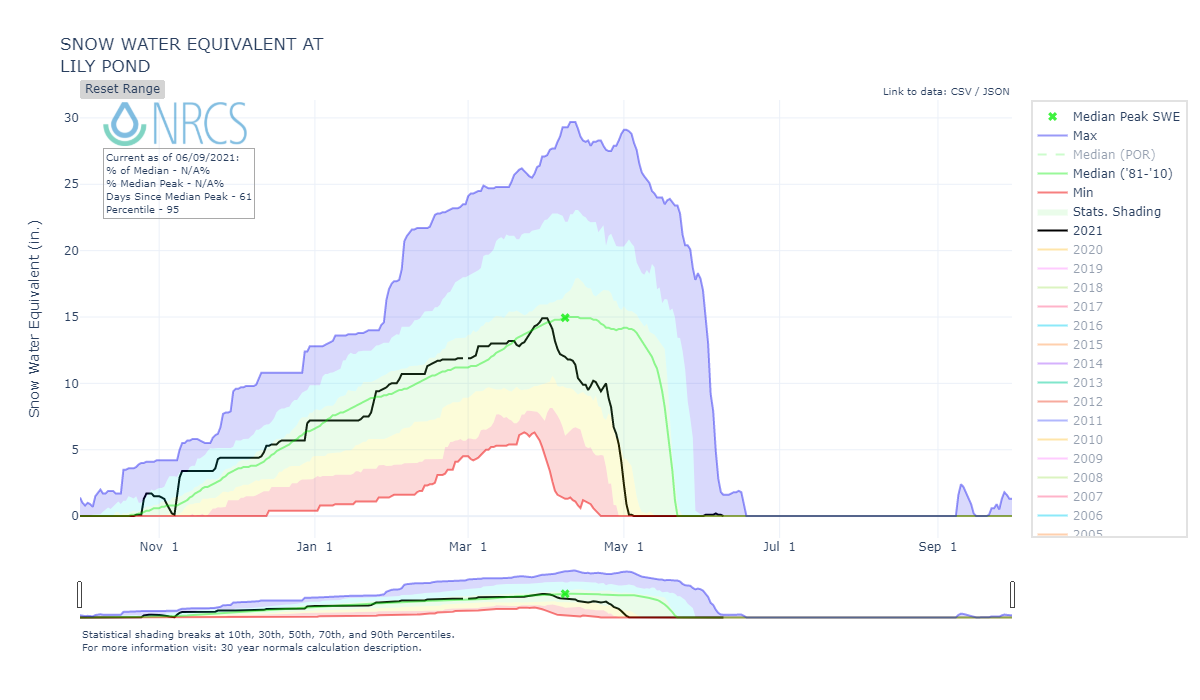
Above: SWE at SNOTEL sites for March, April, May. Some very stark differences (by region and station) of where the snowpack did well and not so well.
Below: Summary data for water years 2006-2021 at the 16 SNOTEL stations that CODOS monitors. The table shows peak SWE, and calculated from the day of peak SWE, melt rates, days to snow-all-gone, and mean temperature. Ten sites reached 100% of their median peak SWE or better. The sites that did not do as well were mainly Central and mainly Southern Colorado

Below: A summary of WY 2006-2021 snowmelt rates and associated conditions at the 16 SNOTEL stations that CODOS routinely monitors. Days to SAG refers to the time between peak SWE and “snow all gone” at the SNOTEL sites. Adjusted Daily Mean Loss calculates the rate of snowmelt following peak SWE, including all precipitation received after peak SWE (assumed to be snow). Melt rate tables are presented for each of the 11 CODOS monitoring sites on their webpages.
Some important points in the table below is WY2021 did a pretty good job at these higher elevation sites in terms of holding onto the snow after peak SWE, the adjusted daily loss of SWE was actually pretty low 0.43”/day, the 5-day moving average of SWE was the lowest in record 0.4”/SWE, and average post peak SWE temperatures were not too bad at 3.6 degrees C. One explanation is this an average of all SNOTELS and the northeast sites had a near normal snowpack and wet spring, and other sites received some timely storms to prolong snow ablation season (such as SBB receiving 1’ snow on May 21).
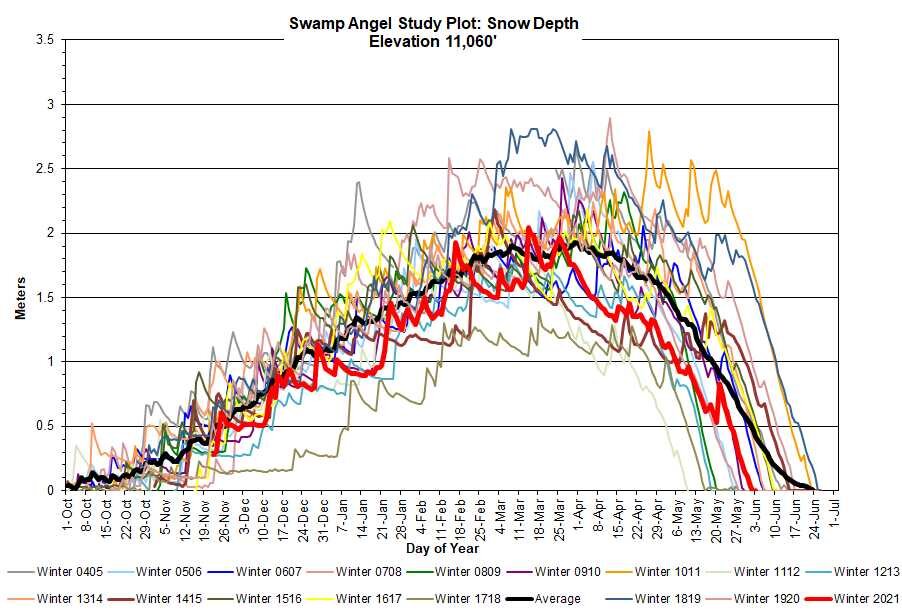
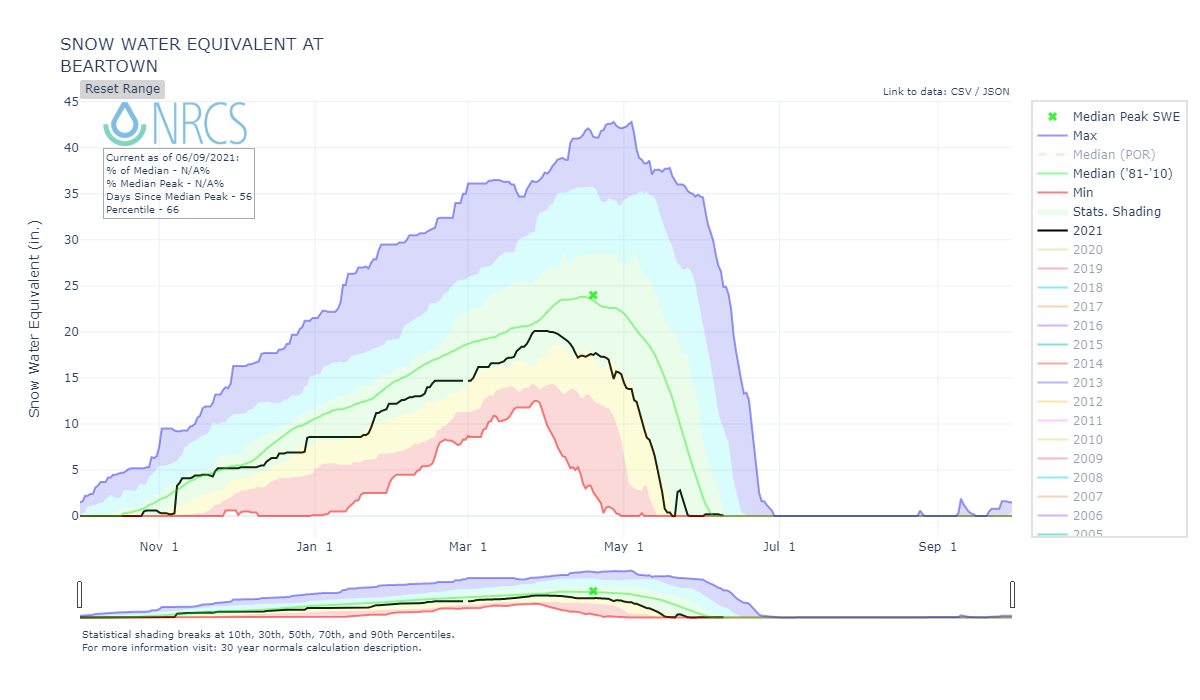
Snow depth at Swamp Angel Study Plot.

Snow depth at Senator Beck Study Plot.

Snow water equivalent at Swamp Angel from snow profiles.

Snow water equivalent at Senator Beck Study Plot from snow profiles.
DUST-ON-SNOW CONDITIONS
DUST ENHANCED RUNOFF CLASSIFICATION:
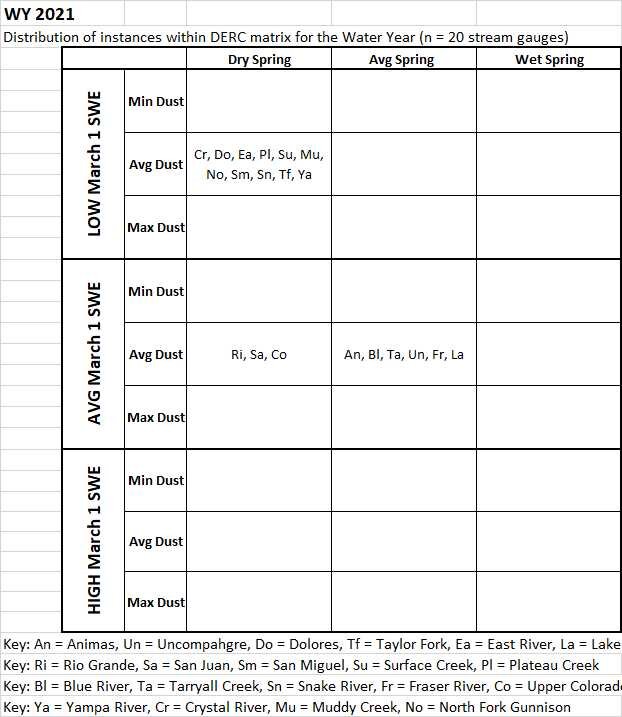
In Water Year 2015 CODOS introduced a Dust Enhanced Runoff Classification (DERC) approach to linking dust-on-snow, snowpack, and spring weather conditions to patterns in statewide hydrographs within a 3x3x3 Dust Enhanced Runoff Space. The below table presents the final DERC classification of WY2021 parameters at each of the 20 stream gauges monitored by CODOS. Water Years 2006-2021 classifications are contained in Excel workbook Runoff_Space_by_Region_and_WY.xlsx. Another workbook, Runoff_Space_by_Watershed.xlsx, contains individual DERC analyses for WY 2006-2021 for each of the 20 stream gauges.
A conceptual Dust Enhanced Snowmelt Runoff Space integrating the interactions of March 1 SWE, dust intensity, and spring precipitation.
Below: Based on the discussions describing the DERC approach in characterizing the watersheds that CODOS monitors, WY2021 snowmelt season conditions are summarized in the tables below. Essentially, Colorado WY2021 snowmelt runoff behaviors fell into general patterns of “Minimum” or “Average” dust severity, mostly “Average” or “Low” March 1 SWE, and all but six sites but had a “Dry” spring.
The Senator Beck Basin received 7 dust events this season, an event on October 25, March 9, March 20, March 29, April 14, April 21, and May 22. For the most part dust events were mostly of moderate severity but for two; the March 20th event (D3) was a significant event that was very noticeable in the snowpack throughout winter. The May 22 event was also particularly nasty, leaving a coating of dust on vehicles, and everything else, in towns located in the Four Corners. This dust came after a large storm so it set about cranking up snowmelt of the new snow and remaining high elevation snow for the remainder of the season.
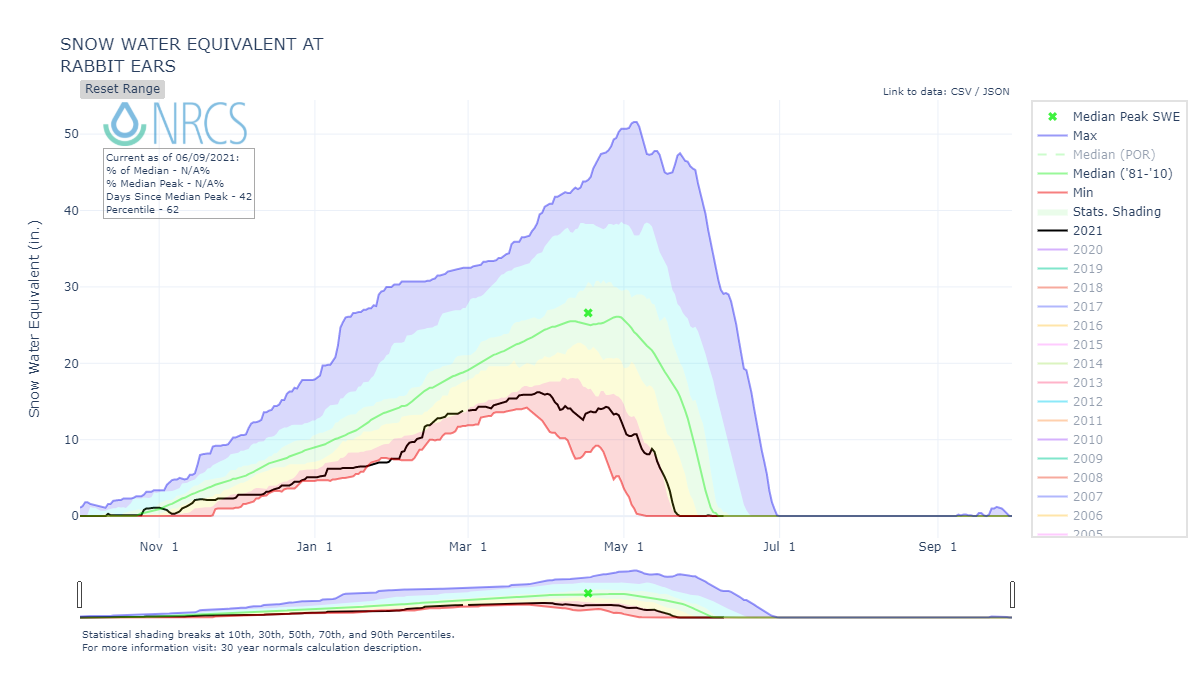
The dust event that made headlines this season didn’t occur in Southern Colorado but along the Front Range and northeast mountains. It originated in the Chihuahuan Desert in Mexico and traveled straight north. As the system traveled farther north it started to curl around to the west depositing dust on the Front Range Mountains and even going as far west as Rabbit Ears Pass. The dust was very apparent at Loveland Pass, most severe at Berthoud, and prominent up to Willow Creek and the northern mountains. Since storm tracks that deposit dust usually come out of the Desert Southwest, dust presence and severity usually diminishes as one travels towards Central and Northern Colorado. But this season with the Mexico event, the front range and northern mountains had their own significant dust for the snowpack to contend with.
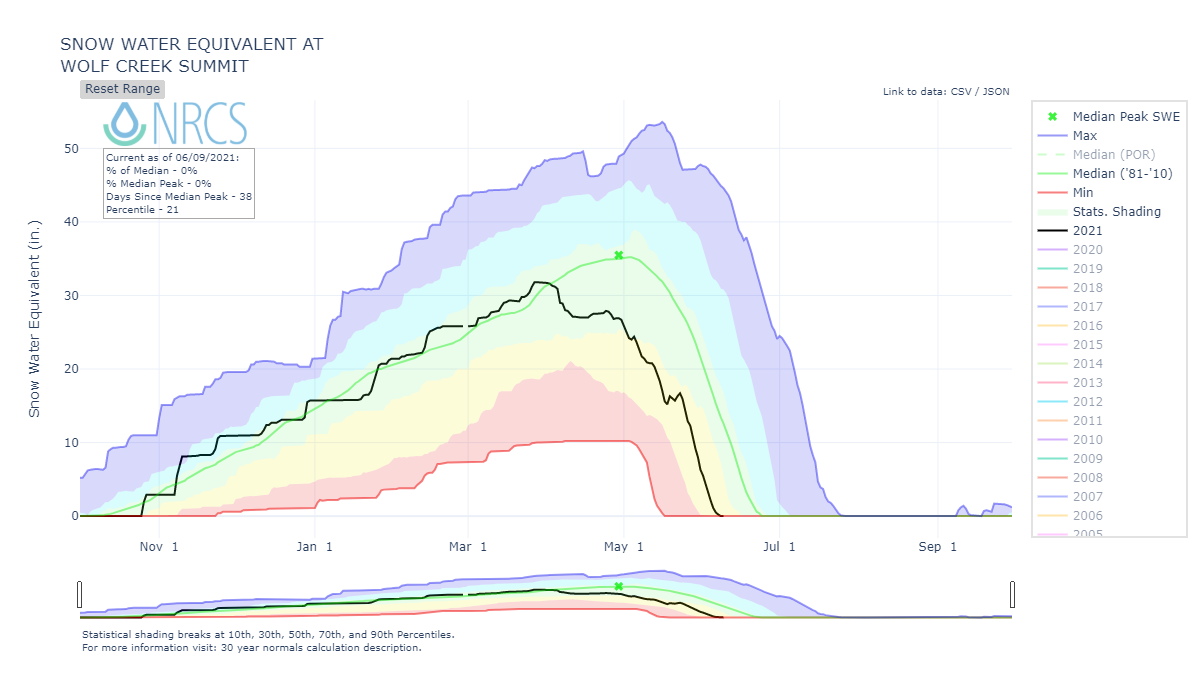
As is getting to be normal occurrence, our Wolf Creek monitoring site showed slightly more severe dust layers than at Senator Beck on Red Mt. Pass. In addition the Southern San Juans received at least two extra dust events that was not observed elsewhere. When these layers merged at the surface it was a bit ”dirtier” than Senator Beck or any other place in Colorado.
In summary, dust severity was very significant, meaning it was on the upper end of average on a “minimum”, “average”, “maximum” scale. It was not as bad as some of the epic DOS years in our record but more severe than what we consider an average severity season. And, as is typical, the majority of dust events occurred in spring leaving the dust at/near surface to influence melt rates, timing, and sublimation rates most of spring.
Above: Total dust-on-snow events by month. March begins the more intensive part of dust-on-snow season. In WY2021, we observed 1 event in October, three in March, two in April, and one in May.
Above: Total dust-on-snow events by year. Four dust events in 2020/2021 were “wet” events and three were “dry” events. Seven events total.
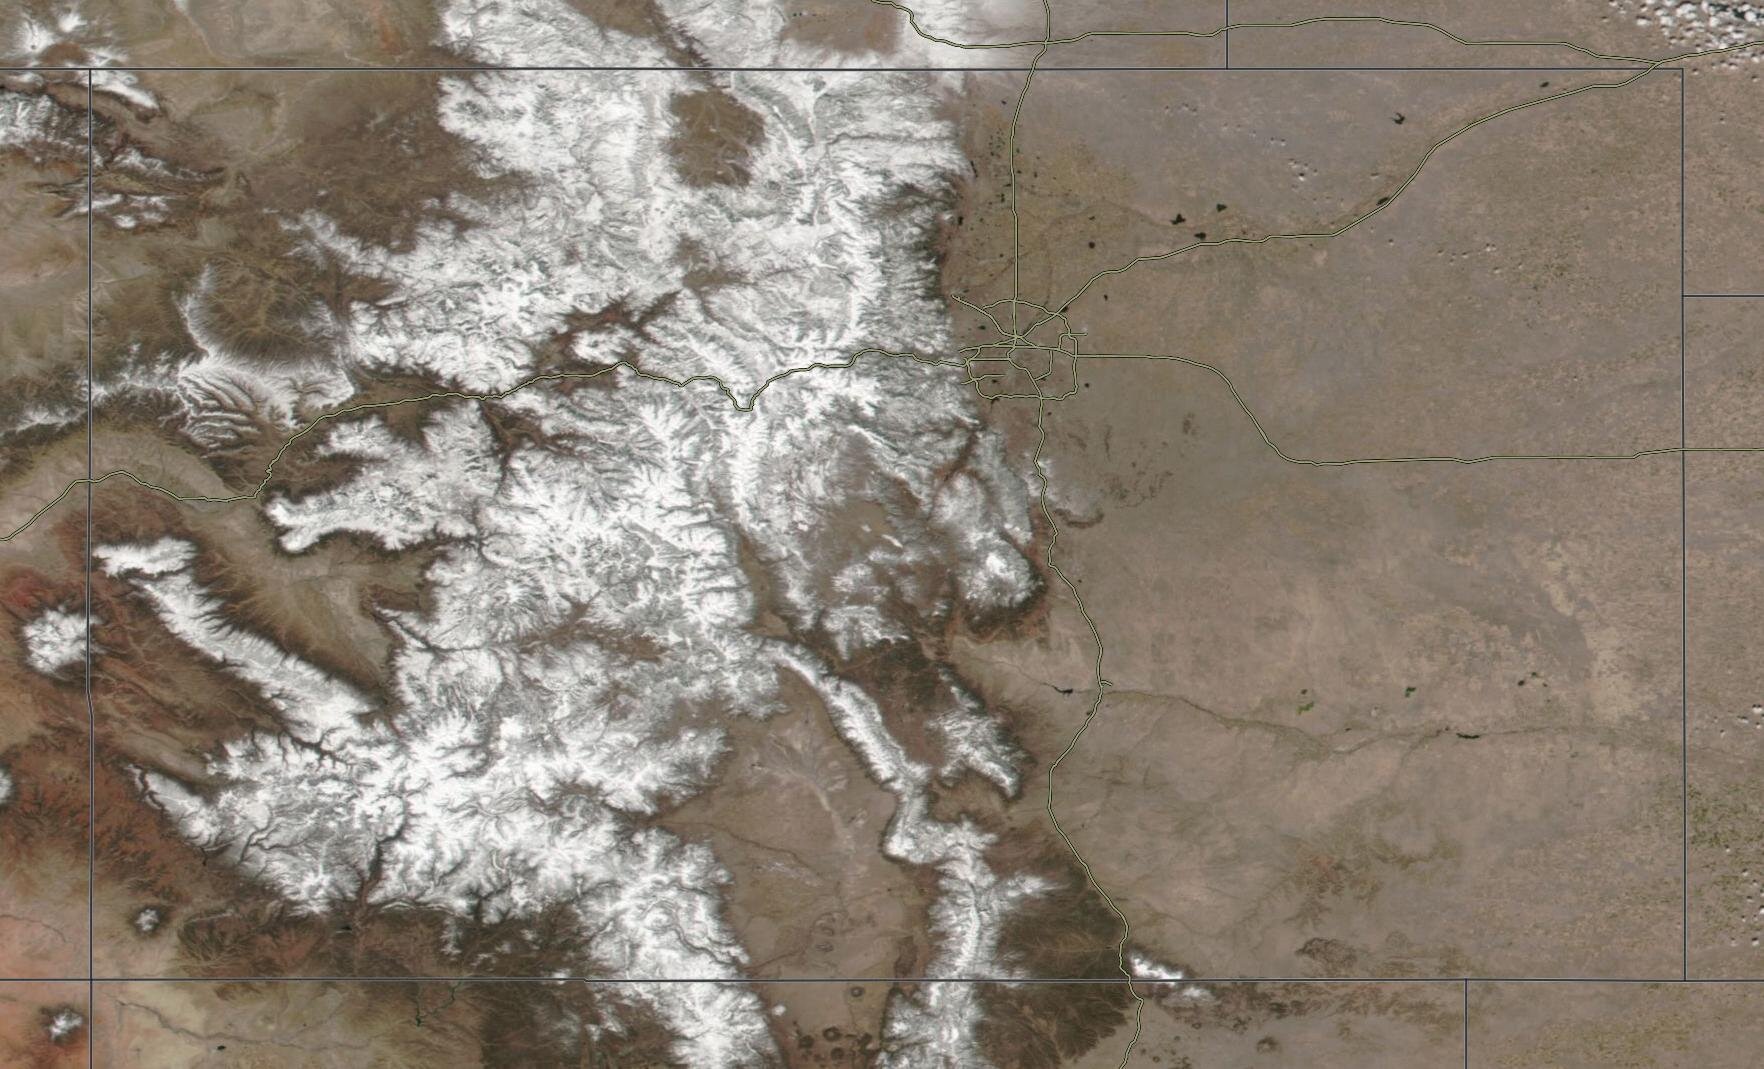
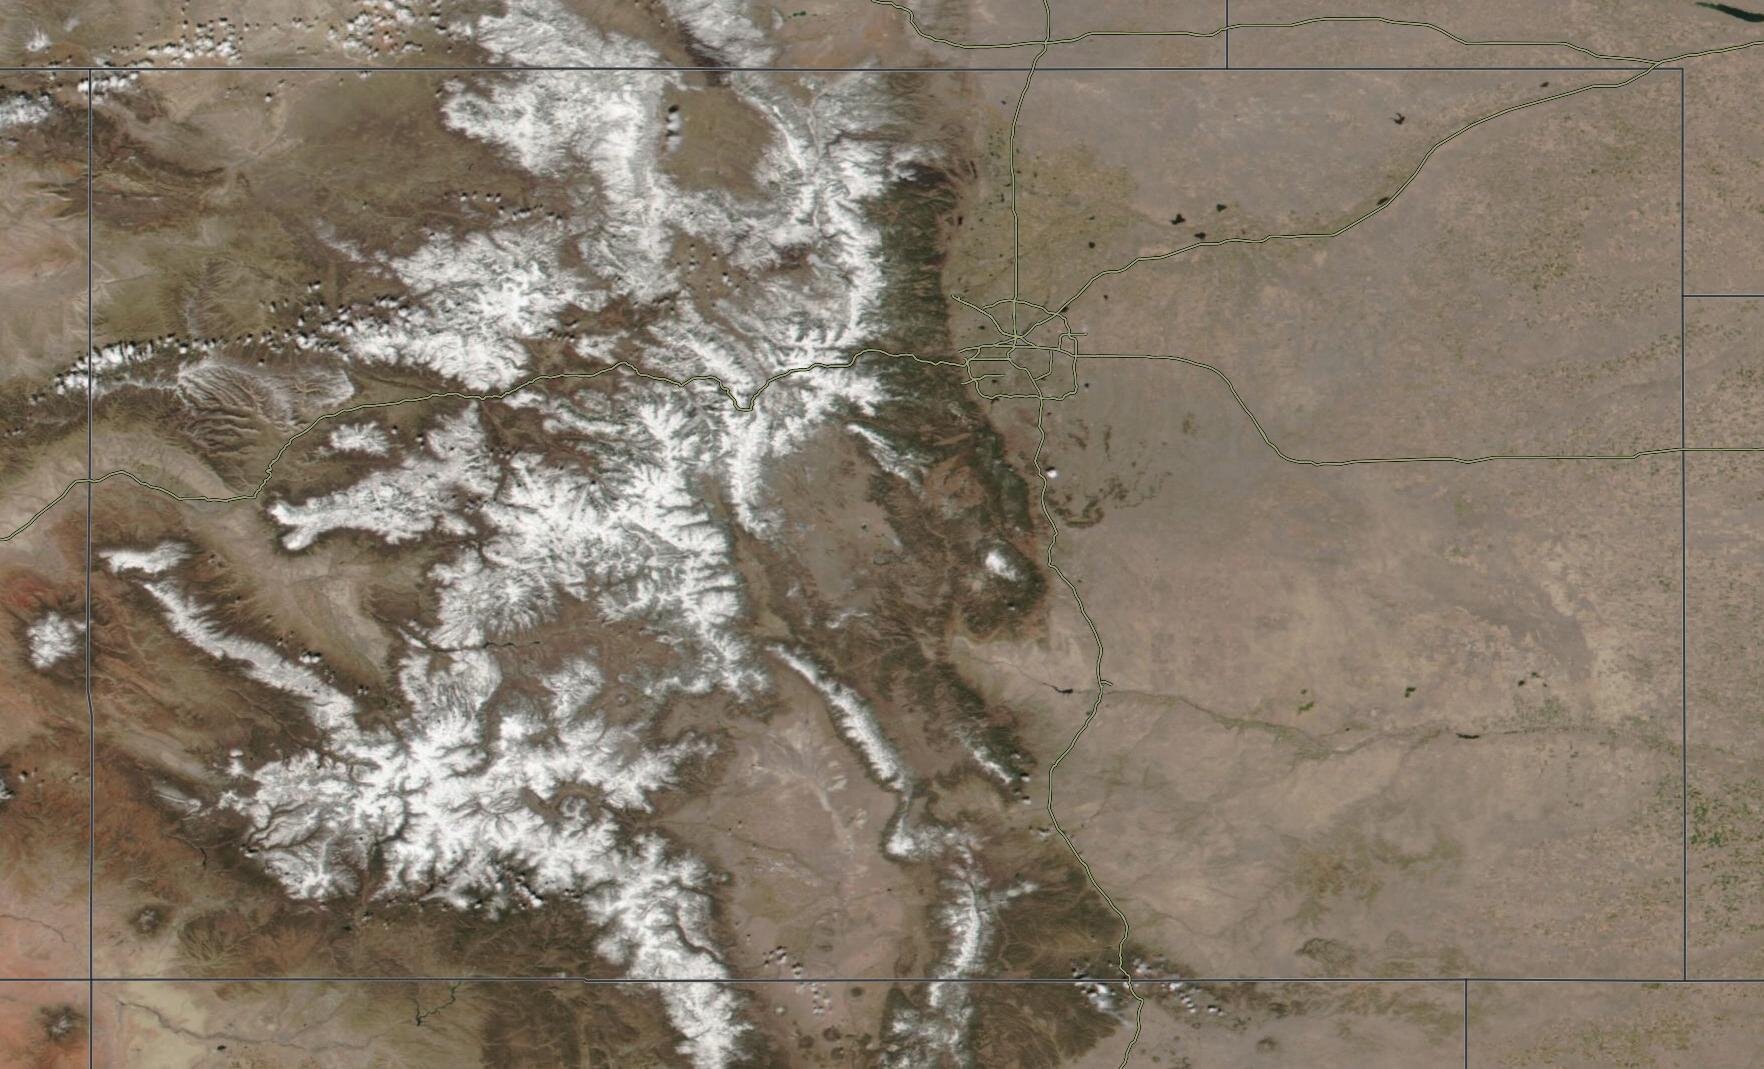
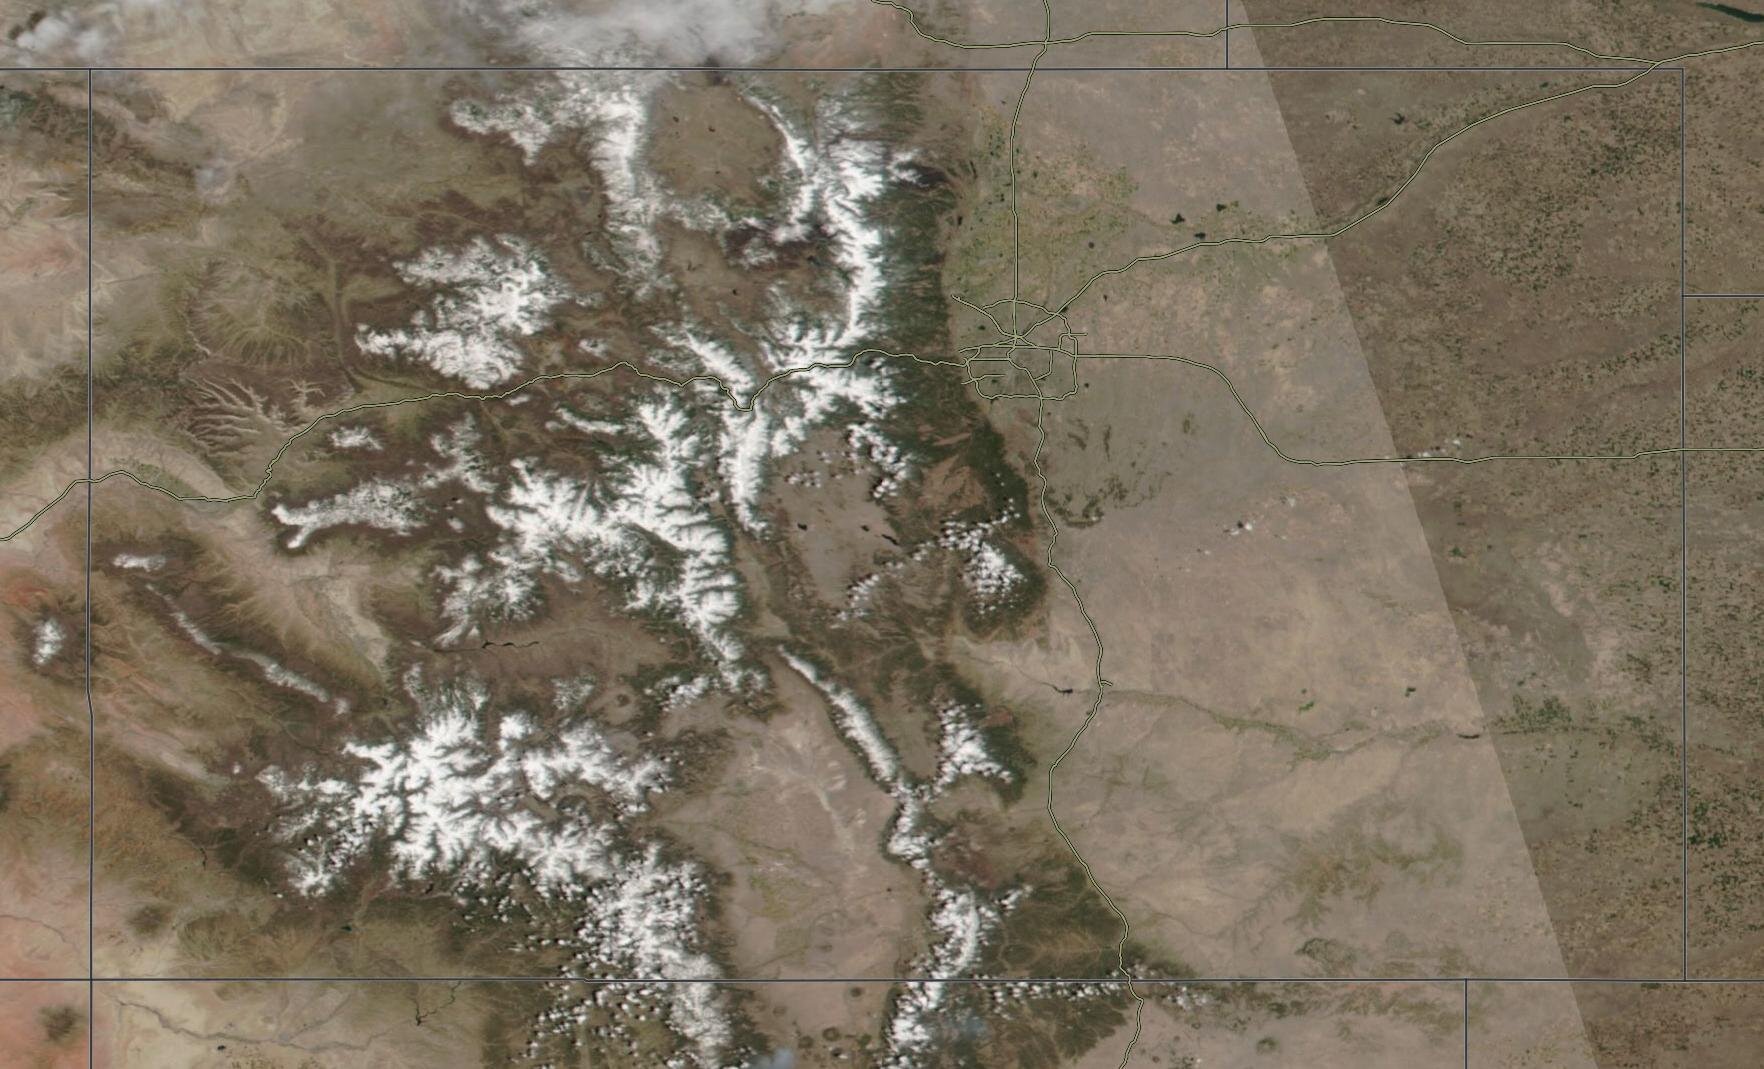
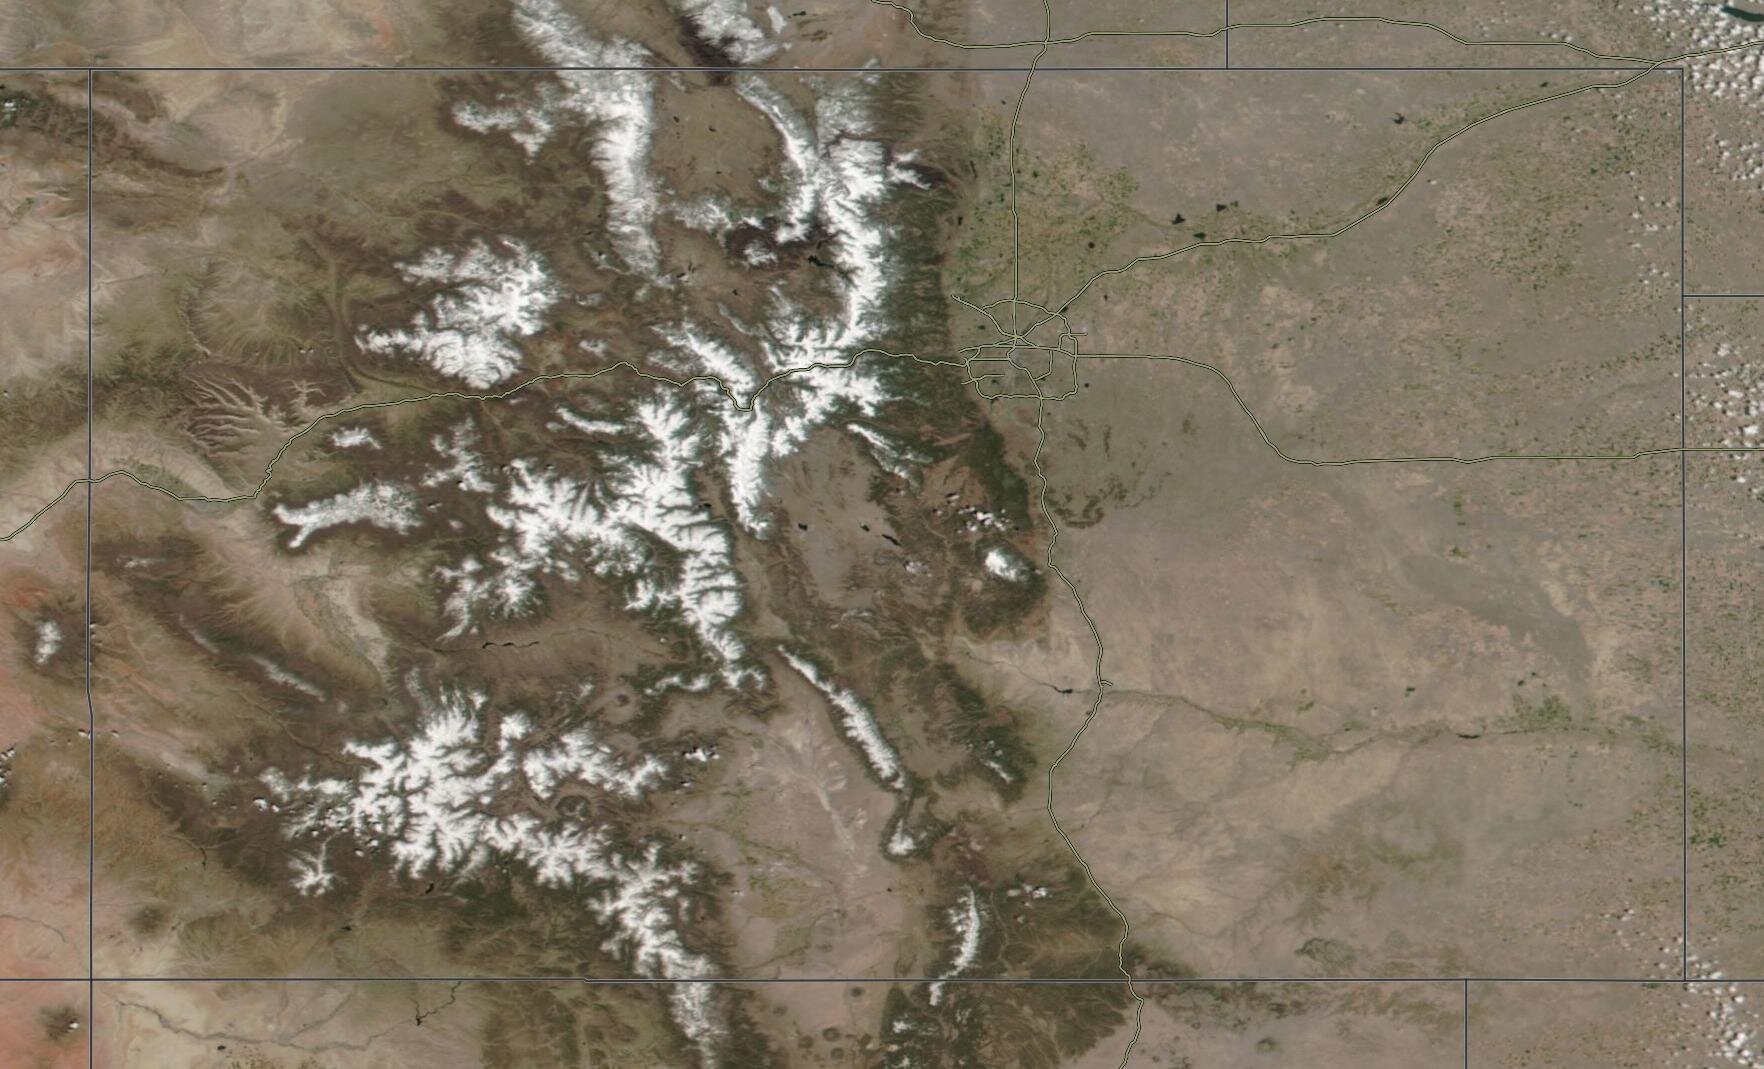
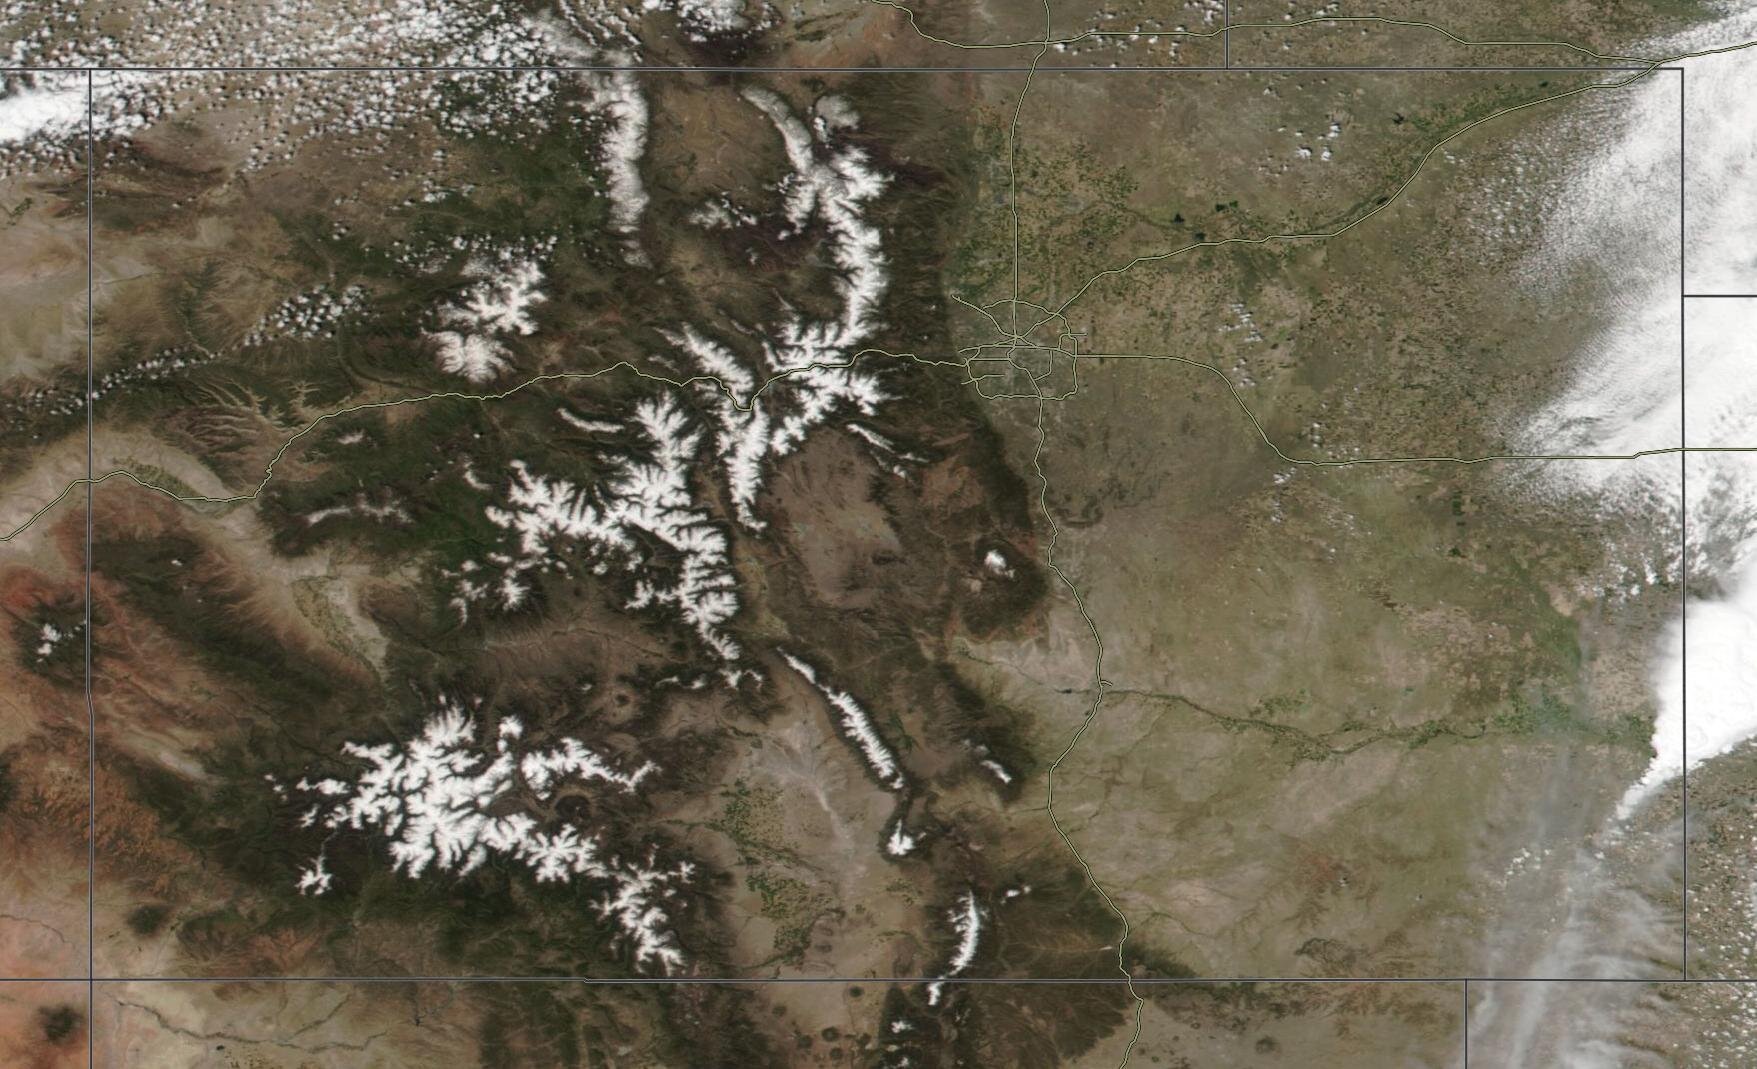
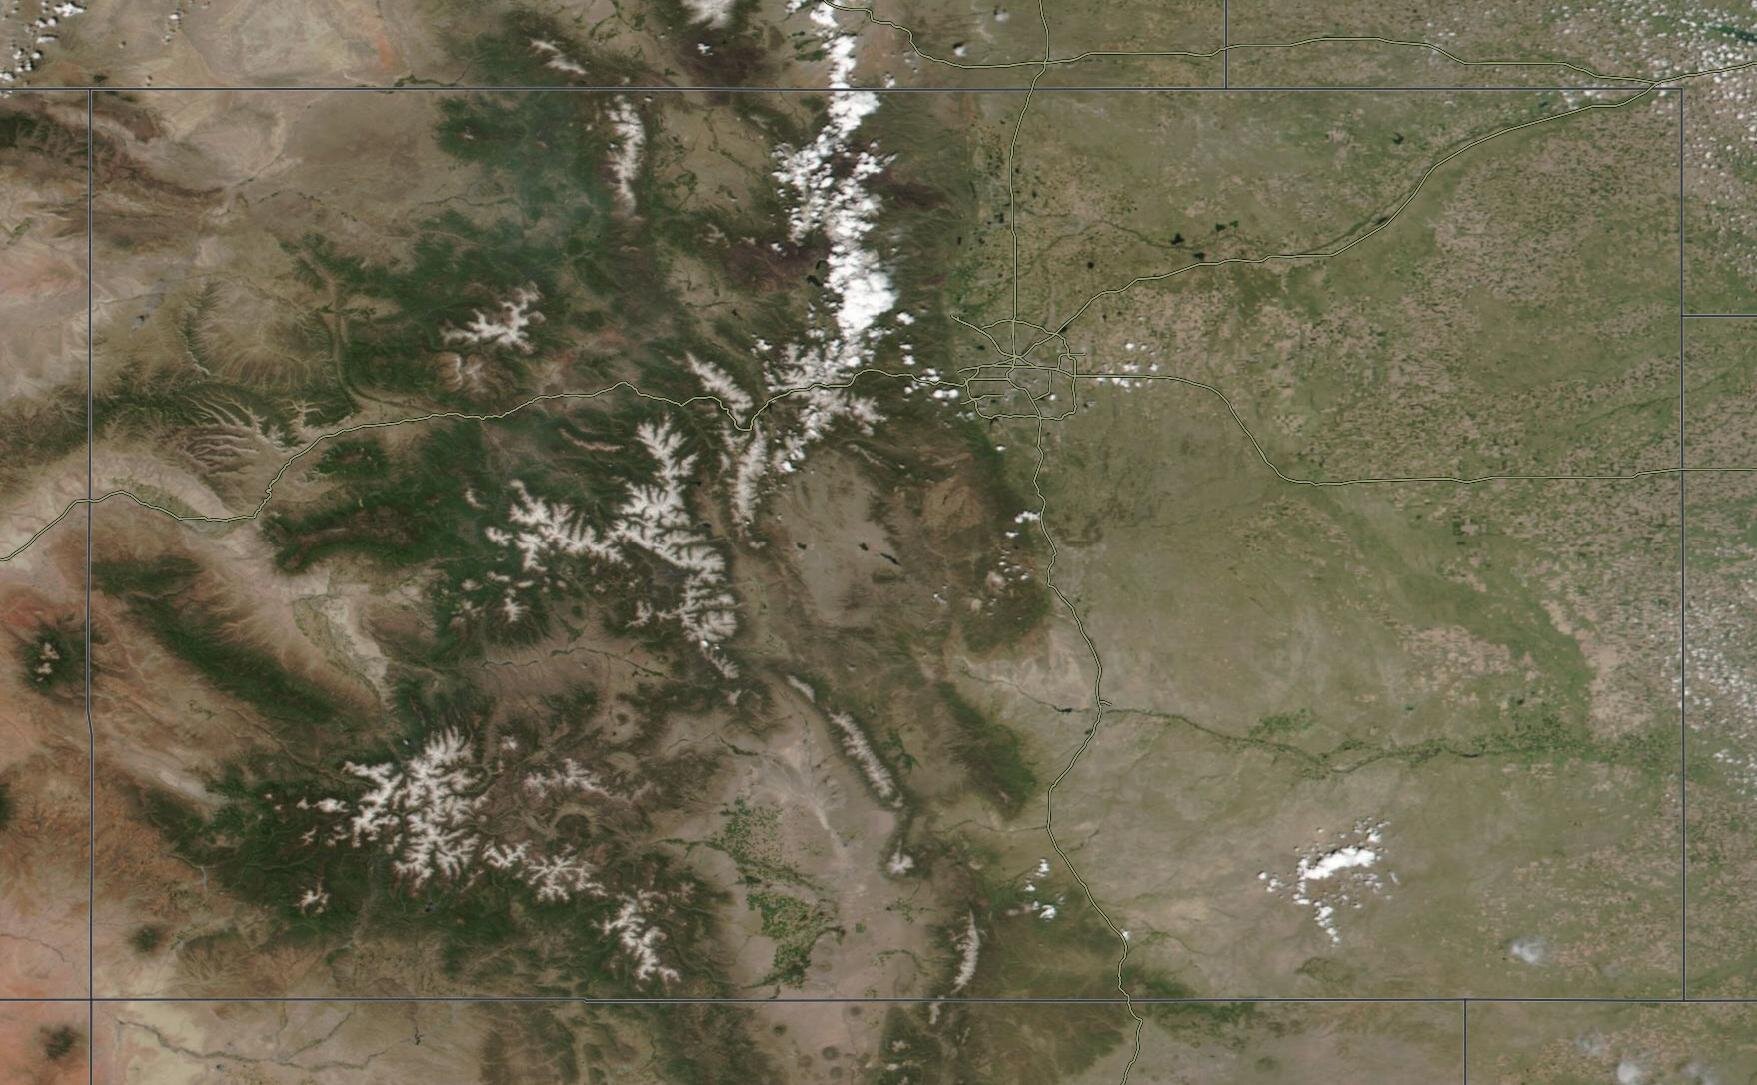
Above: MODIS images starting the end of March to June 8. These images help visualize how rapid snow ablation was this spring as well as the dustier periods. The March 24 image shows a pretty clean snow surface on remaining snowpack following a storm May 21.
Above: Variance of combined March, April, and May precipitation for the SNOTEL stations adjacent to or near CODOS monitoring sites. This bar graph illustrates one reason why streamflows turned out the way they did. The 6 bars to the right are in the San Juan Mountains, on average, 17% decline in normal precipitation during March/April/May. The Central and Northern Colorado fared worse with declines near 31%, except for the anomalous Berthoud and Hoosier site.
RUNOFF BEHAVIOR
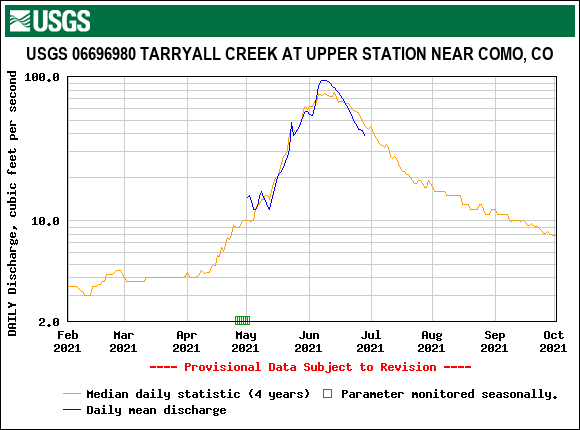
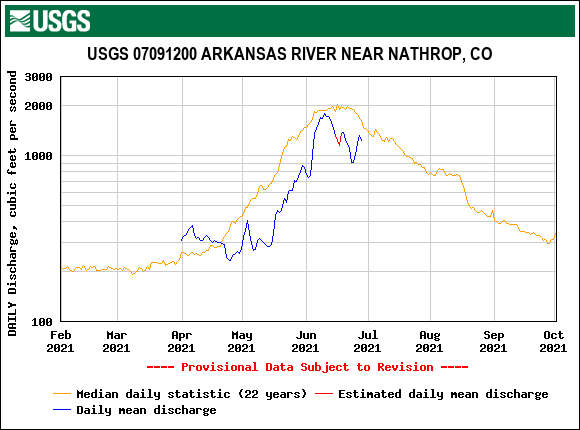
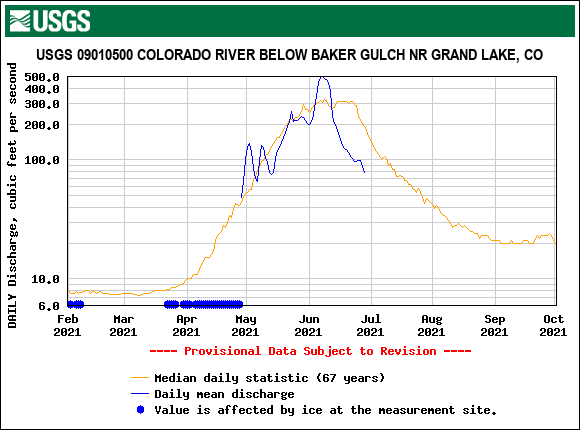
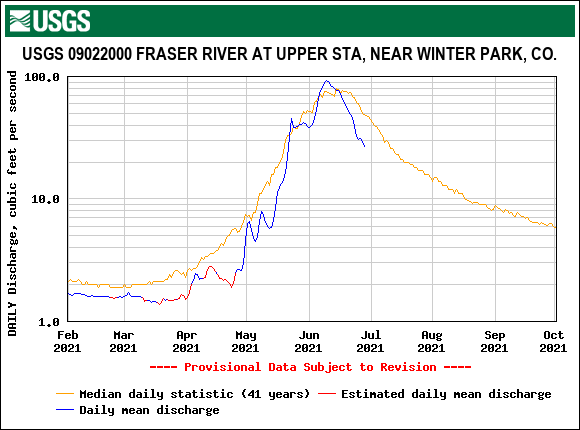
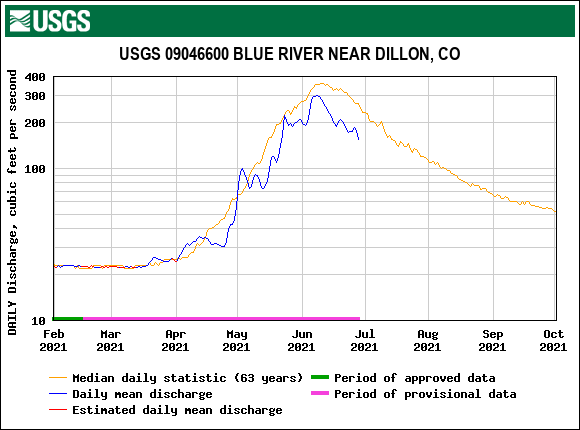
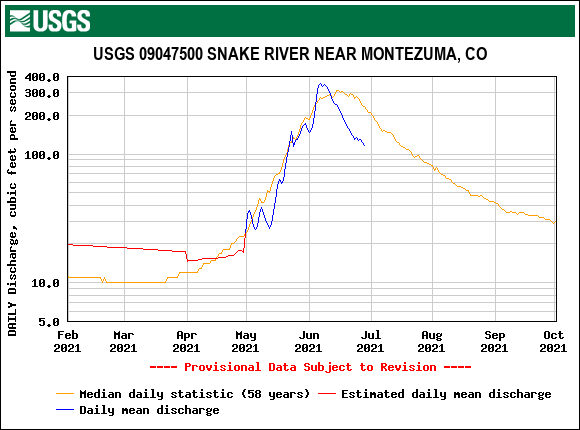
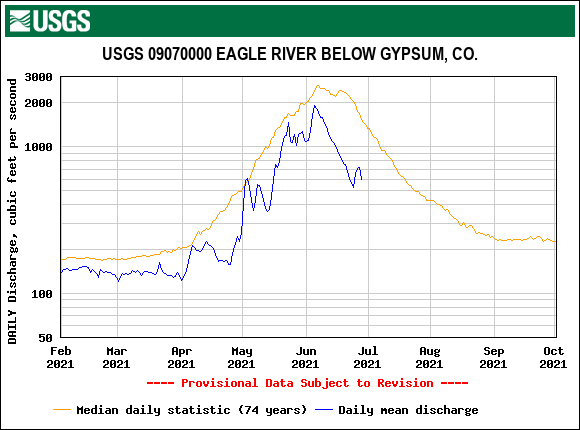
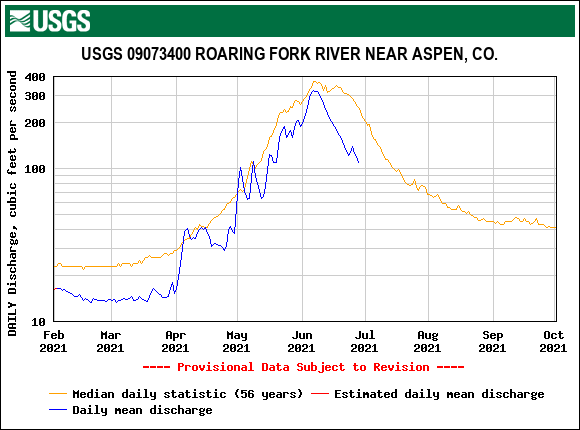
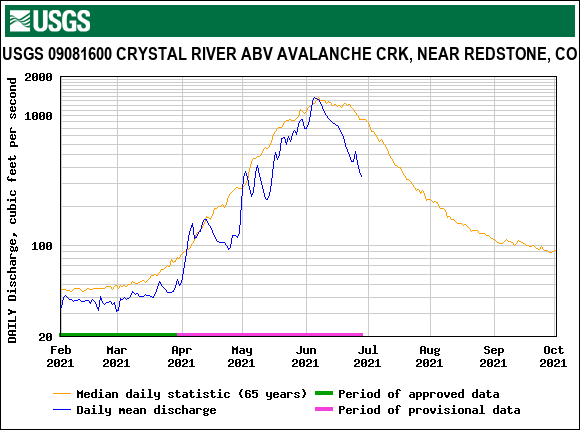
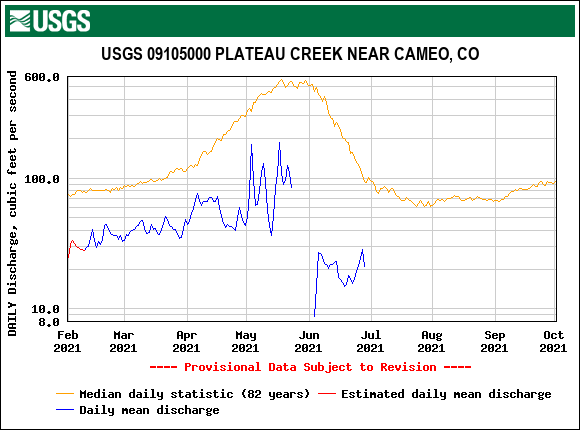
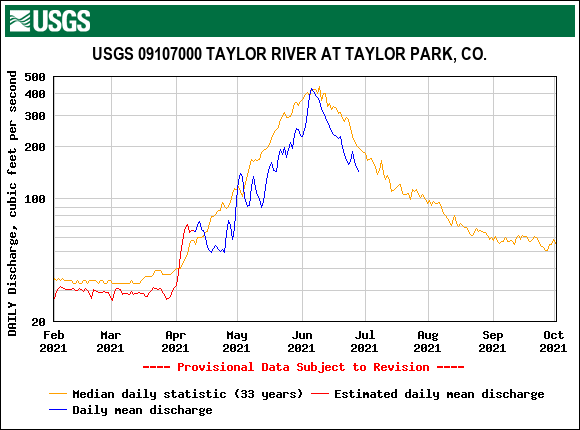
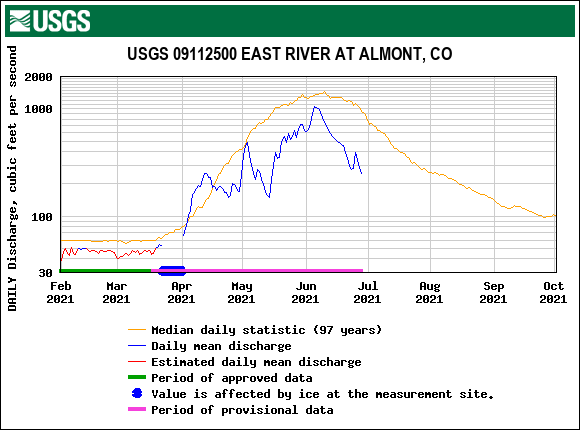
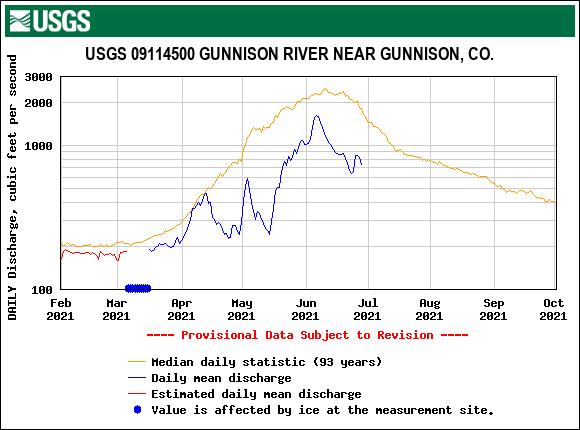
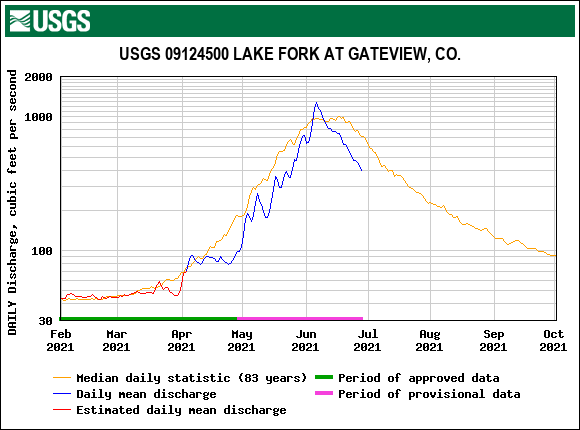
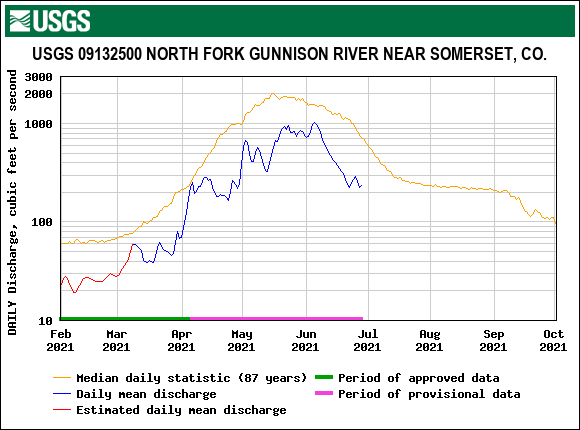
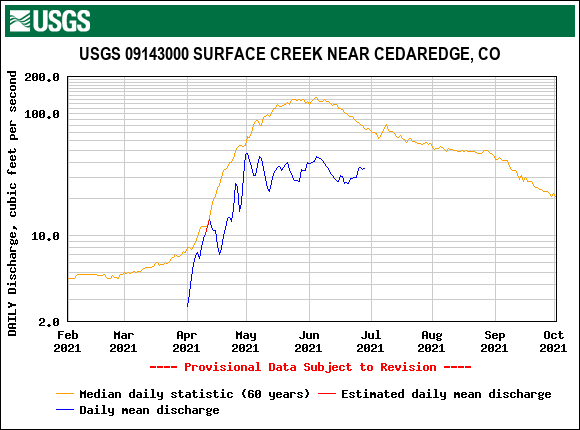
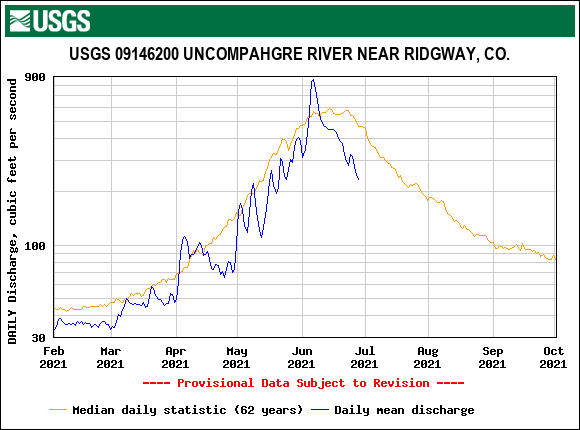
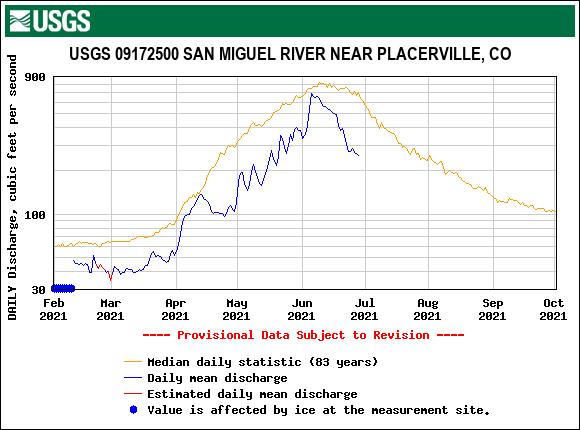
Similar to the last couple years, one of the biggest questions as the snowpack accumulated was, given the severe soil moisture deficit, just how much melt water would make it to the streams and how much would go towards replenishing the thirsty soils that were even worse off than WY2020. Once again baseflows were extremely low going into the winter season and continued being below normal through winter. Streamflow remained well below median starting early spring continuing until end of April, only maybe spiking to near normal streamflow during periods of rapid melt due to dust-on-snow and hot weather, but most rivers still falling well short.
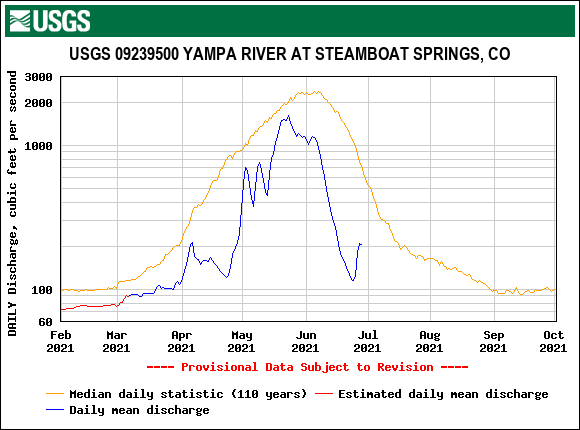
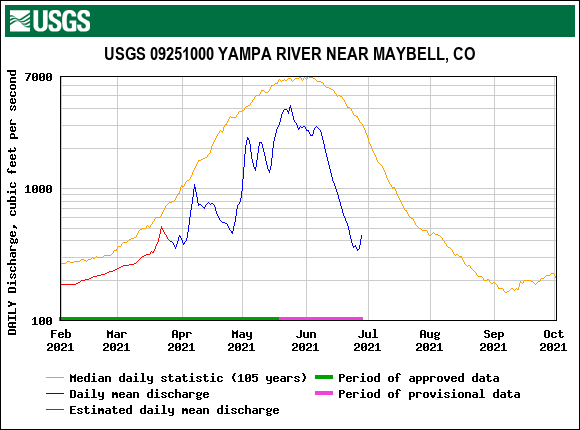
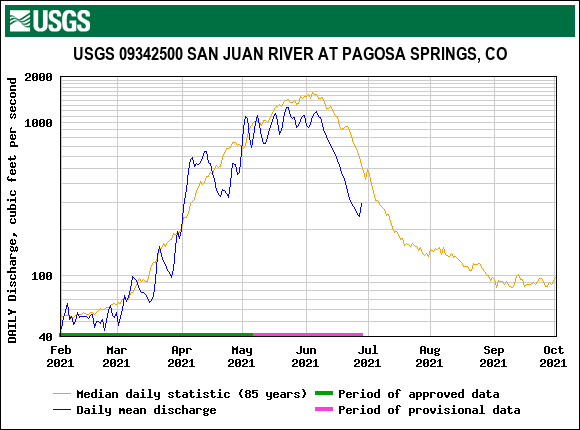
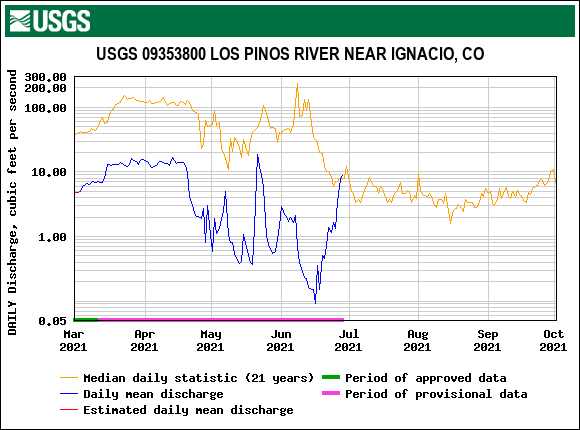
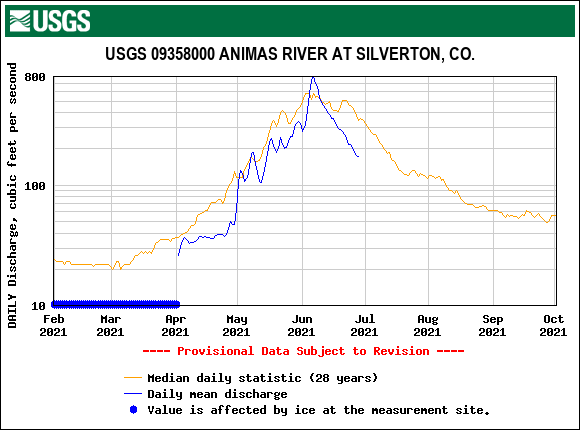
The extreme dry soils throughout Colorado, dry/hot weather, and significant exposed dust-on-snow starting in April, culminated in increased evaporation/sublimation of the snow while snowmelt was consumed to a large degree by thirsty soils. Peak discharge occurred near the usual timeframe (Animas) or up to two weeks (Yampa) early depending on watershed.
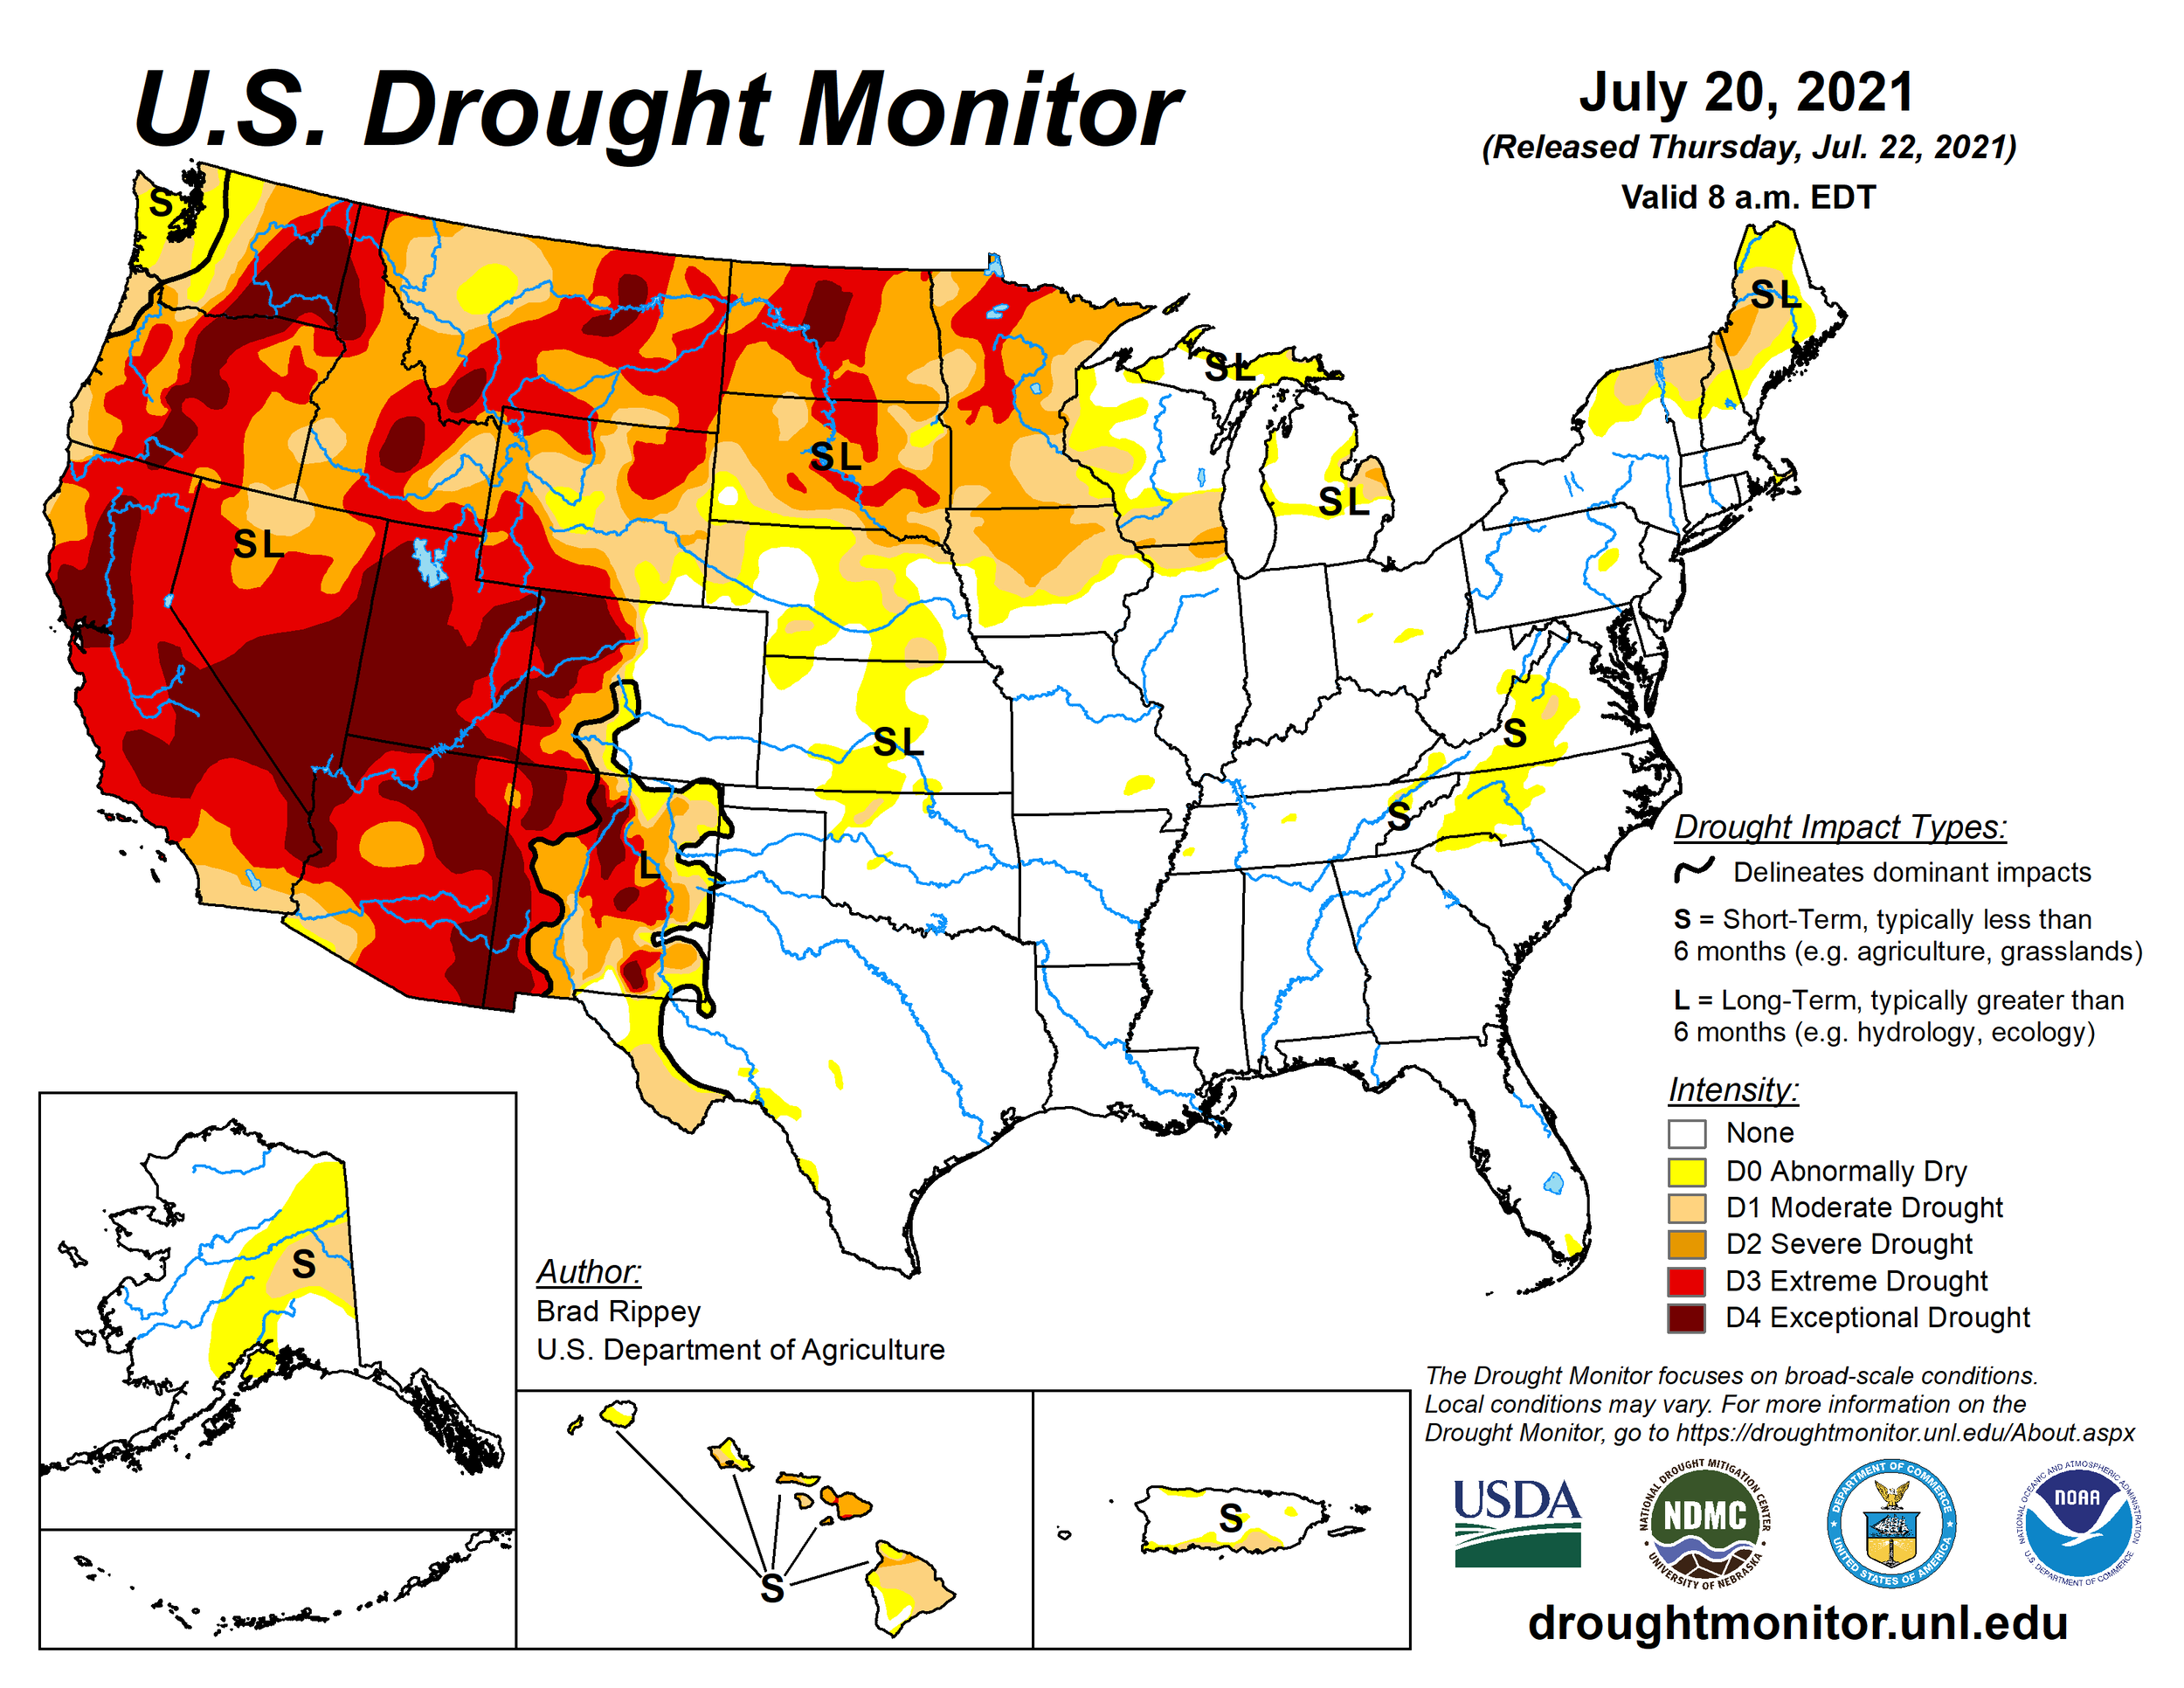
Overall snowmelt volumes were very low and continue to be such. Drought conditions east of the Continental Divide have been alleviated for the time being while Western Colorado (and the West) remain in extreme drought. Streamflow forecasts were among the five driest on record and the forecasted April-July inflow forecast for Lake Powell was 25% of normal. At the time of posting of this Season Summary Lake Powell is lower than it ever has been, emergency measures are being taken to prop up lake levels by releasing water in Colorado reservoirs. We are headed into uncharted territory with aridification of the West and lack of water resources.
Looking Ahead
Currently, stream gauges are well below median levels. For the last few weeks and considering the near term forecast it appears the monsoons are back in Colorado this summer. Stream gauges have shown some pretty sharp spikes and where storms are hitting burn scars (i.e. Glenwood Canyon, Cache la Poudre) flash flooding has been common and looks to continue.
El Niño Southern Oscilation (ENSO) is a periodic fluctuation in sea surface temperature and the air pressure of the overlying atmosphere across the equatorial Pacific Ocean. Currently ENSO neutral conditions exist in the Tropical Pacific and expected to continue through summer. ENSO predictions and what it might mean for the 2021/22 snowpack are taking shape. In a nutshell, ENSO-neutral is favored through the Northern Hemisphere summer and into the fall (51% chance for the August-October season), with La Niña potentially emerging during the September-November season and lasting through the 2021-22 winter (66% chance during November-January). With Colorado sitting in the transition zone, La Niña can generally mean wetter and cooler towards Northern Colorado and dryer and warmer towards Southern Colorado.
Current long-term outlooks (below) are suggesting the remaining summer and fall will be warmer than average with a decreased chance of precipitation in the long-term but equal chance for the next few weeks.