

Overview
Every March 1 the Colorado Dust-on-Snow Program (CODOS) summarizes dust-on-snow and snowpack conditions statewide and evaluates snow water equivalent (SWE) data from SNOTEL stations associated with our eleven CODOS sample sites and places them within the framework of the Dust Enhanced Runoff Classification scheme (DERC) developed by CODOS. The intent is to offer a glimpse of plausible WY2022 hydrograph characteristics based on current snowpack and dust conditions compared to similar conditions in our period of record.
SNOWPACK CONDITIONS
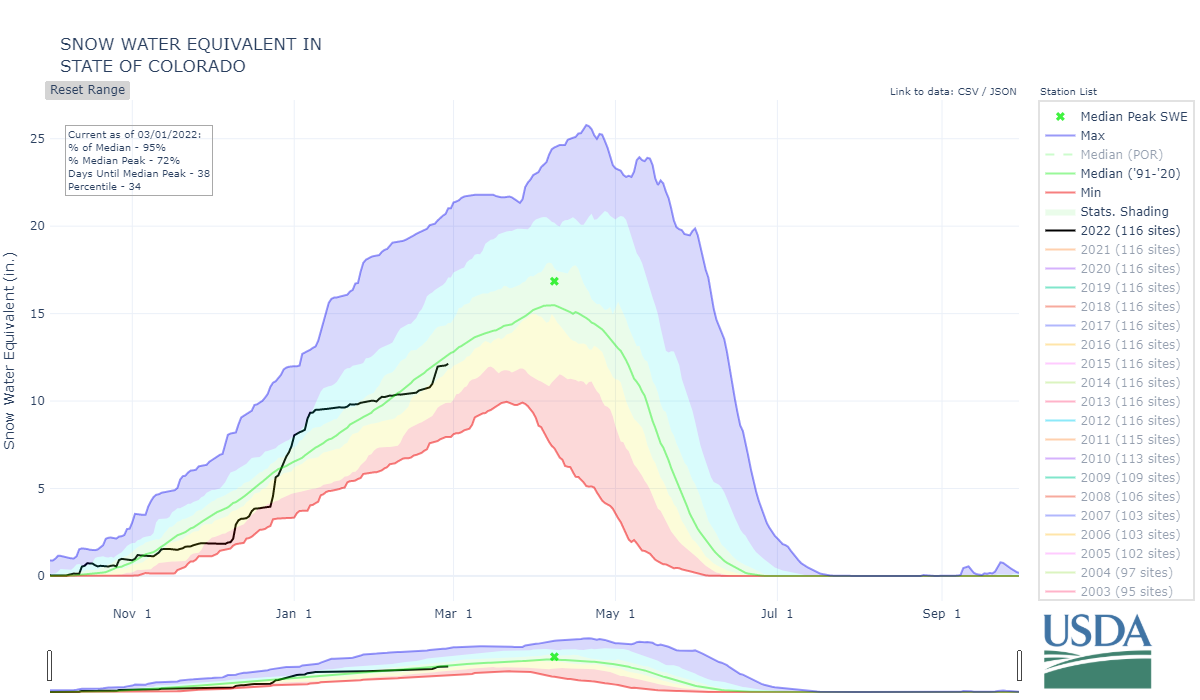
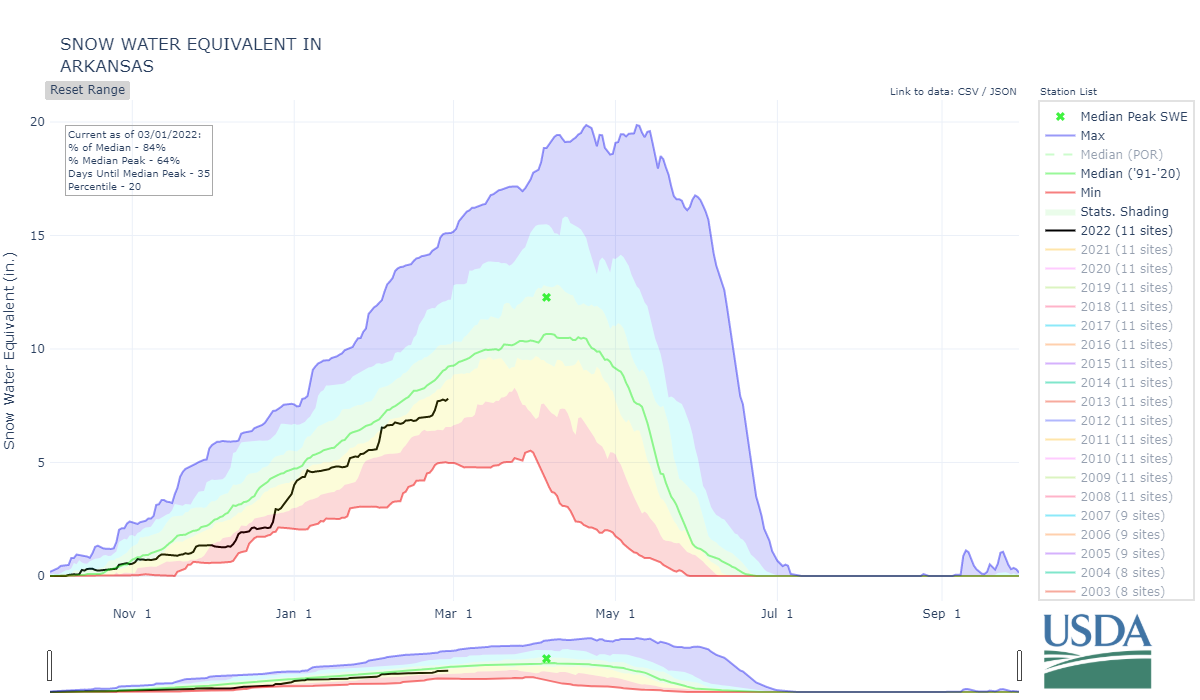
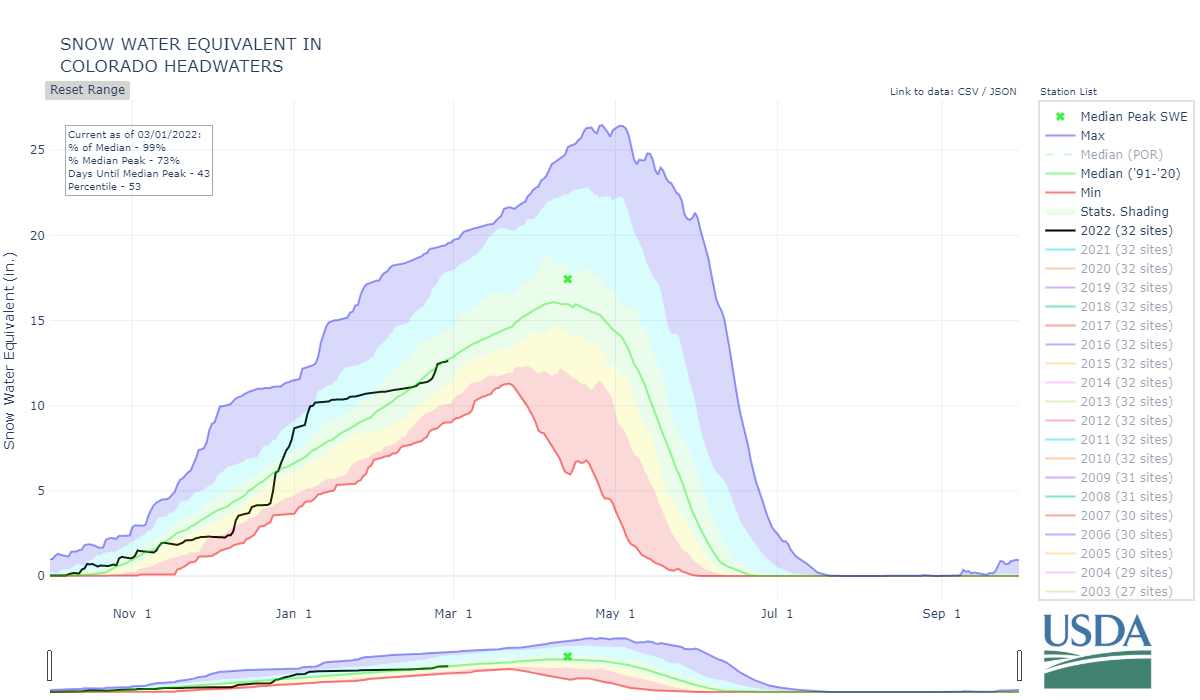
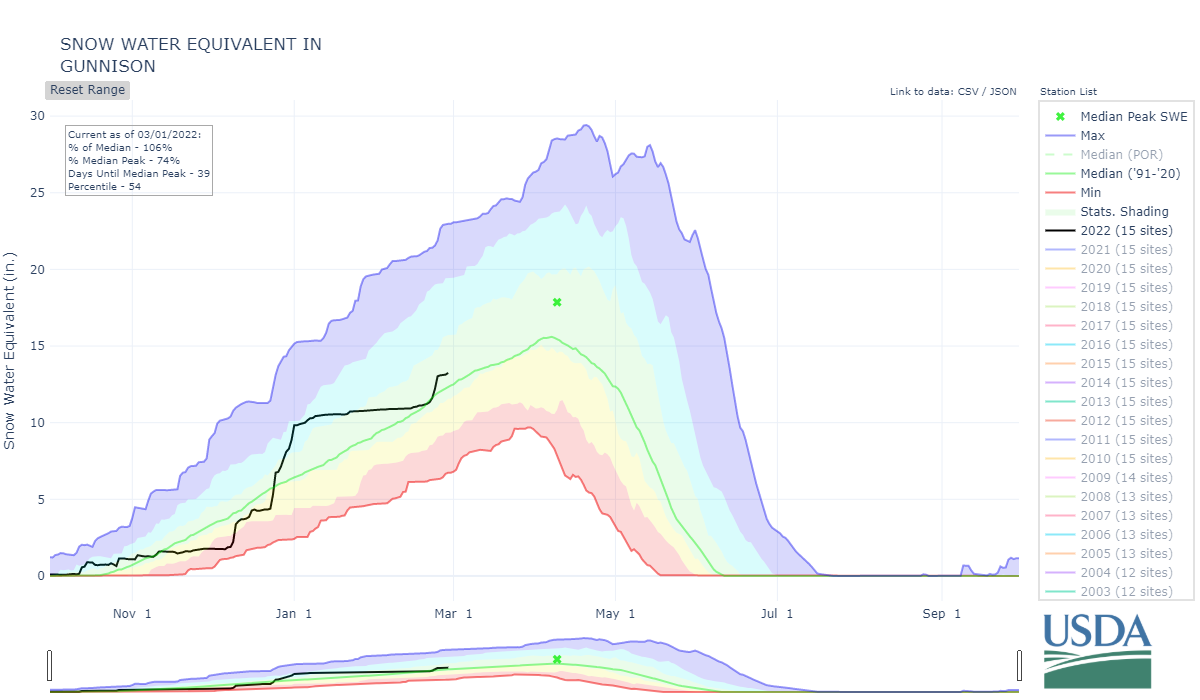
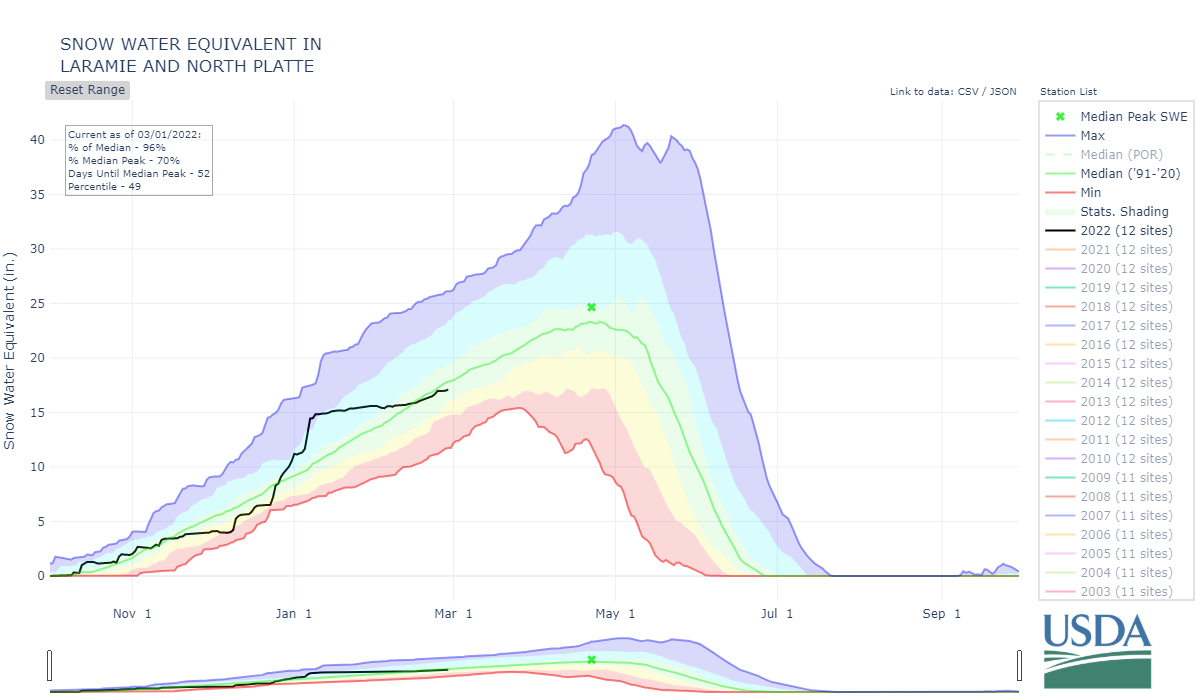
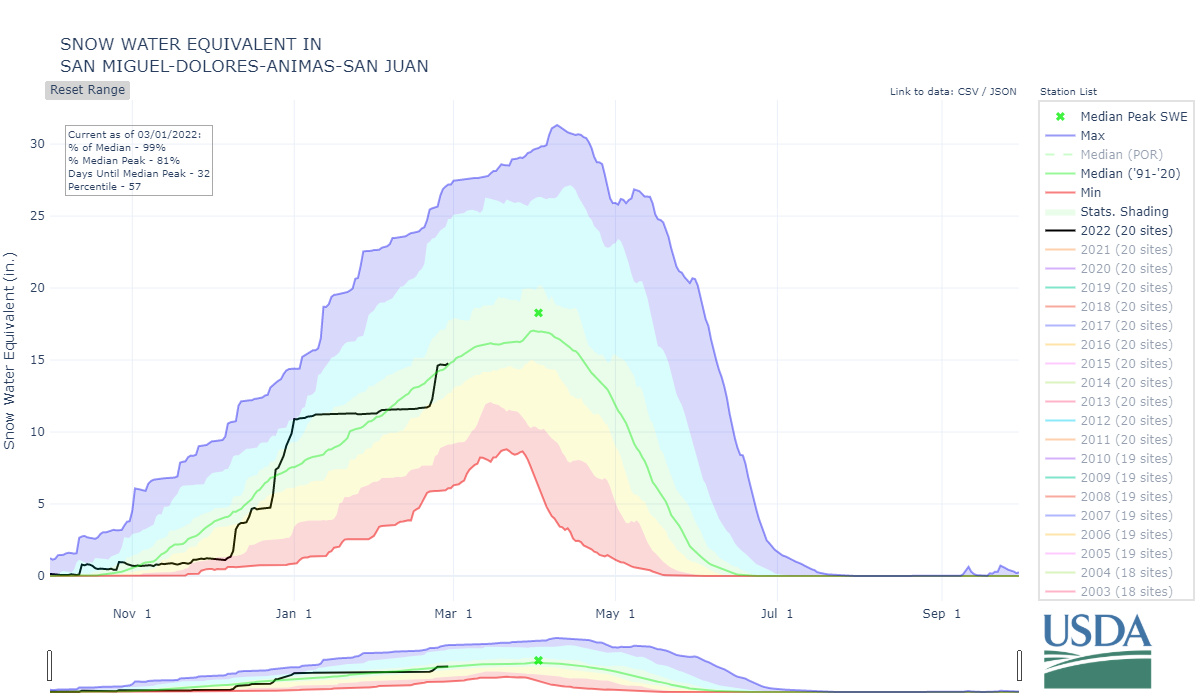
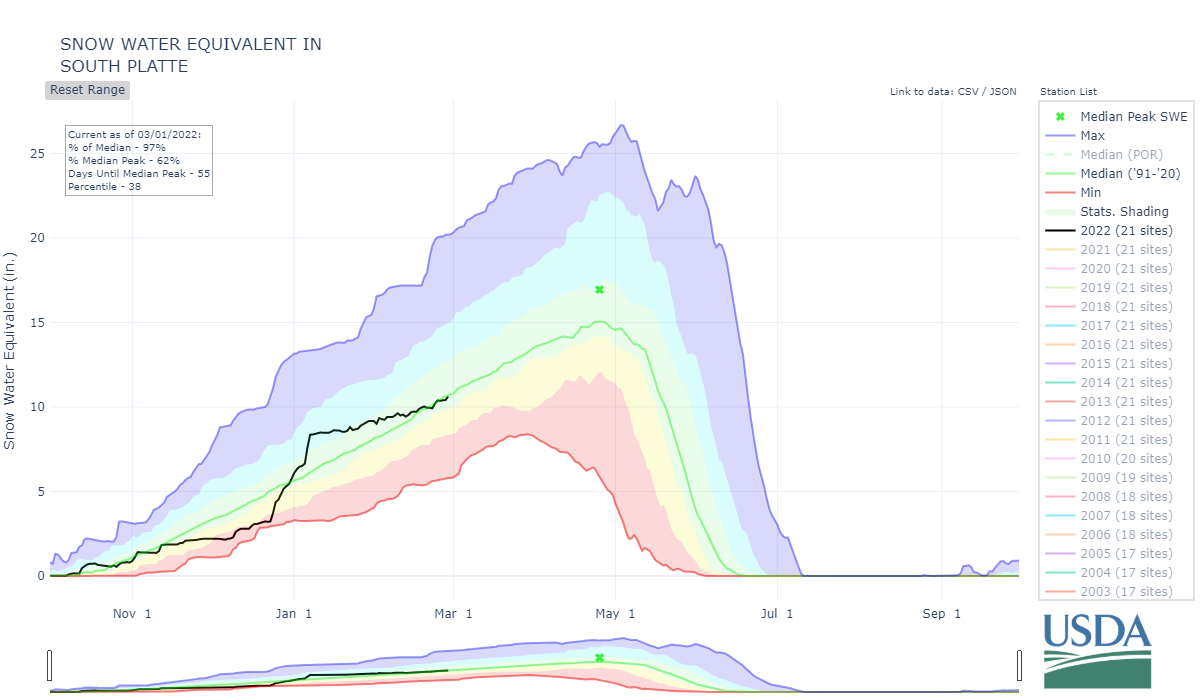
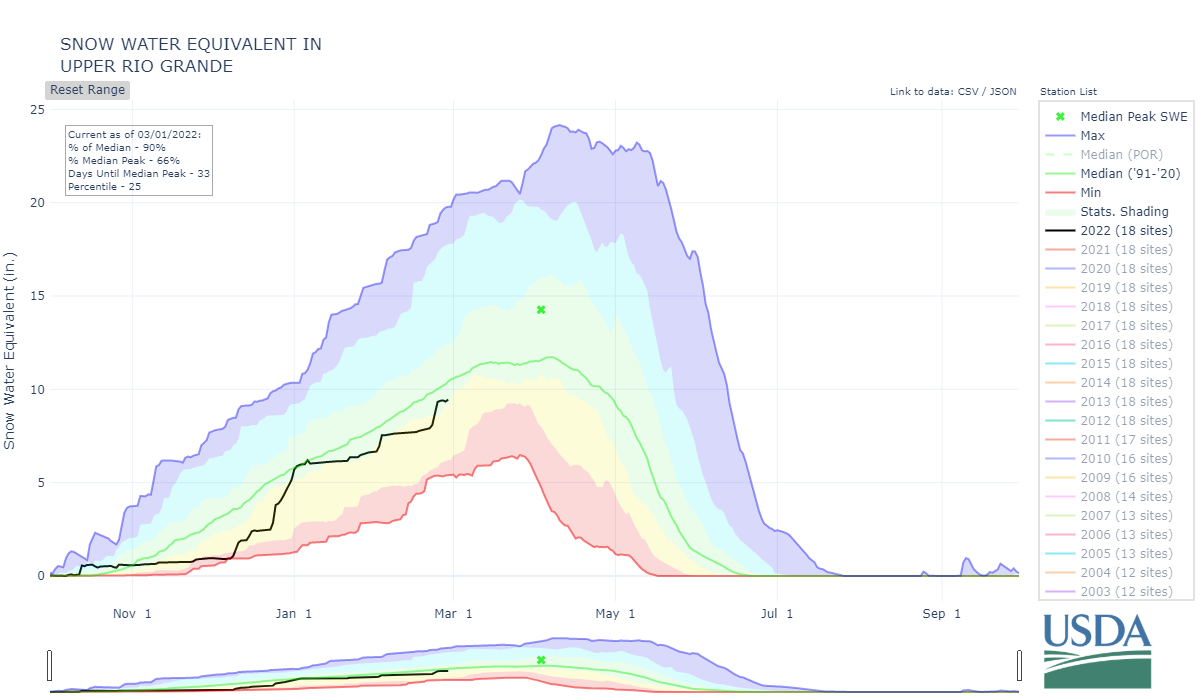
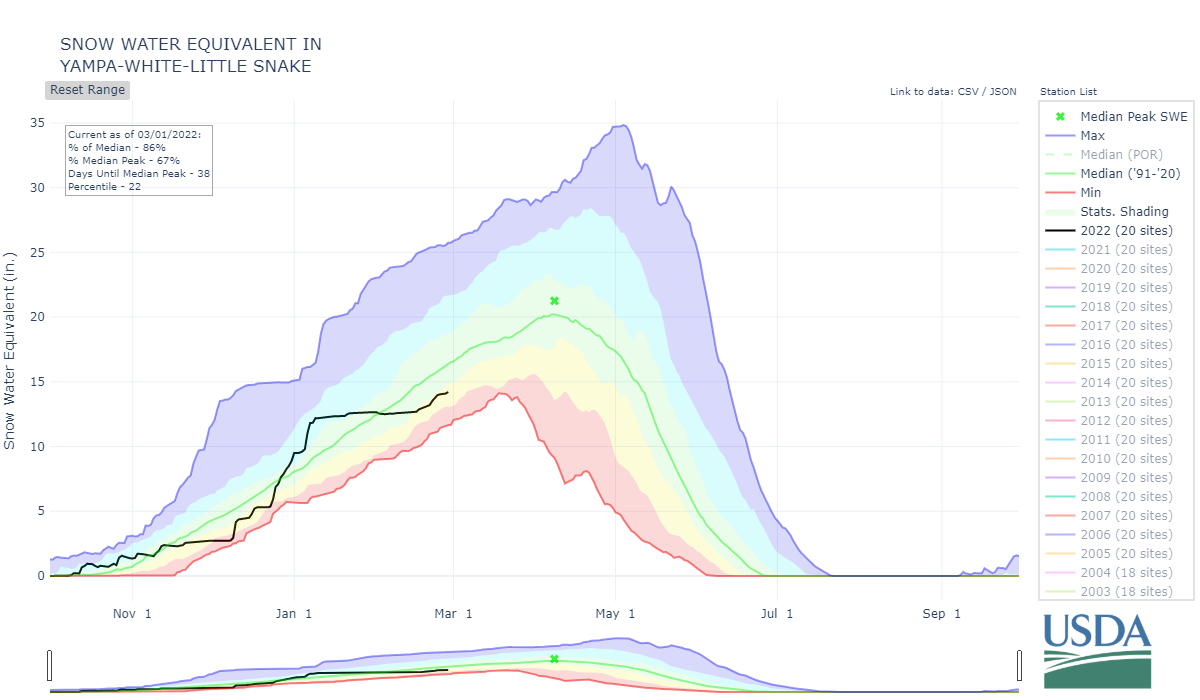
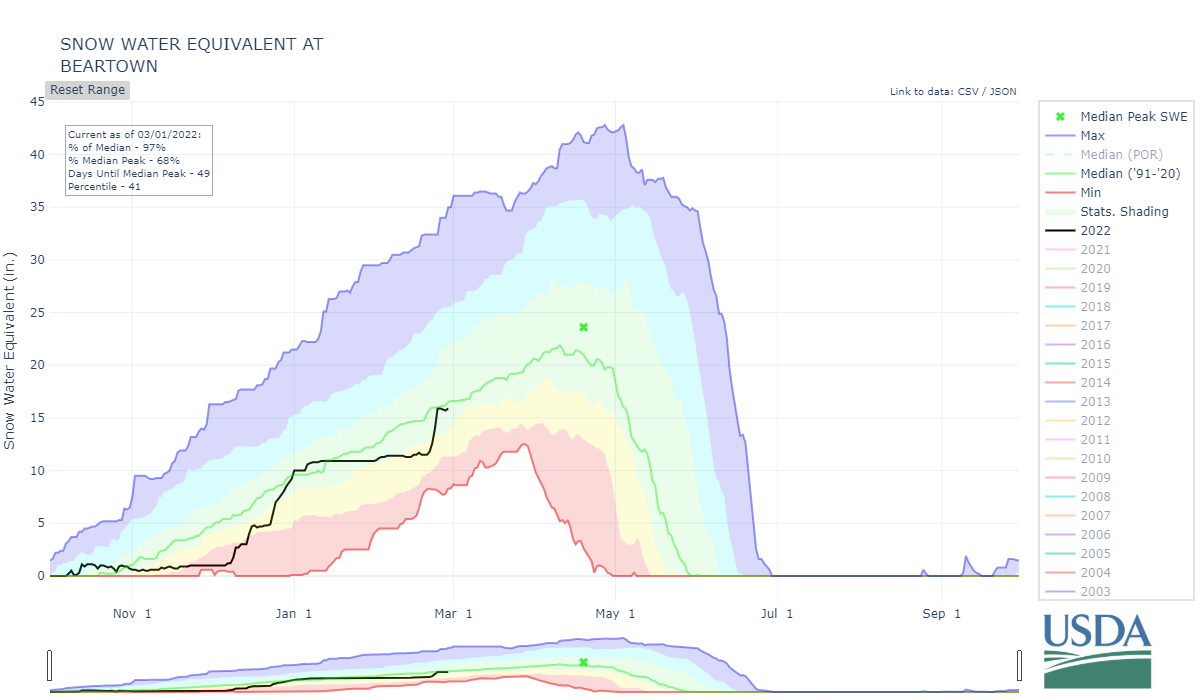
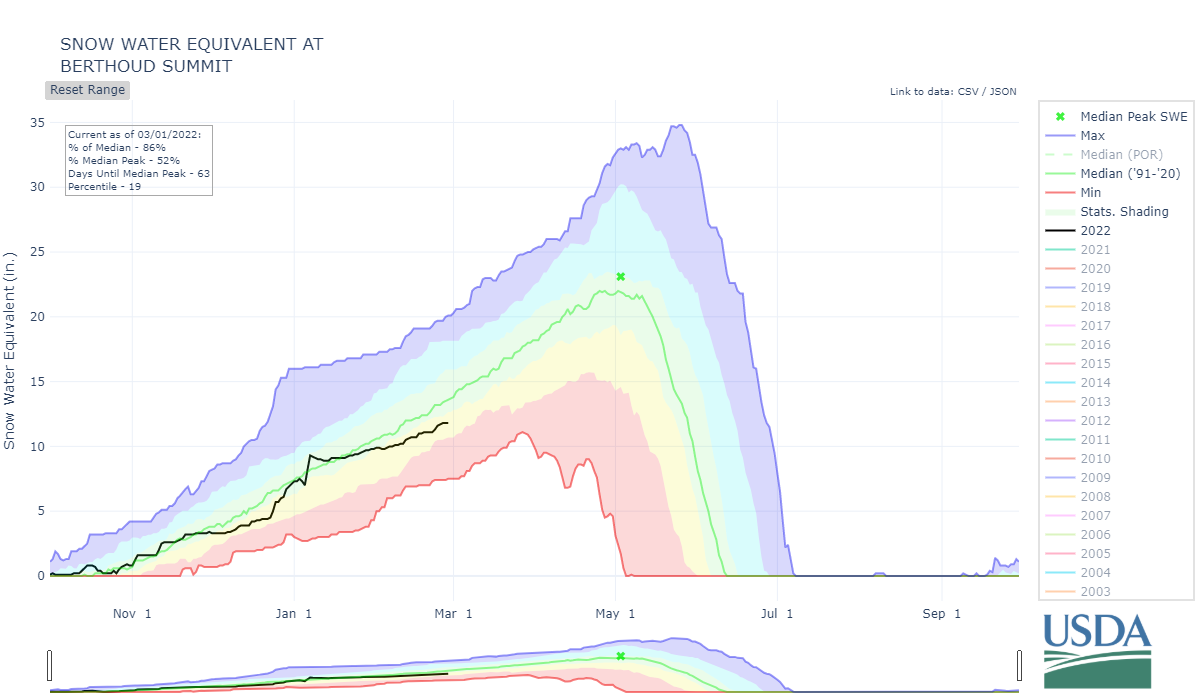
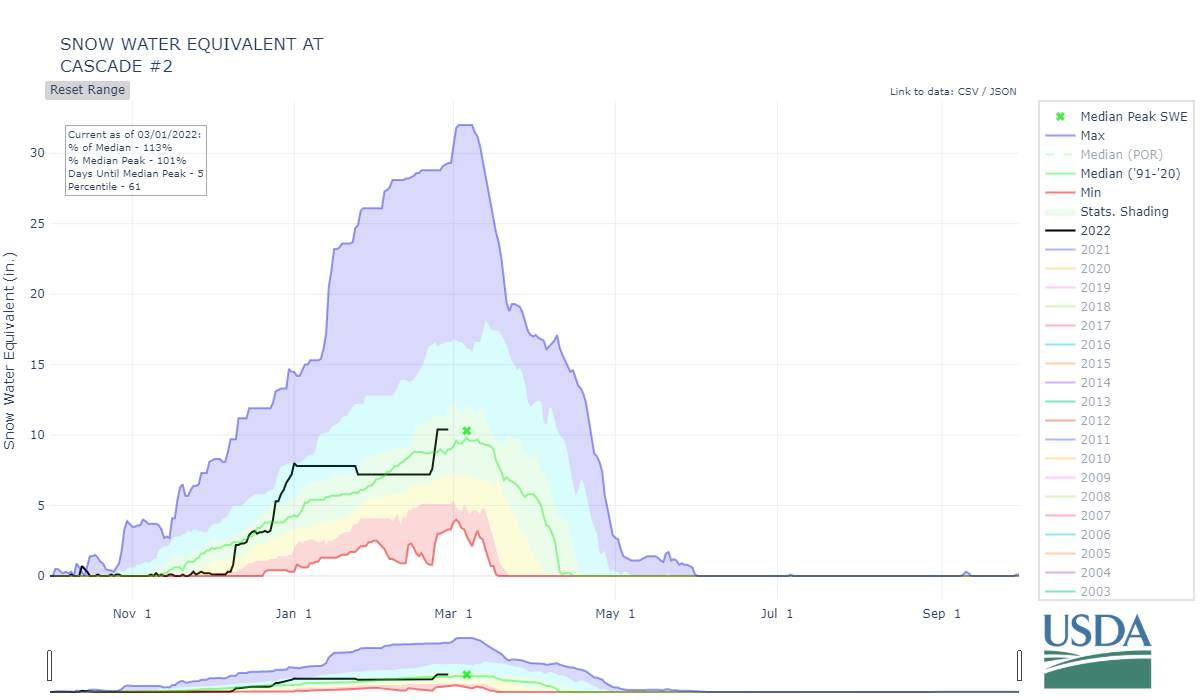
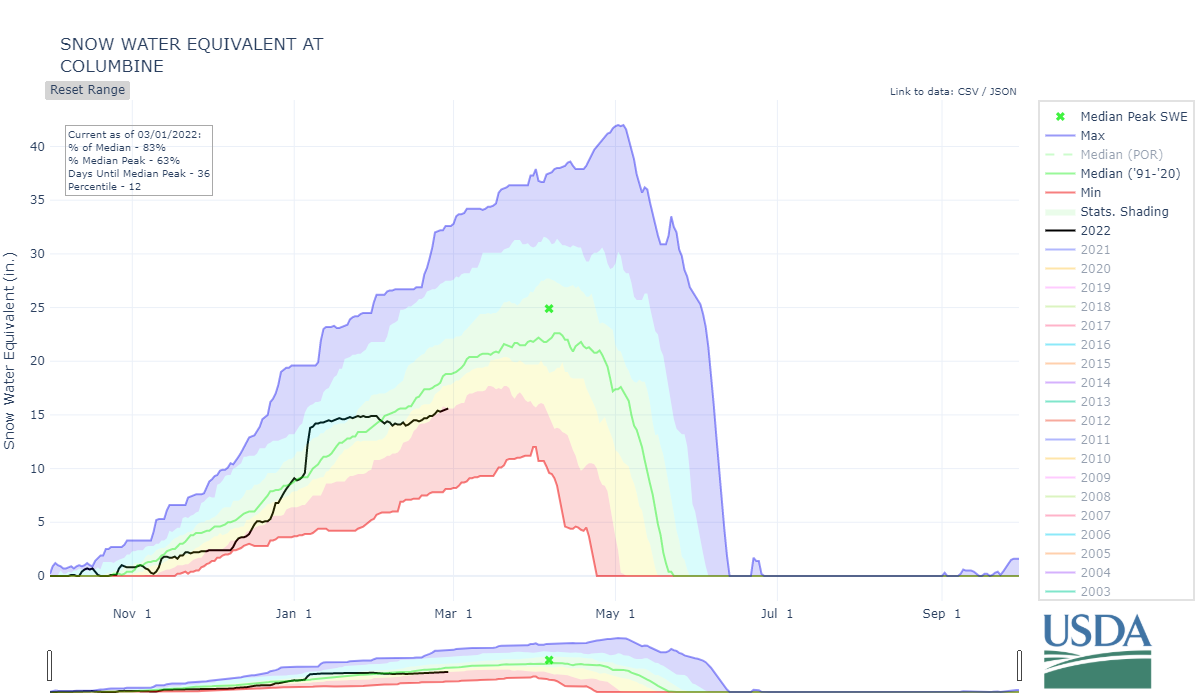
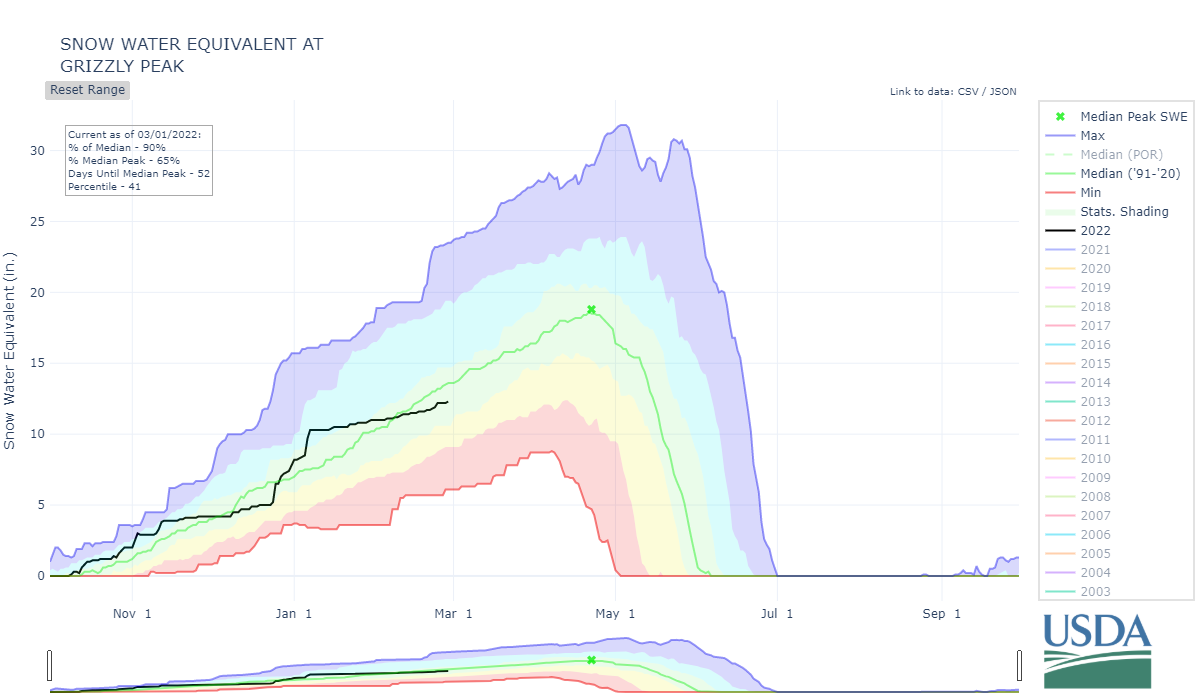
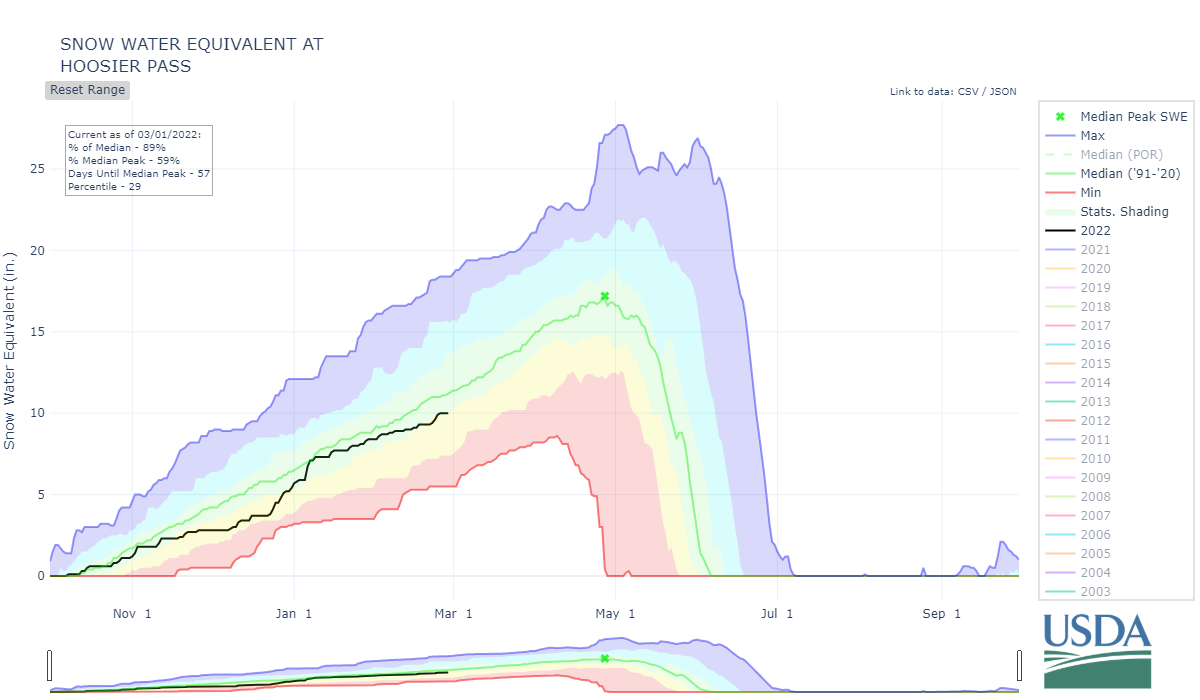
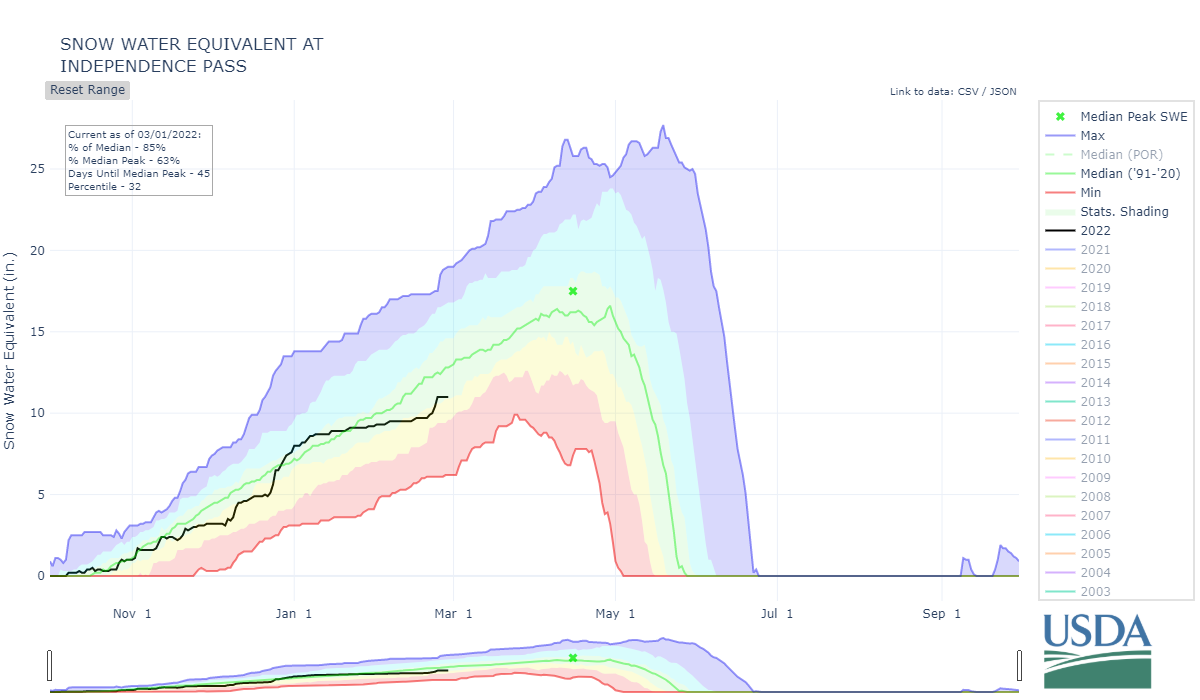
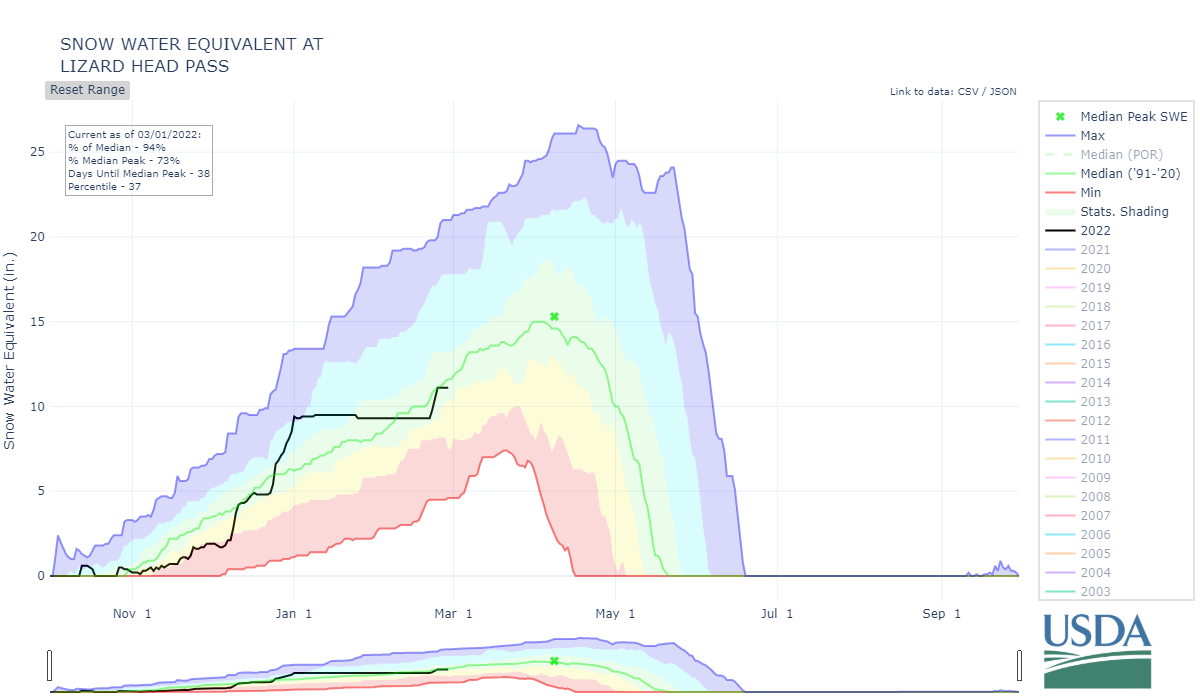
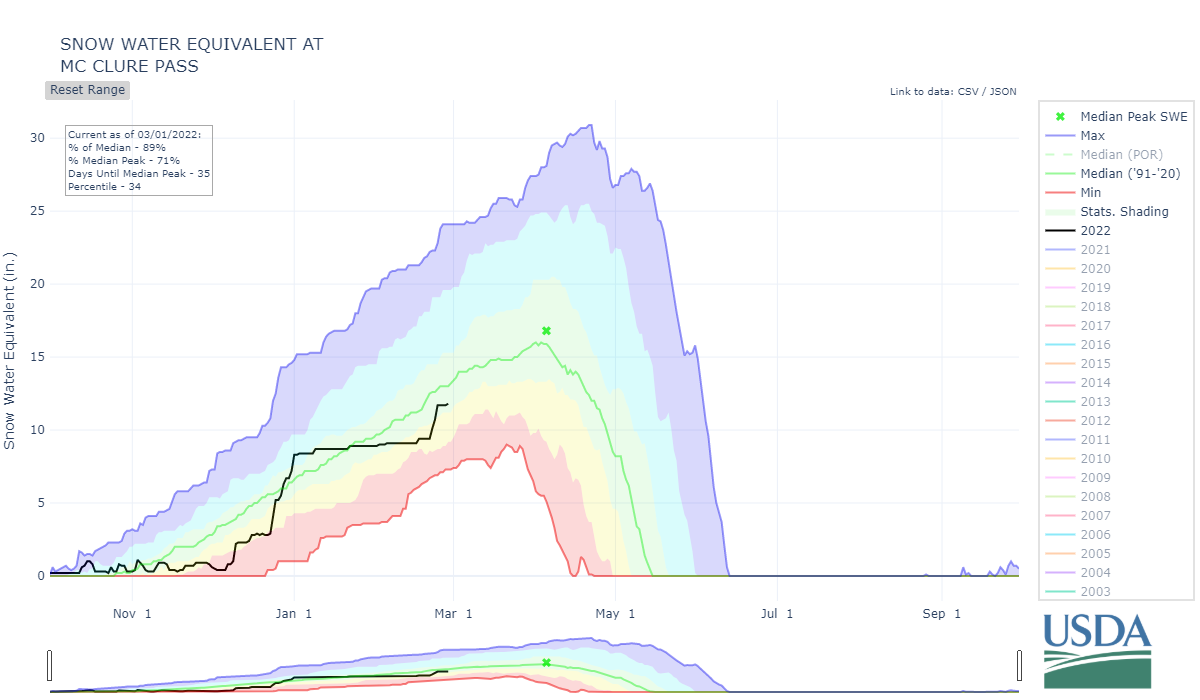
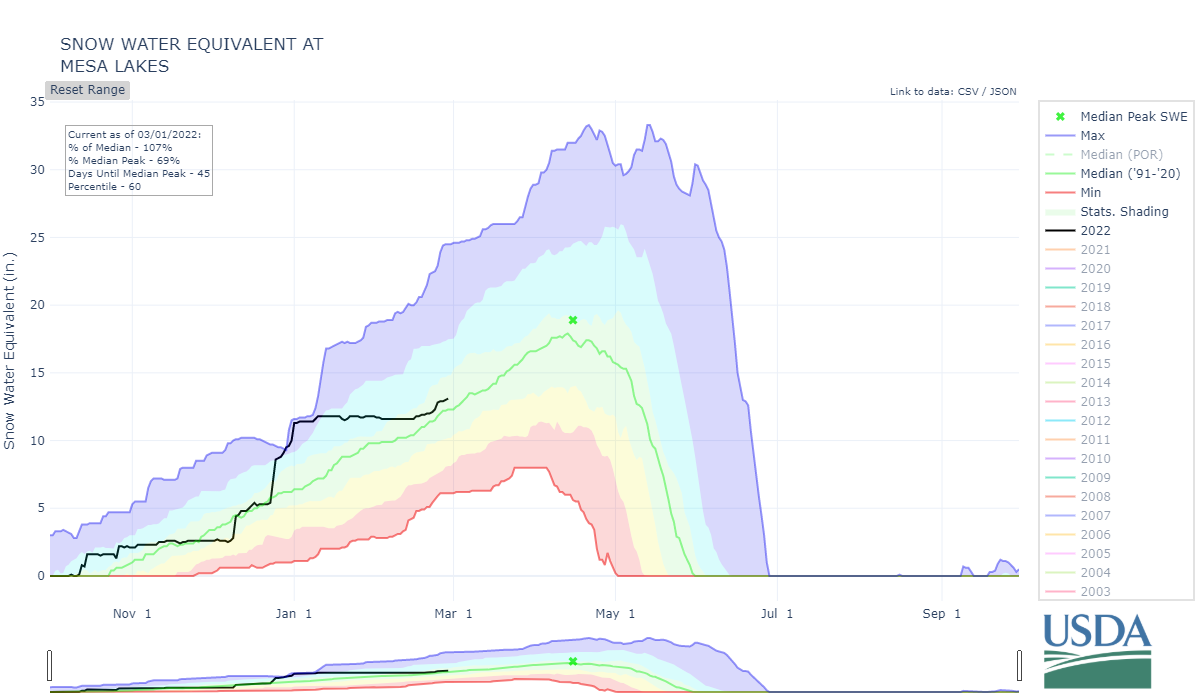
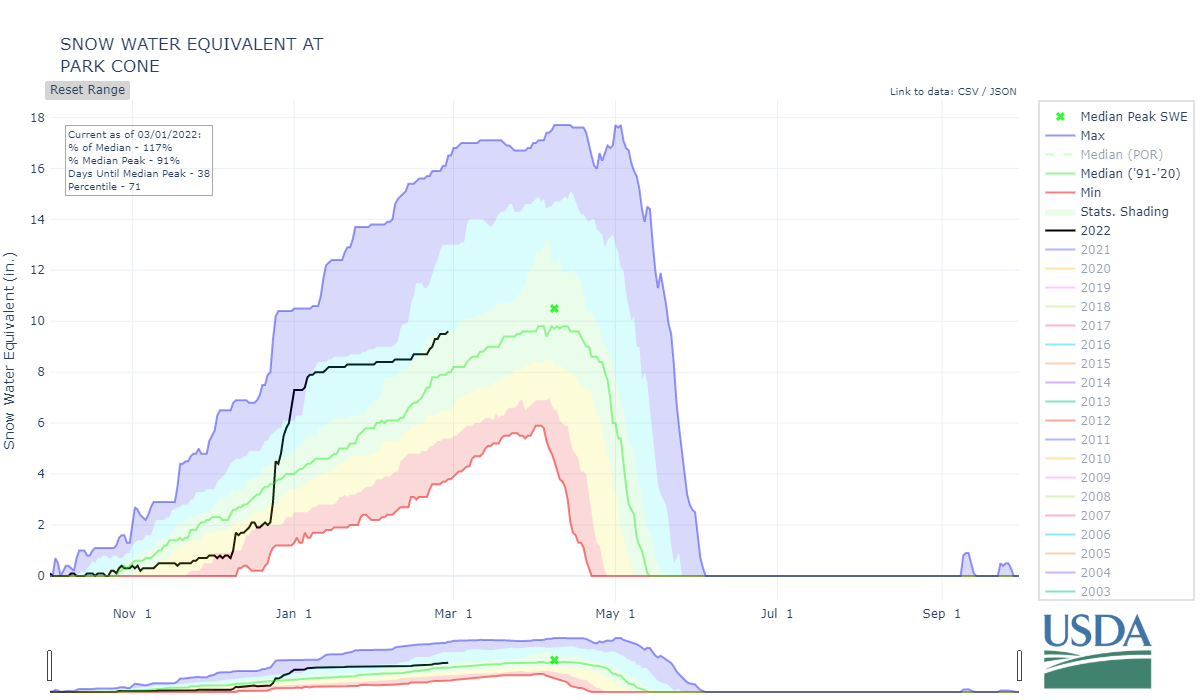
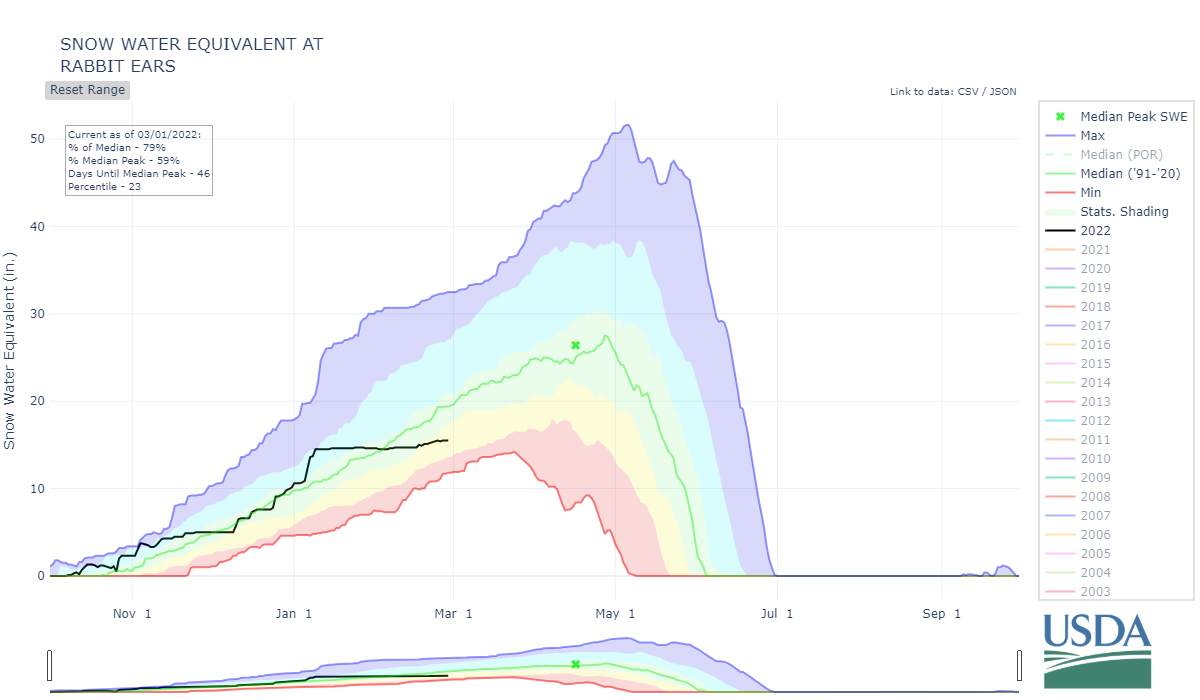
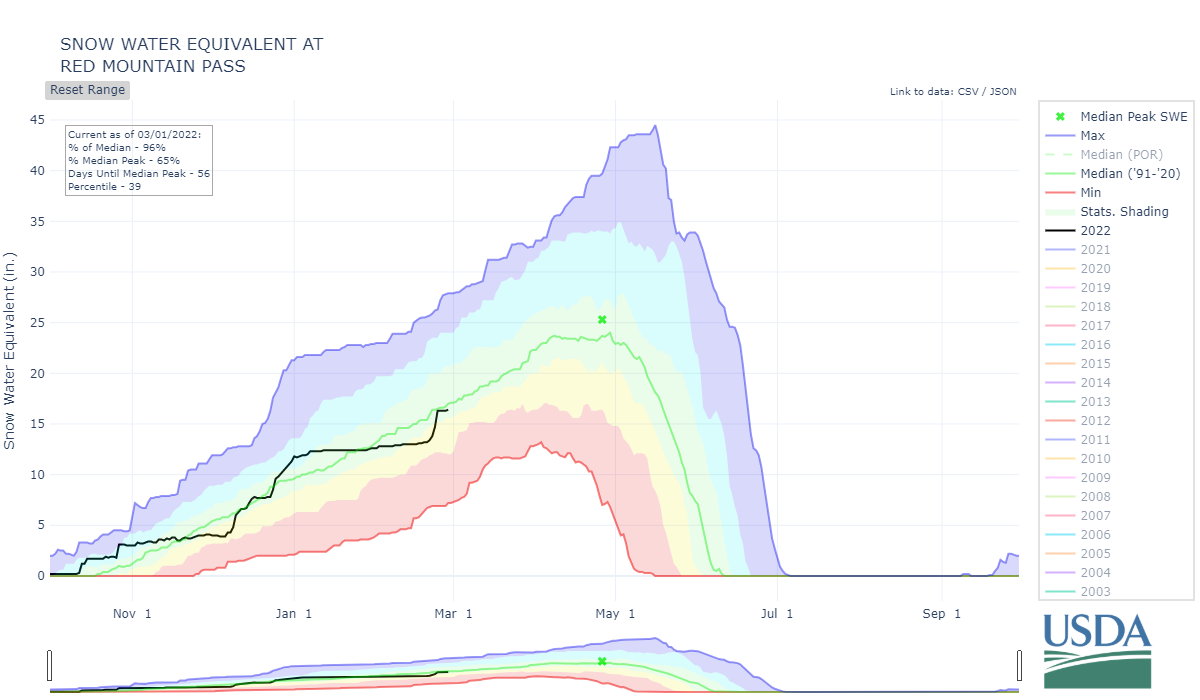
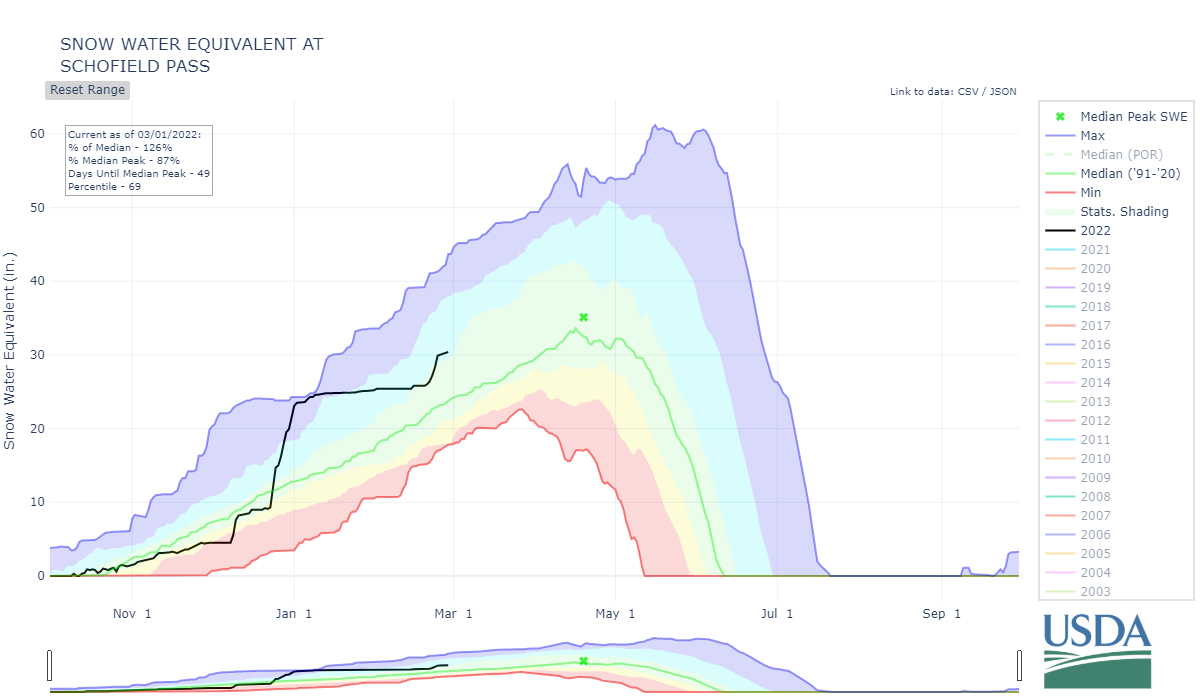
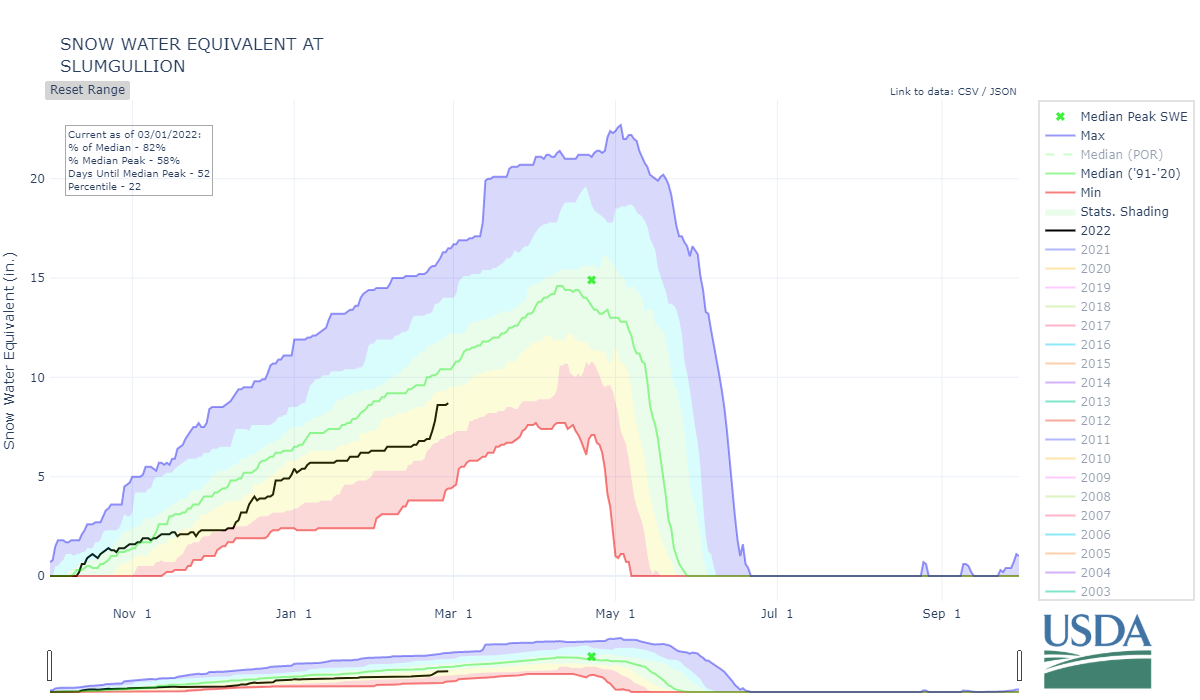
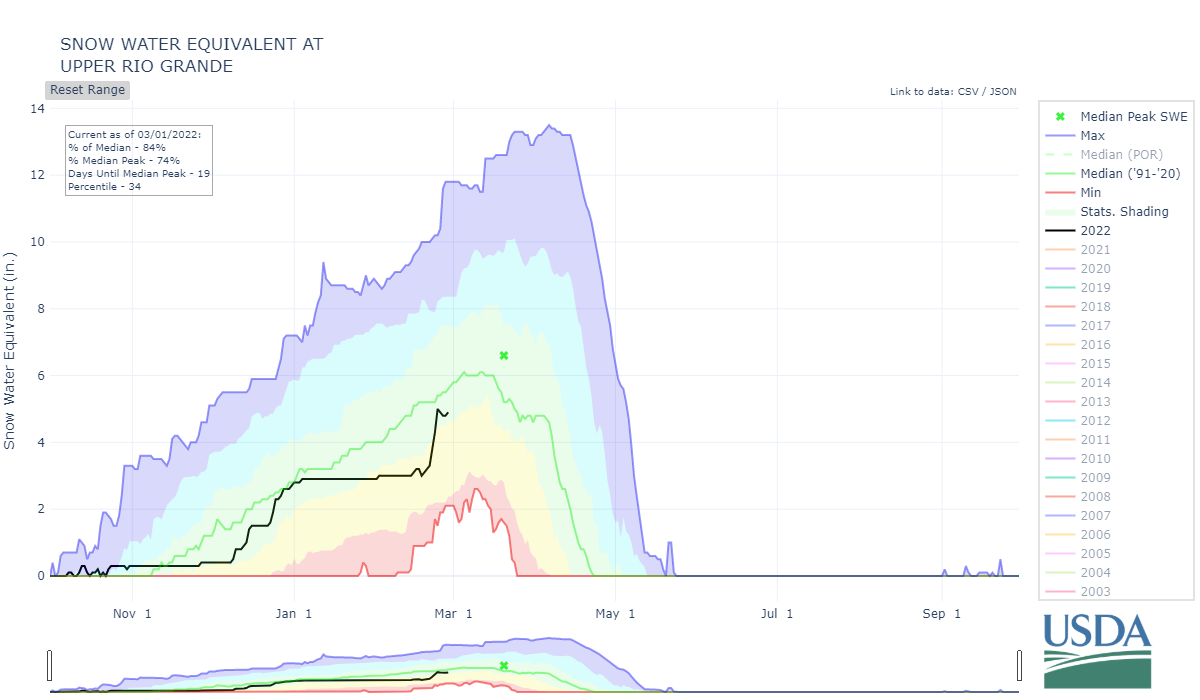
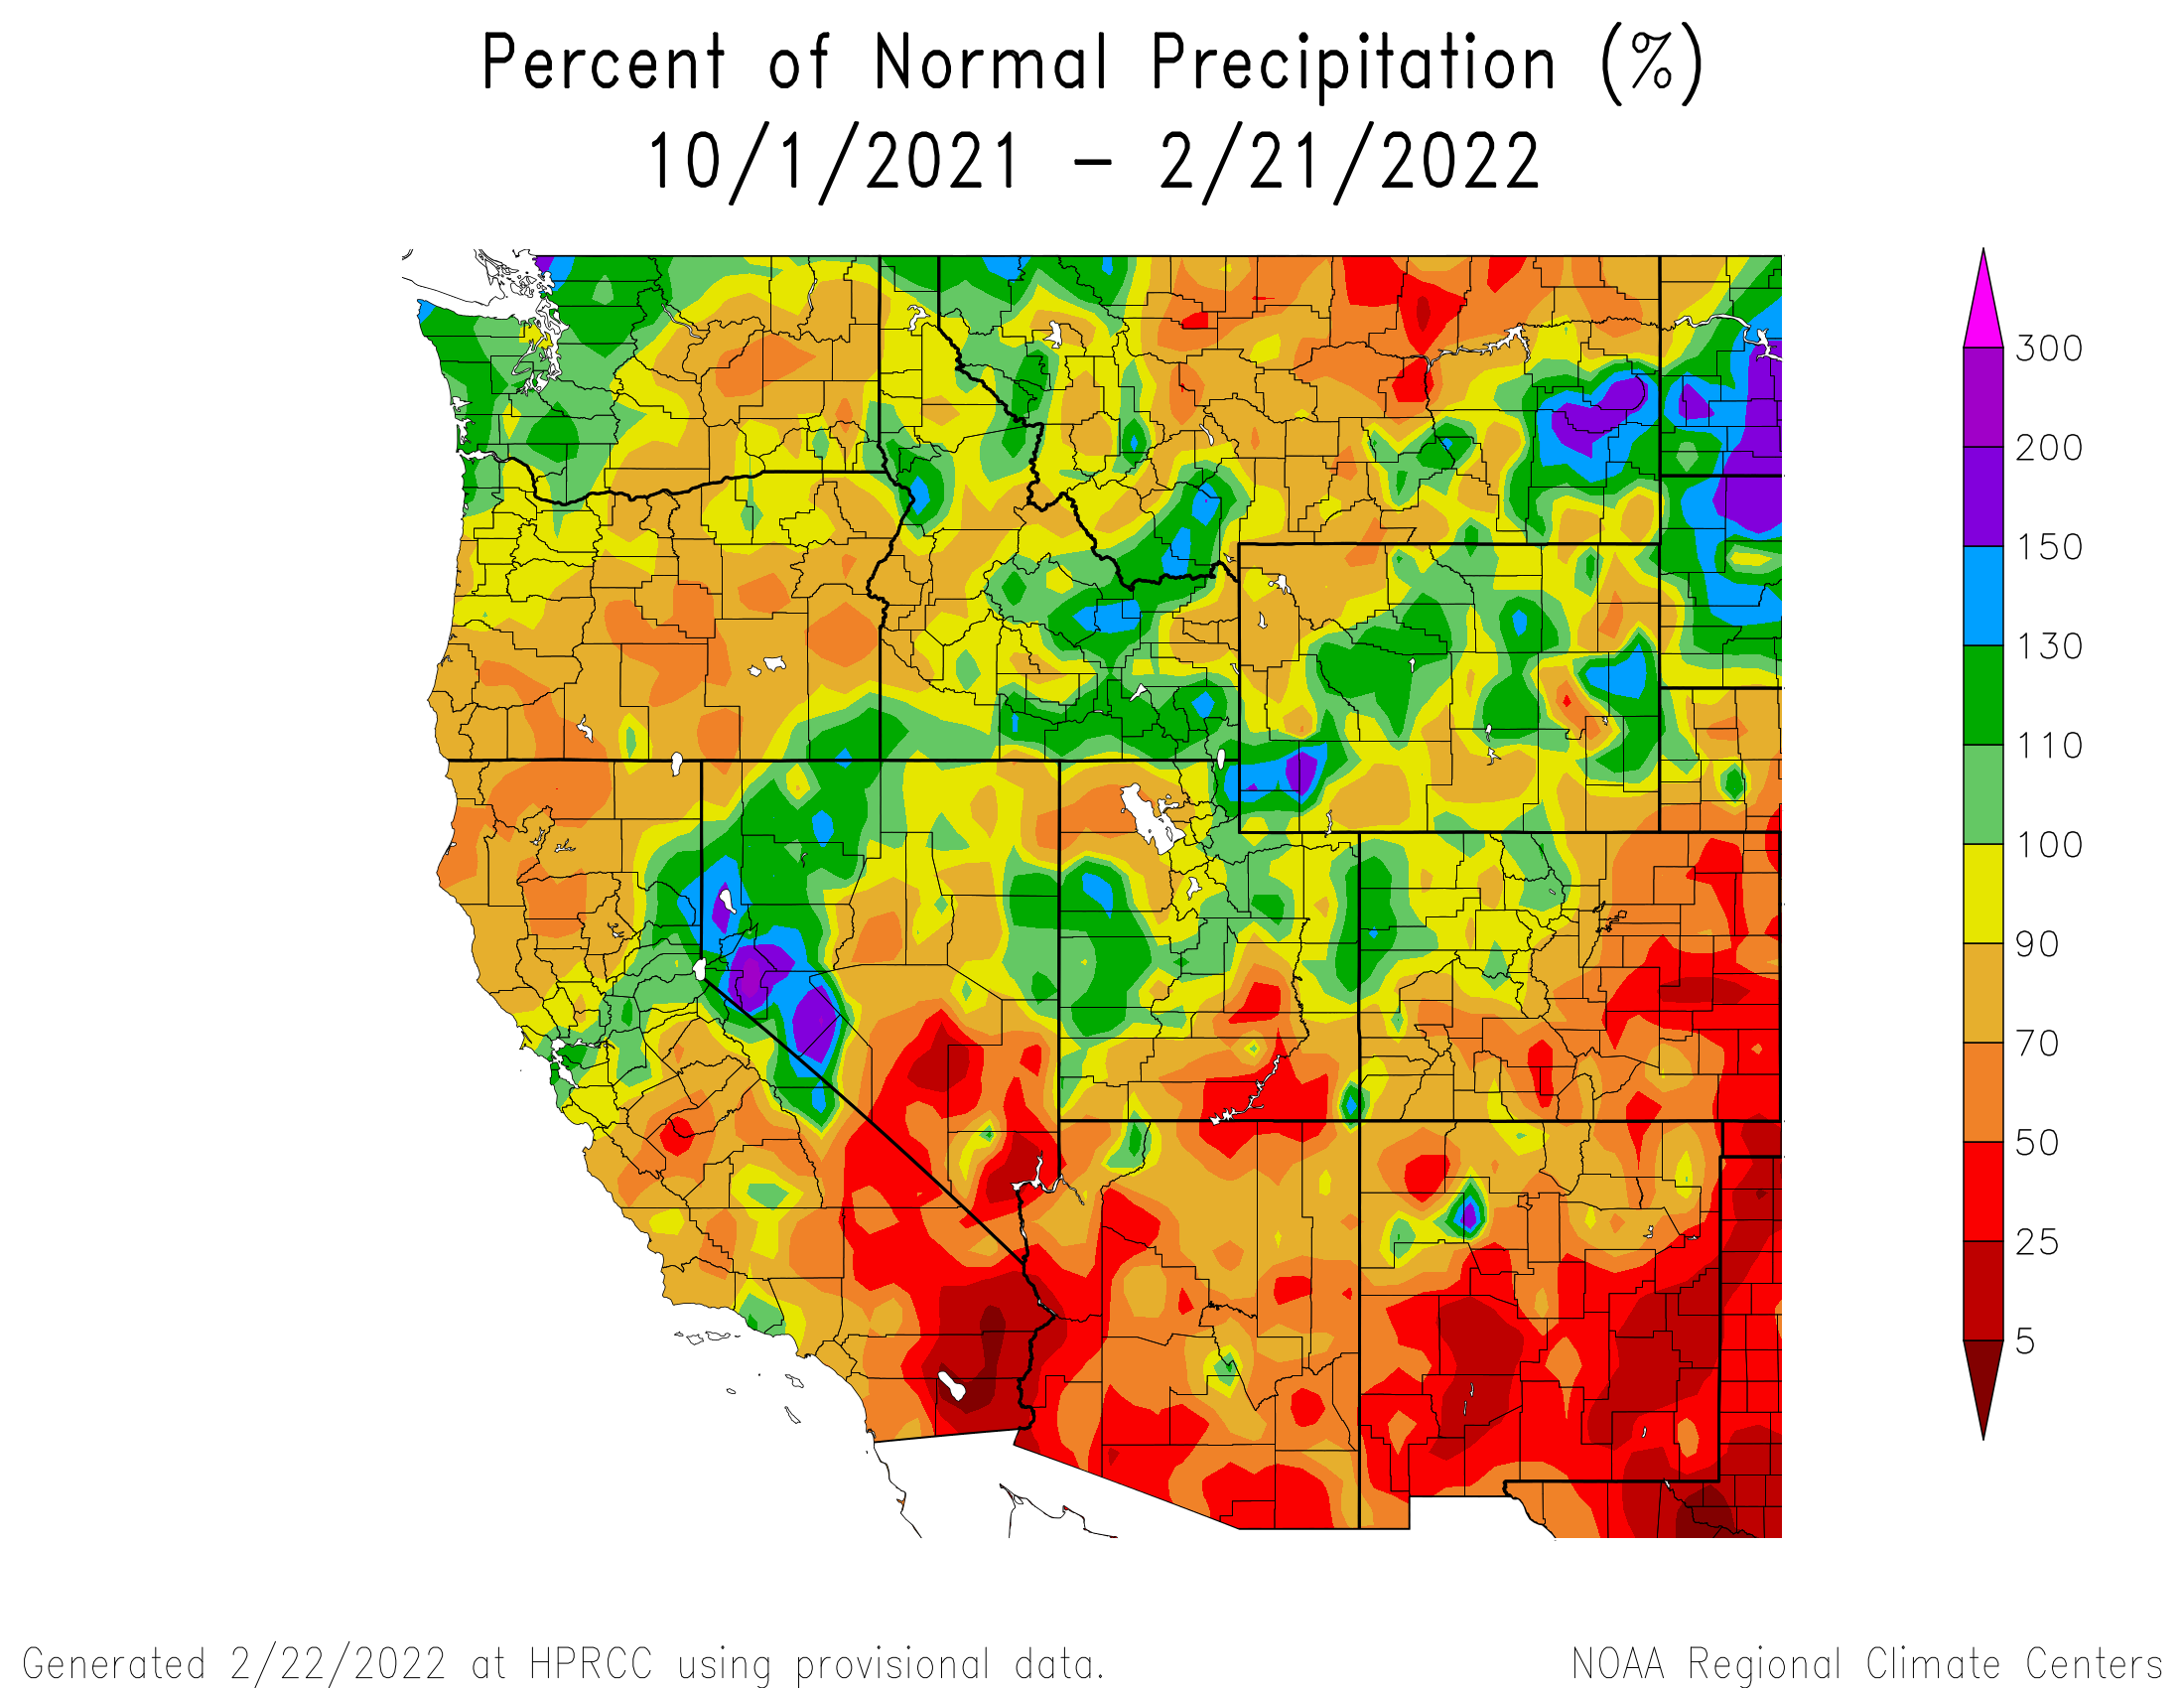
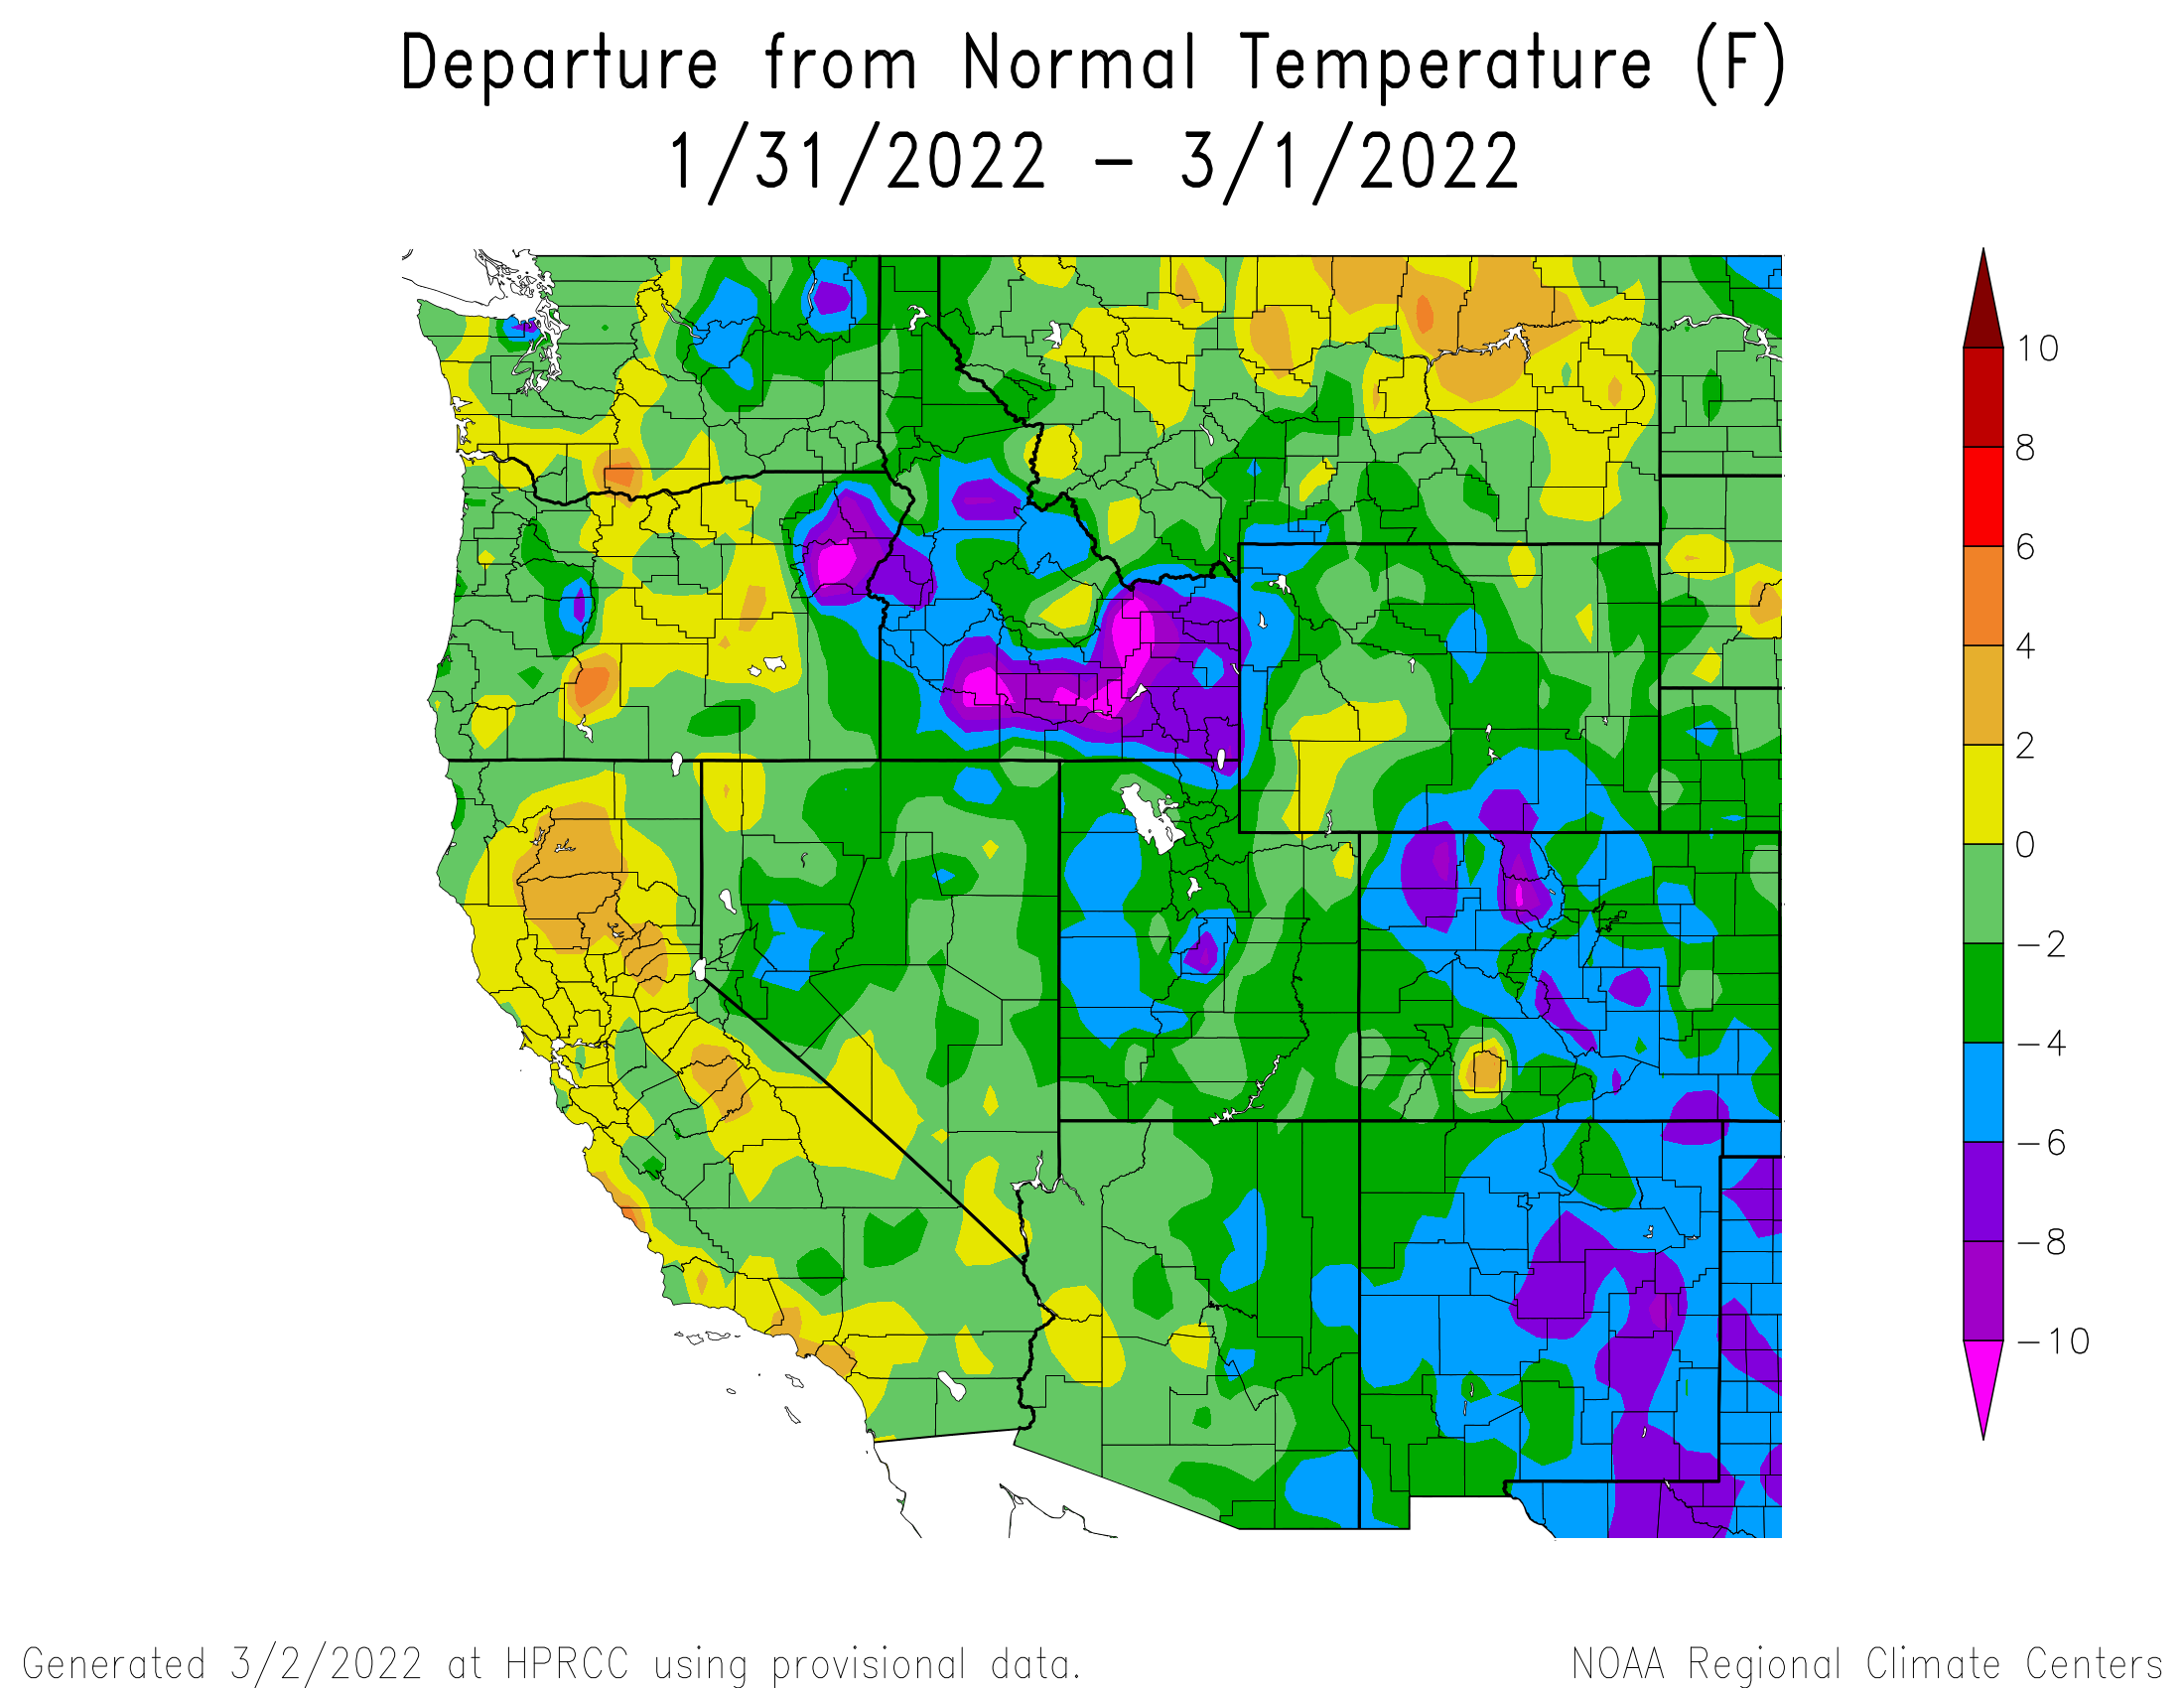
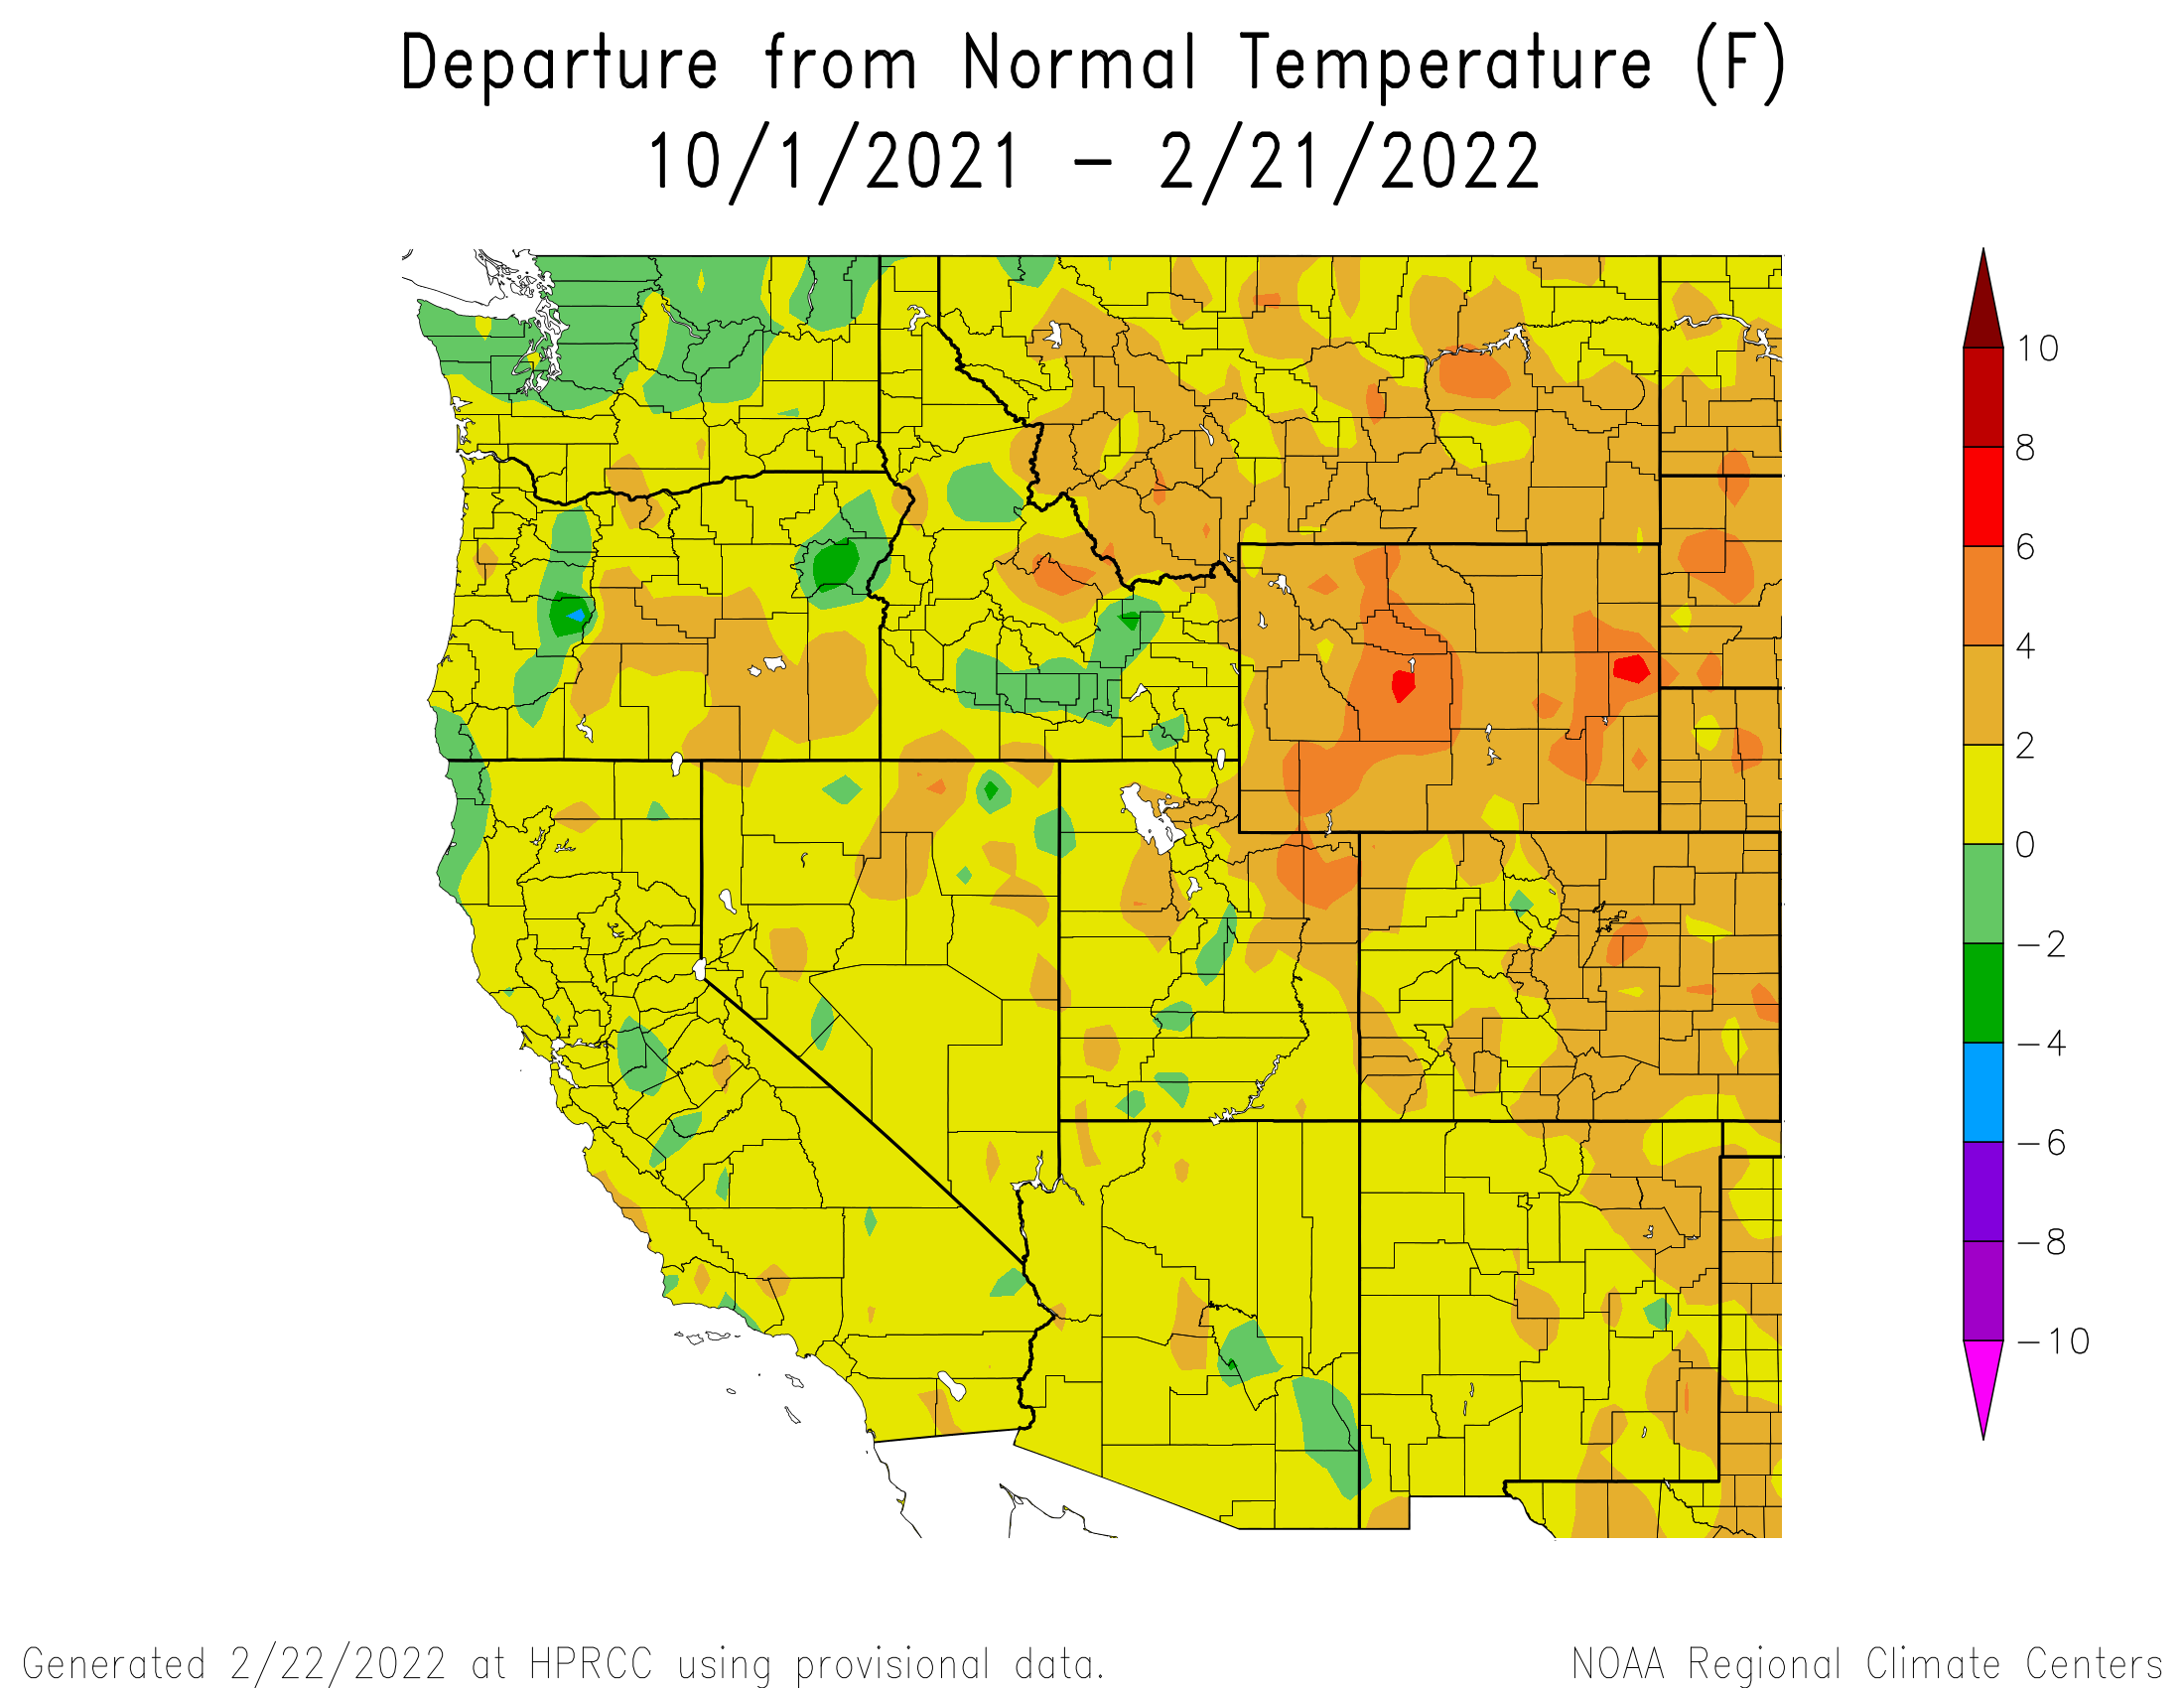
The accumulation of the snowpack this year has taken on a stair stepped appearance when looking at the SWE hydrograph. We saw large snow accumulation in December, then essentially a ~7 week dry spell, followed by a big storm that hit Feb 21-25. This stop and go process has so far kept major Colorado basins 84%-106% of average. As we head into spring snowpack conditions look similar to WY2020 and WY2021 in that the snowpack in major basins were average or within reach of average conditions (or even better), but hot/dry spring conditions, few productive spring storms, significant dust-on-snow conditions, and thirsty soils all played a part in depleting the snowpack or robbing water that would otherwise go towards streamflow. And the forecast for spring WY2022 is once again drier than average, soils are still considerably dry, and we have significant dust in the snowpack as of March 1.
A Brief Monthly Summary
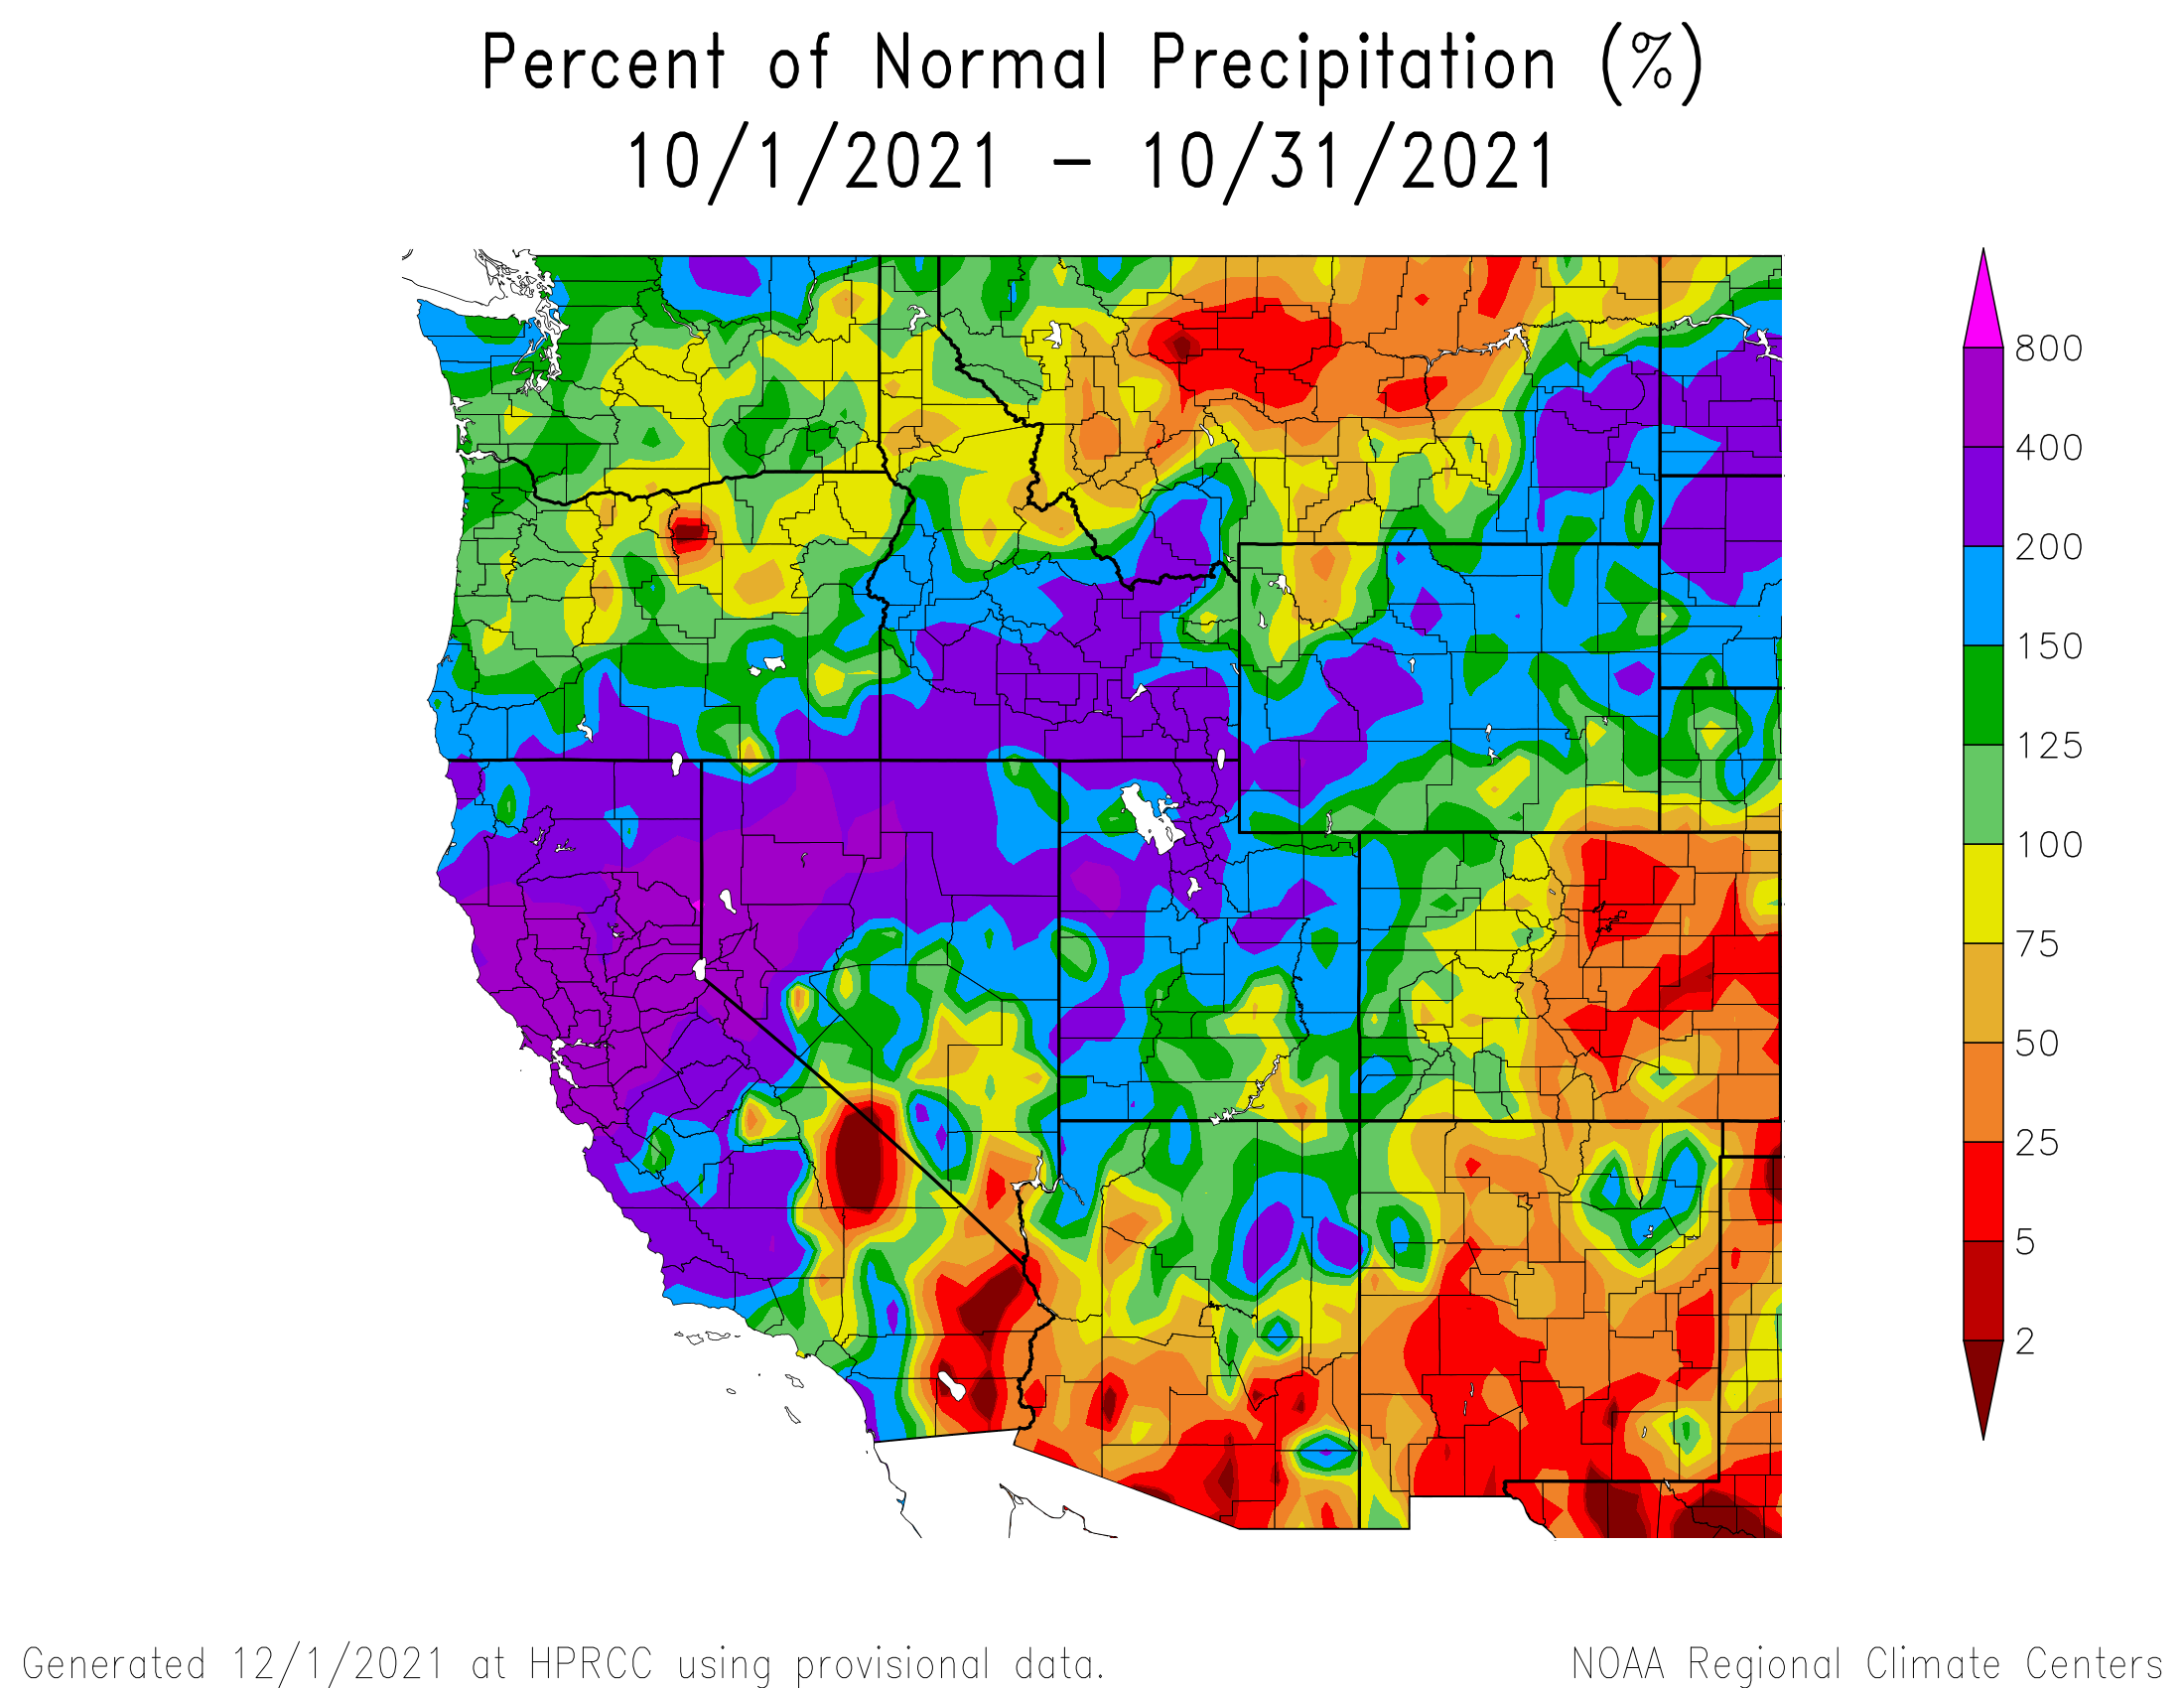
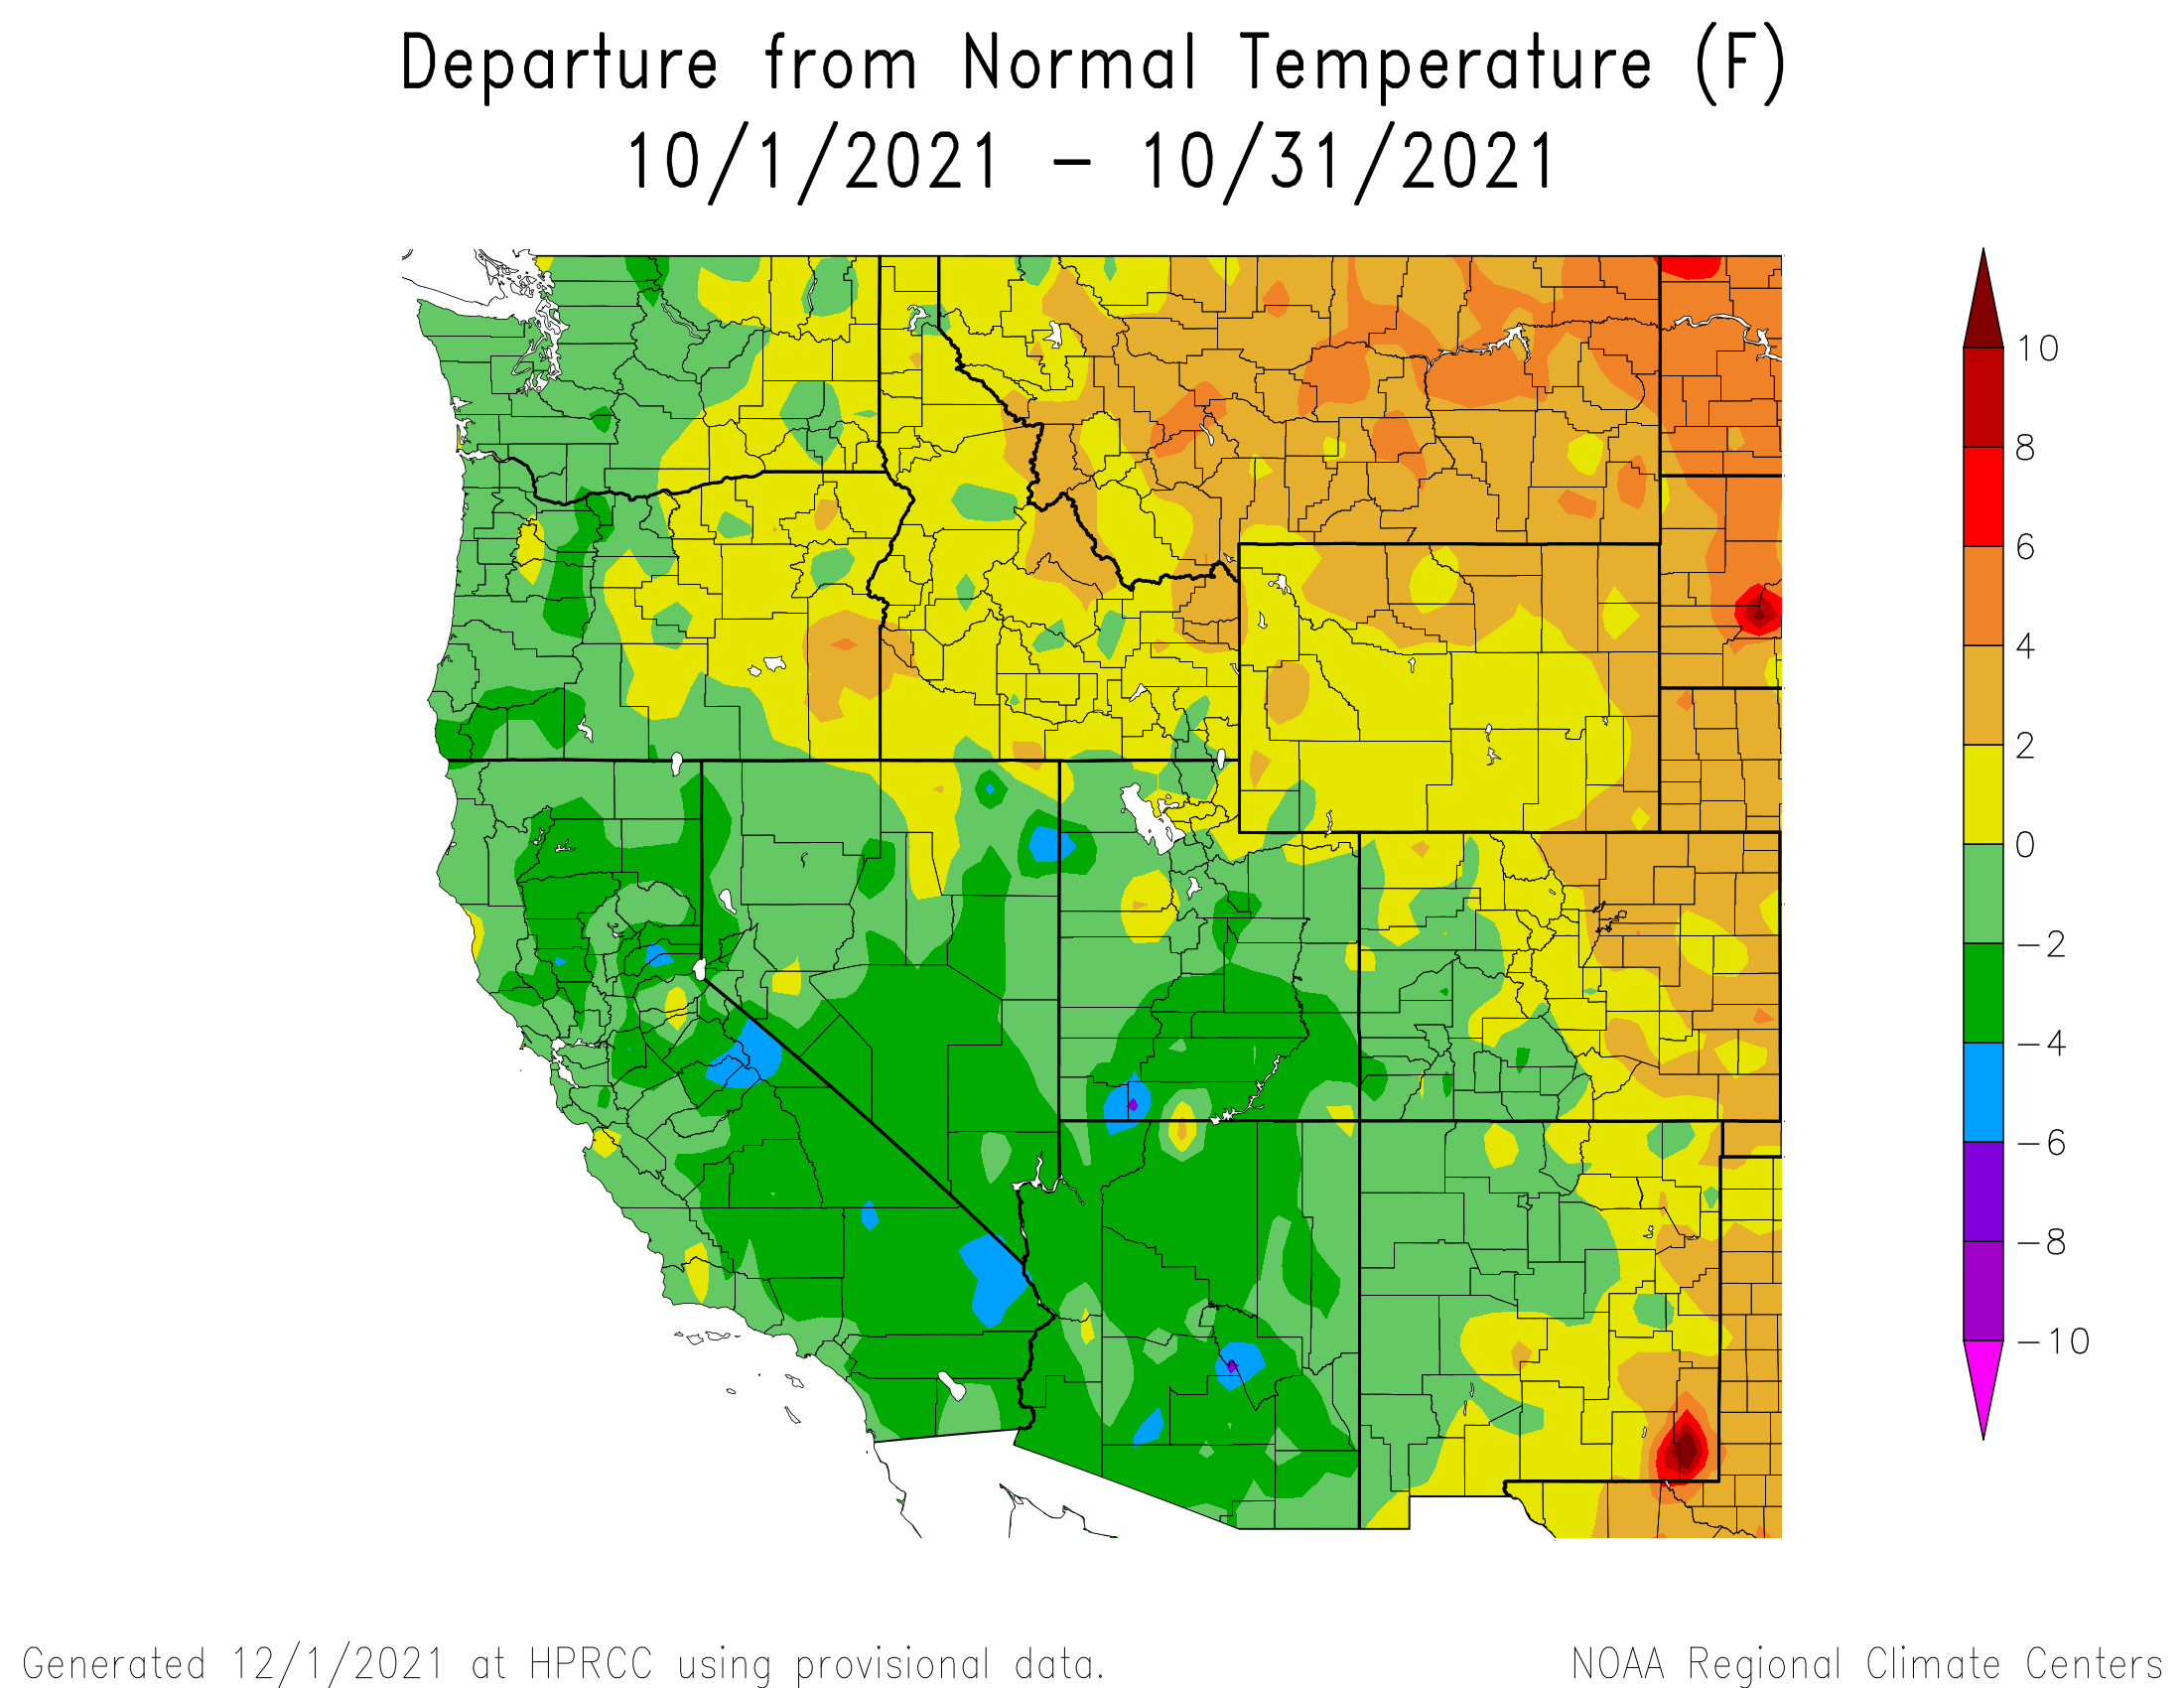
October 2021: At SASP we experienced 13 days with recorded precipitation. The first few days of October, while the USGS snow station was being installed, a wet snow storm hit the high country for a couple days, but this snow largely ablated. On October 12 the San Juan’s saw a big snow storm that made one think it was mid-winter. It made a mess for drivers on Red Mountain Pass and even a bigger problem for Wolf Creek Pass. It was this storm that initiated the snow cover that would mark the beginning of winter in the high country. Another nice storm delivered a bit over an inch of water on October 26. As a whole the western third of Colorado was near normal precipitation and slightly cooler for the month, but hot and very dry for the eastern half of the state.
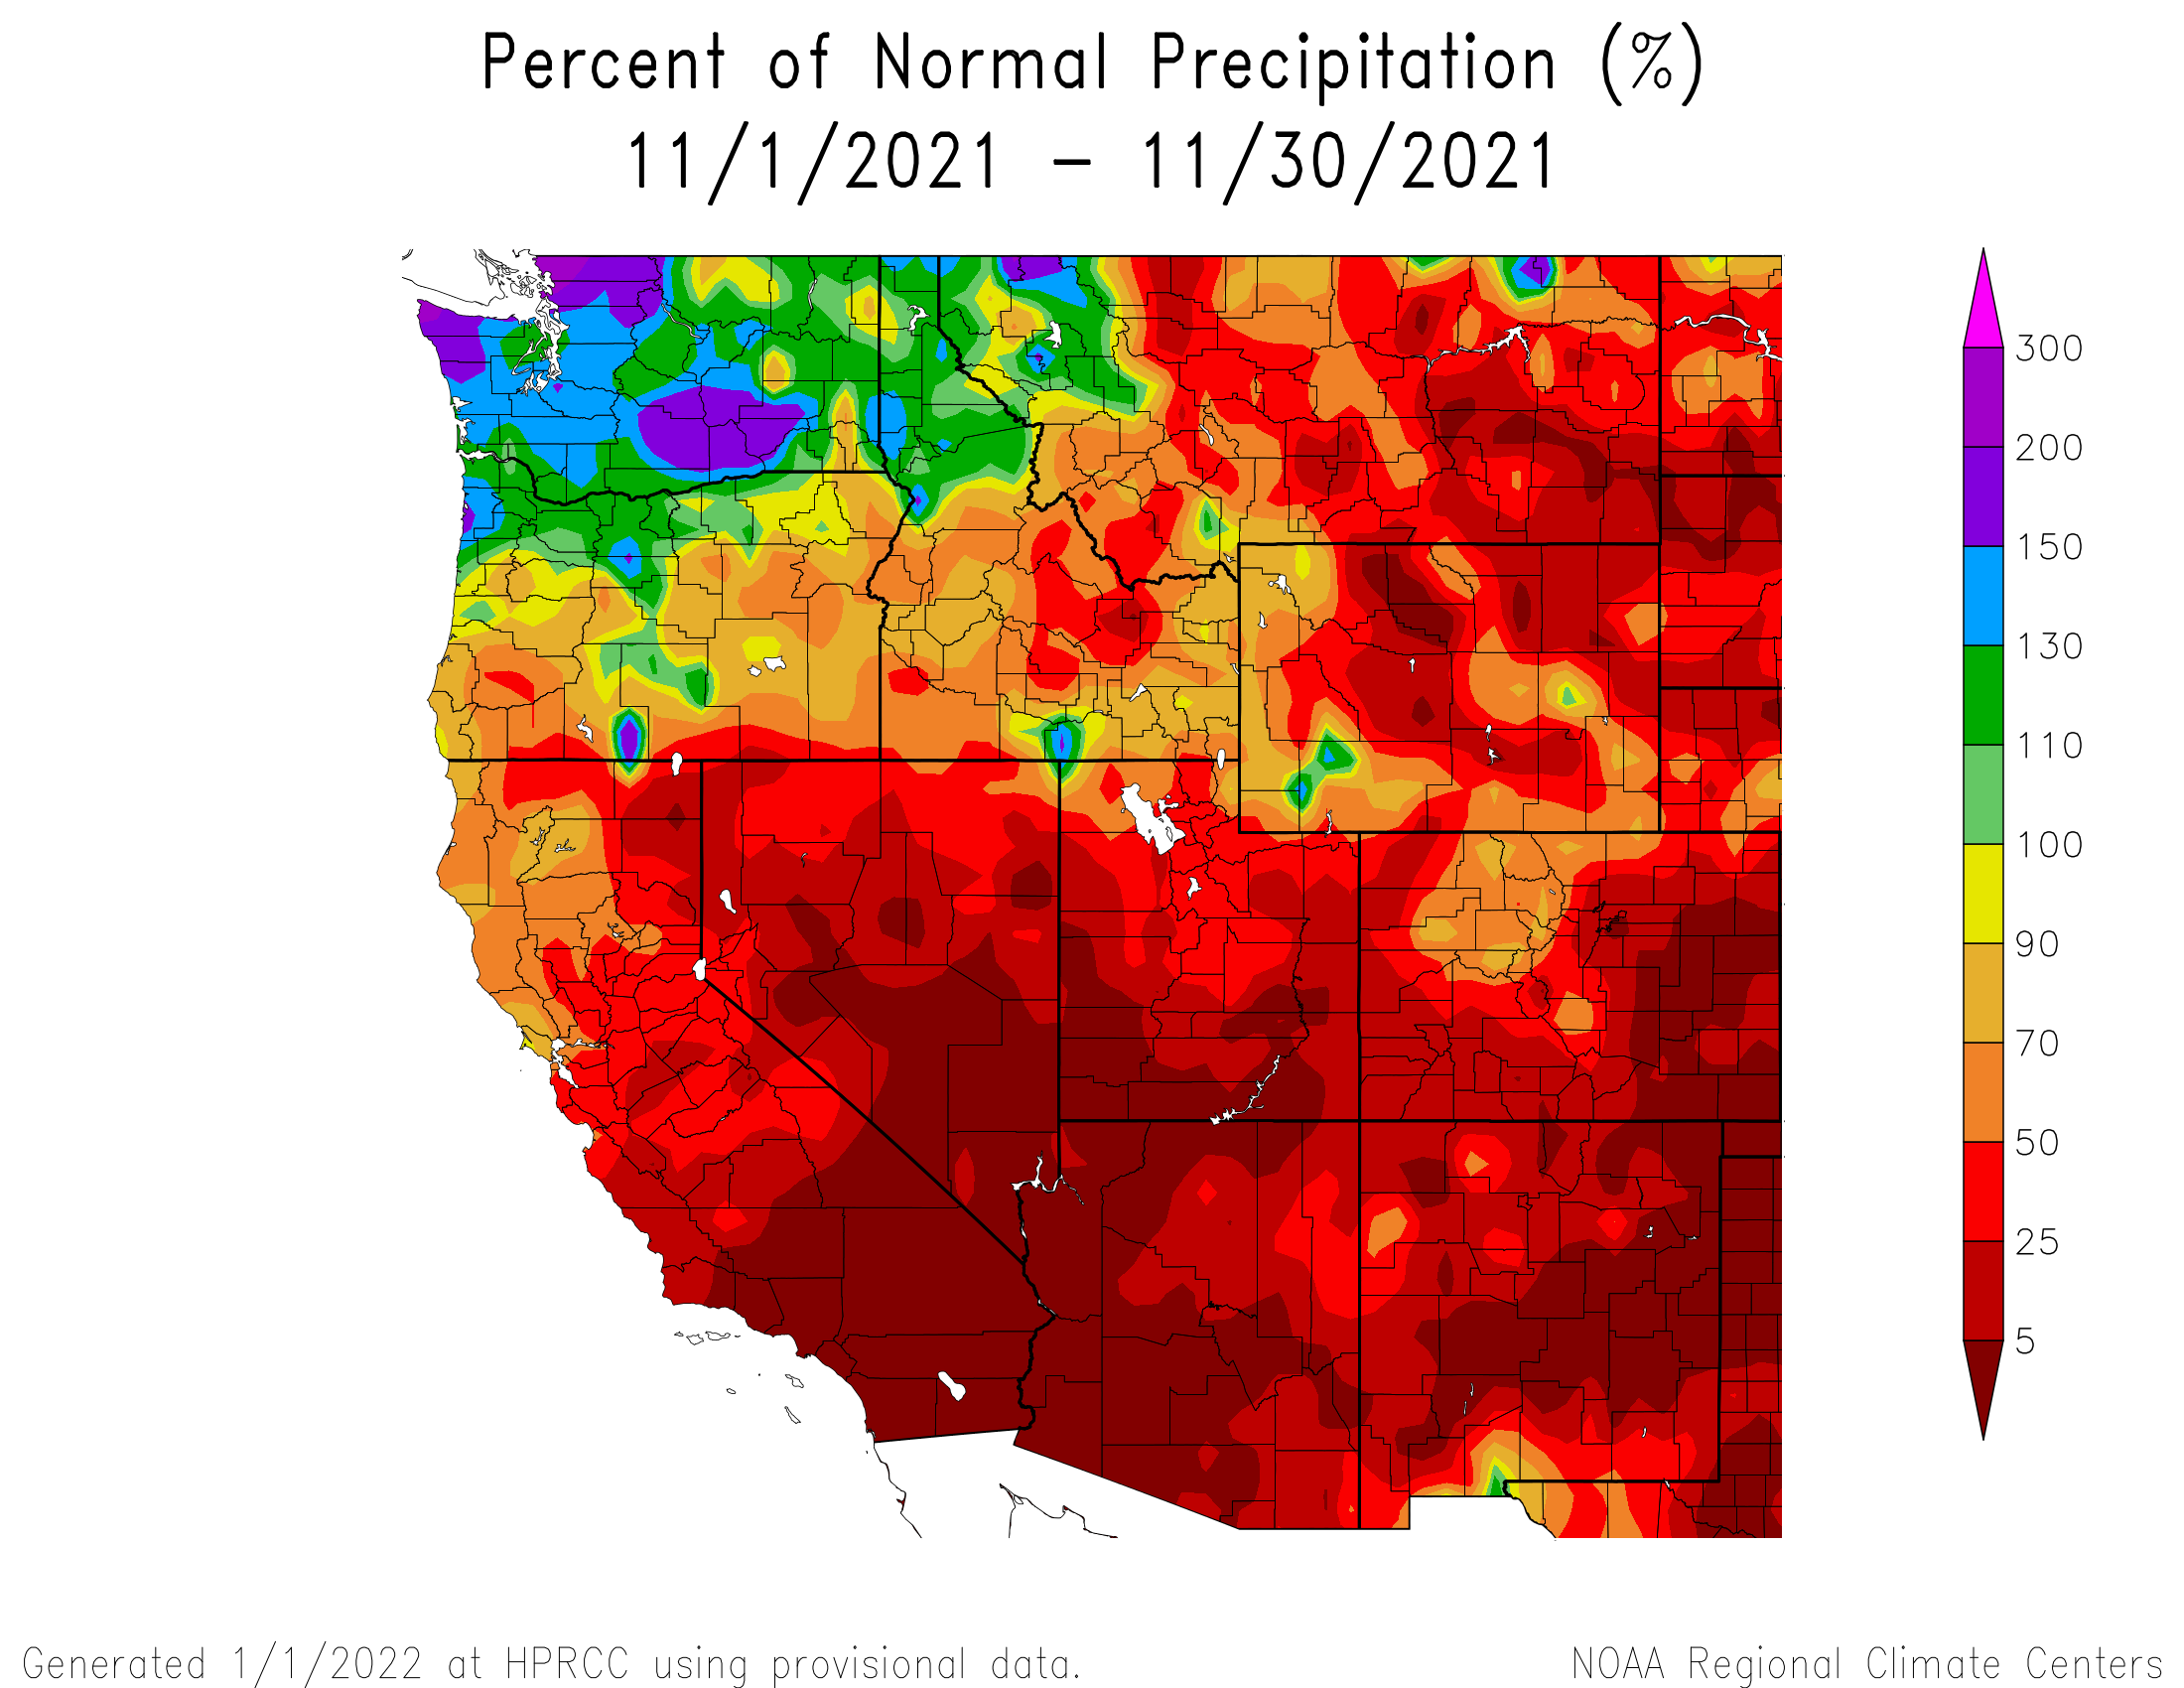
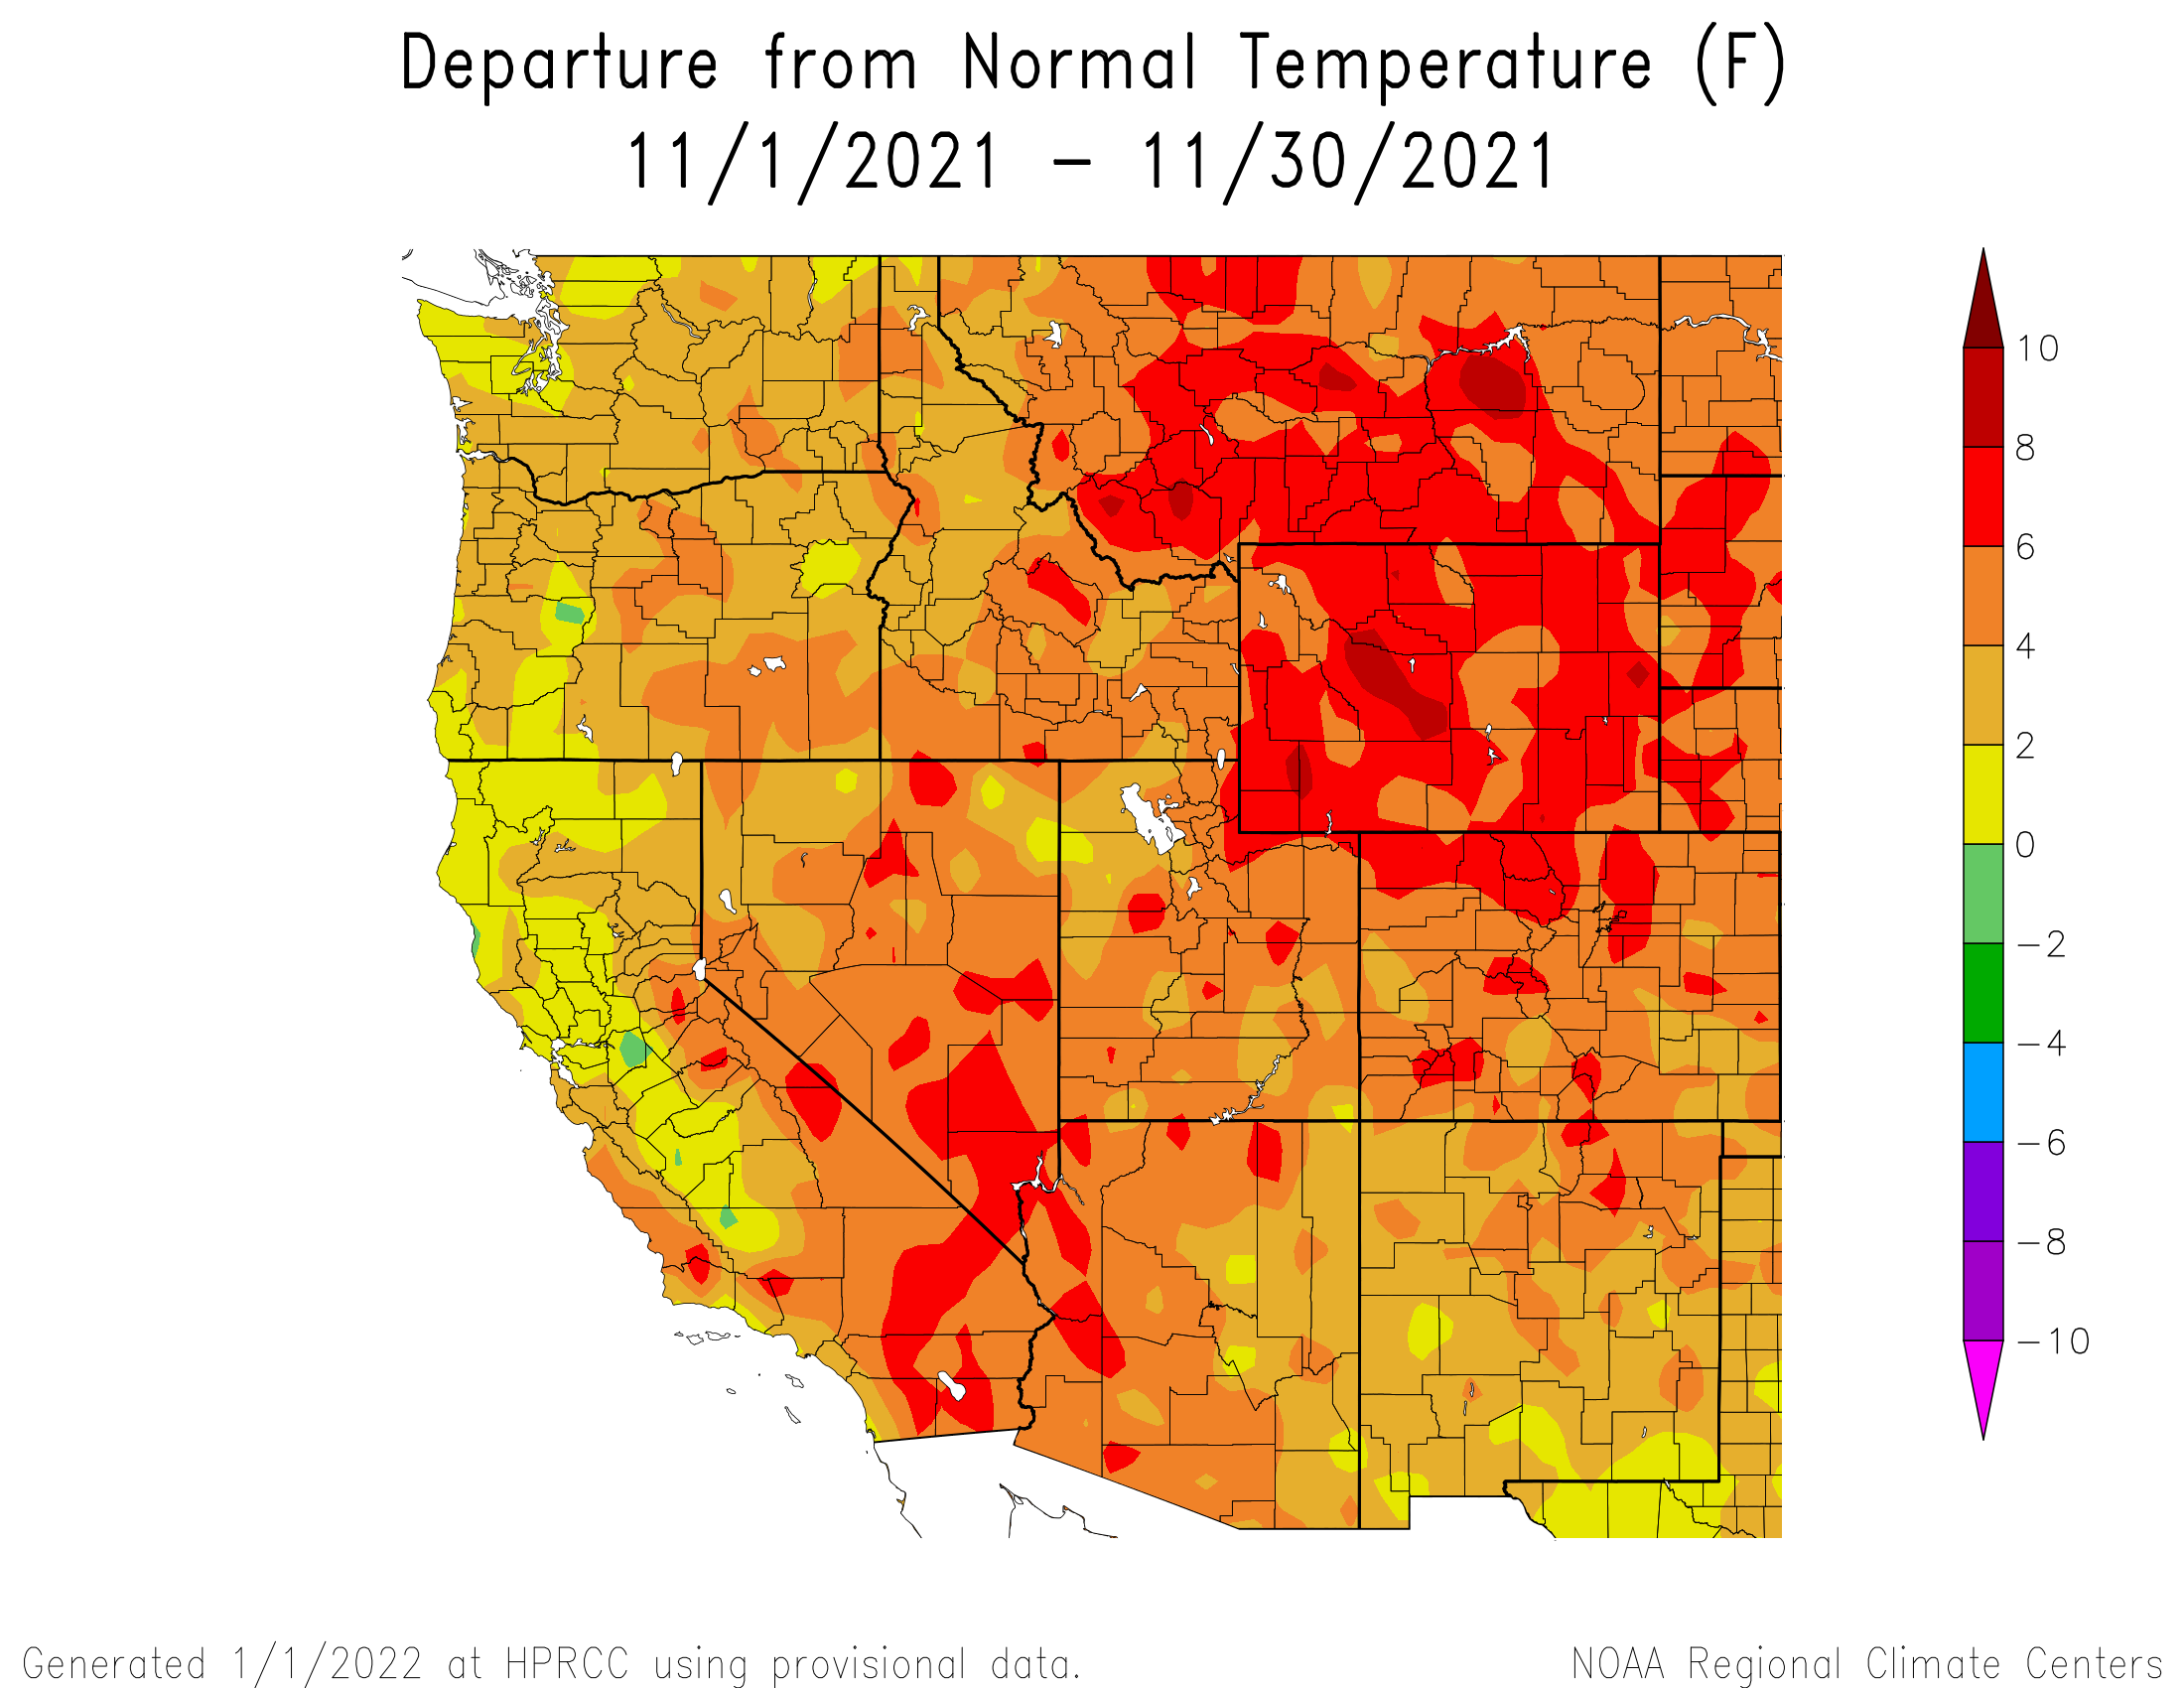
November 2021: November was hot and very dry throughout the state. The one notable precipitation event was on November 10 that delivered 0.5” of water. Snow cover diminished throughout the long and hot month making it difficult to travel in the backcountry as it was not enough snow to ski but enough snow to prevent hiking.
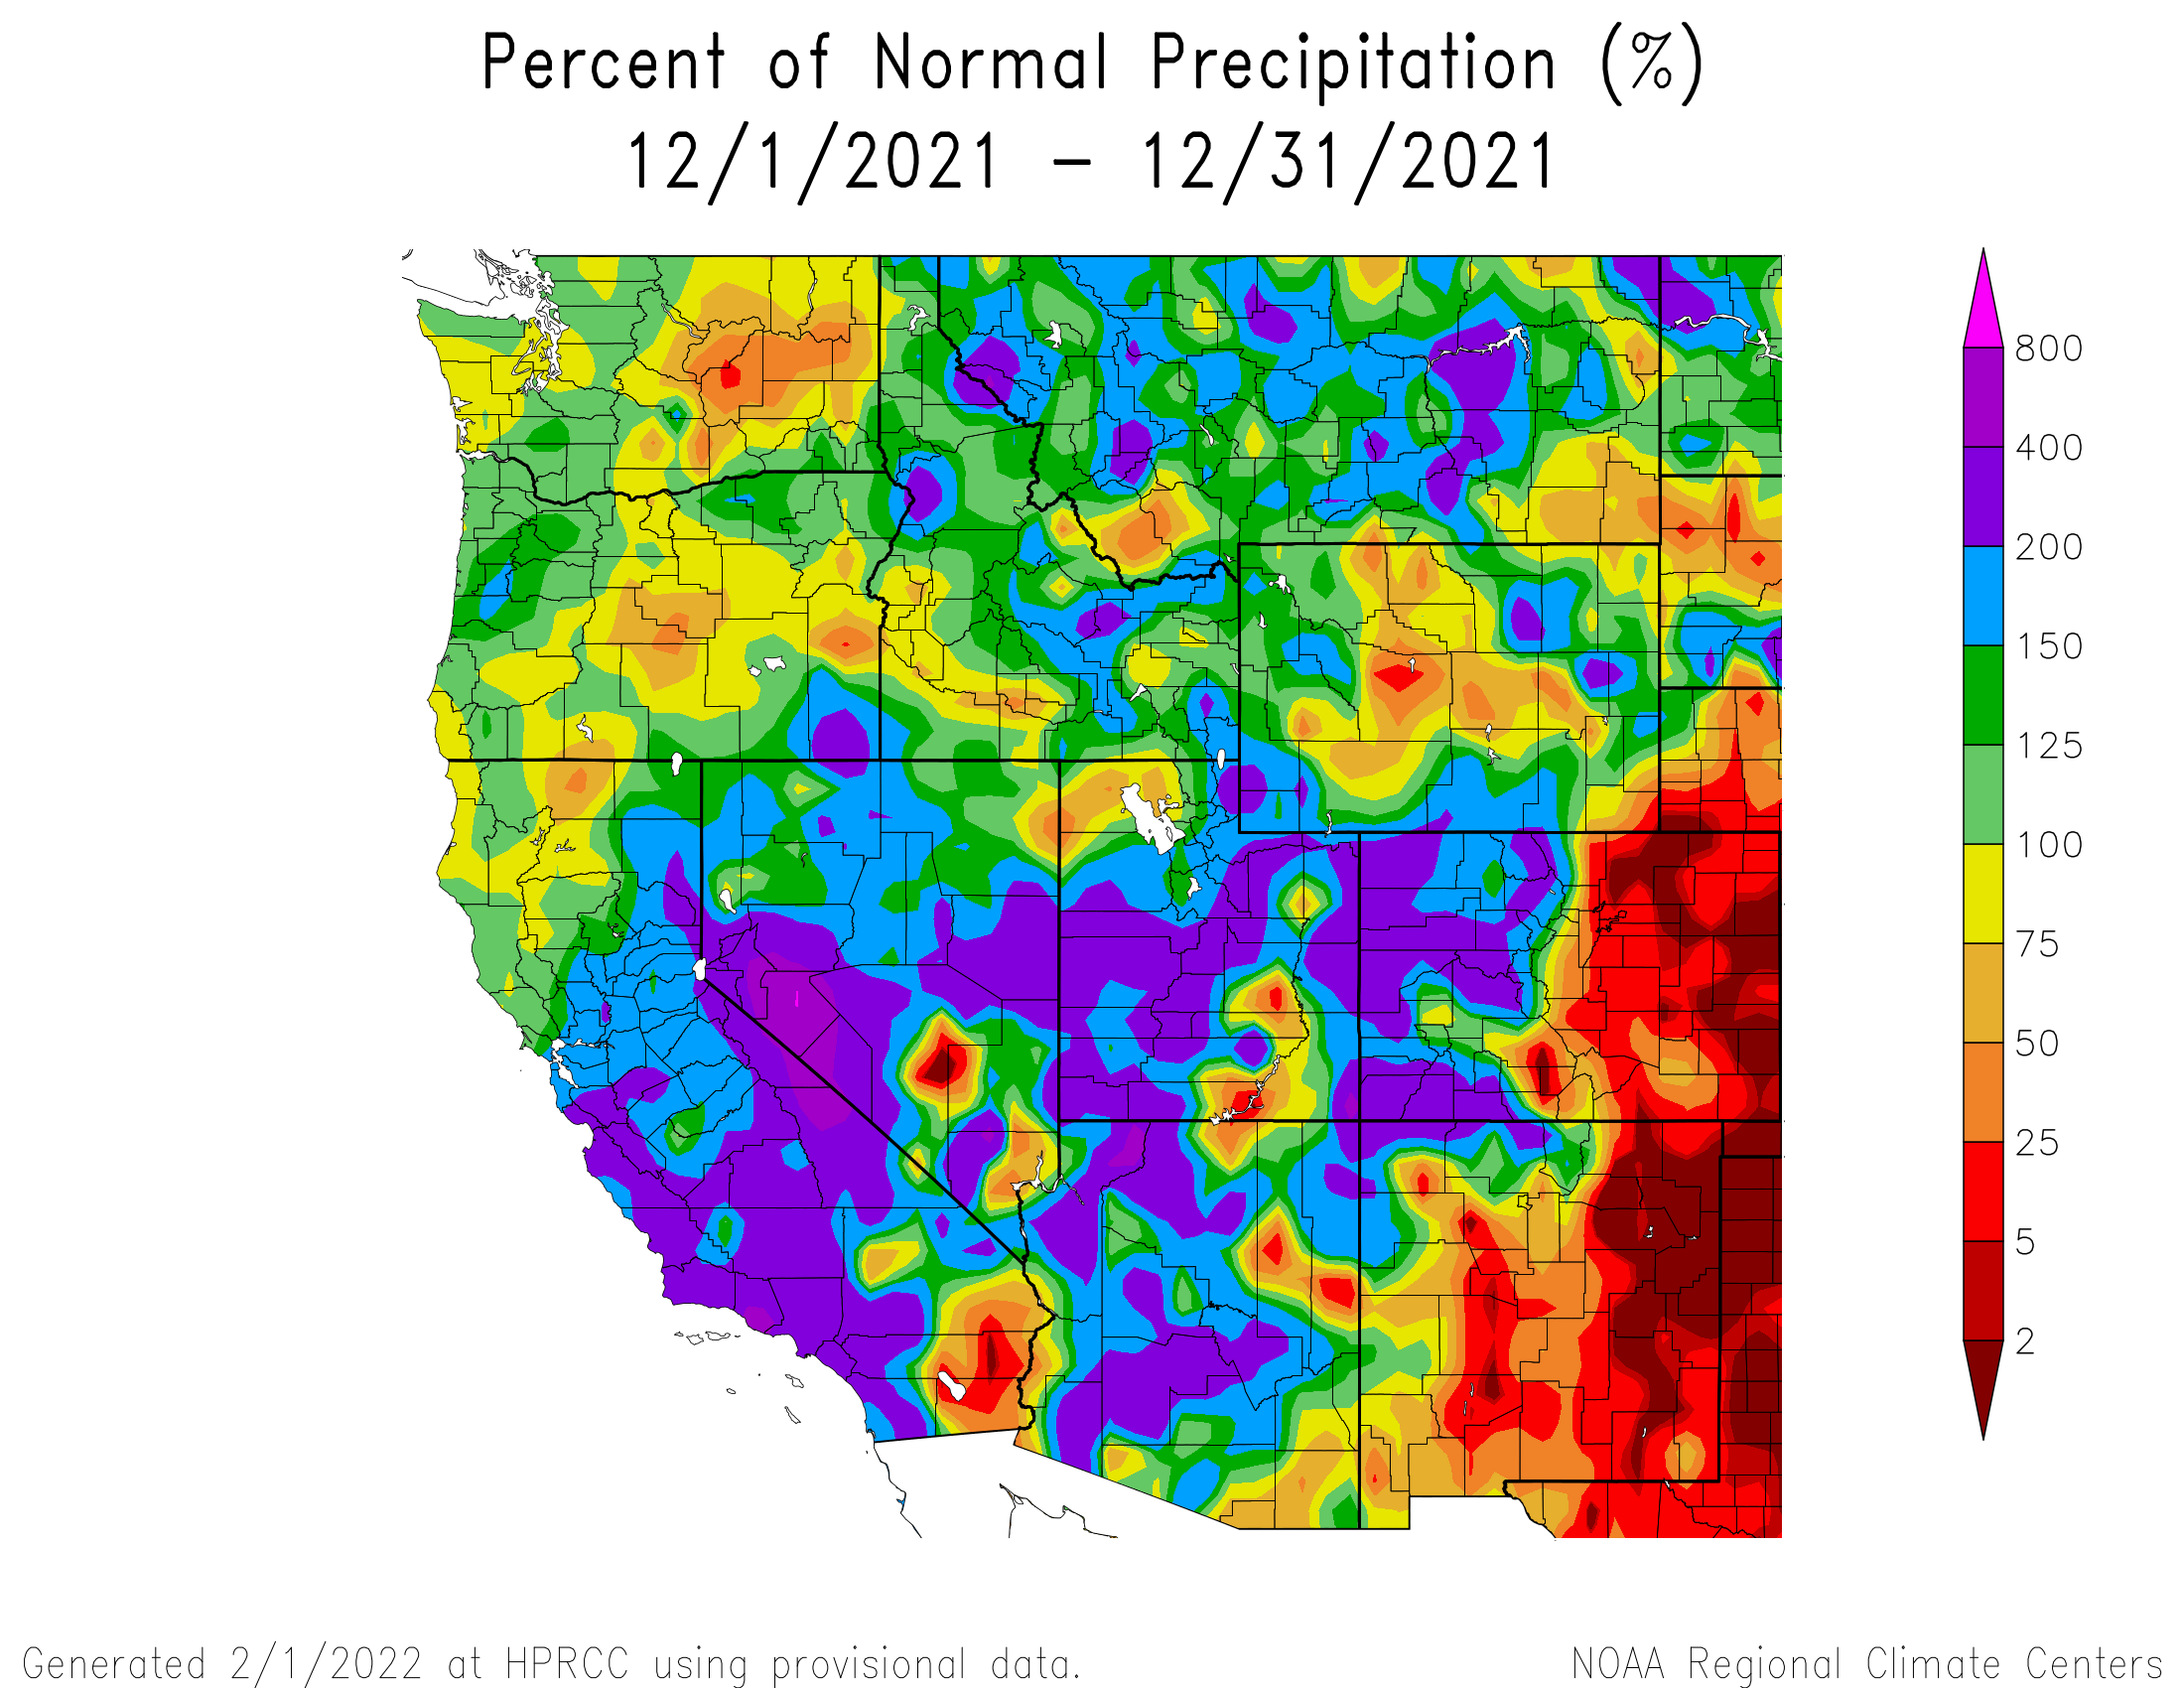
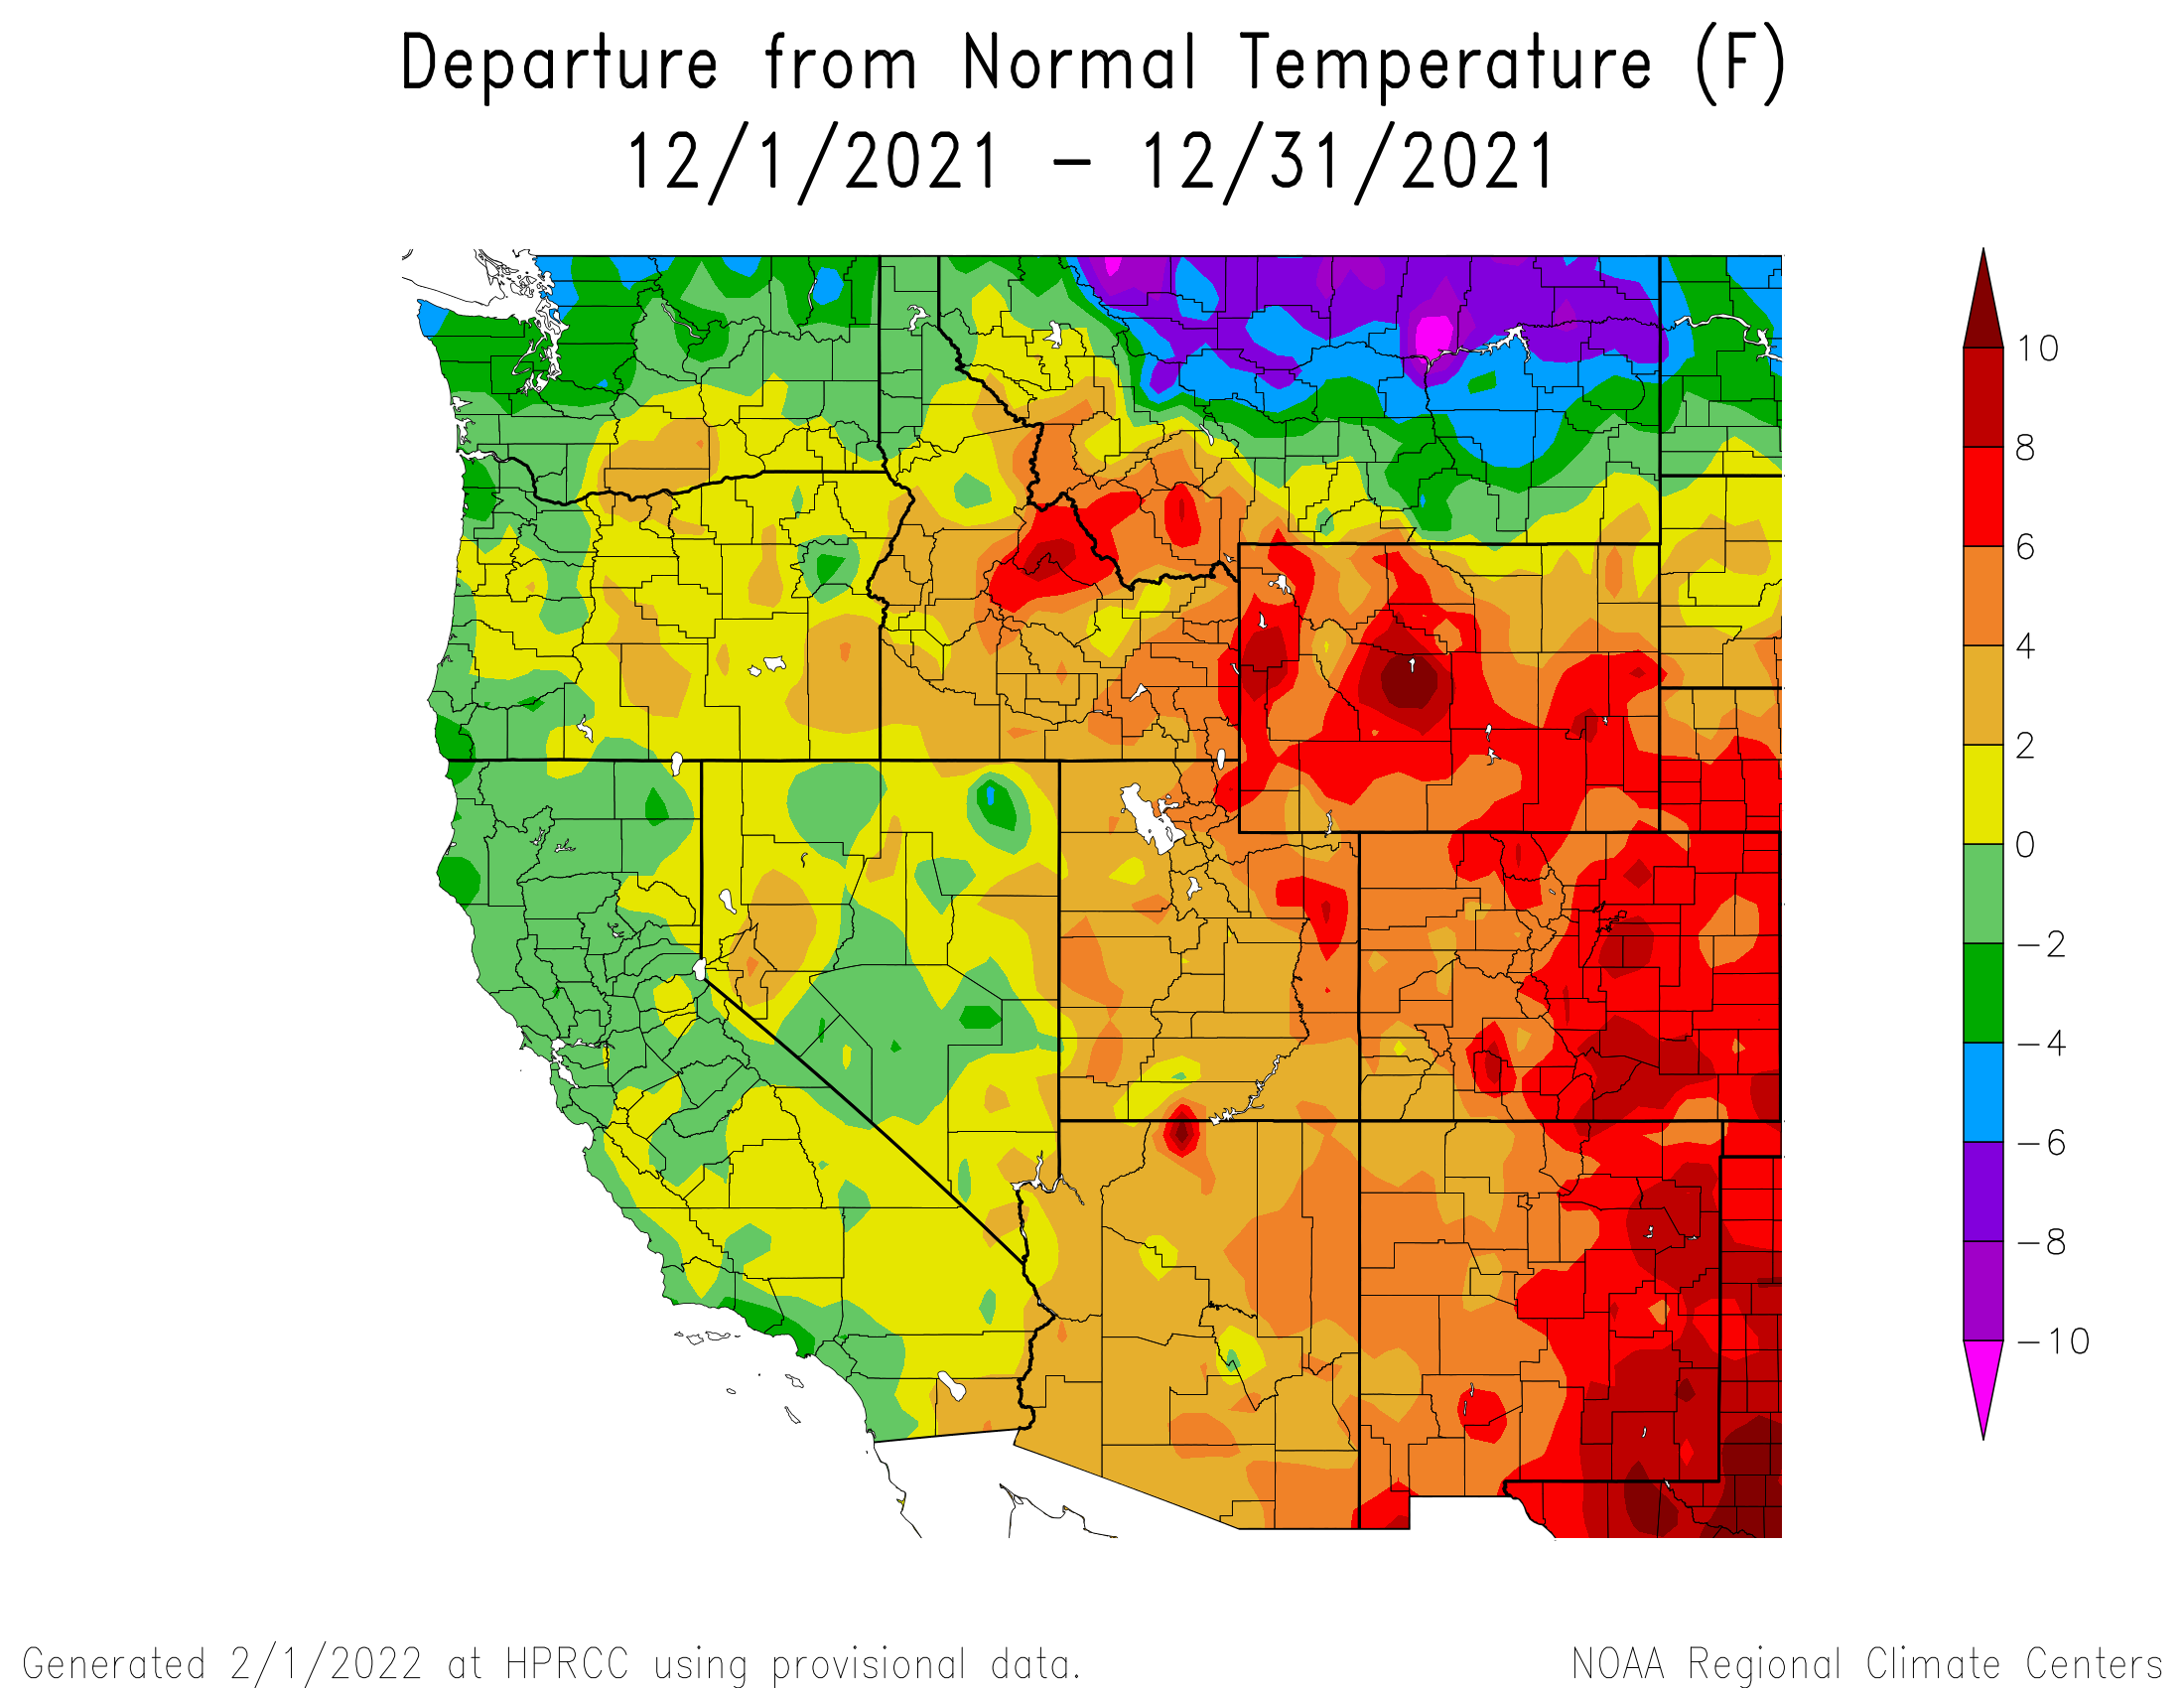
December 2021: The eastern half of Colorado was again very hot and very dry. Fortunately at least, western Colorado was very wet, 200%-300% of normal for many locales. In December we issued 5 storm reports, defined as at least 0.5” of water is received with no break in precip longer than 12 hours. The first two storms occurred Dec. 6-11 that delivered 2.7” of water as 1.6’ of snow. This really jump started the snowpack particularly at mid and lower elevations. The next storm, Dec 14-16, brought 70-107 mph winds at our Putney station and dust was kicked up in Southeast Colorado and swept into Kansas, Nebraska, Minnesota and Great Lakes. Storm #4 from Dec 23-26 brought dust to parts of the Southwest San Juan Mt snowpack, but as of right now we have not observed it farther north, such Hoosier Pass and Berthoud Pass. It is very likely in the Rio Grande snowpack. Storm #5, Dec. 28-Jan. 1, ended the very productive cycle that initiated Dec. 6, and cumulatively, left the snowpack at upwards of 150% of median levels. Which was wonderful because for the next 7 weeks Colorado sat under a high pressure ridge and the snowpack flat lined.
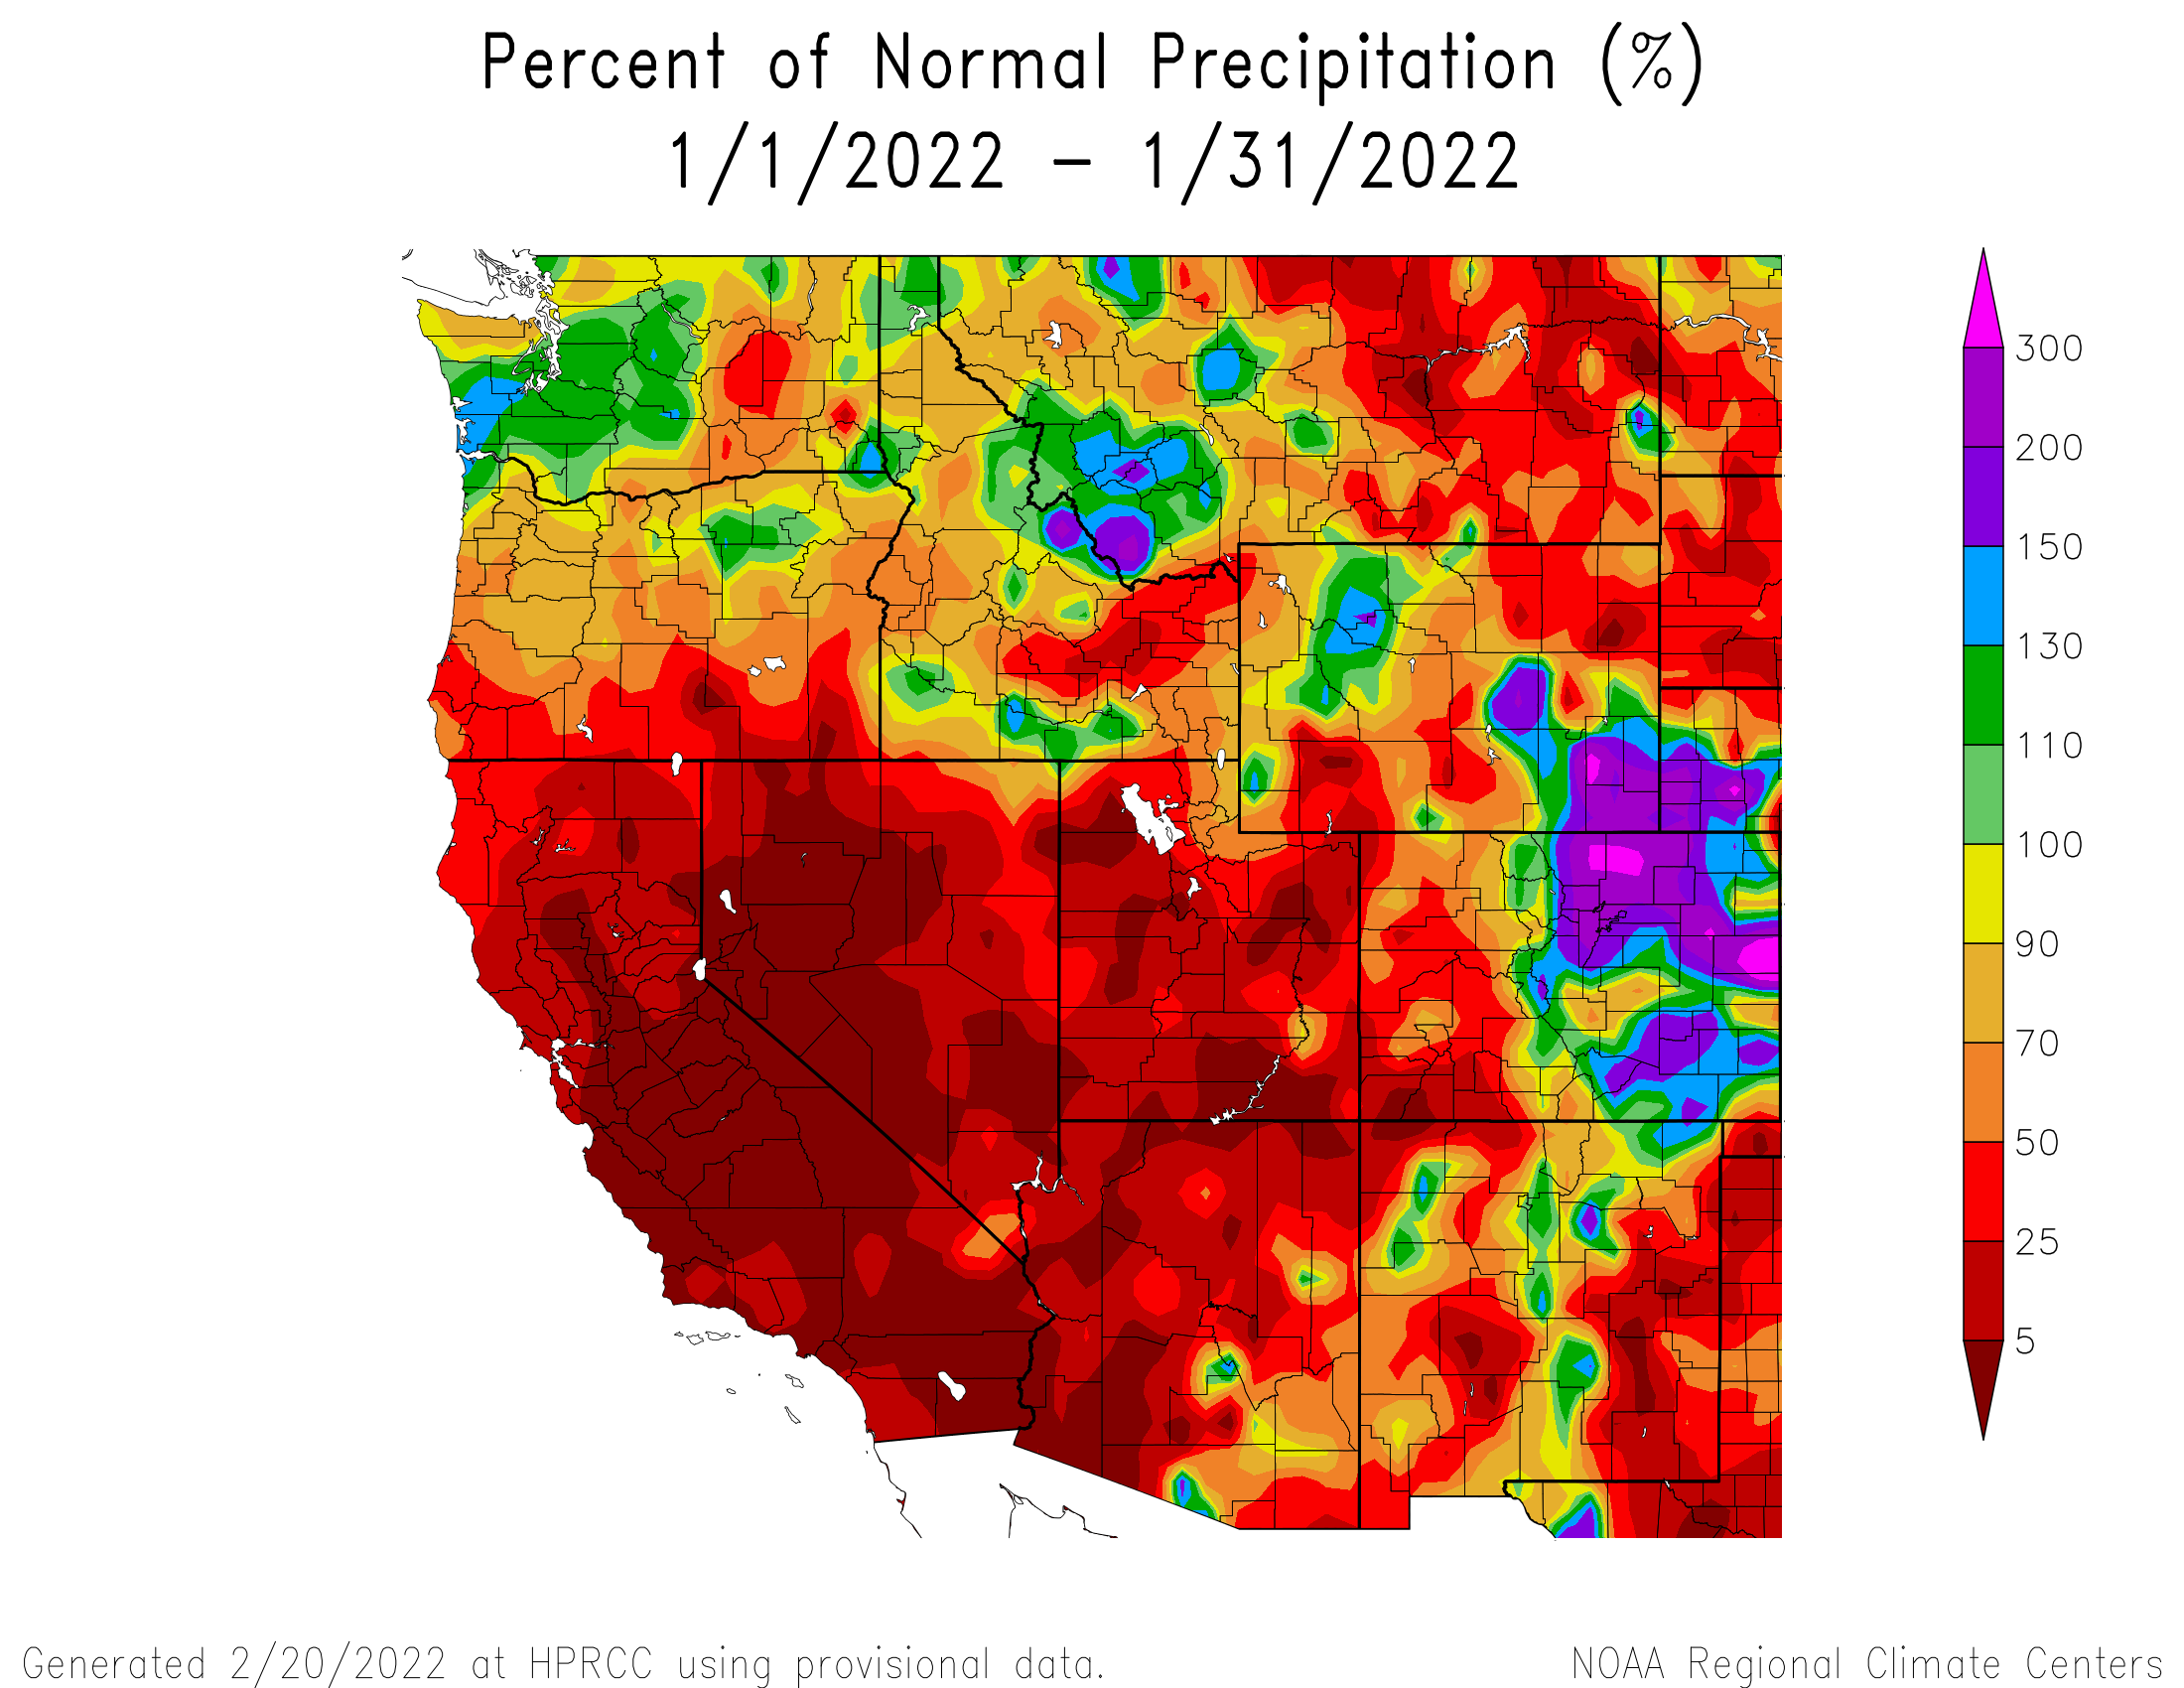
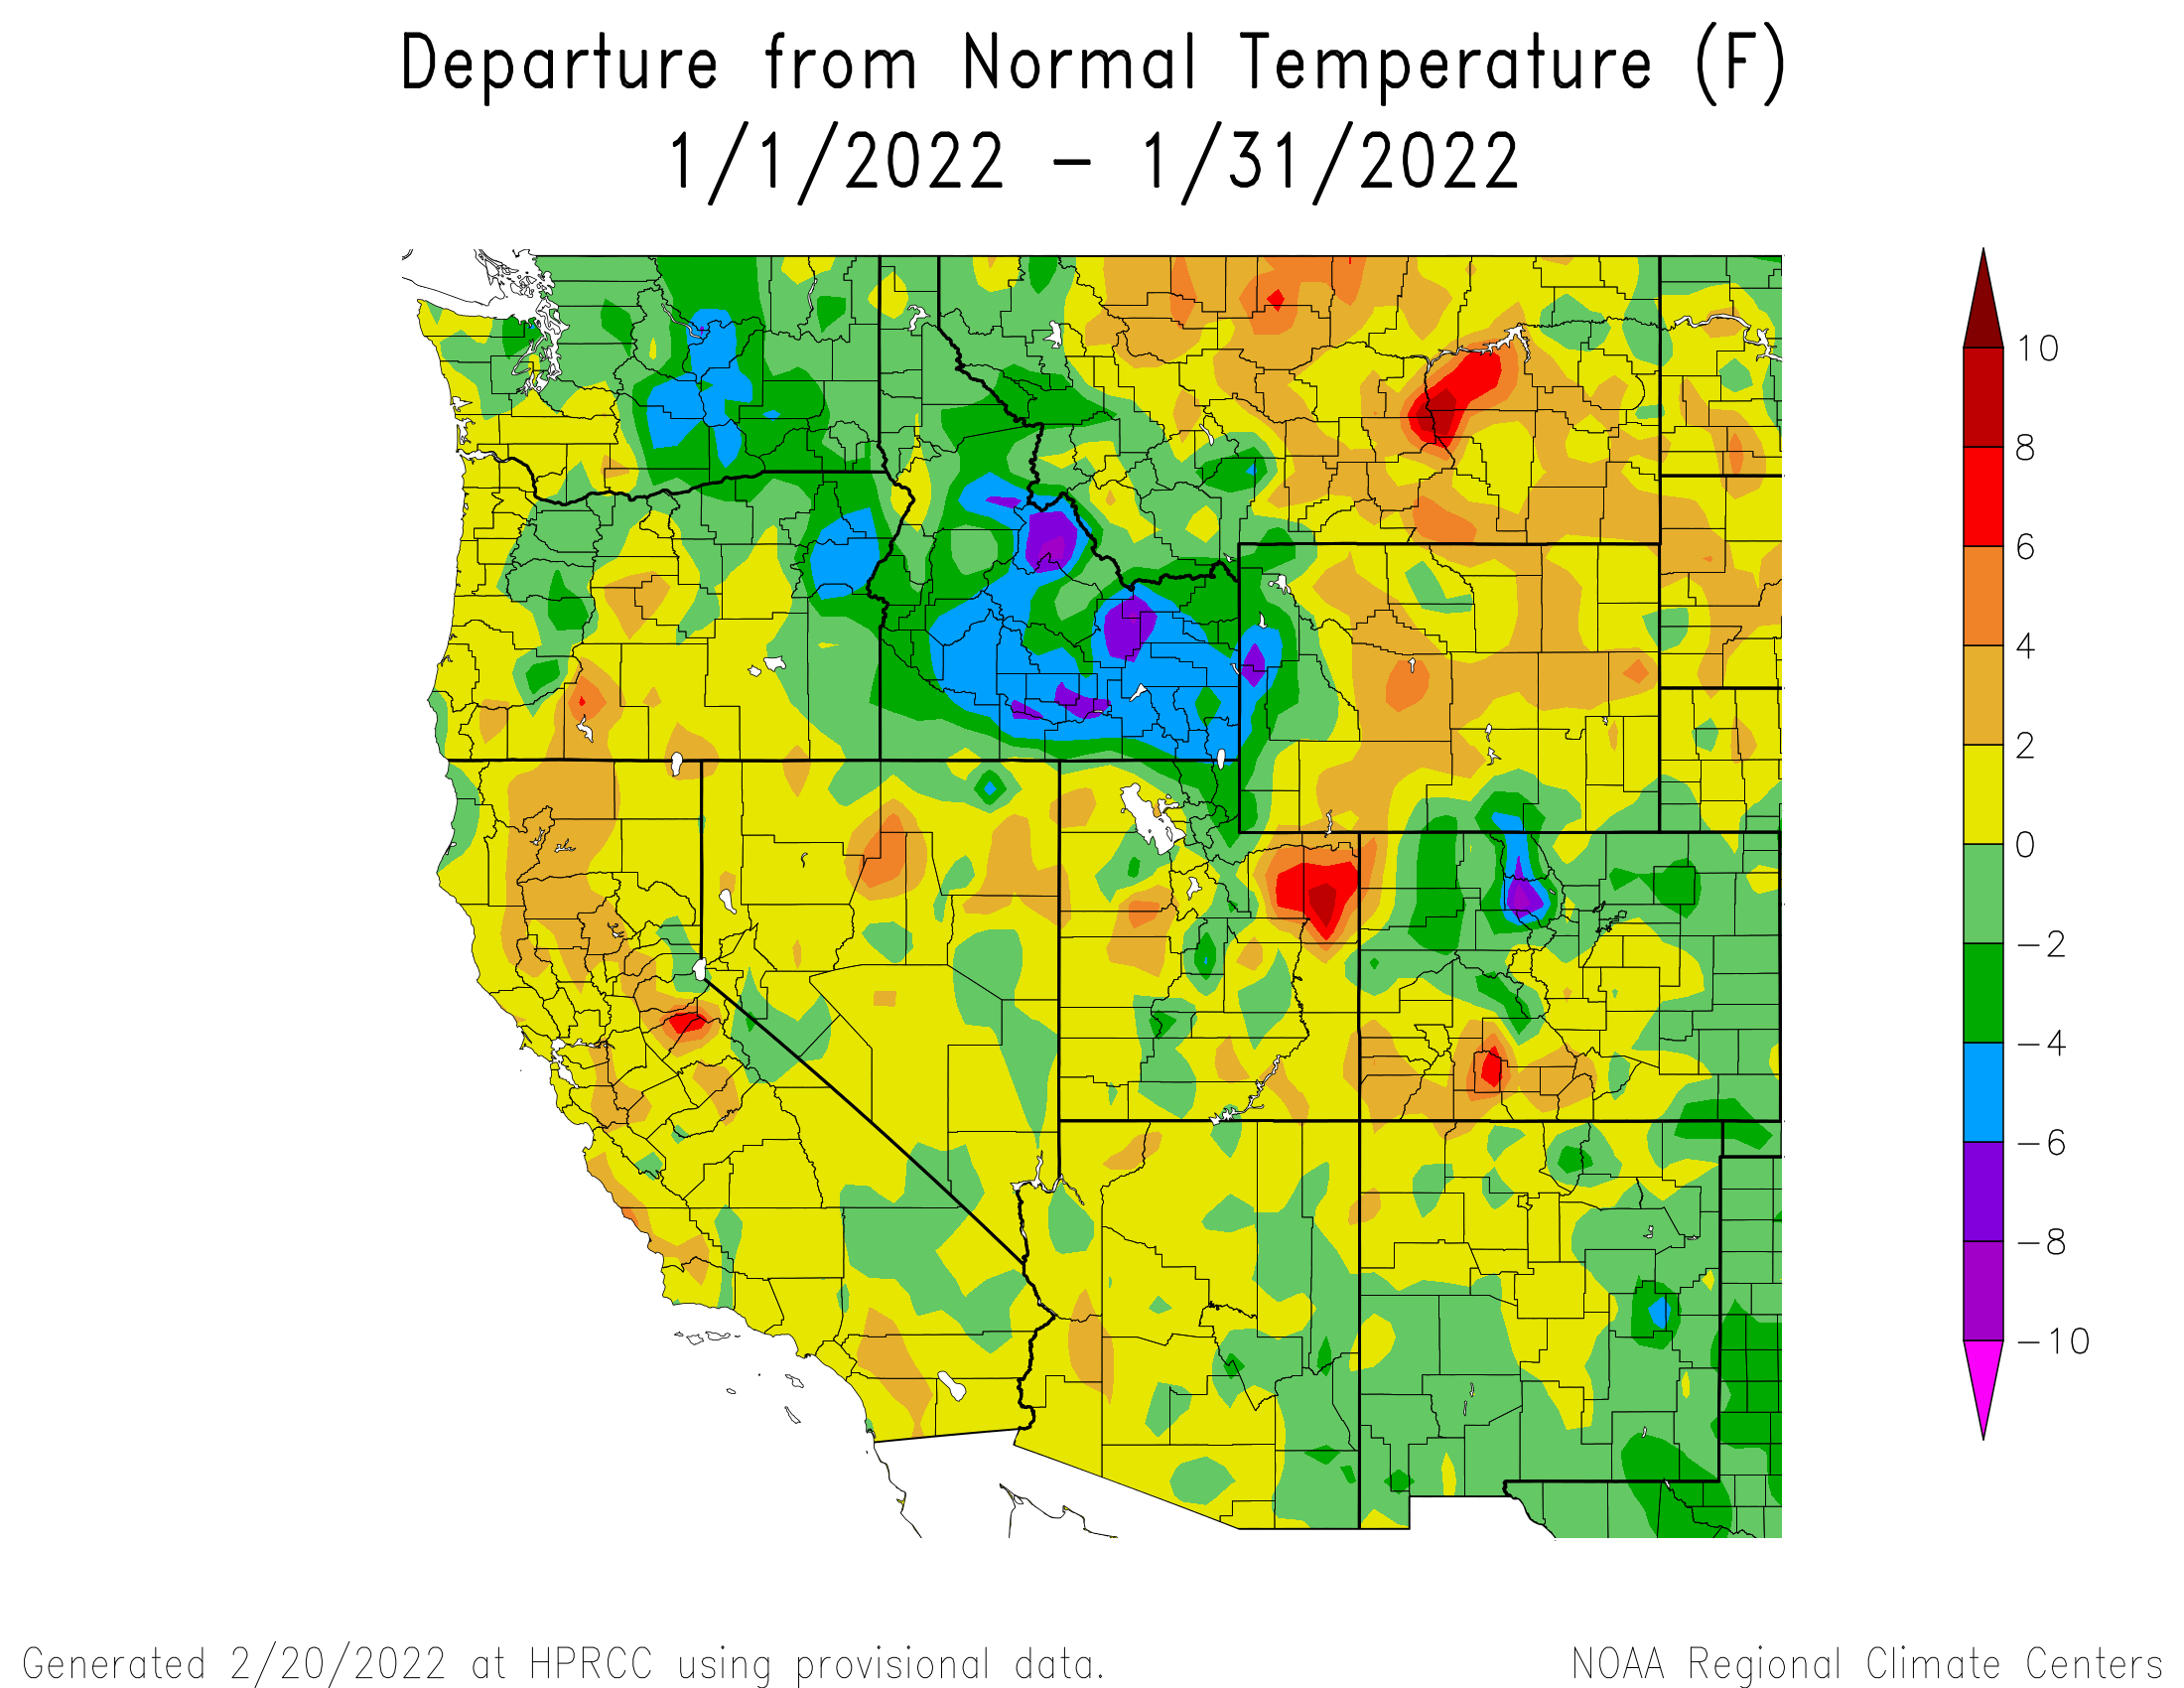
January 2022: Western Colorado was very dry for January, about 10 days with precip but only a scant amount each occurrence. For precipitation that’s about it for the month worth mentioning. Fortunately temperatures were somewhat near normal, albeit a little warmer towards the southern mountains. Fortunately as well, the Front Range received a good bit of snow this month that has helped drought conditions to the east.
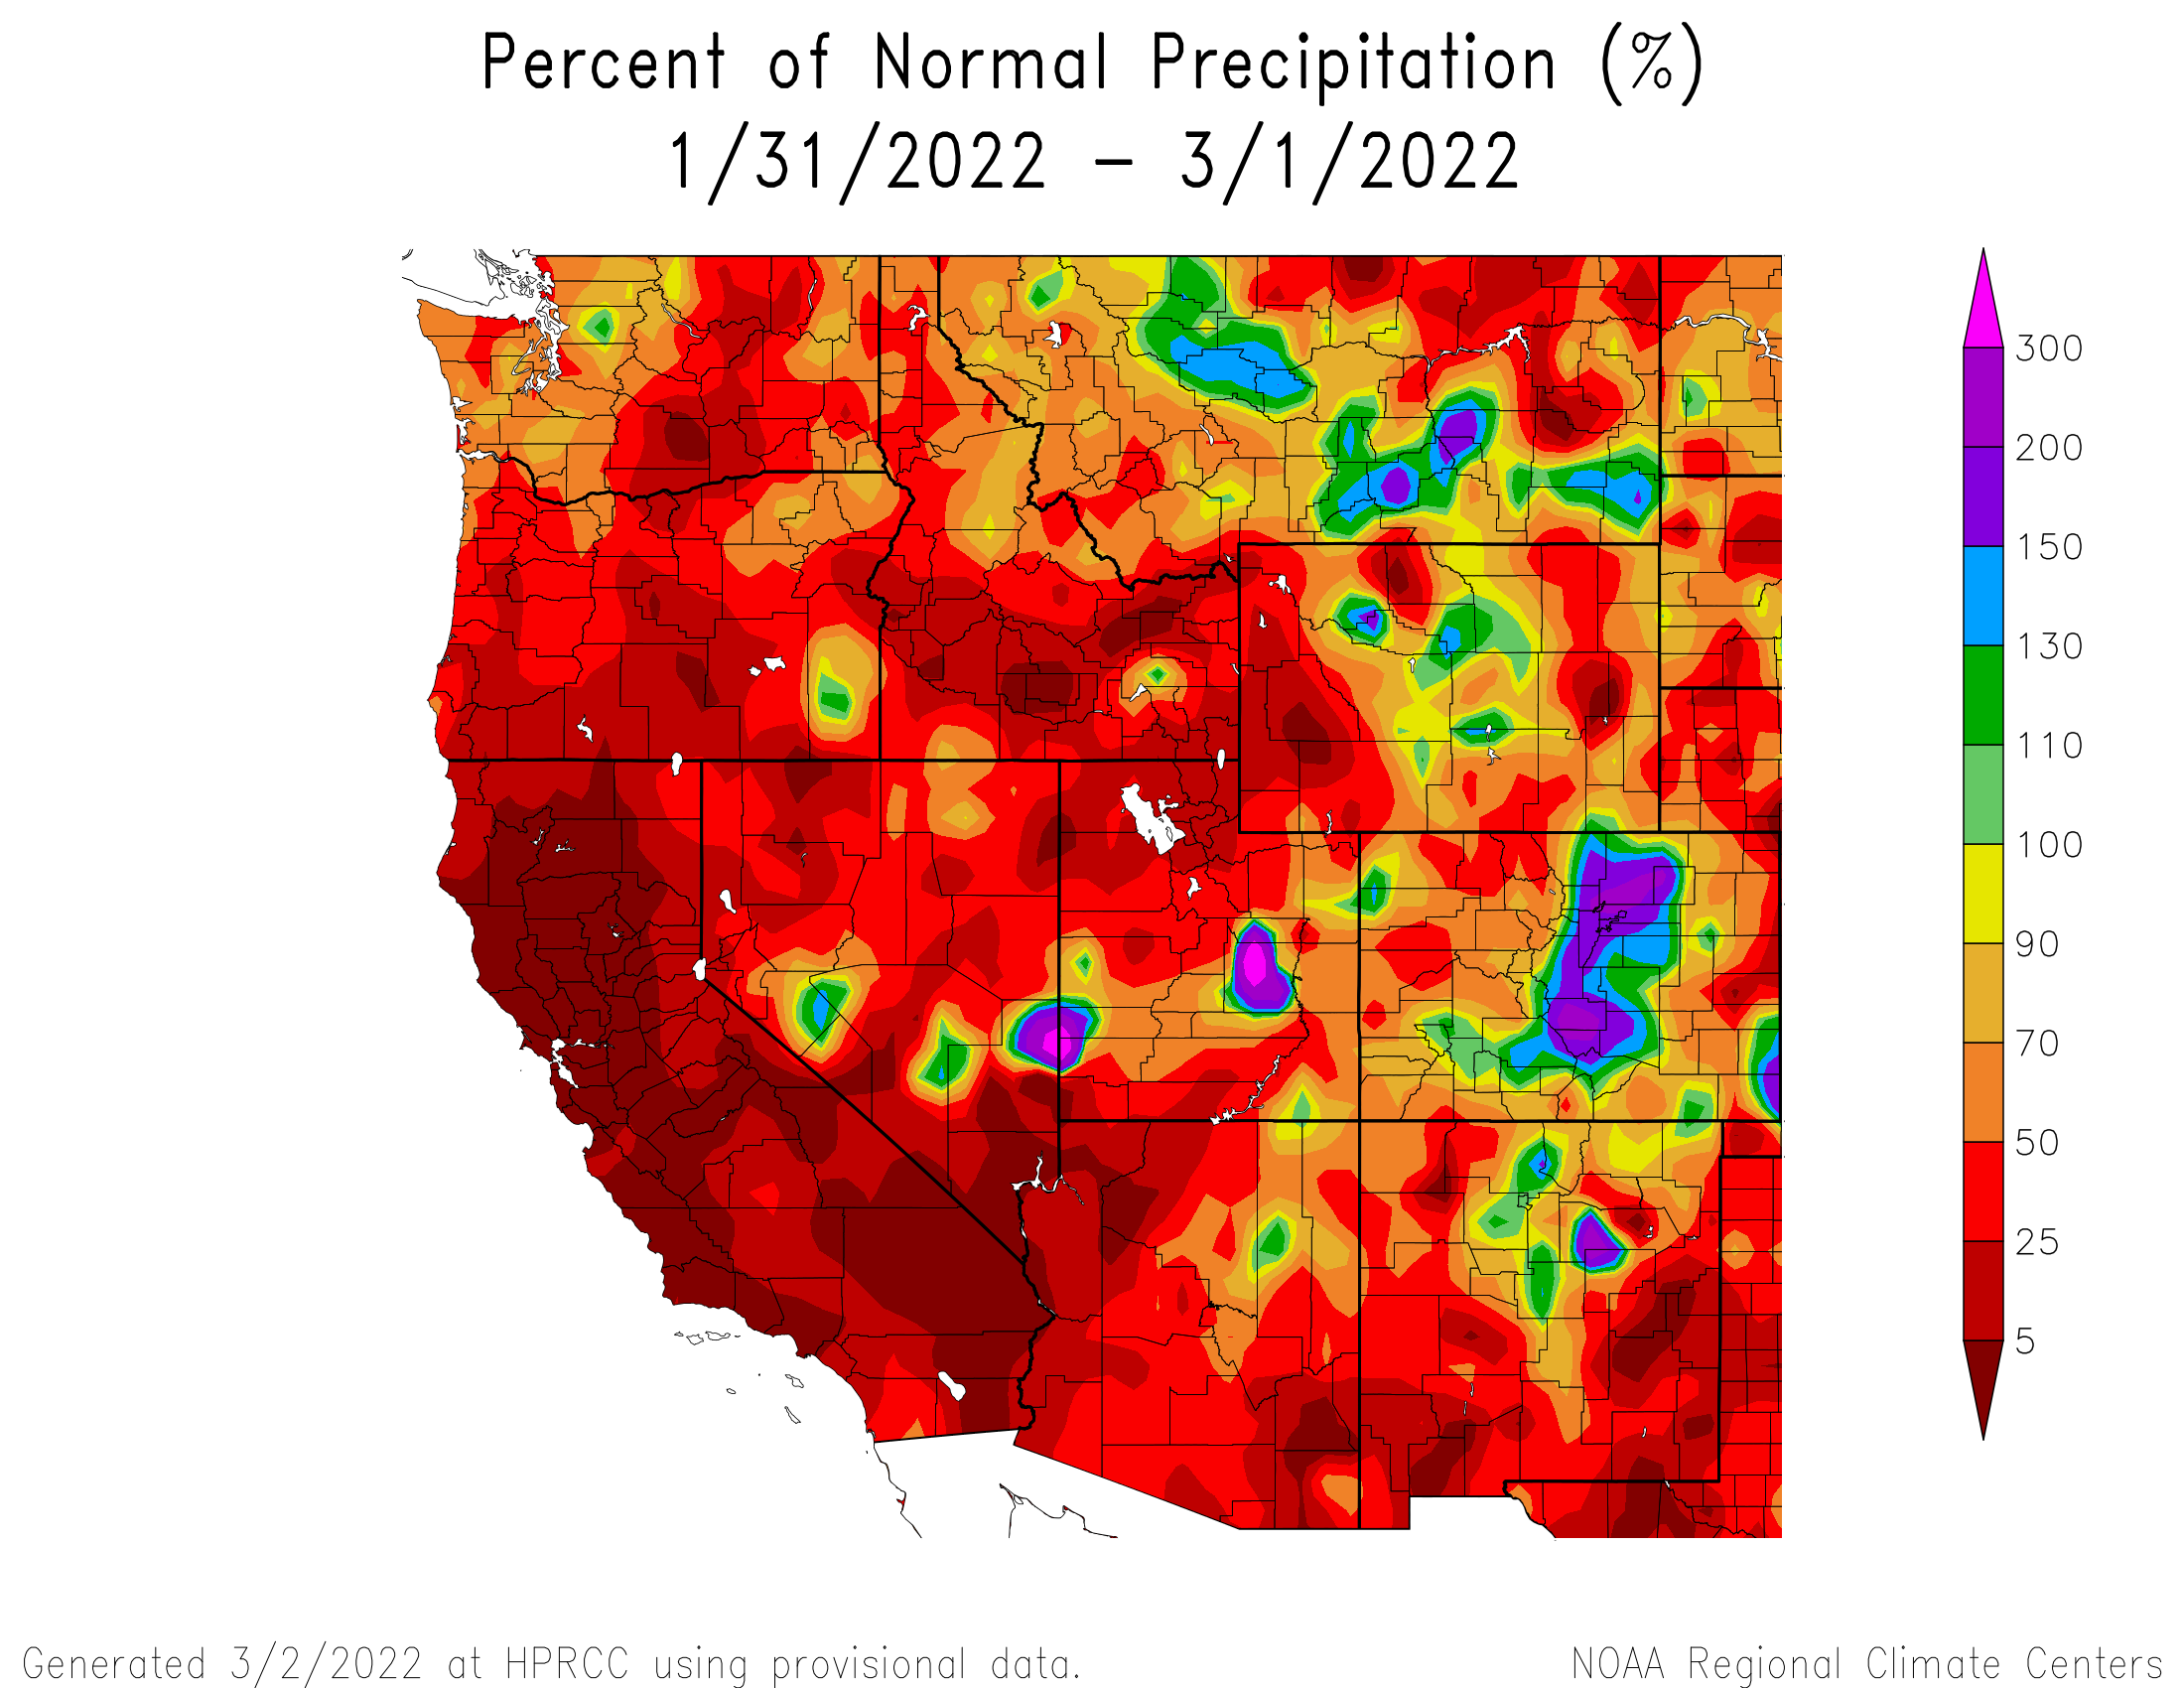
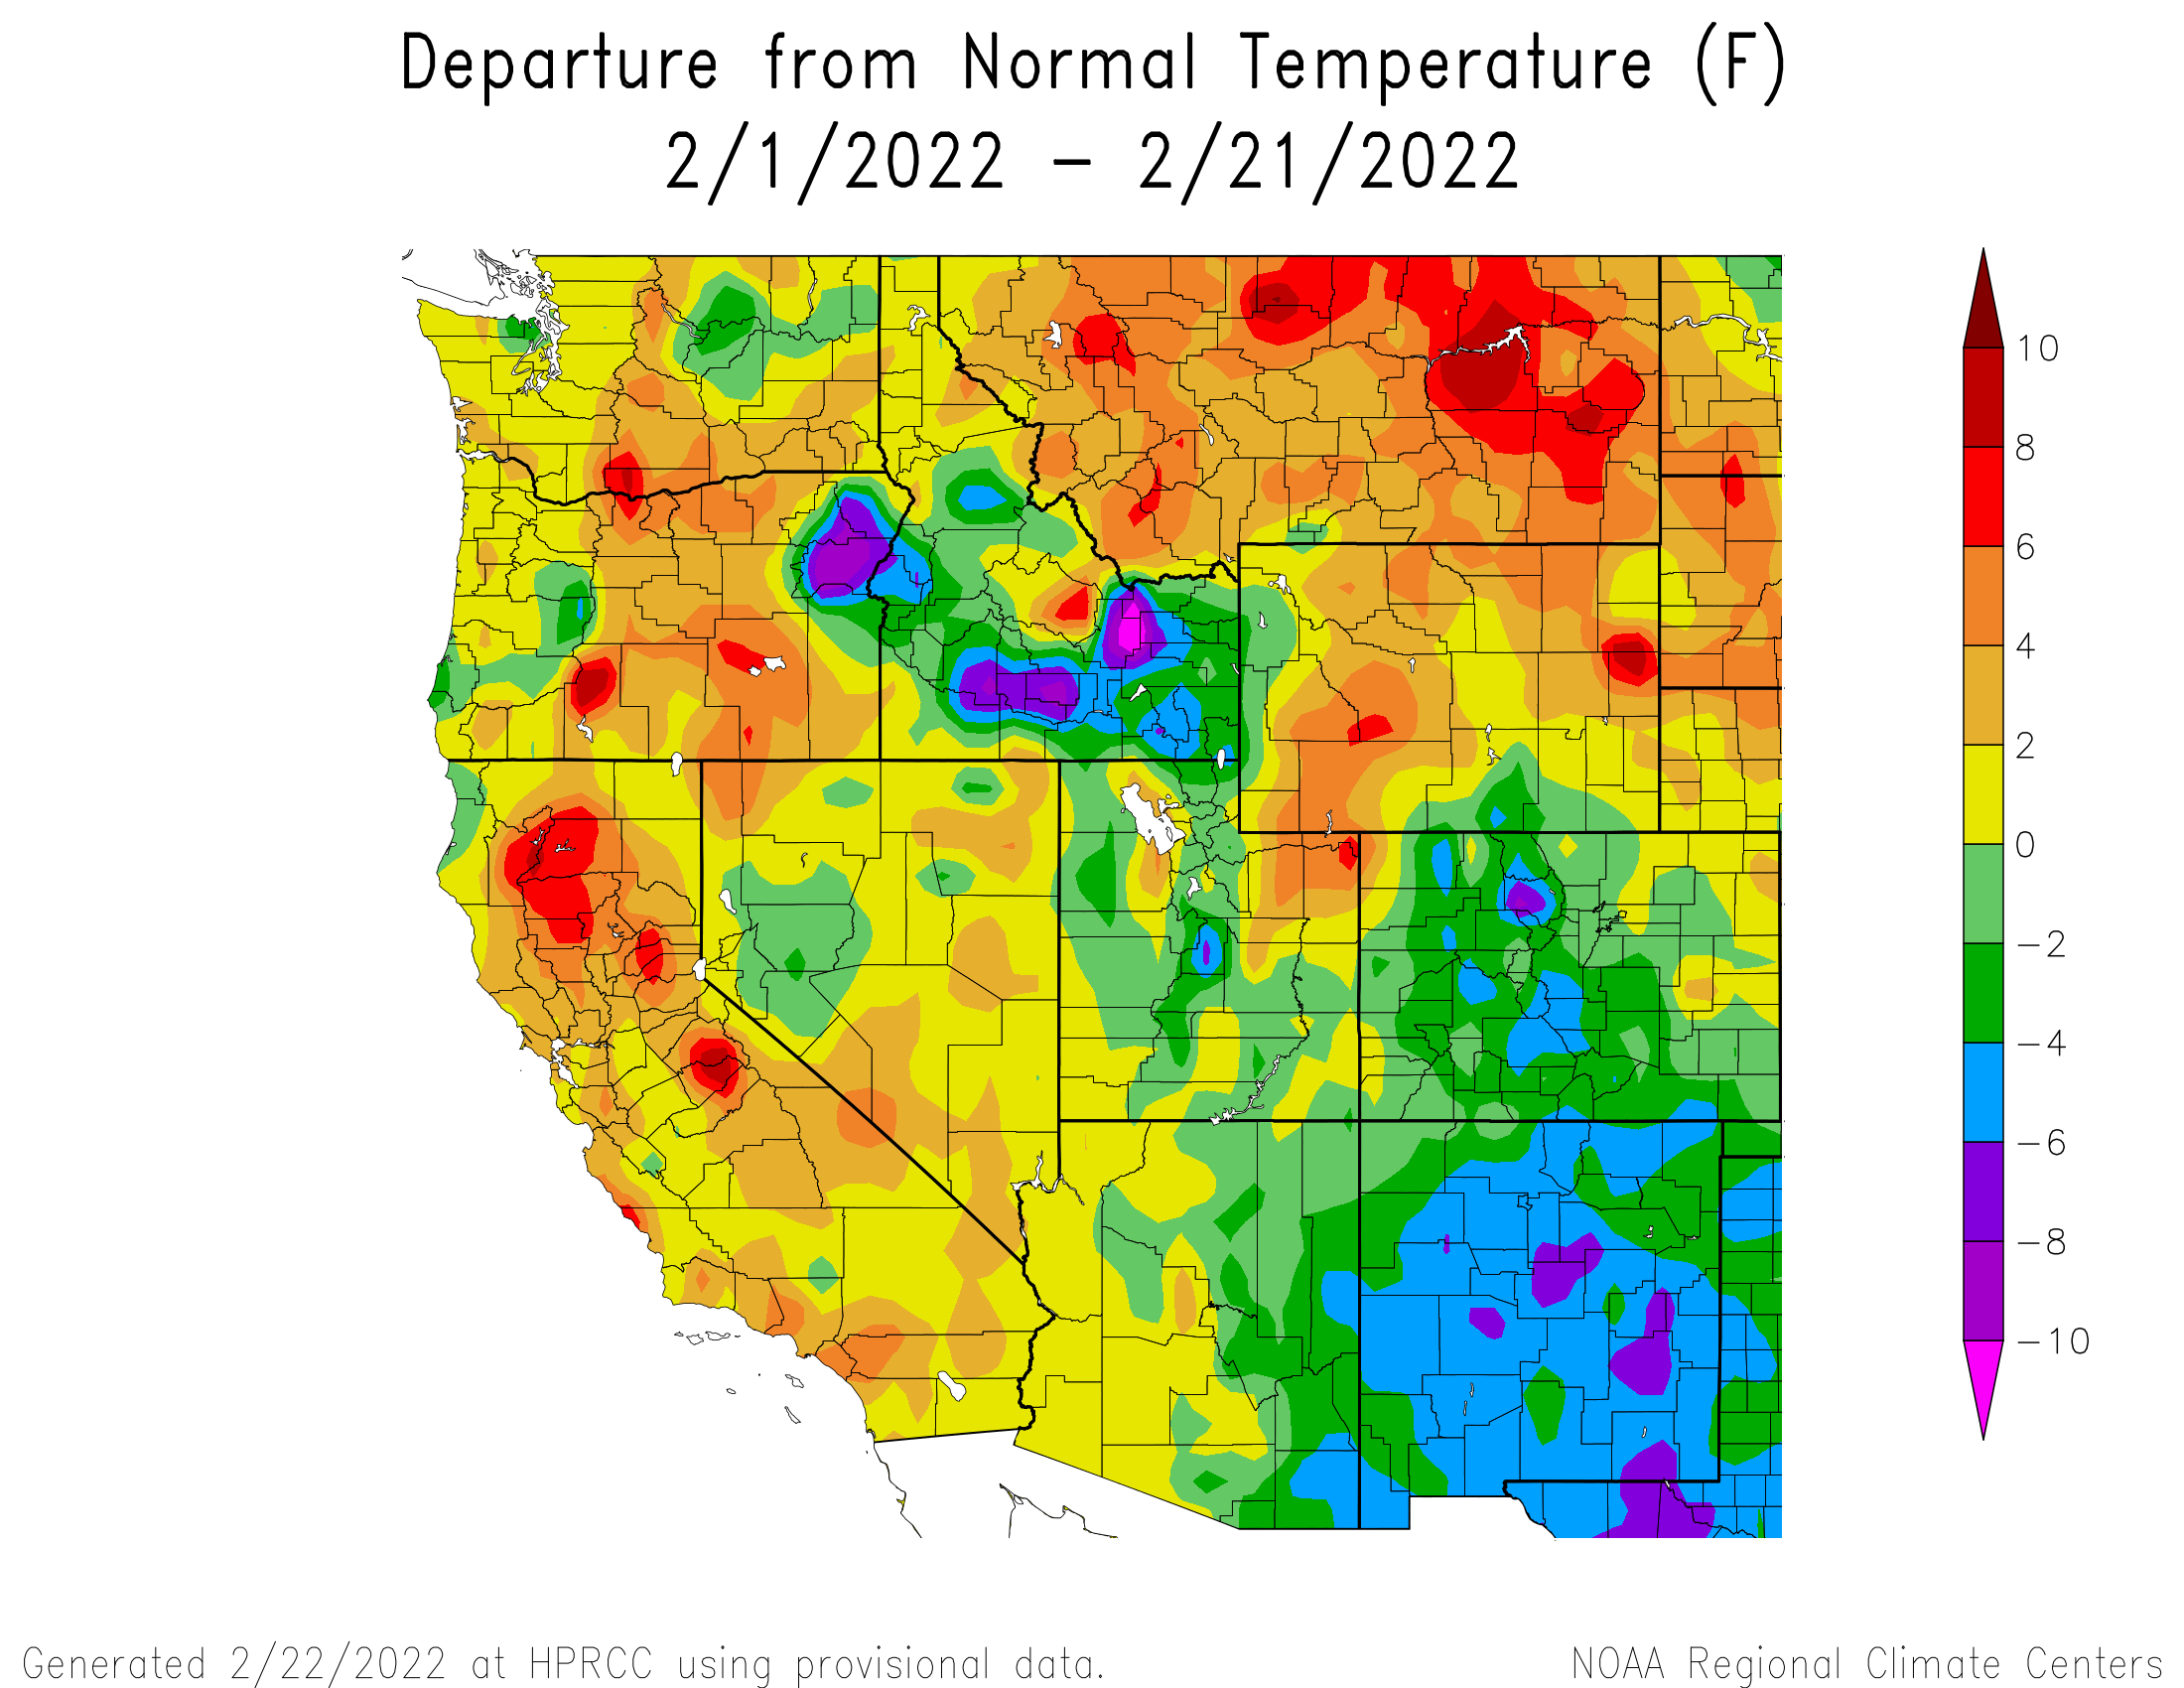
February 2022: The first half was equally uneventful and warm. Mid-month we saw the persistent ridge break down and a system moved through Feb 16. It was 1 mm short of being considered a storm in our record books but a welcome 0.4” precip nonetheless. The real news worthy storm (storm #6) came in two waves from Feb 21-24 hitting northern to southern Colorado, with the San Juan’s lucking out as the largest benefactor as we observed 3” precipitation in the gauge (but measured 5” new SWE on the ground). Storm #6 really jumped the snowpack into gear, much like the string of storms in December. On this storm front came a wave of dust that hit the San Juan snowpack severely as well as depositing a layer of significant dust as far north as Eagle County. We will determine the full spatial extend of this event when we conduct the CODOS statewide road trip assessing dust-in-snow conditions in mid-March. Currently, it is hot and dry but the forecast calls for a few days of snow starting March 4. Please see graphs below.
A review of winter storms to date can be viewed on the storm reports page on our snowstudies.org website.
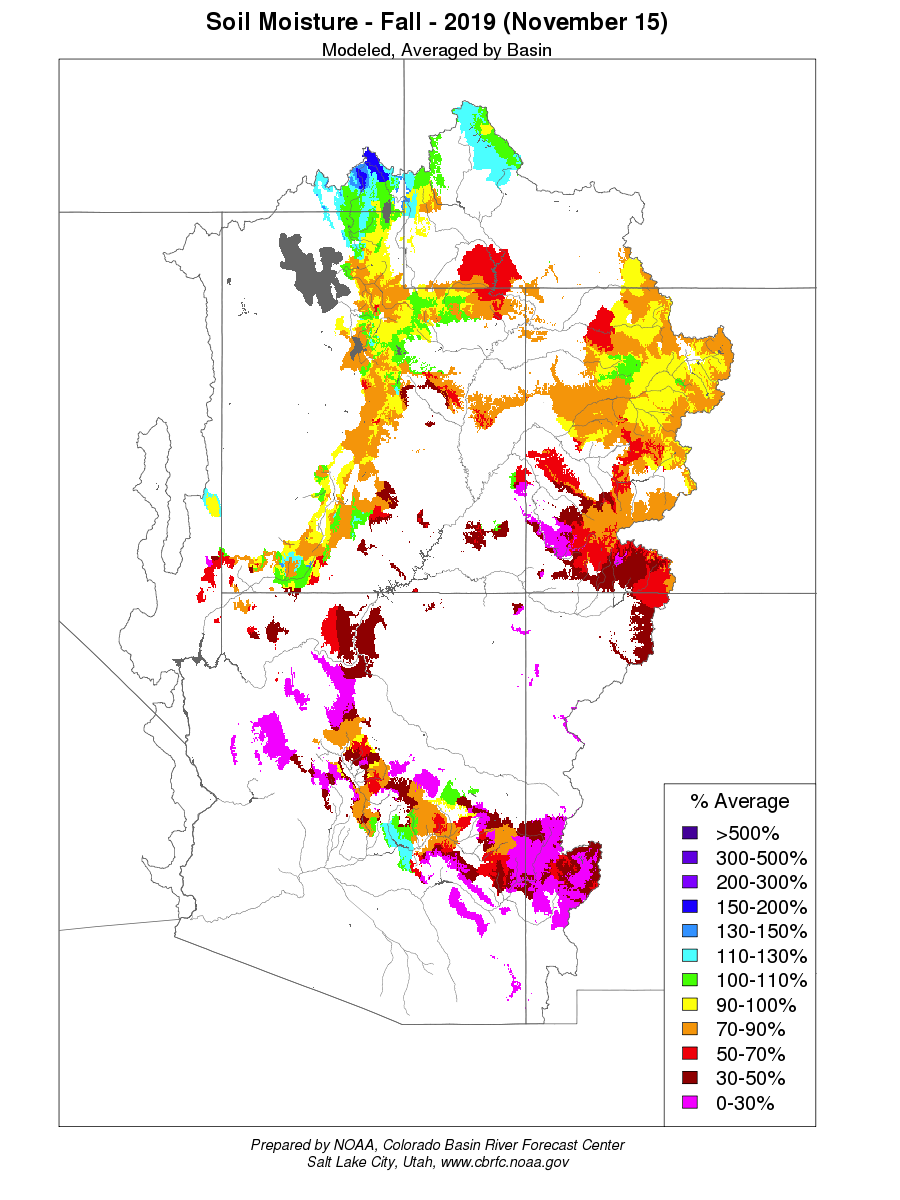
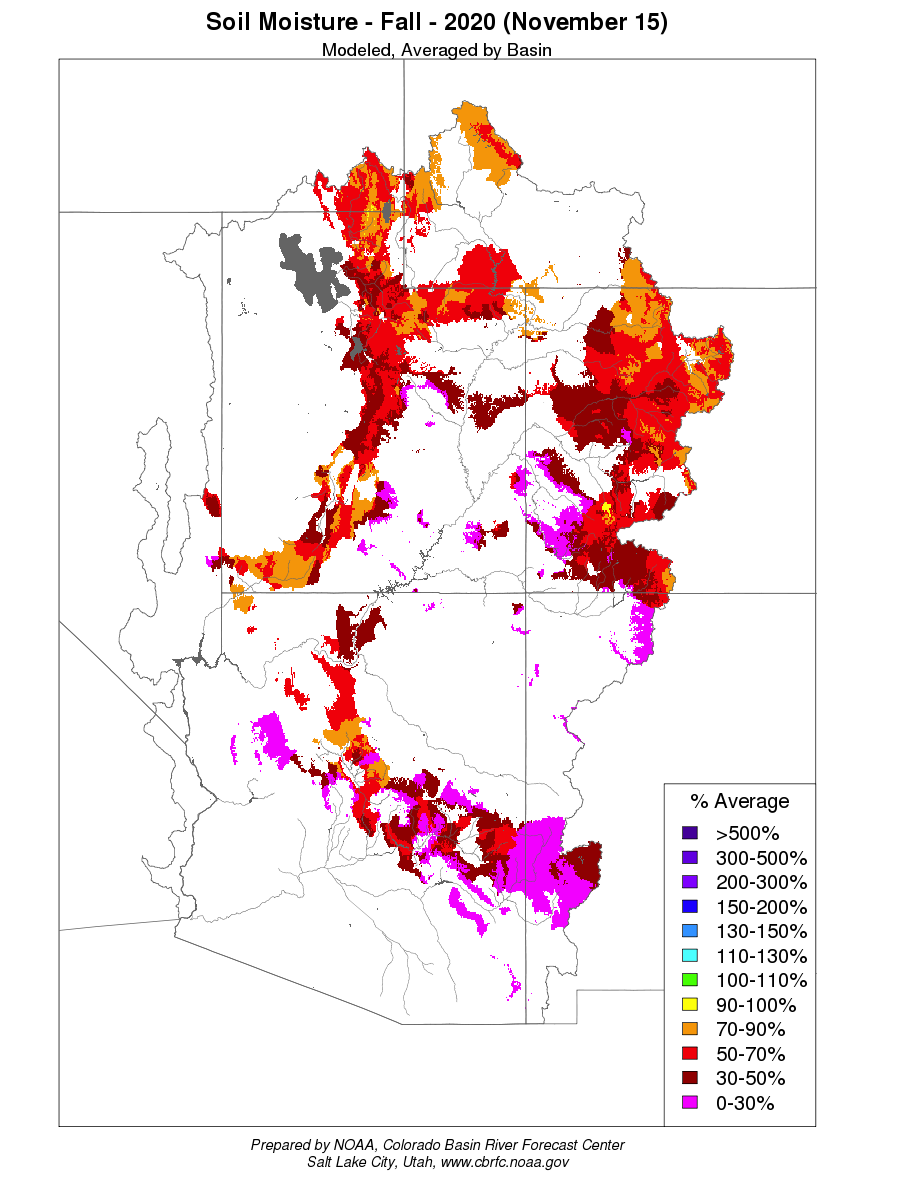
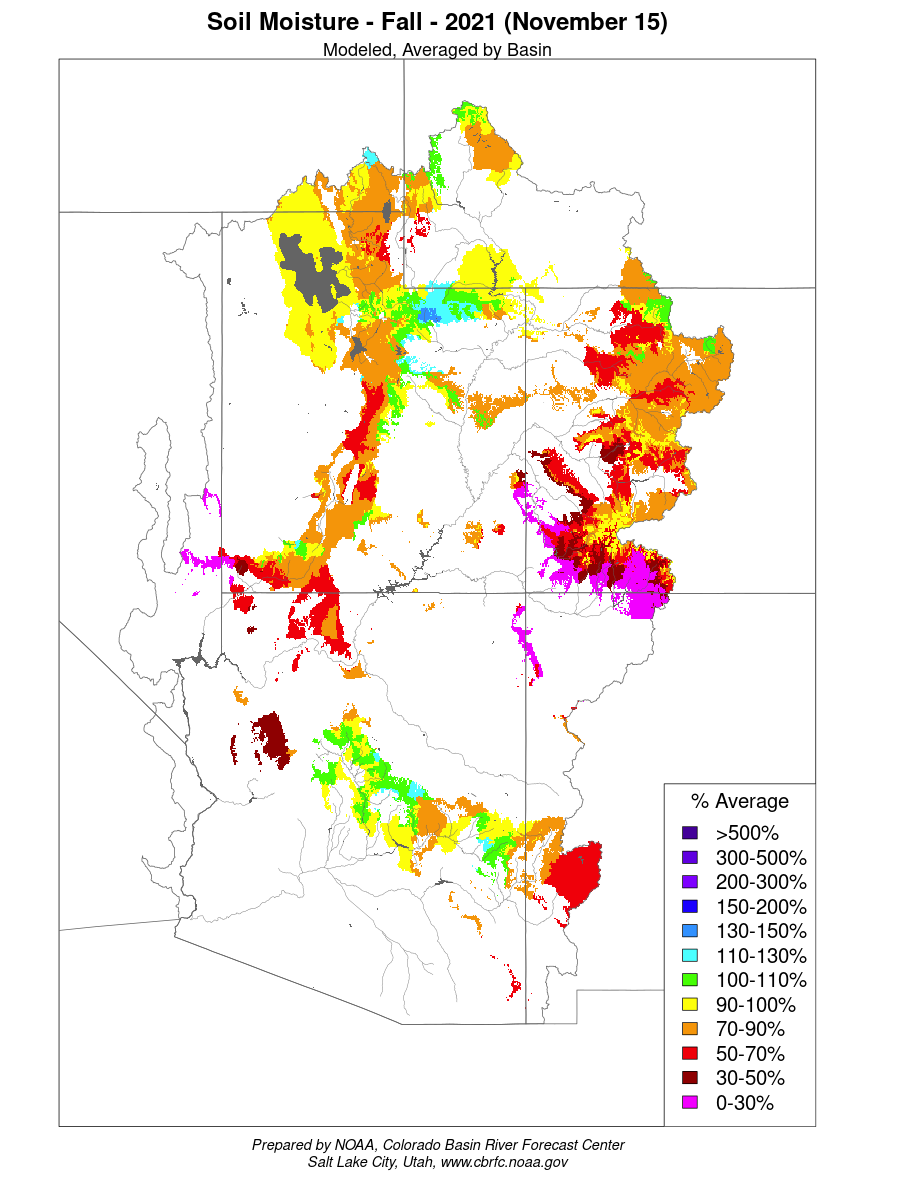
Below is a soil moisture map for the CRB. Modeled soil moisture is better than last year in most areas but still very dry. Given the dry conditions, an above normal snowpack or a wet spring will be needed to see near average water supply volumes.
Current DUST-ON-SNOW Conditions AND DERC CLASSIFICATION
Over the course of our 2005-2021 period of rigorous observations, March 1st has marked the beginning of the heart of “dust-on-snow season” for the Colorado Mountains (see the CODOS Dust Log chart of dust events by month). So far for WY2022 at SBB, the primary ‘sentry site’ for the CODOS program, we observed 2 dust events. The first was a December (dust event #1=D1) dust-on-snow event occurring on Dec 26 on top of 1-meter (3.3’) snowpack. This dust was variable in it’s spatial extent as it is observed in San Miguel and Dolores watersheds but lesser degree near Red Mt Pass. Naturally, where this dust is most prevalent will have a greater impact on snowmelt come spring. The second dust (D2) event was a big event, both in it’s severity as well as spatial extent. It occurred recently, on February 21, and it left a severe layer on the old snow surface which was immediately covered by ~ 26” of snow accumulation. We know this event extended at least as far as Eagle County and likely a good bit farther north. Prior to this event dust conditions were considered “minimum”, but after we are solidly in the “average” category in southern Colorado and likely farther north.
The CODOS team will do our first statewide dust assessment of the season around mid-March. We try to time our trips to best document dust in/on snow conditions. If there is plenty of fresh snow accumulation and minimal dust we delay the tour, but if we feel dust layers are near the snowpack surface we hit the road to determine the potential short-term and later melt season impacts.
As of March 1st, SWE % is in the “average” category in all basins but the Yampa and Arkansas, which are 86% and 84%, respectively . DERC “Average” SWE equals median +/- 10%, and deviation above and below those limits are assessed as having “high” or “low” SWE. The basins listed below are classified according to the appropriate DERC classification of either Low, Average, or High March 1st SWE domains.

Picture of dust event #2 that was buried by 19” of snow.

D2 very evident a couple feet below snow surface. D2 is very pronounced in snow profiles across the San Juan’s. D1 is very pronounced in San Miquel, Dolores, Animas watersheds, in this picture at Red Mt Pass it is faint about 2’ from ground.

The same dust layer (D2) in Durango. Photo by Gigi Richard
Basin scale WY 2022 March 1 SWE conditions (NRCS data) classified using the Dust Enhanced Runoff Classification Scheme.
As described on the CODOS website, the DERC framework is utilized to identify prior years with similar patterns of dust-on-snow intensity, March 1st SWE, and spring precipitation conditions, and their associated hydrographs. March 1st SWE analyses have been performed for each CODOS site. From this, hydrographs from 2006-2021 with associated March 1st SWE conditions have been identified and included in the analyses.
An ‘exploded view’ of the Dust Enhanced Runoff Space, separated by March 1 SWE classifications.
CODOS SITE-SPECIFIC ANALYSES
Comparison of Reference Periods: We have transitioned into using an updated reference period that is used to calculate the average and median metrics. Previously we used 1981-2010 as the basis, where the 1980’s and even 1990’s were wetter than 2000’s. Now the 1991-2020 timeframe is being used, which include the last 20 years of the current megadrought we are experiencing. How do the two time periods compare? Below is a comparison of the differences of % March 1st values calculated using the two time periods. At some stations the difference is small (1%-3%) and at others a good bit larger (4%-12%).
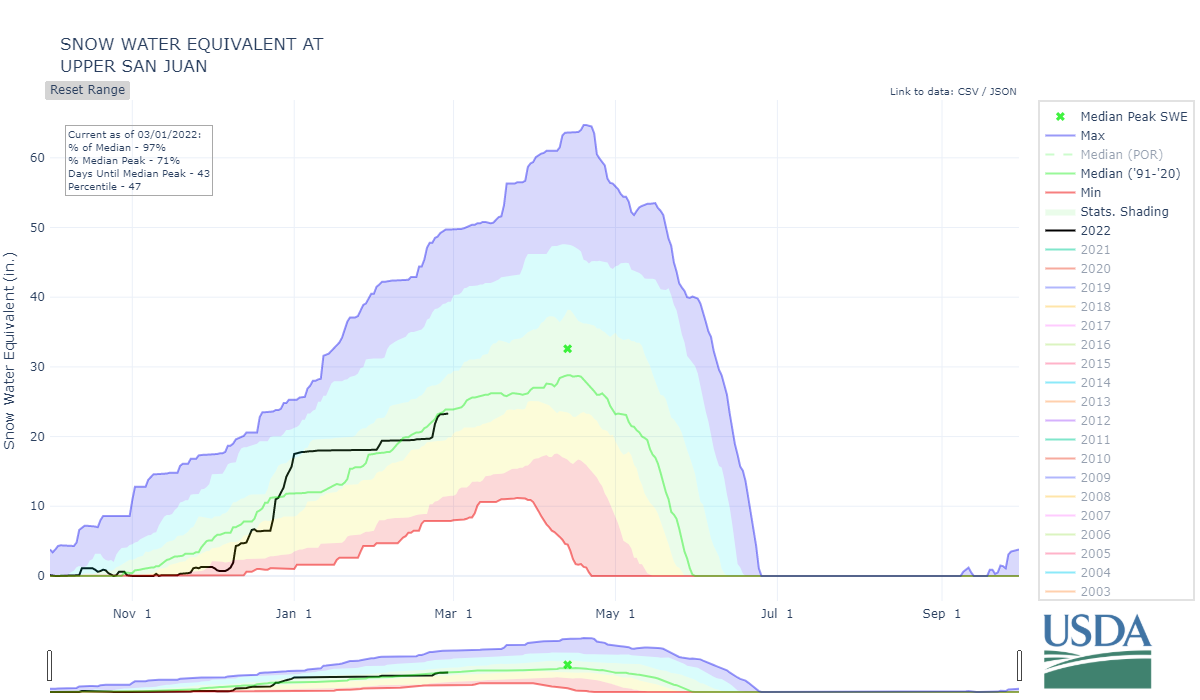
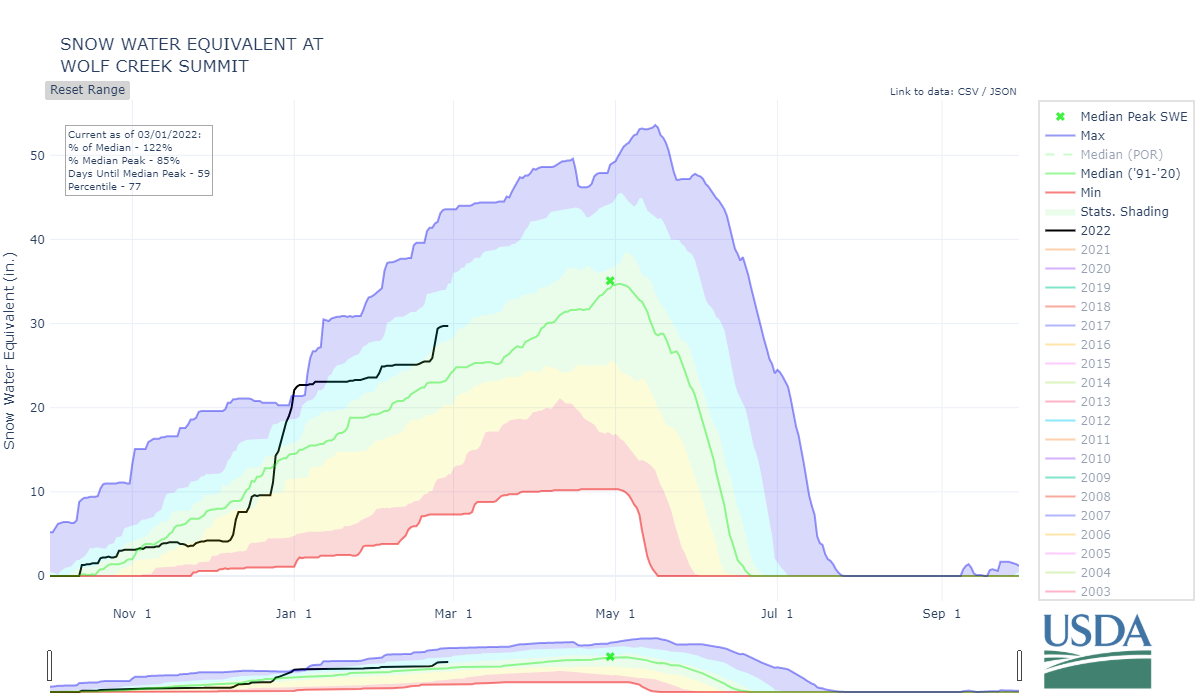
For individual SNOTEL stations associated with our eleven CODOS sites, March 1 SWE ranges from 79%-122% of median levels (using the new 1991-2020 metric). March 1 SWE conditions are classified by the SNOTEL station directly associated with each CODOS site, and also for select nearby SNOTEL stations. Prior seasons with similar March 1st conditions were identified and placed within the appropriate dust enhanced March 1st SWE space. Local watershed hydrographs (from 2006-2021) associated with those March 1st SWE conditions are presented as plausible examples of runoff behavior in spring 2022, with the understanding that these prior years exhibit a relative limited variety of 2006-2022 dust and spring precipitation conditions for each CODOS site.
These analyses are presented in PDF format and are available for the watersheds listed below. You can see the entire period-of-record hydrographs as it relates to dust conditions on our CODOS website.
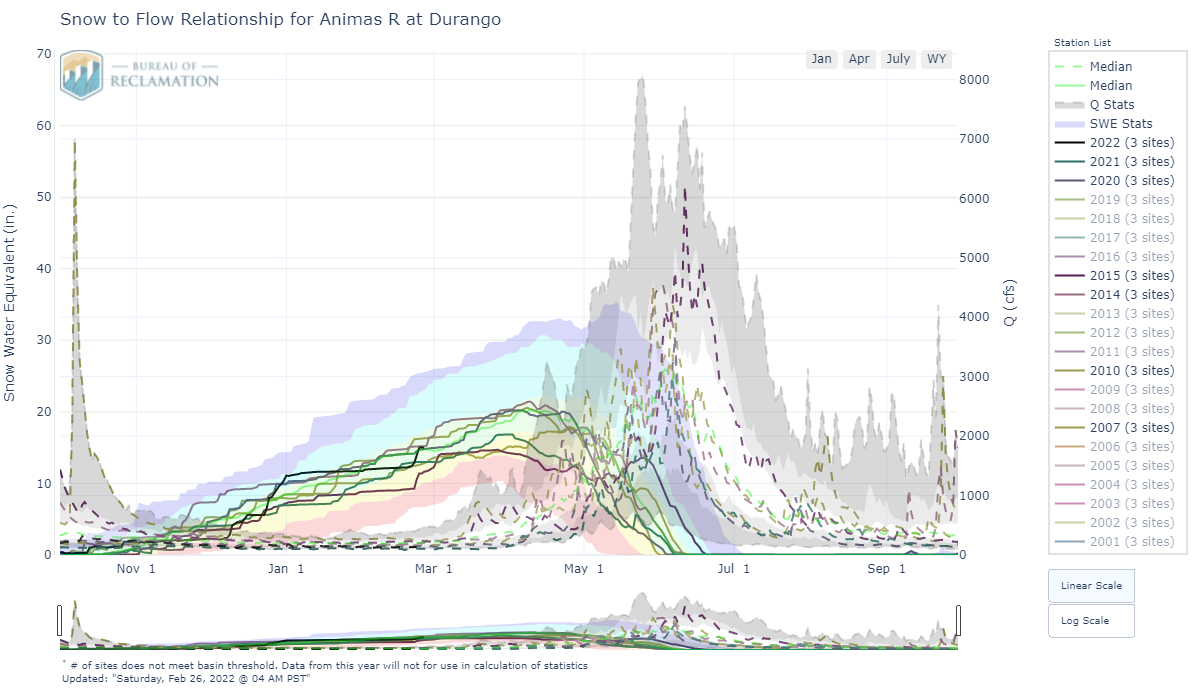
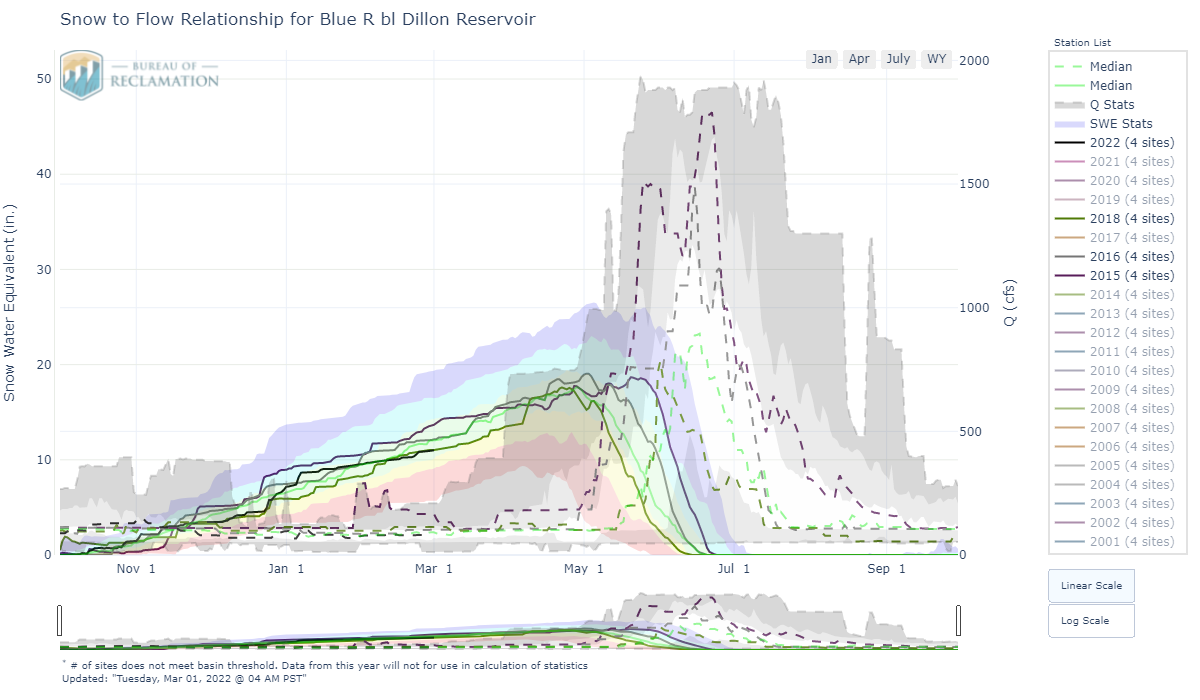
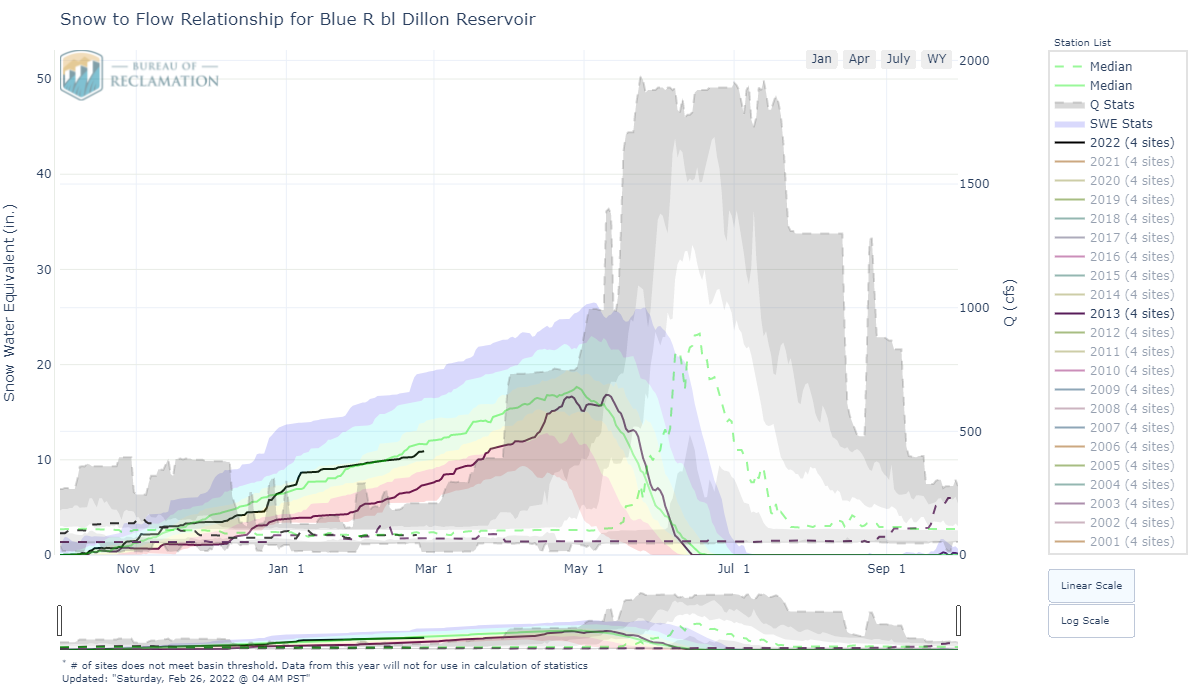
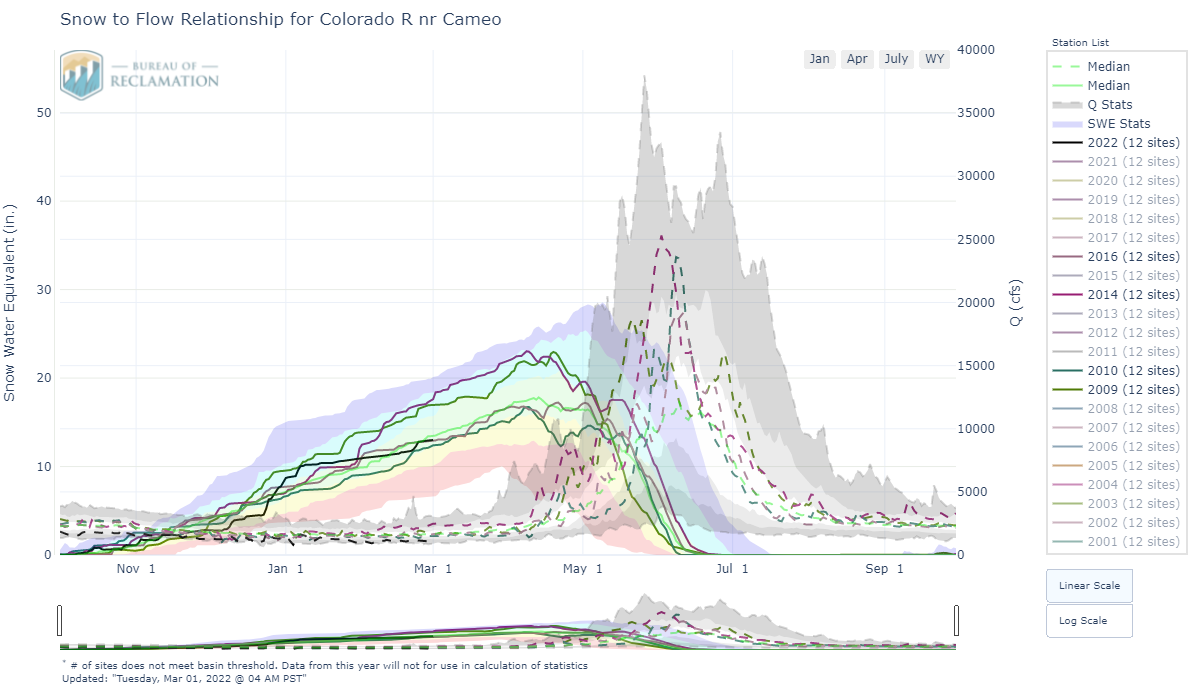
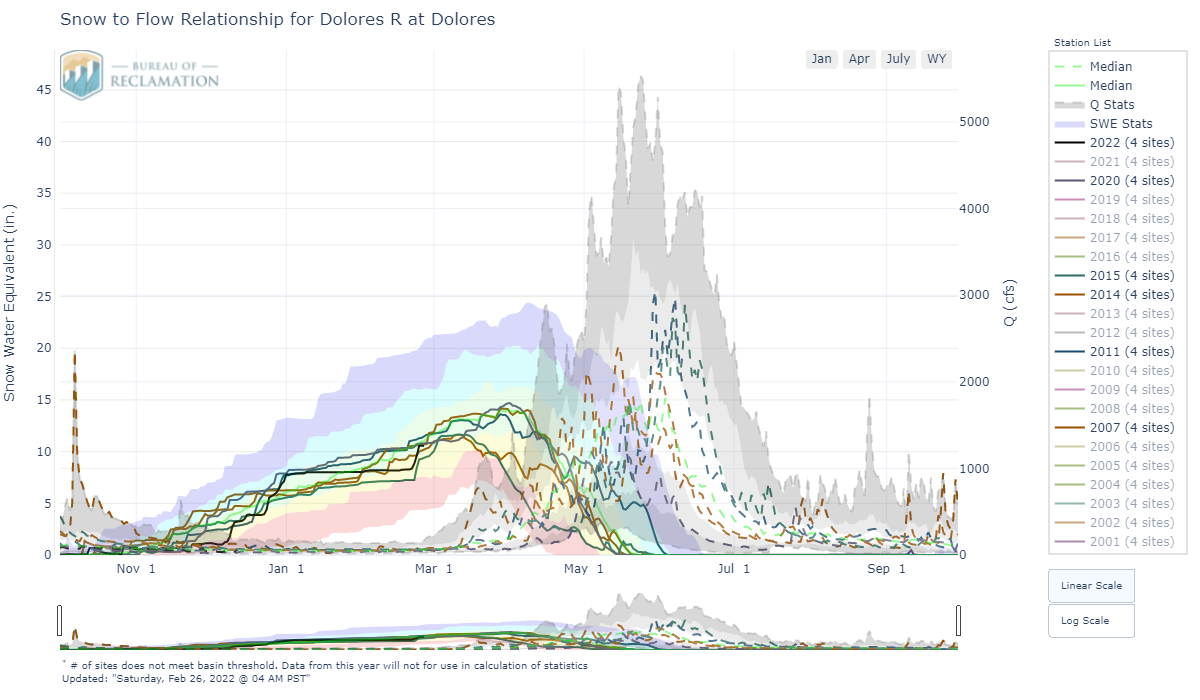
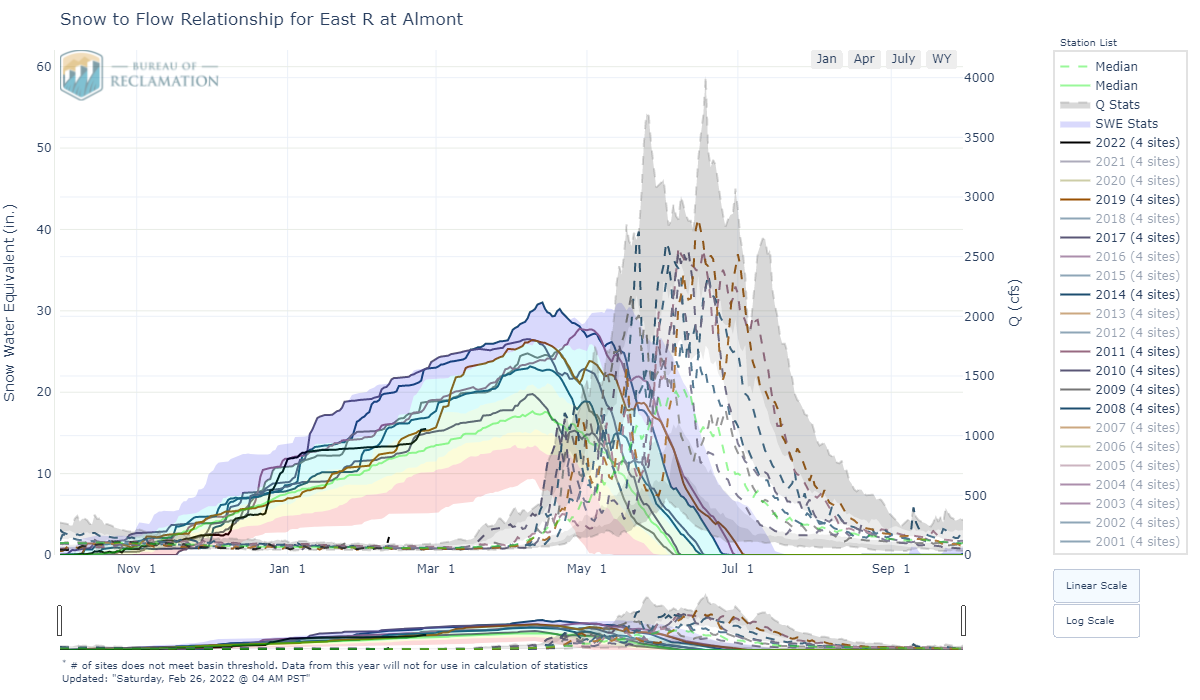
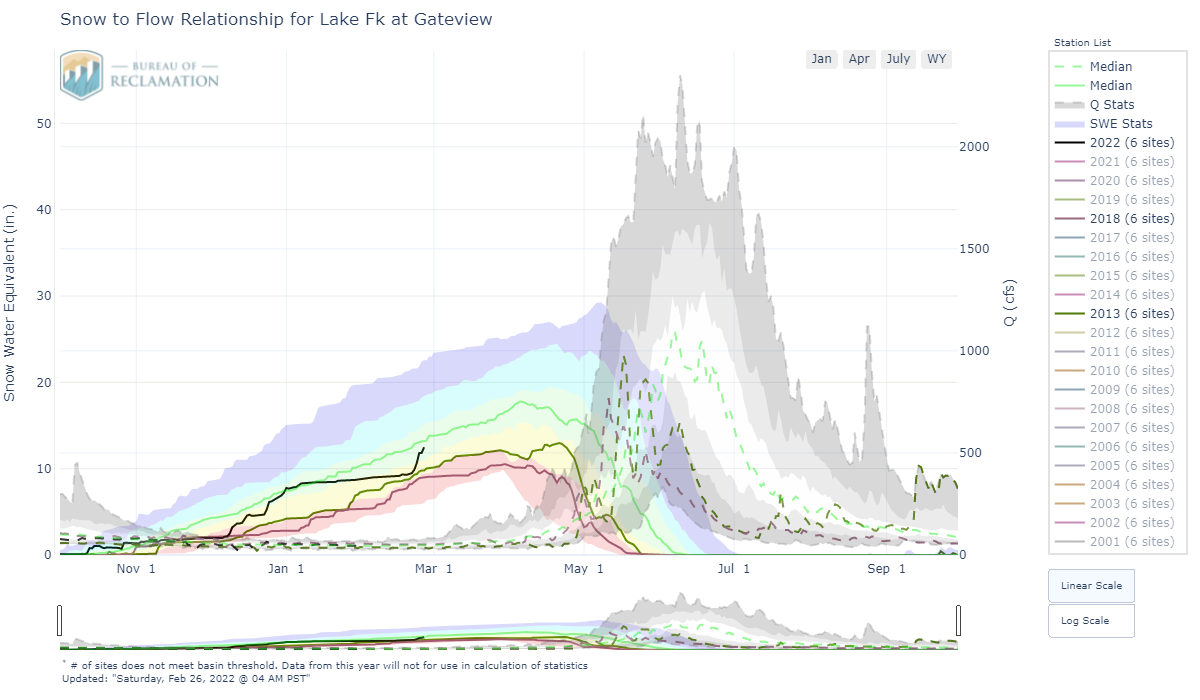
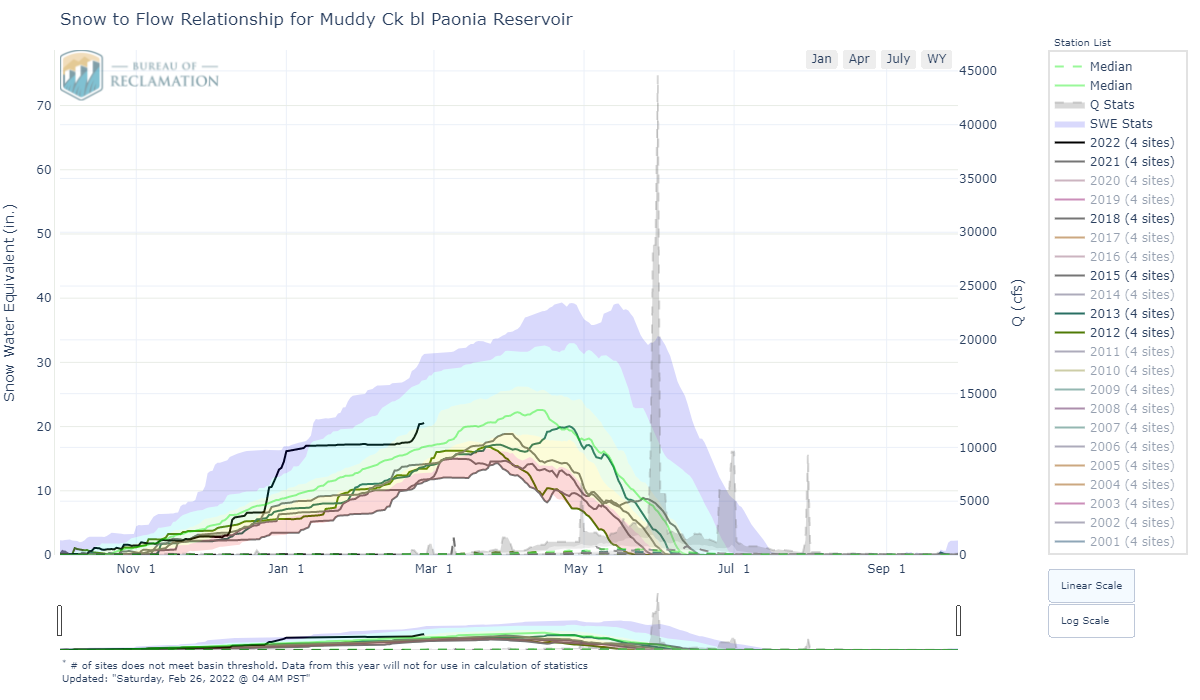
Below: In addition to the links to the pdf documents above the plots below show SWE and discharge for select watersheds for years with similar March 1 conditions. Explore this convenient tool on your own by following this link.
SENATOR BECK STUDY BASIN DATA PLOTS
SBB is located at, or near, the headwaters of four major watersheds (Animas, Uncompahgre, San Miguel, and Rio Grande) and is the only high alpine study site in the region collecting comprehensive snowpack and information. We regularly dig snow profiles to assess snow/dust conditions, and our meteorological stations measure the entire energy balance of the snowpack. Being a headwater study basin, the elevations that we collect snowpack information and continue meteorological station monitoring is well above the highest of most SNOTEL stations.
Snowpack at the Swamp Angel Study Plot (SASP), located at 11,060’, is a few inches of SWE below average conditions. The same is true for the Senator Beck Study Plot (SBSP), which is at 12,200’ and more exposed.


Comparison of Red Mt SNOTEL early and late comparison periods to illustrate differences at a station over the snow season. Also shown is SASP average SWE and current state of the snowpack (red line).

Below: Dry conditions are expected to prevail in the long term, the next couple weeks hold better chances of precip with cooler temperatures.


SENATOR BECK STUDY BASIN SETTING
Usually just before spring it is helpful to remind long-time CODOS subscribers and inform new subscribers where Senator Beck Basin (SBB) and it’s meteorological stations are located, so when we refer to data at SASP (Swamp Angel Study Plot) or SBSP (Senator Beck Study Plot) the reader understands the environment in which it was collected.
Senator Beck Study Basin location near Red Mountain Pass near Silverton, CO. Elevation of the Basin ranges from 11,030’ at the stream gauge to 13,510’ at the crest of the peaks. The blue line delineates watershed boundary. Senator Beck Study Plot and Swamp Angel Study Plot are the locations of highly instrumented meteorological stations and are also where snowpack data is collected. This picture was taken from our Putney station, where we collect “free air” wind speed and direction.
