

Overview
Every March 1 the Colorado Dust-on-Snow Program (CODOS) summarizes snowpack conditions state-wide and evaluates snow water equivalent (SWE) data from SNOTEL stations associated with our eleven CODOS sites and places them within the framework of the Dust Enhanced Runoff Classification scheme (DERC) developed by CODOS. The intent is to offer a glimpse of plausible WY2020 hydrograph characteristics based on current snowpack and dust conditions compared to similar conditions in our period of record.
SNOWPACK CONDITIONS
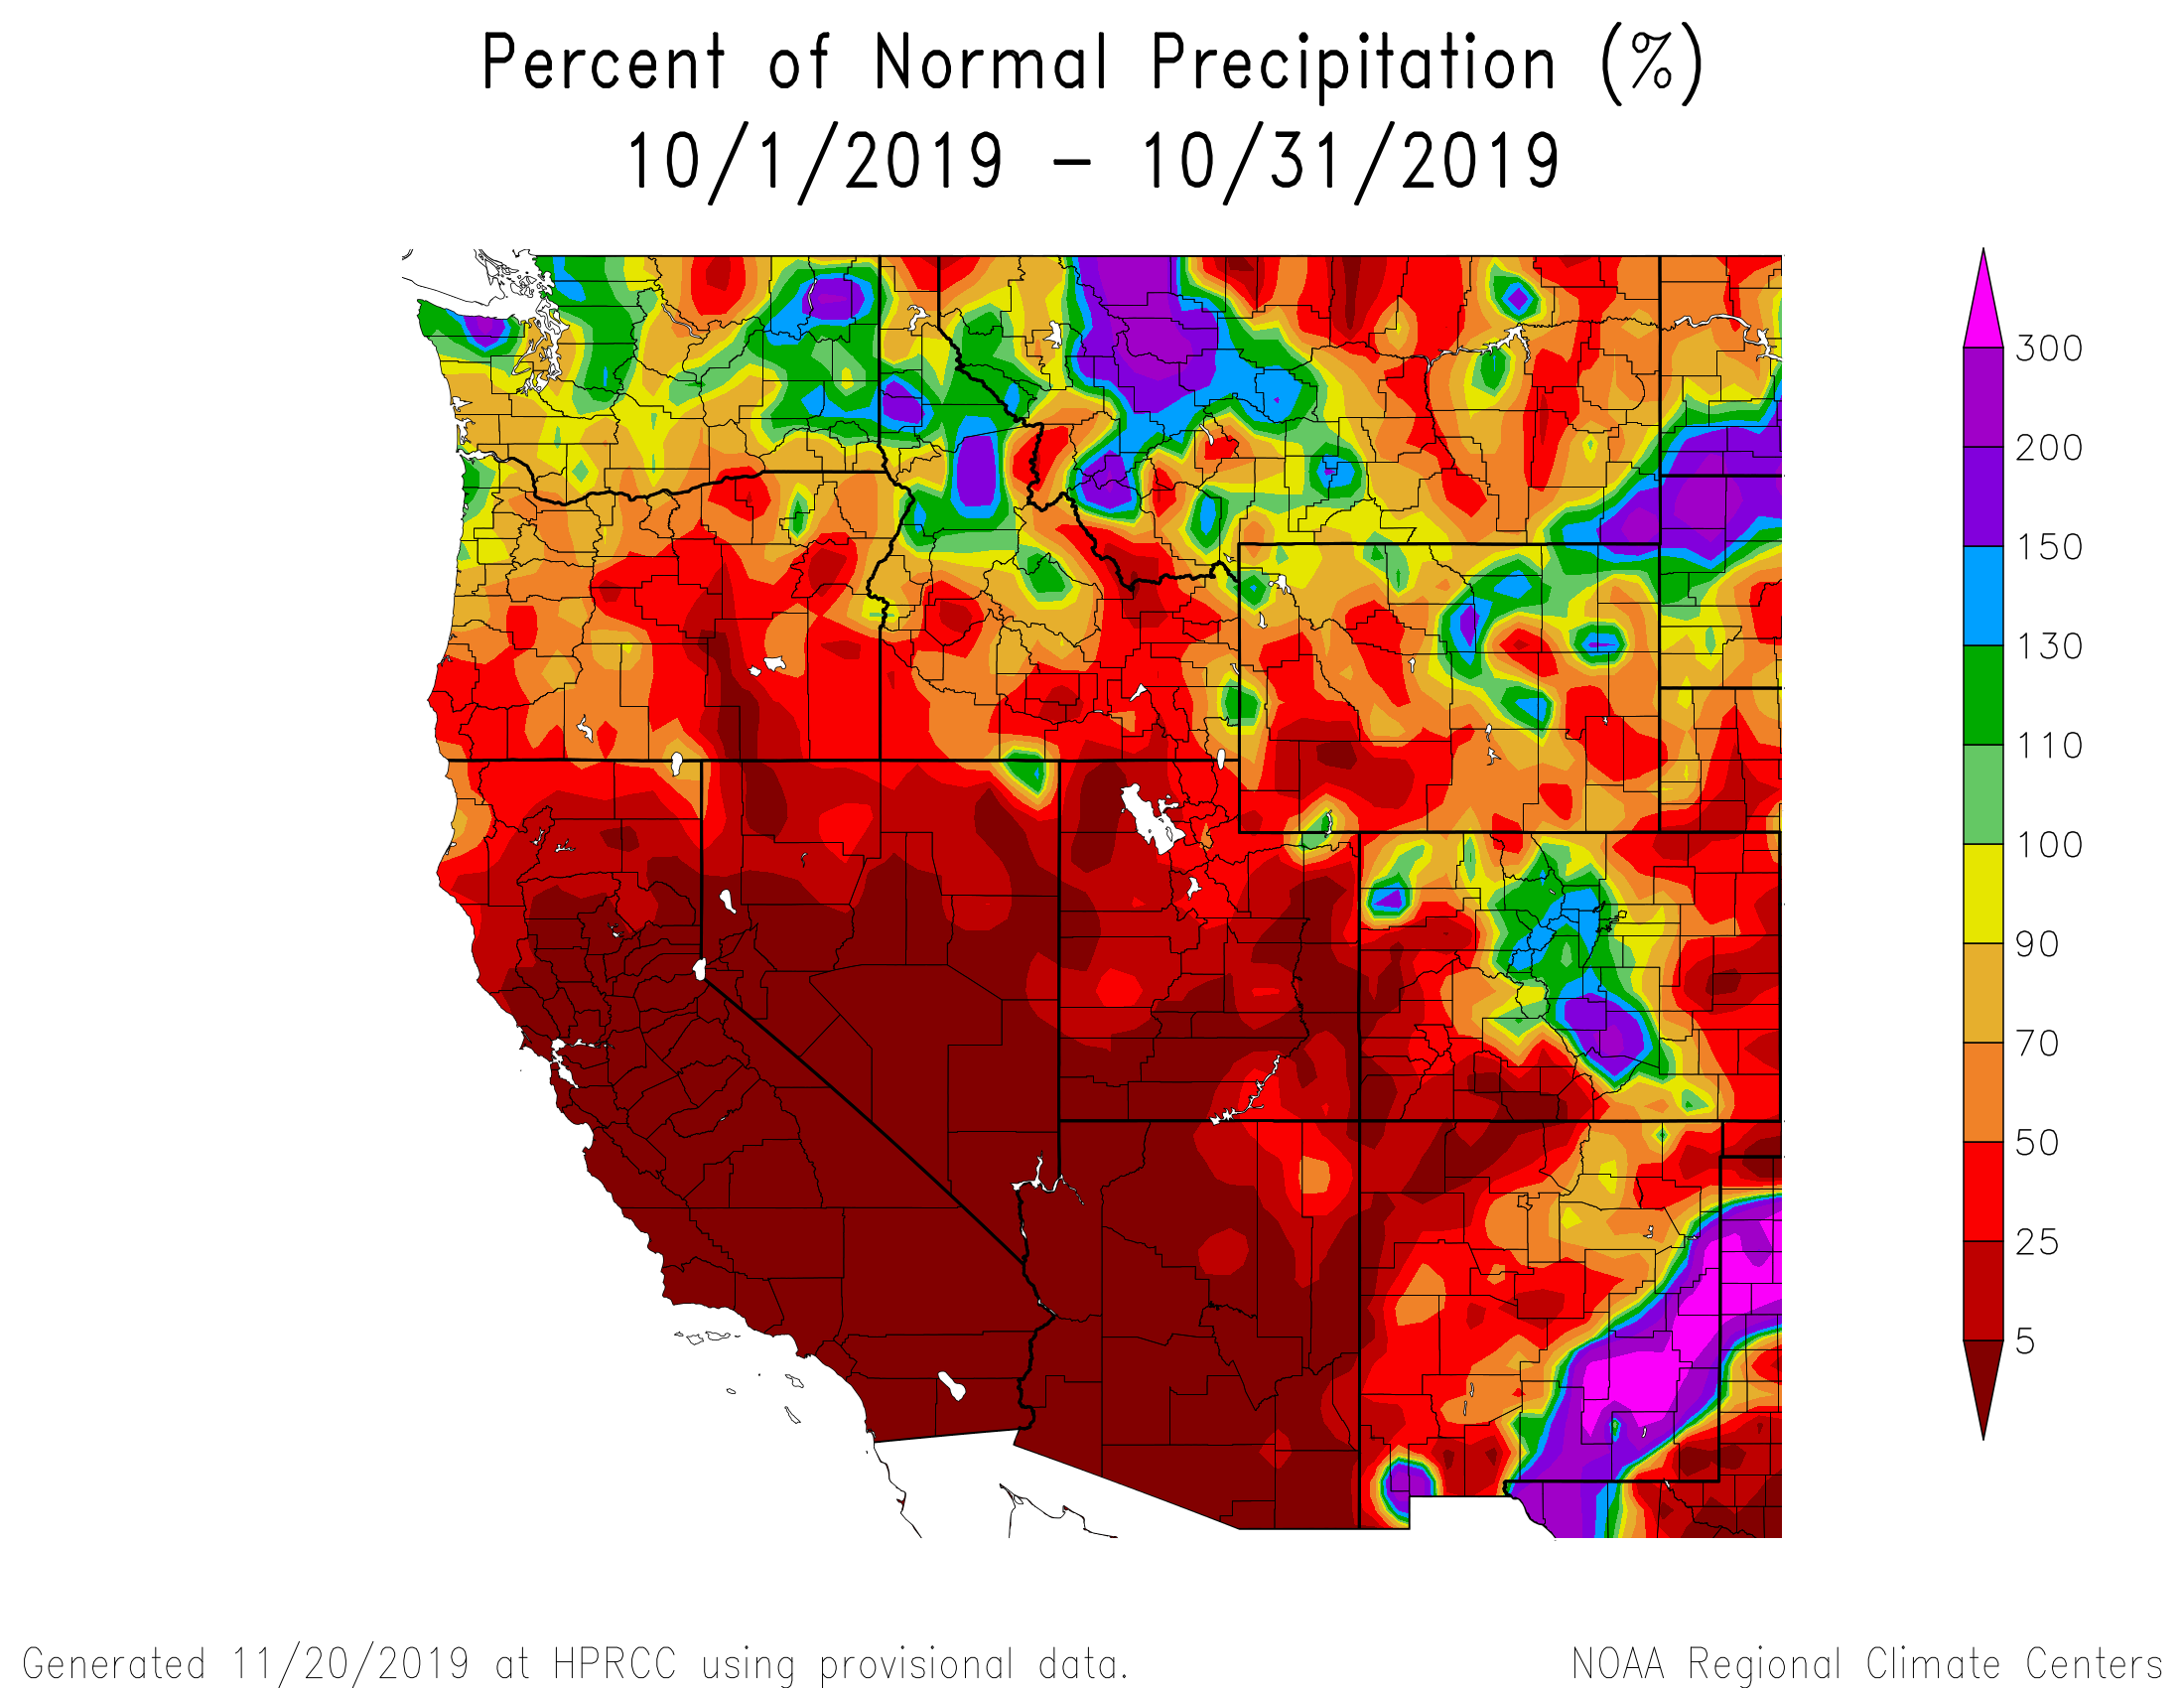
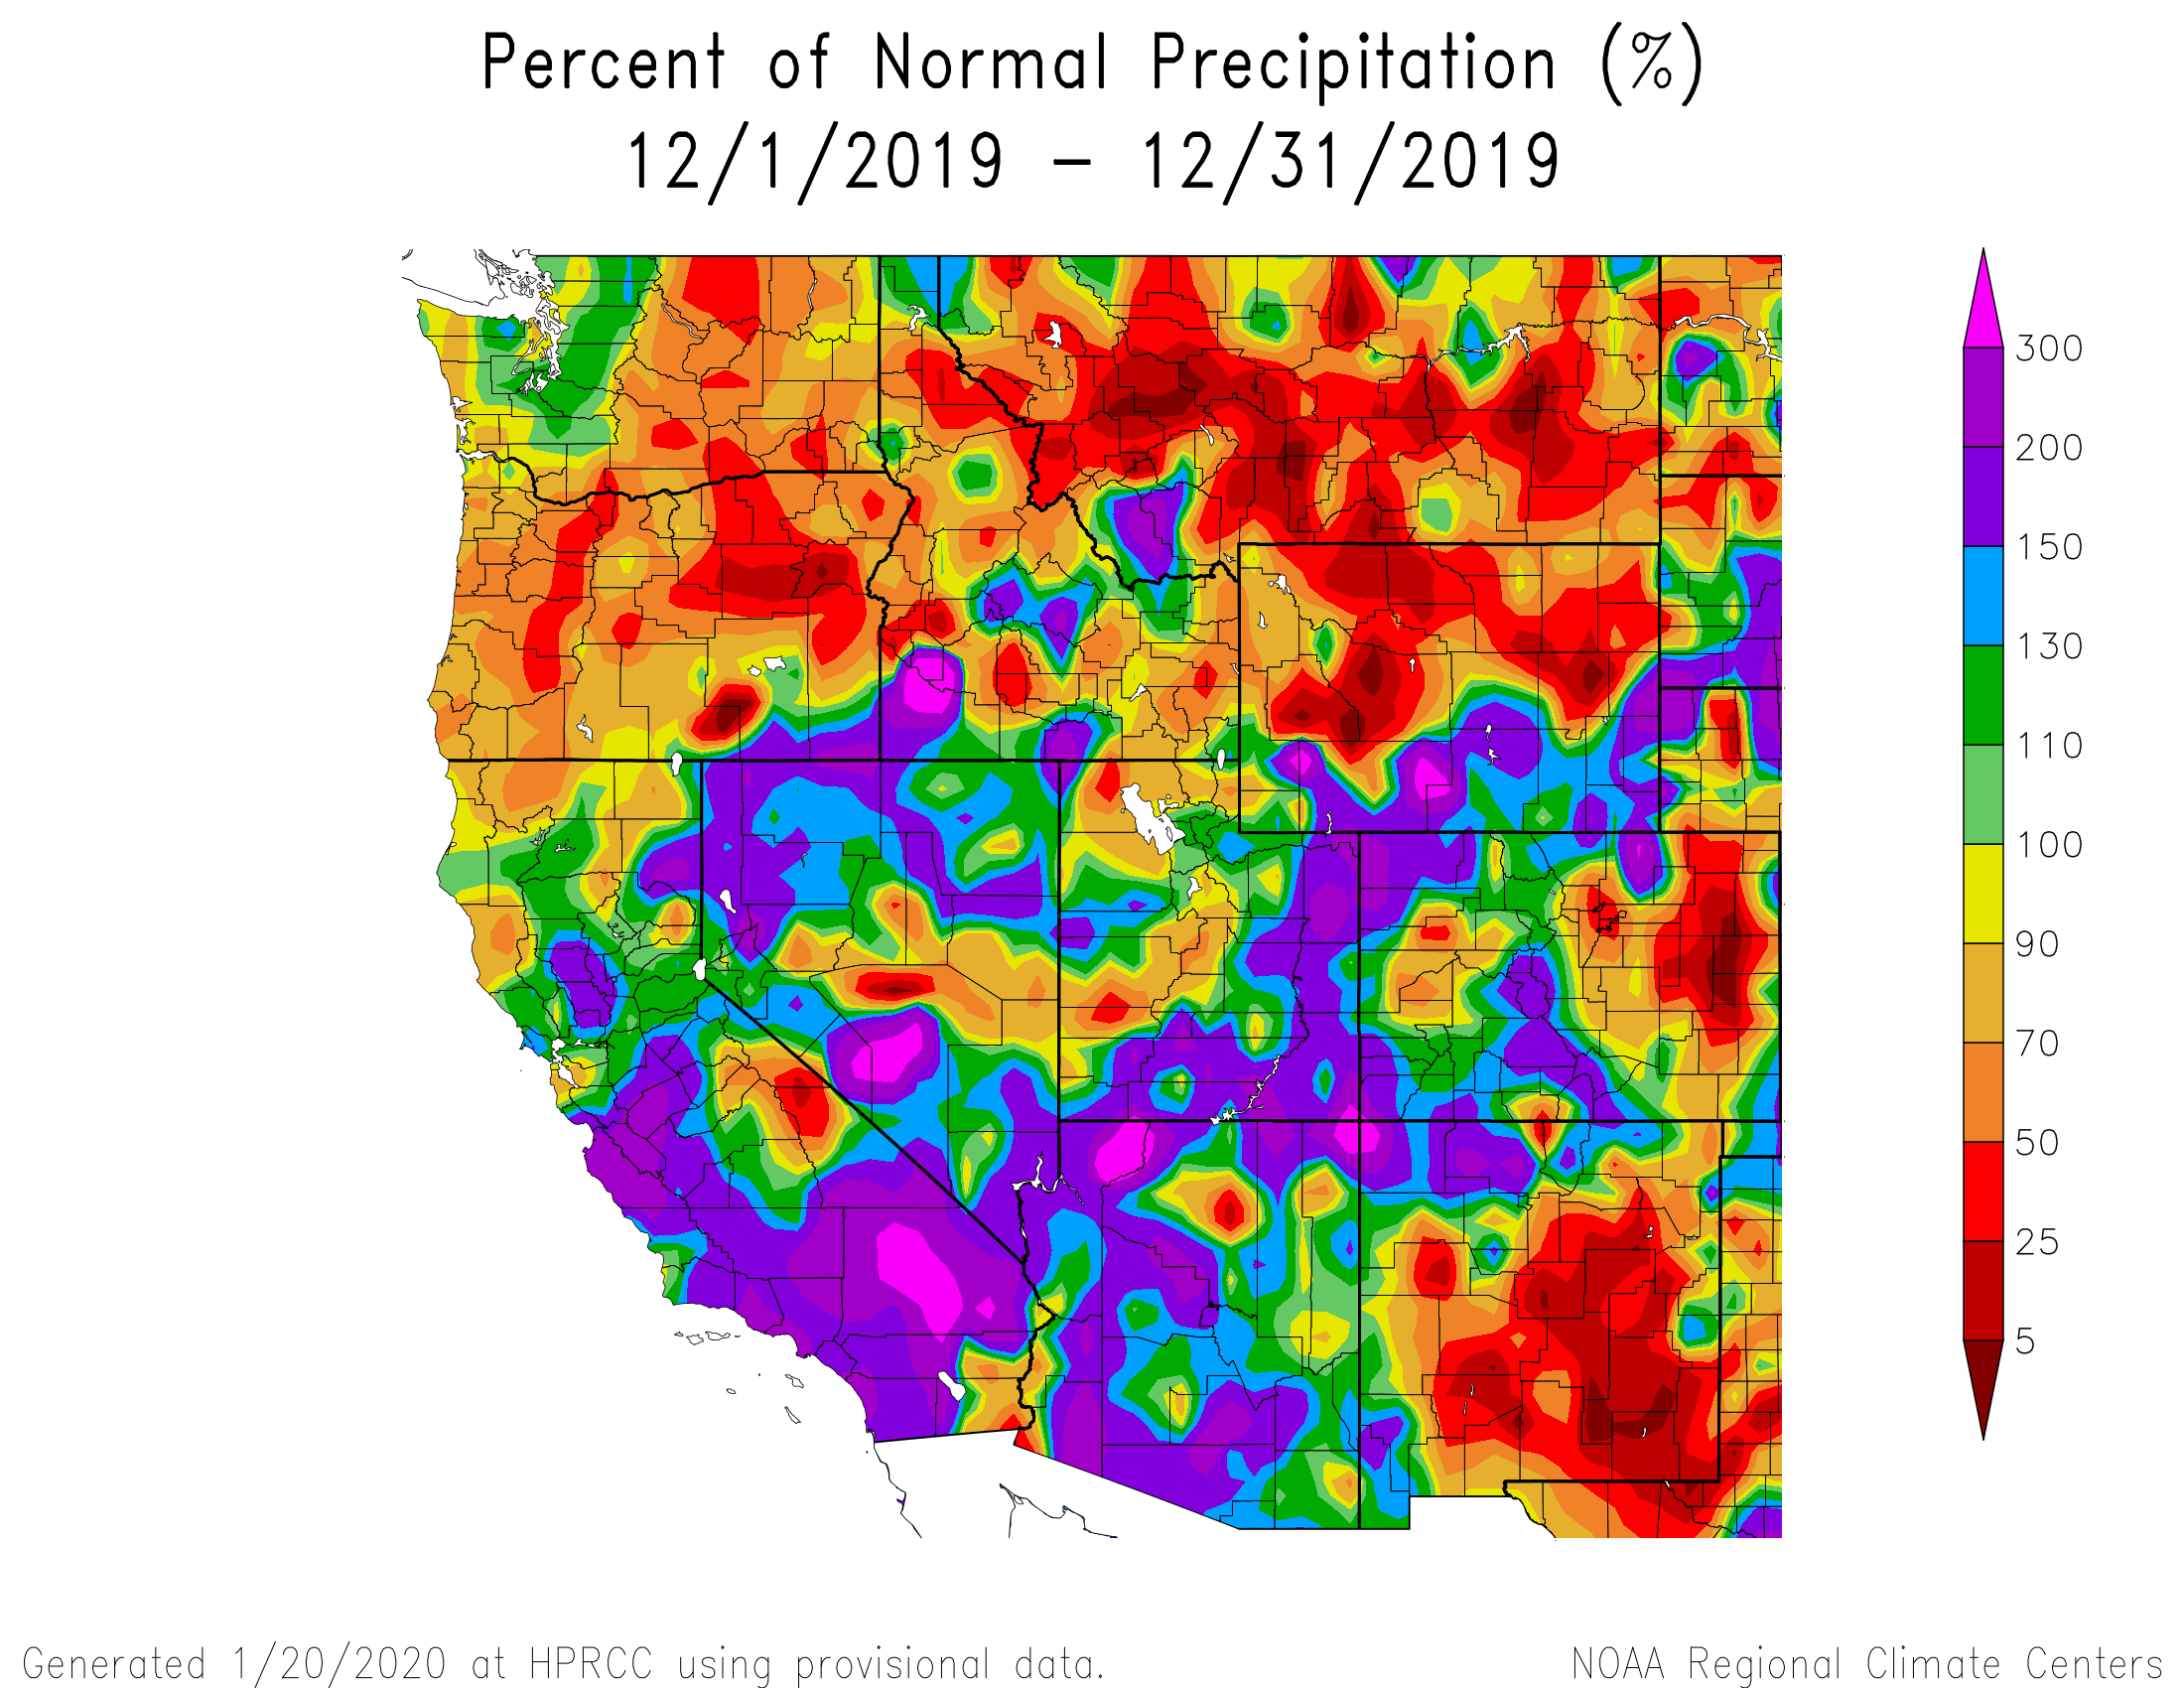
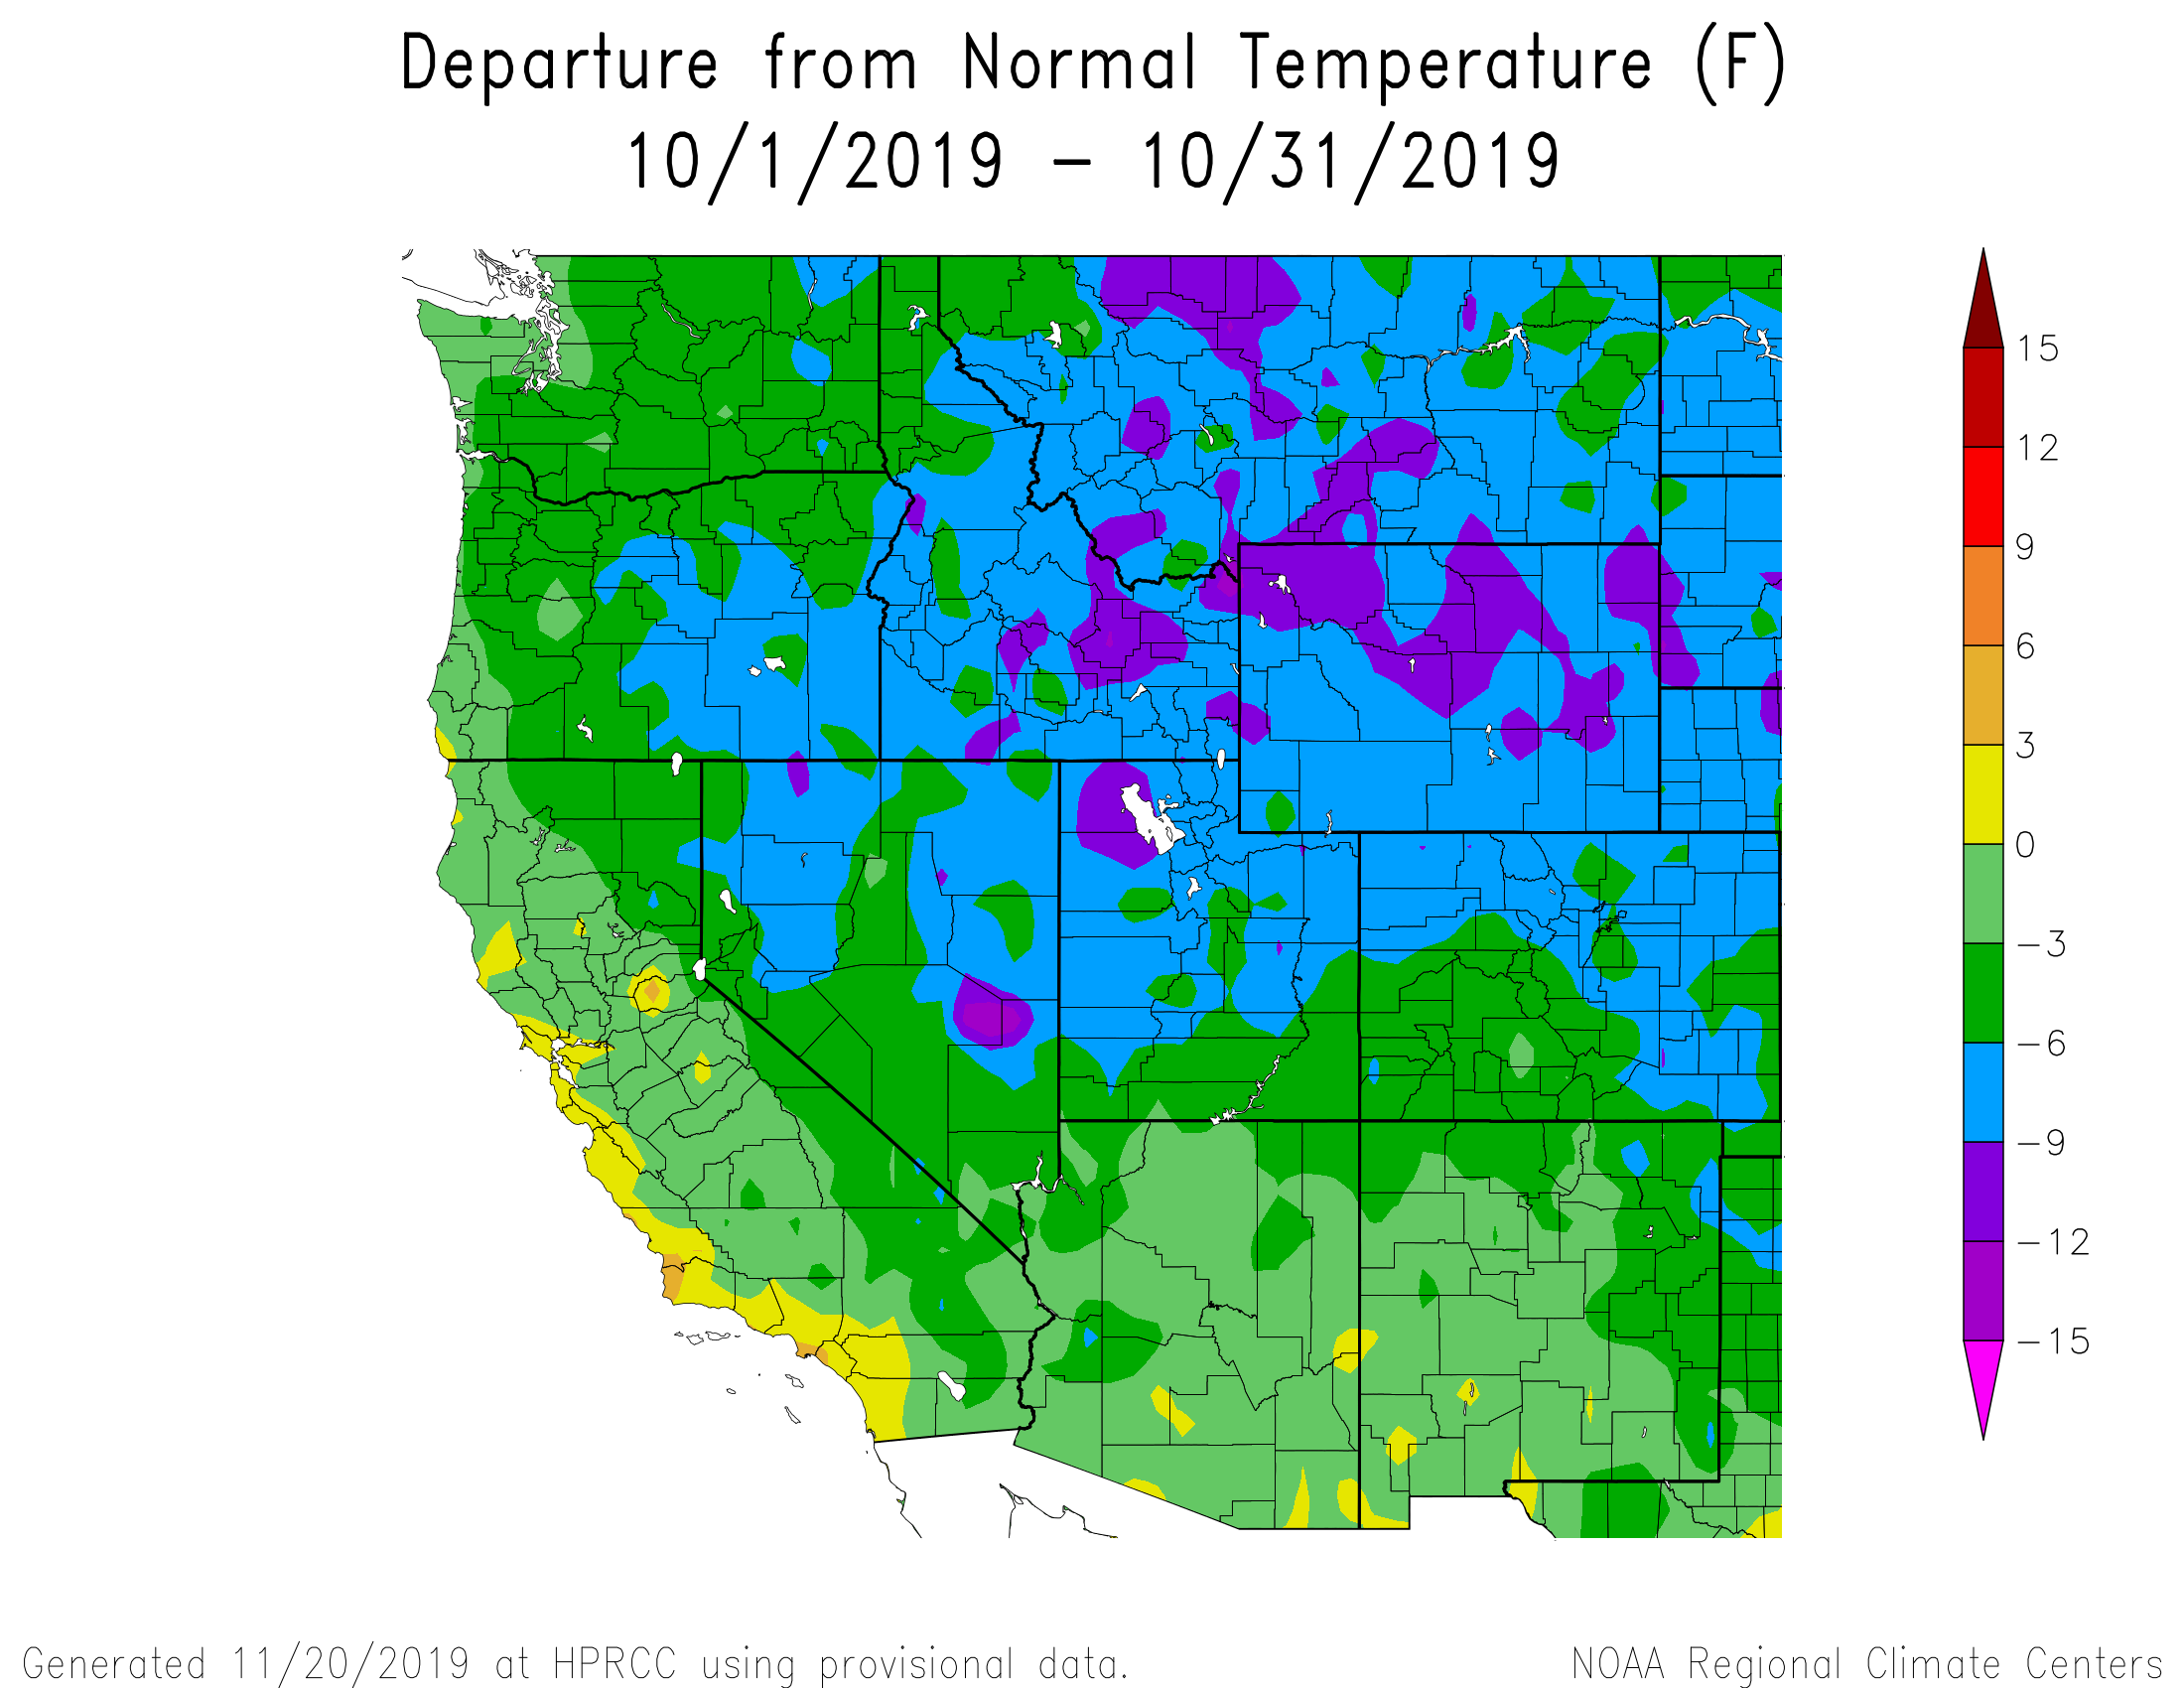
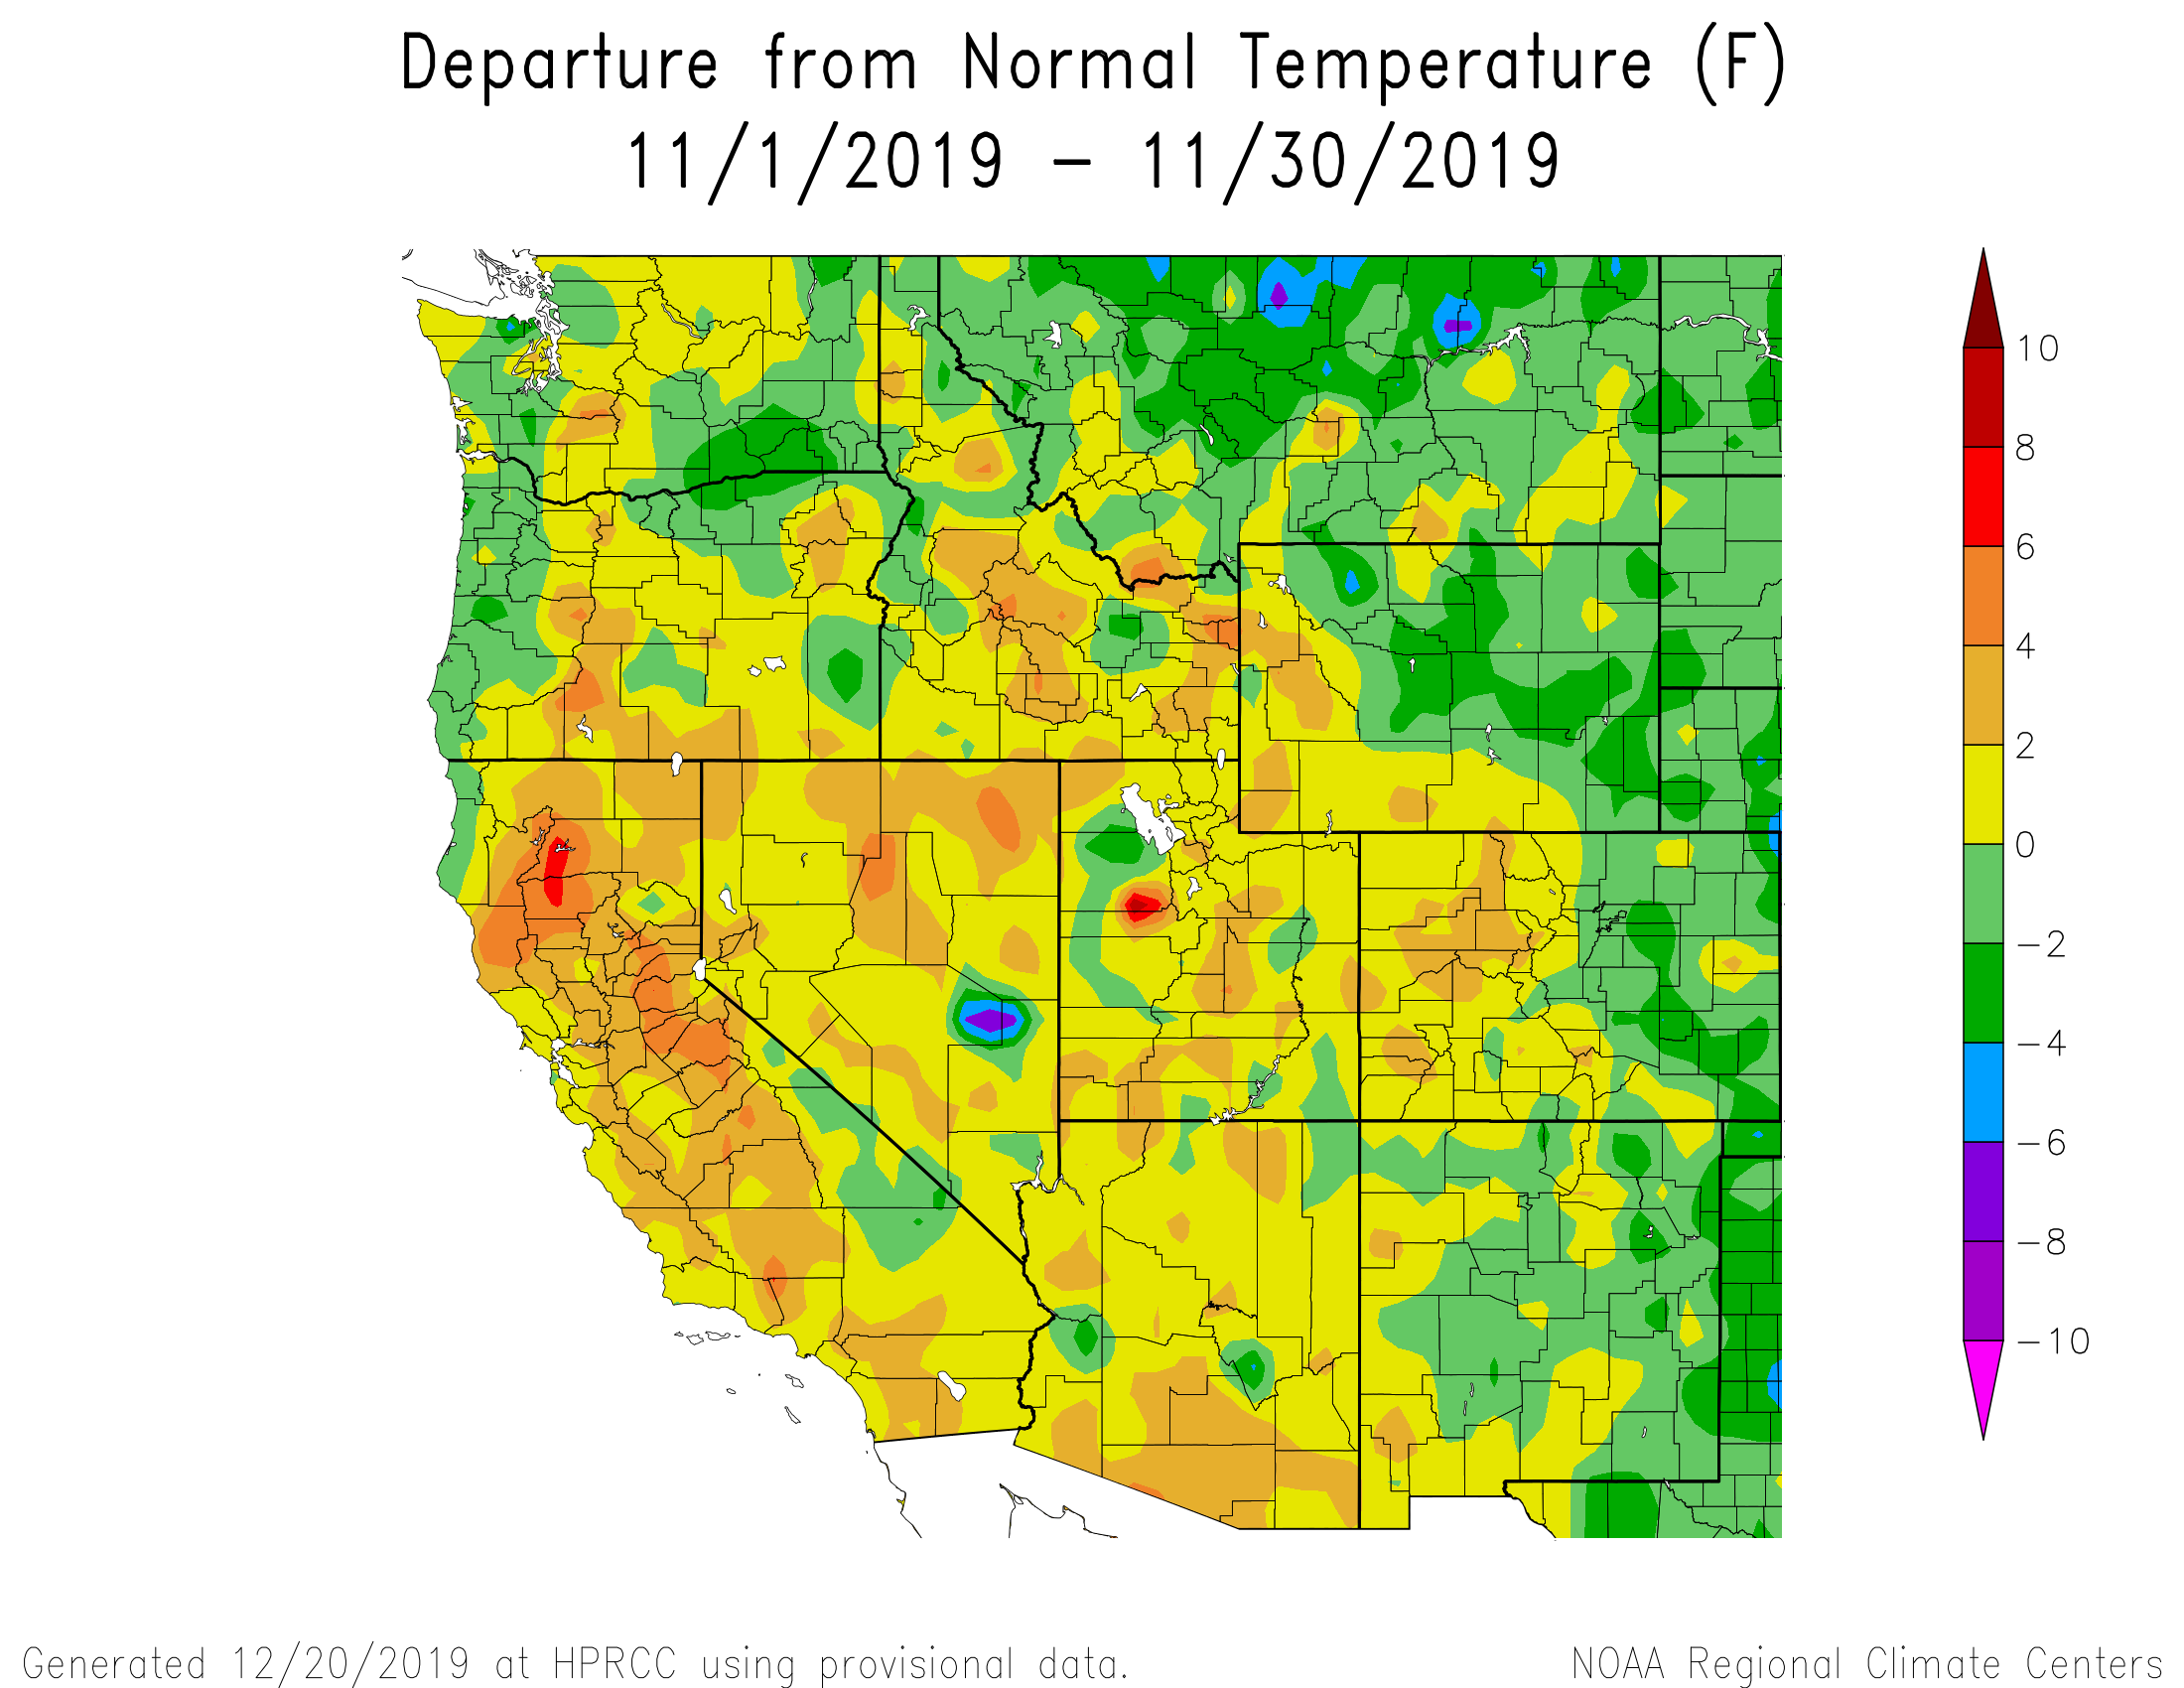
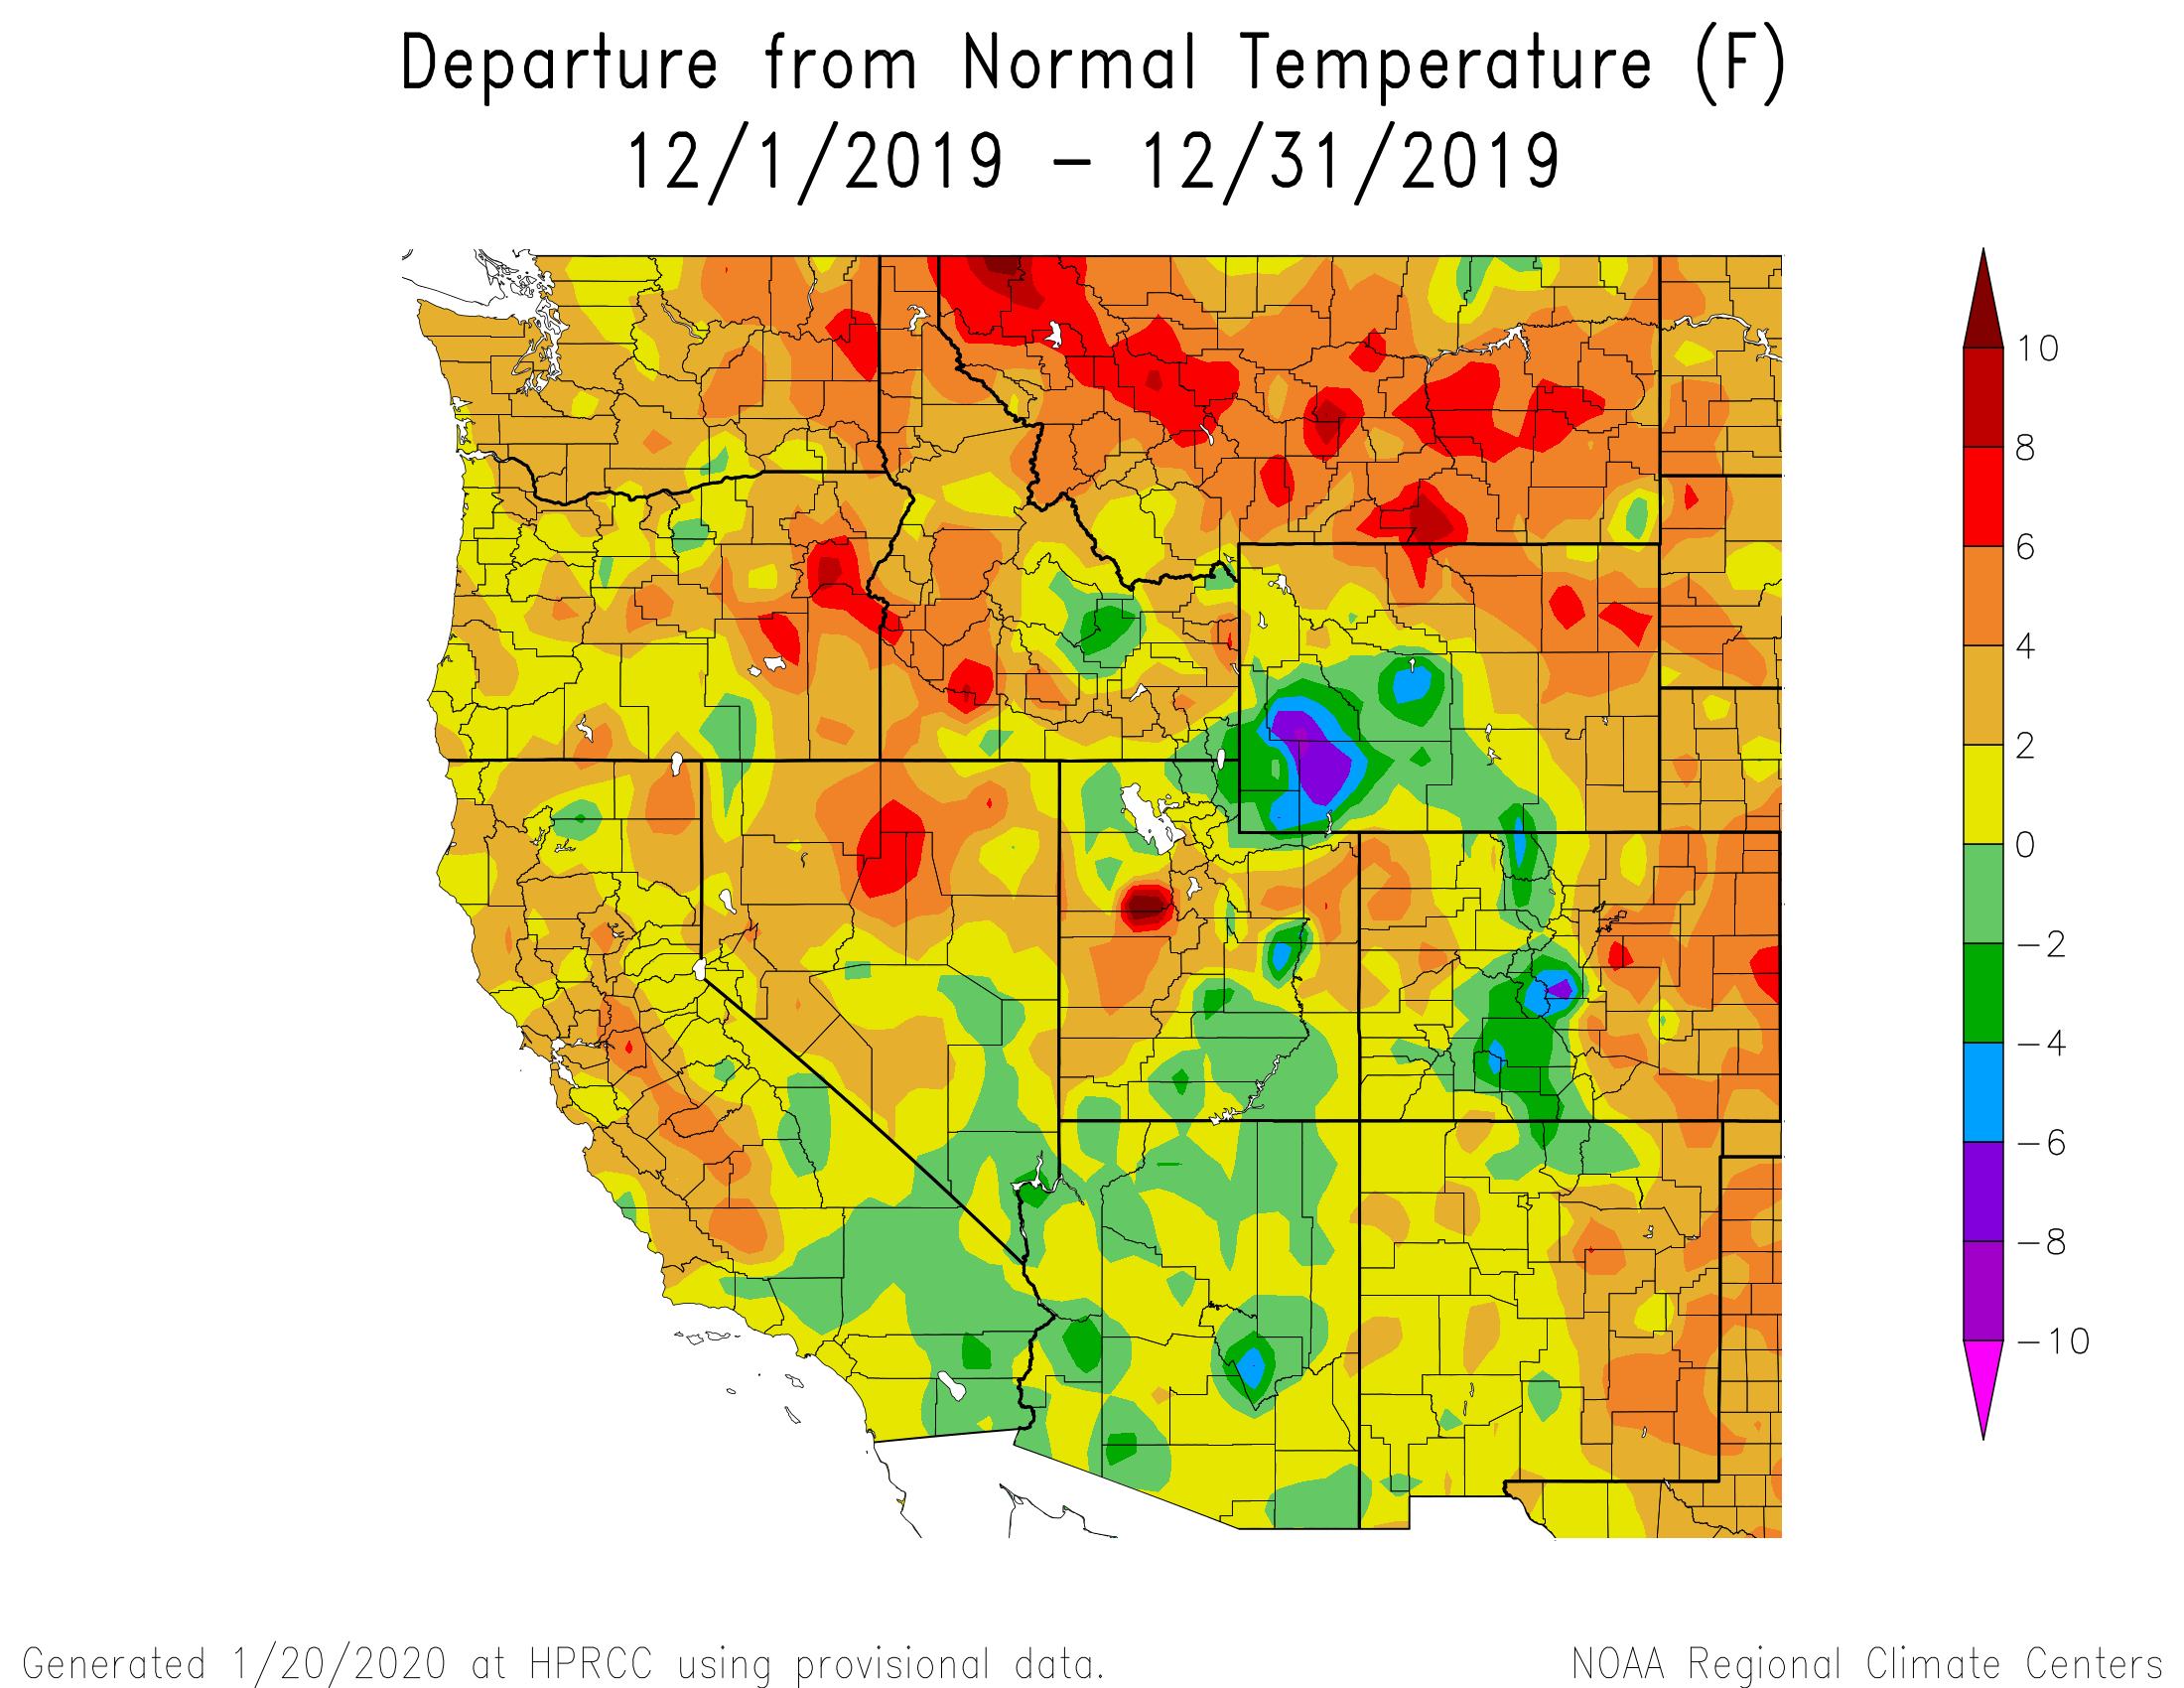
A dry and hot latter summer hastened drought conditions to return to most of Colorado as soil moisture was depleted and plant stress intensified. Going into Autumn there was very little precipitation but when precipitation did finally start to come it was late enough in the season that it stuck around adding to the accumulation of the snowpack. To where, by January in Southwest Colorado for example, precipitation was 87% of normal but SWE was 105%. This early season condition translated to a healthy snowpack but persistent drought conditions, although the severity has lessened somewhat since early season. Currently, most of Western, Southern, and Eastern Colorado are under moderate drought conditions. The amount of snow we receive the remainder of this snow season and springtime melting of the snowpack, replenishing soil moisture conditions, will determine how much the drought is alleviated and to what extent.
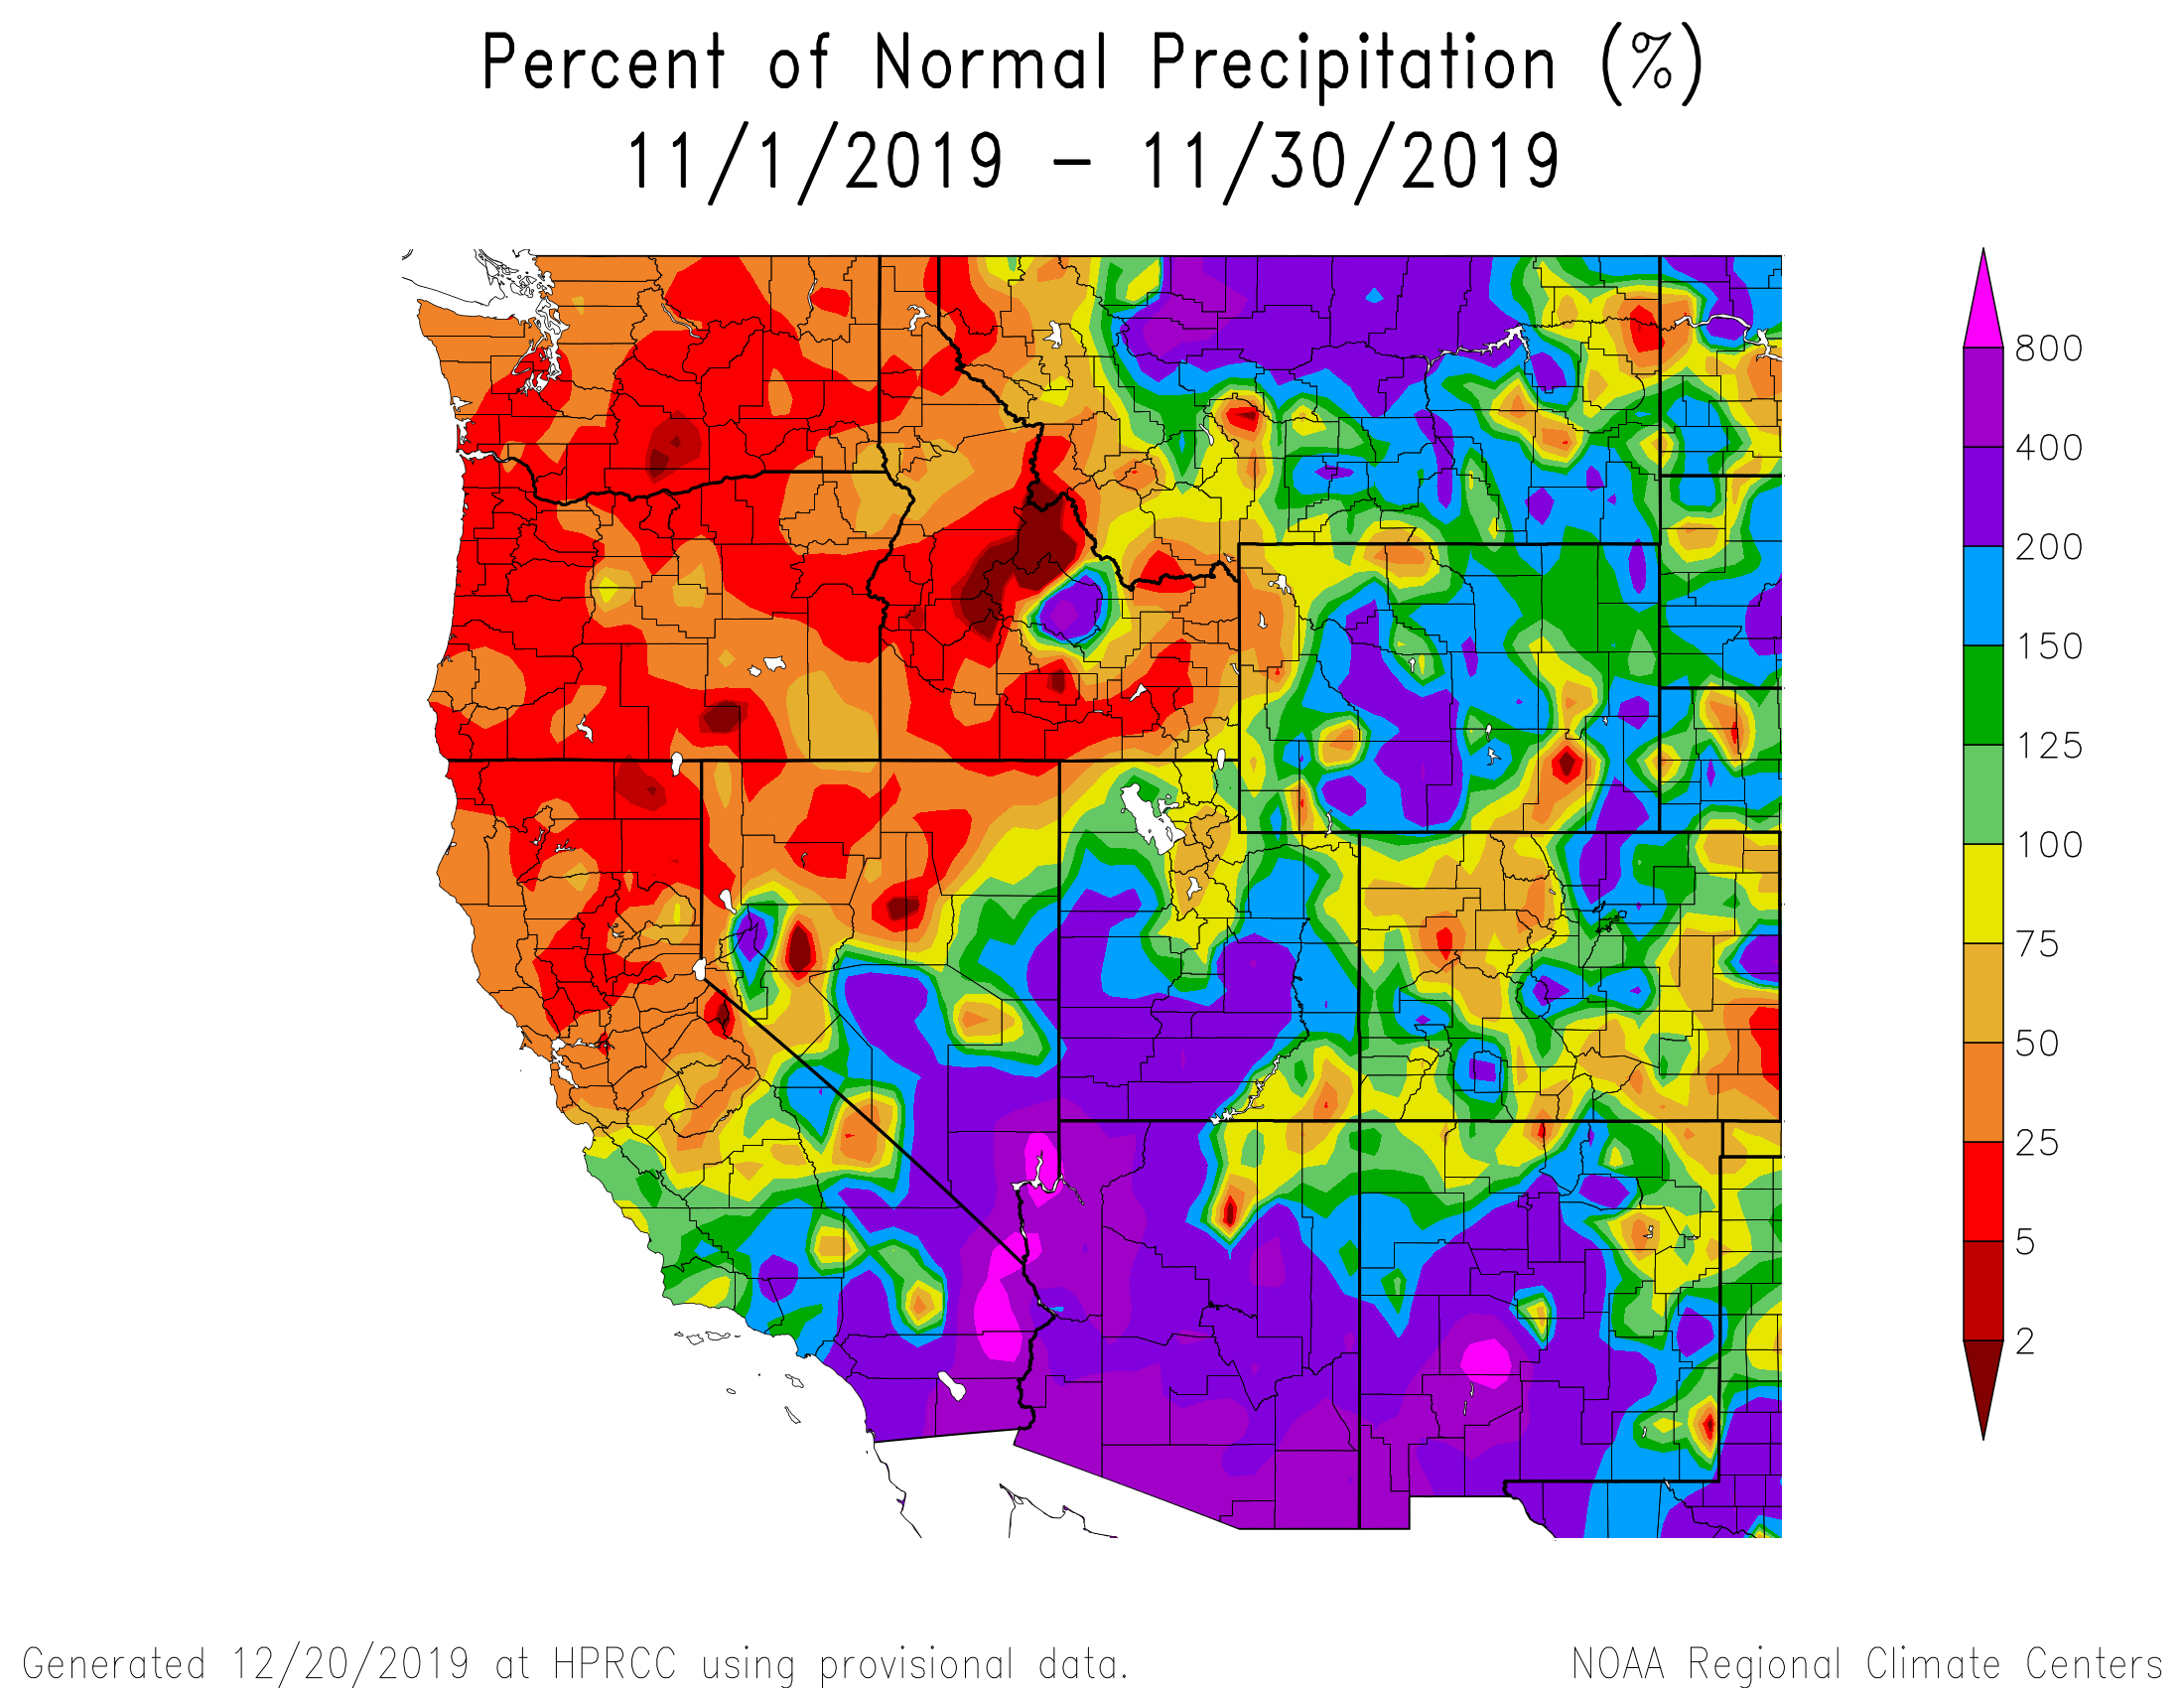
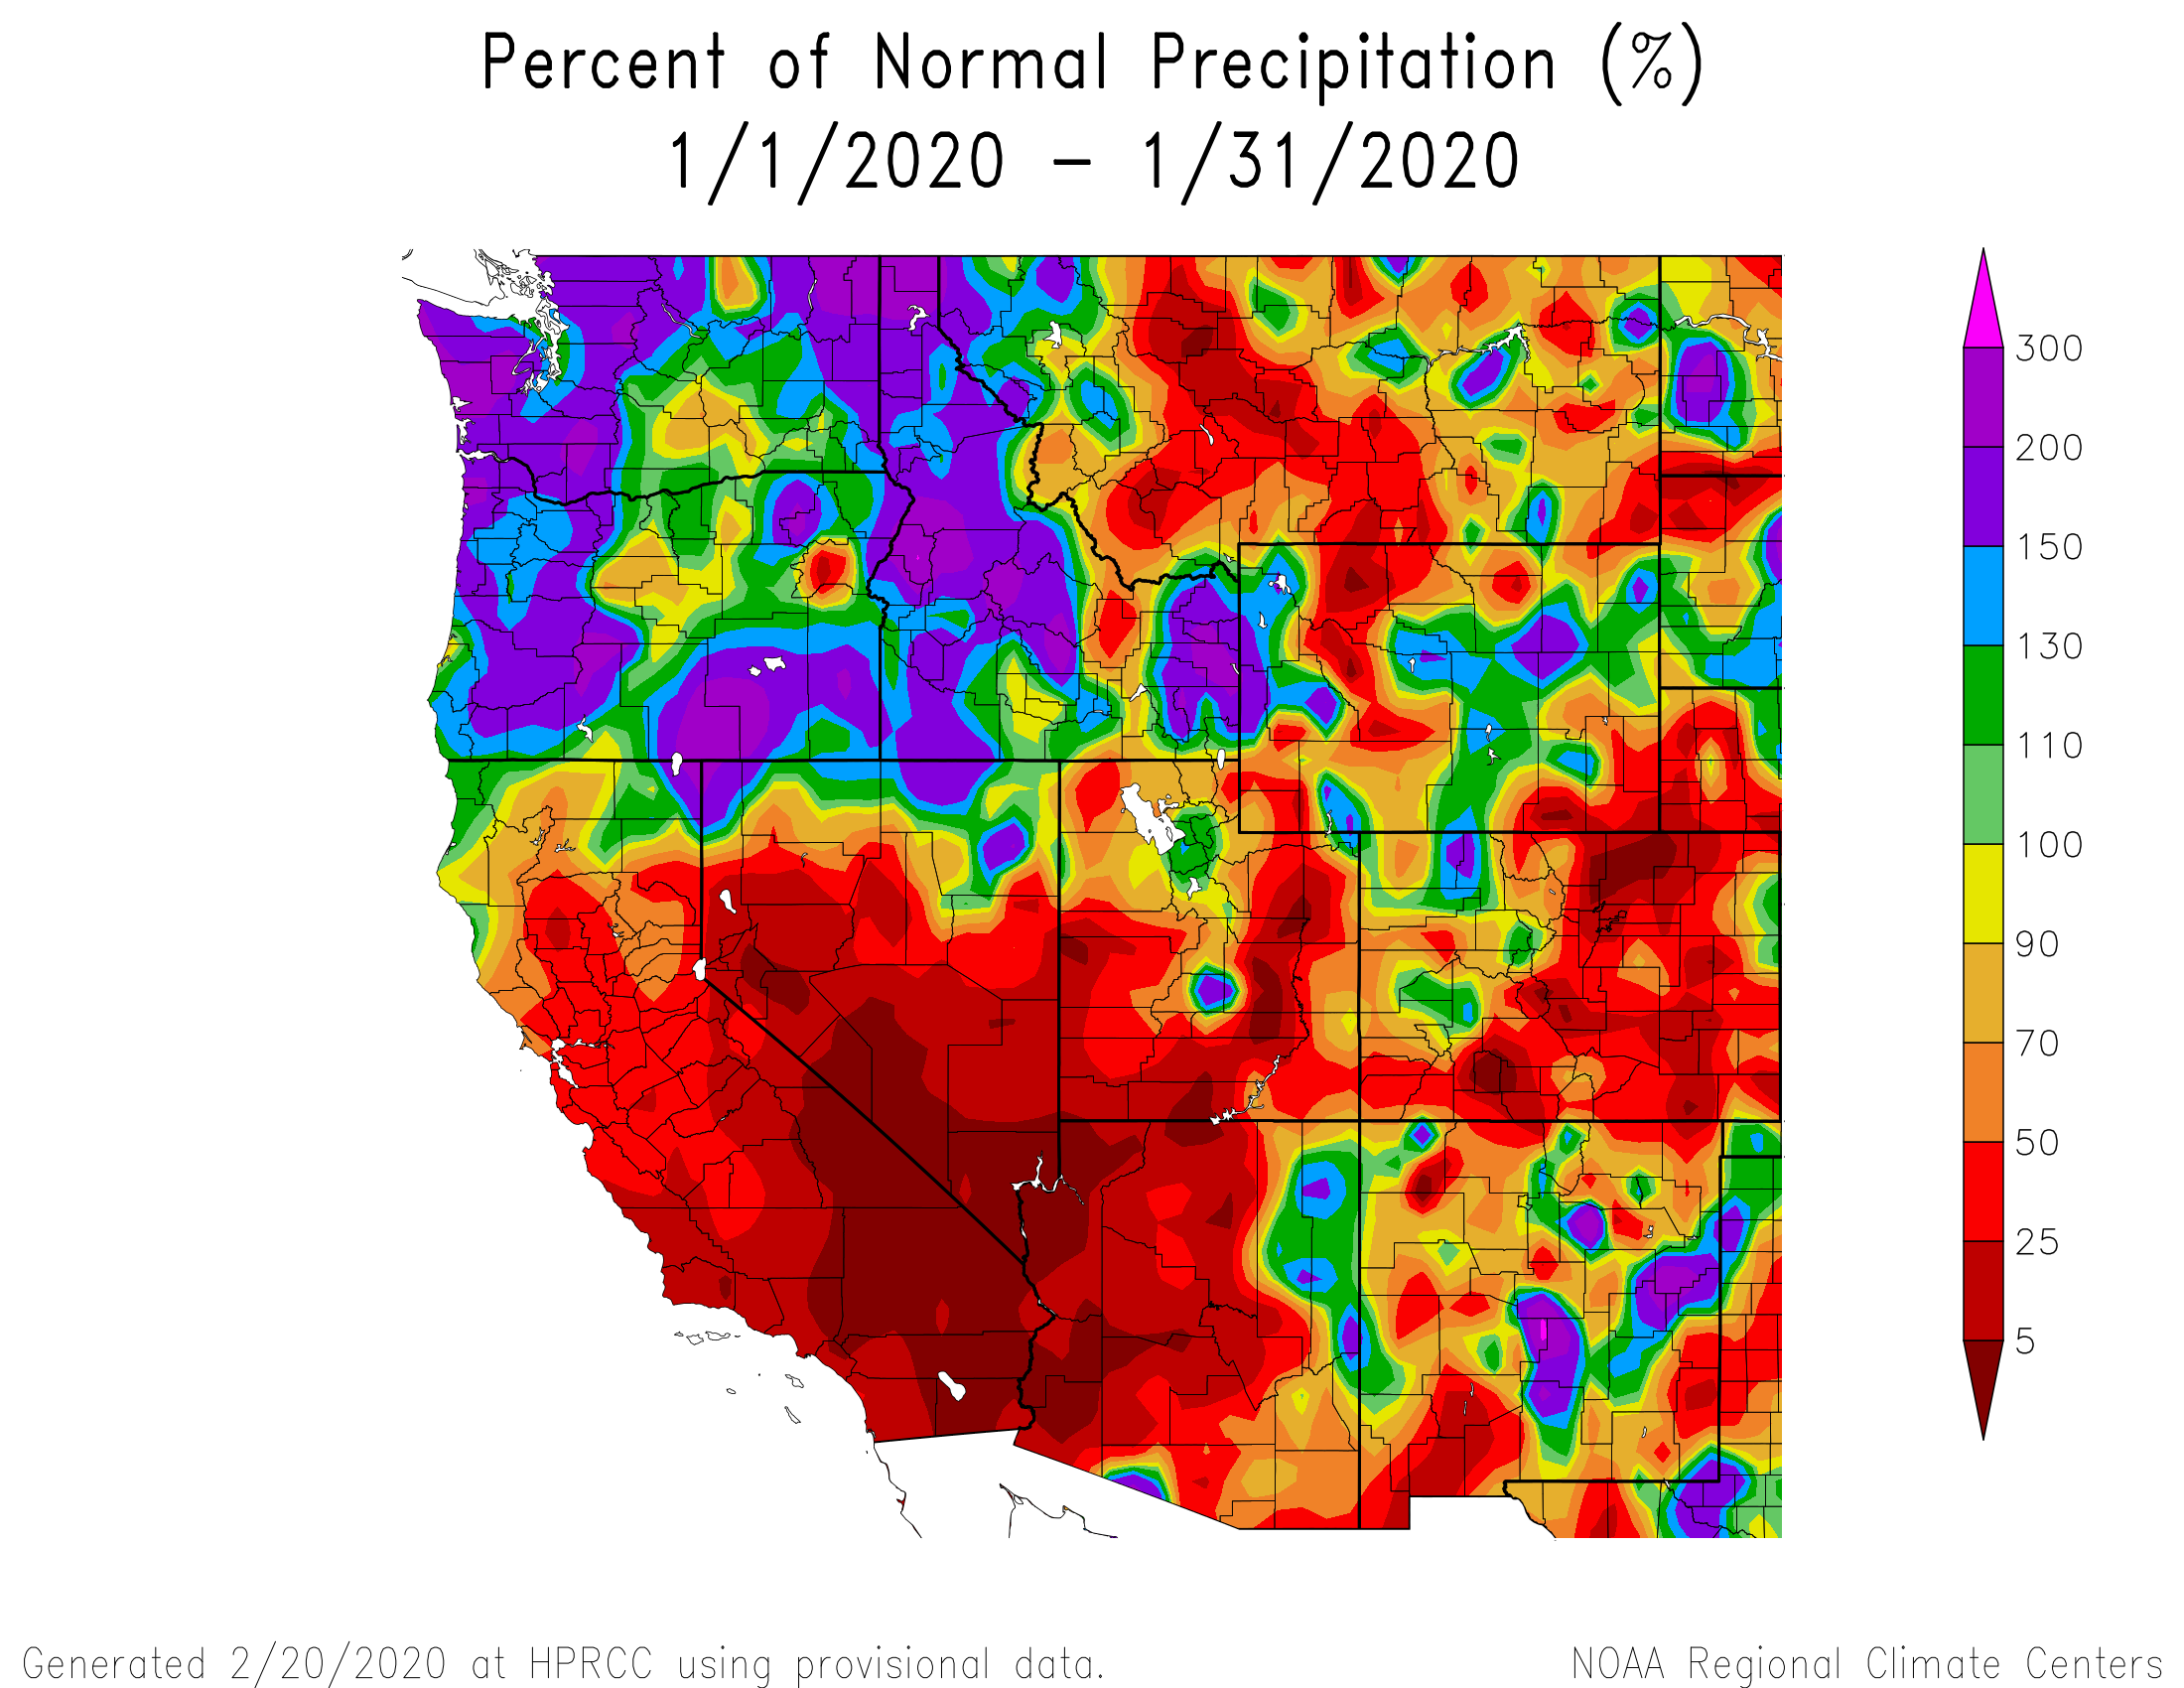
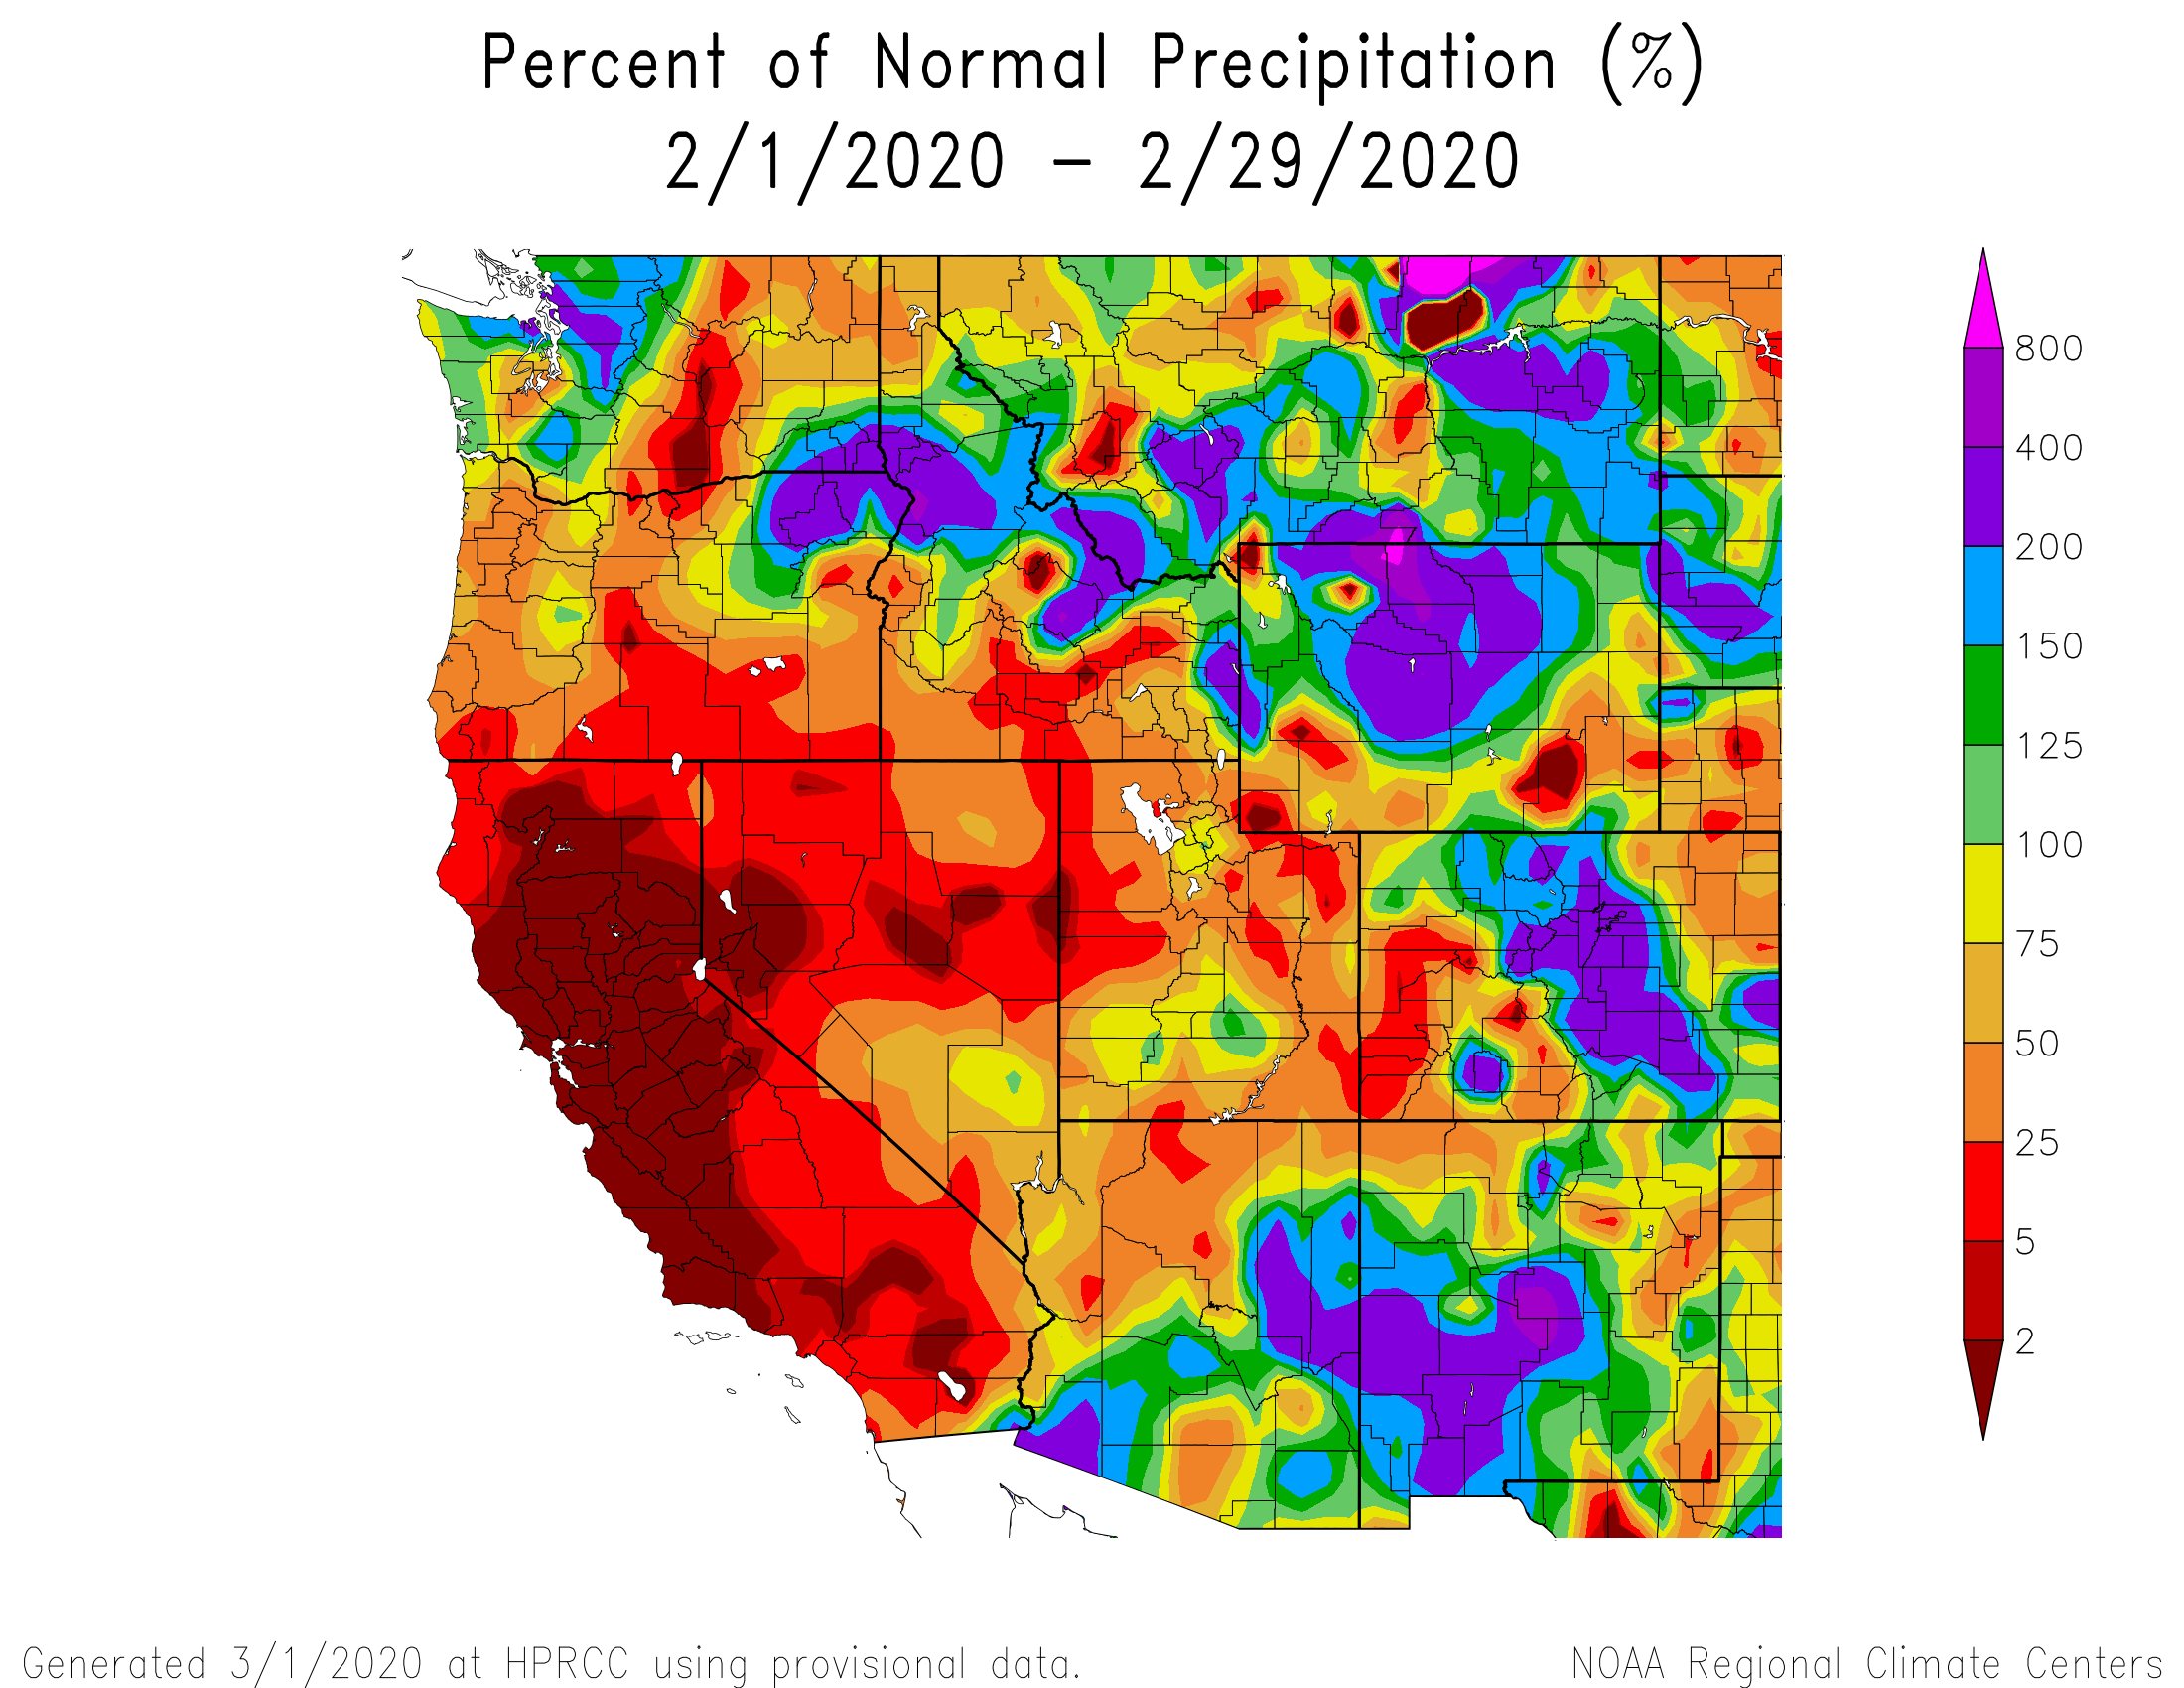
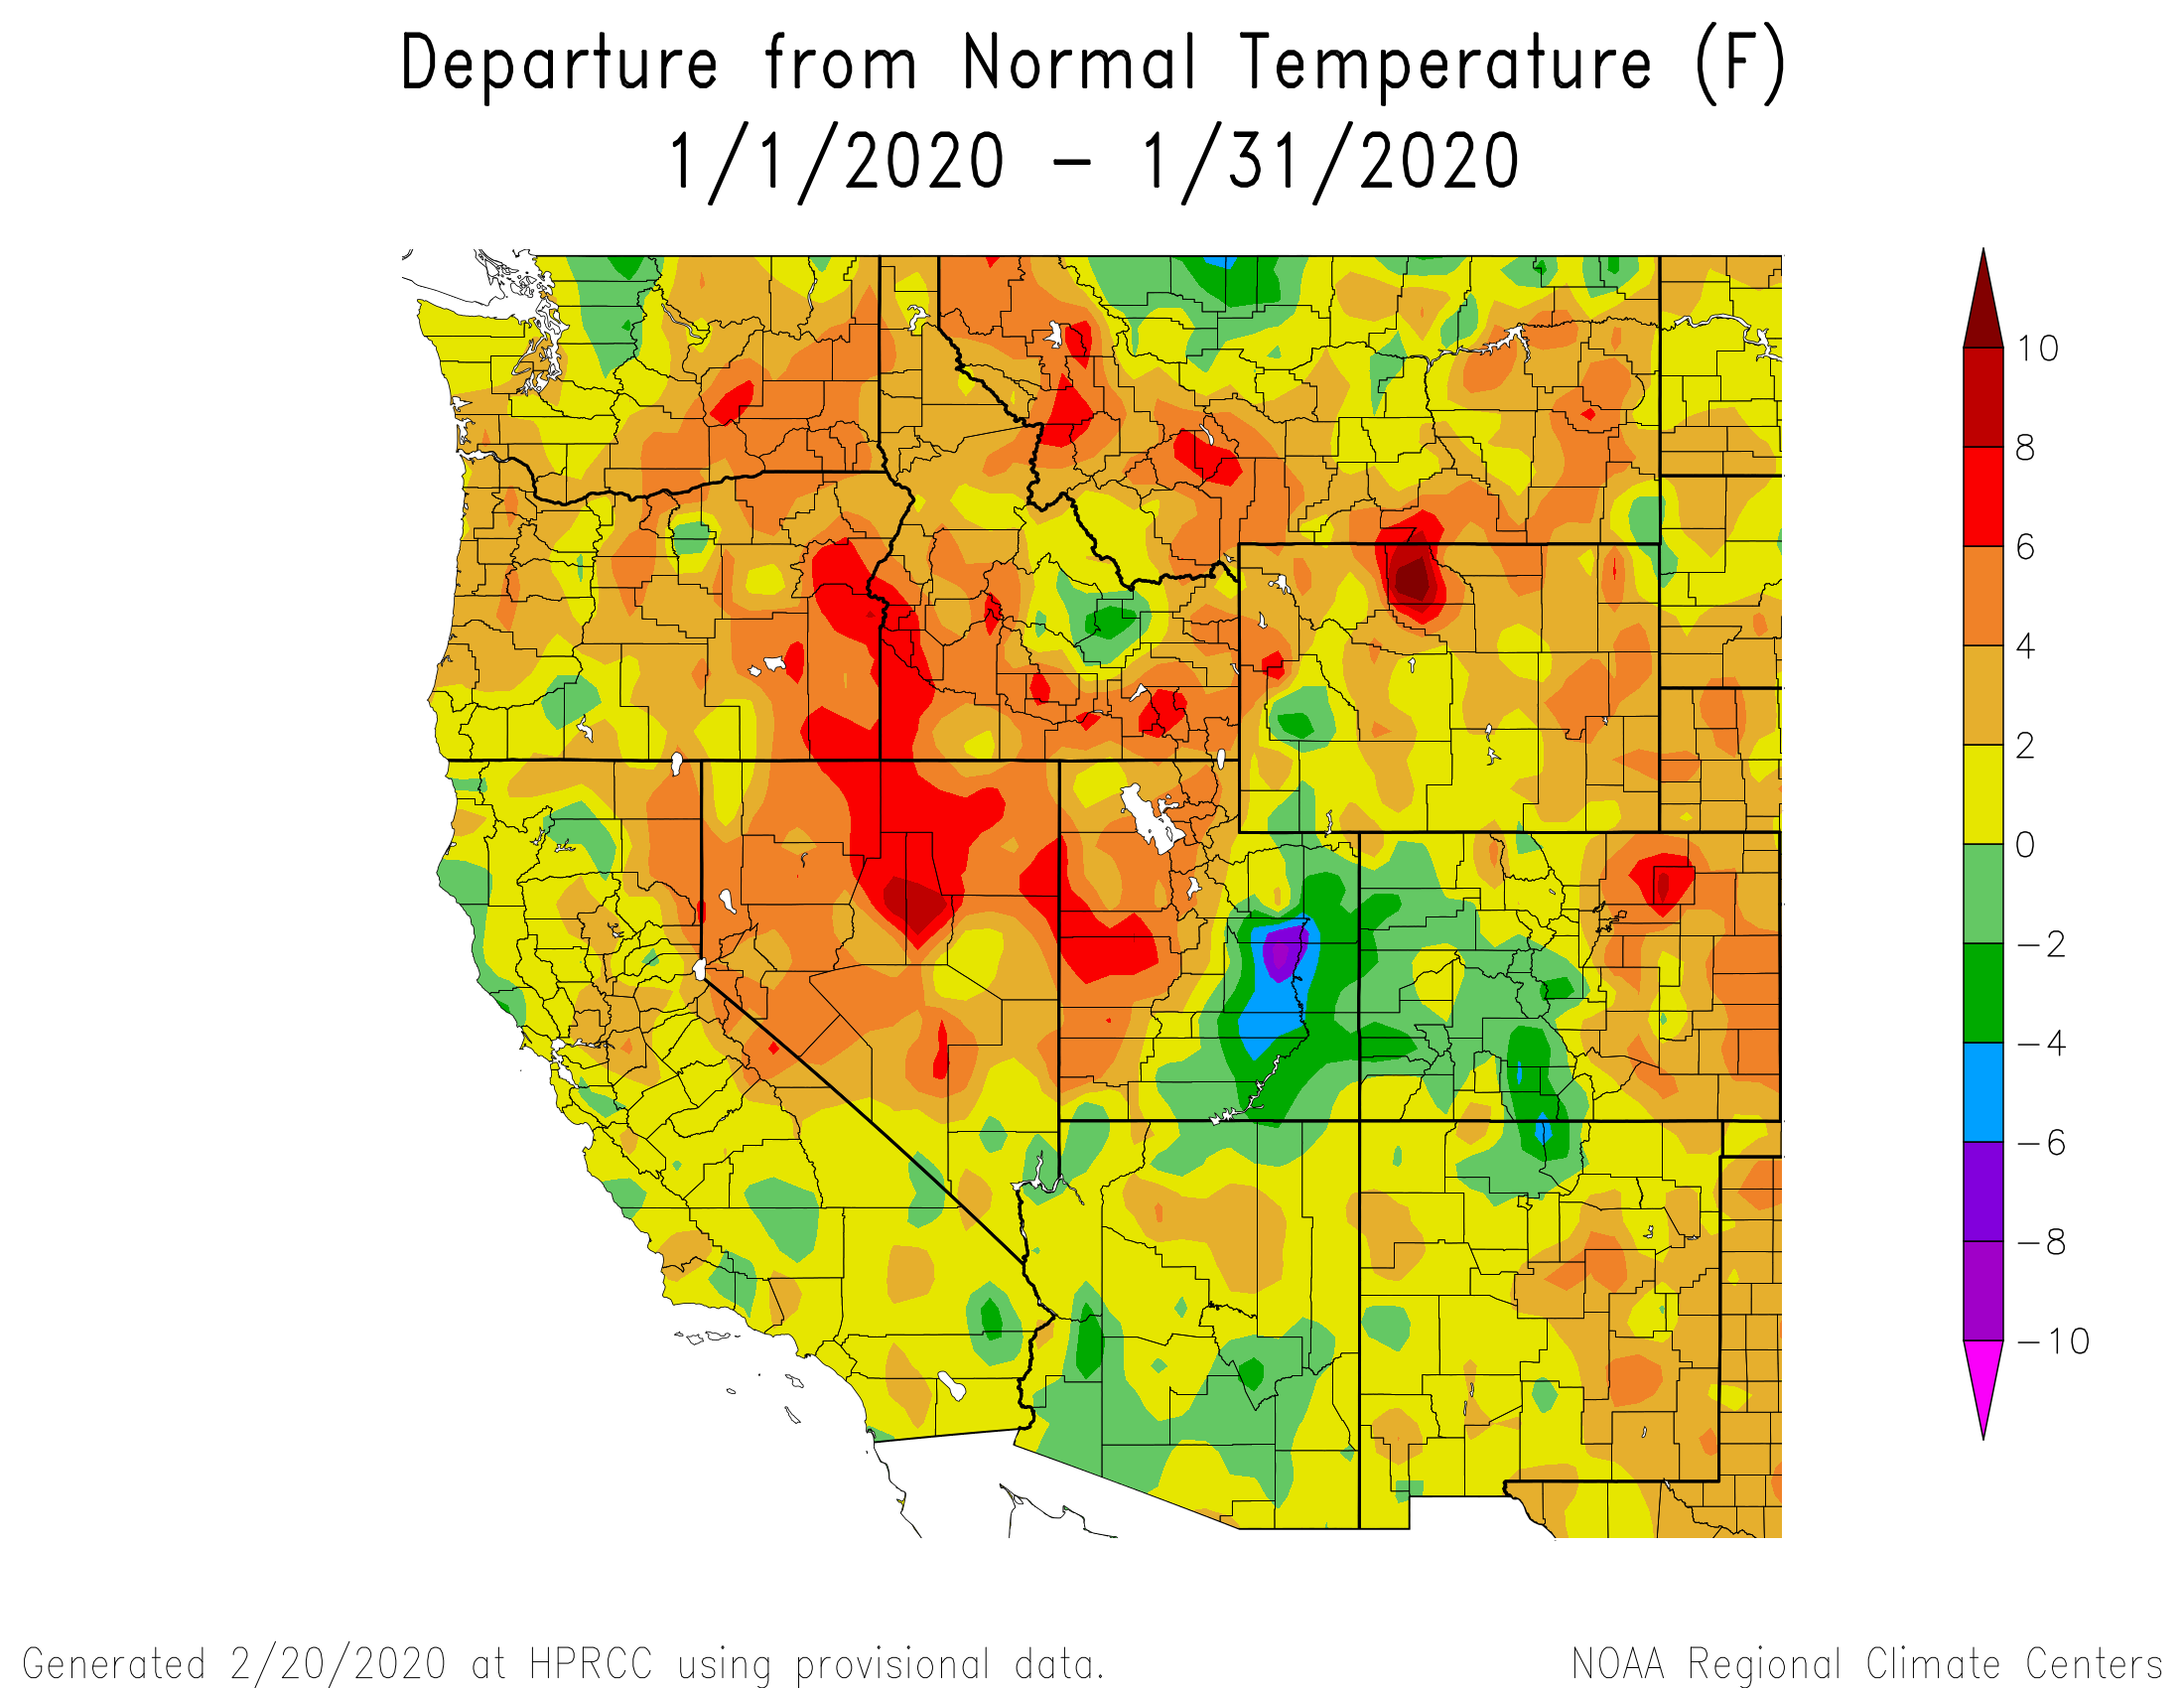
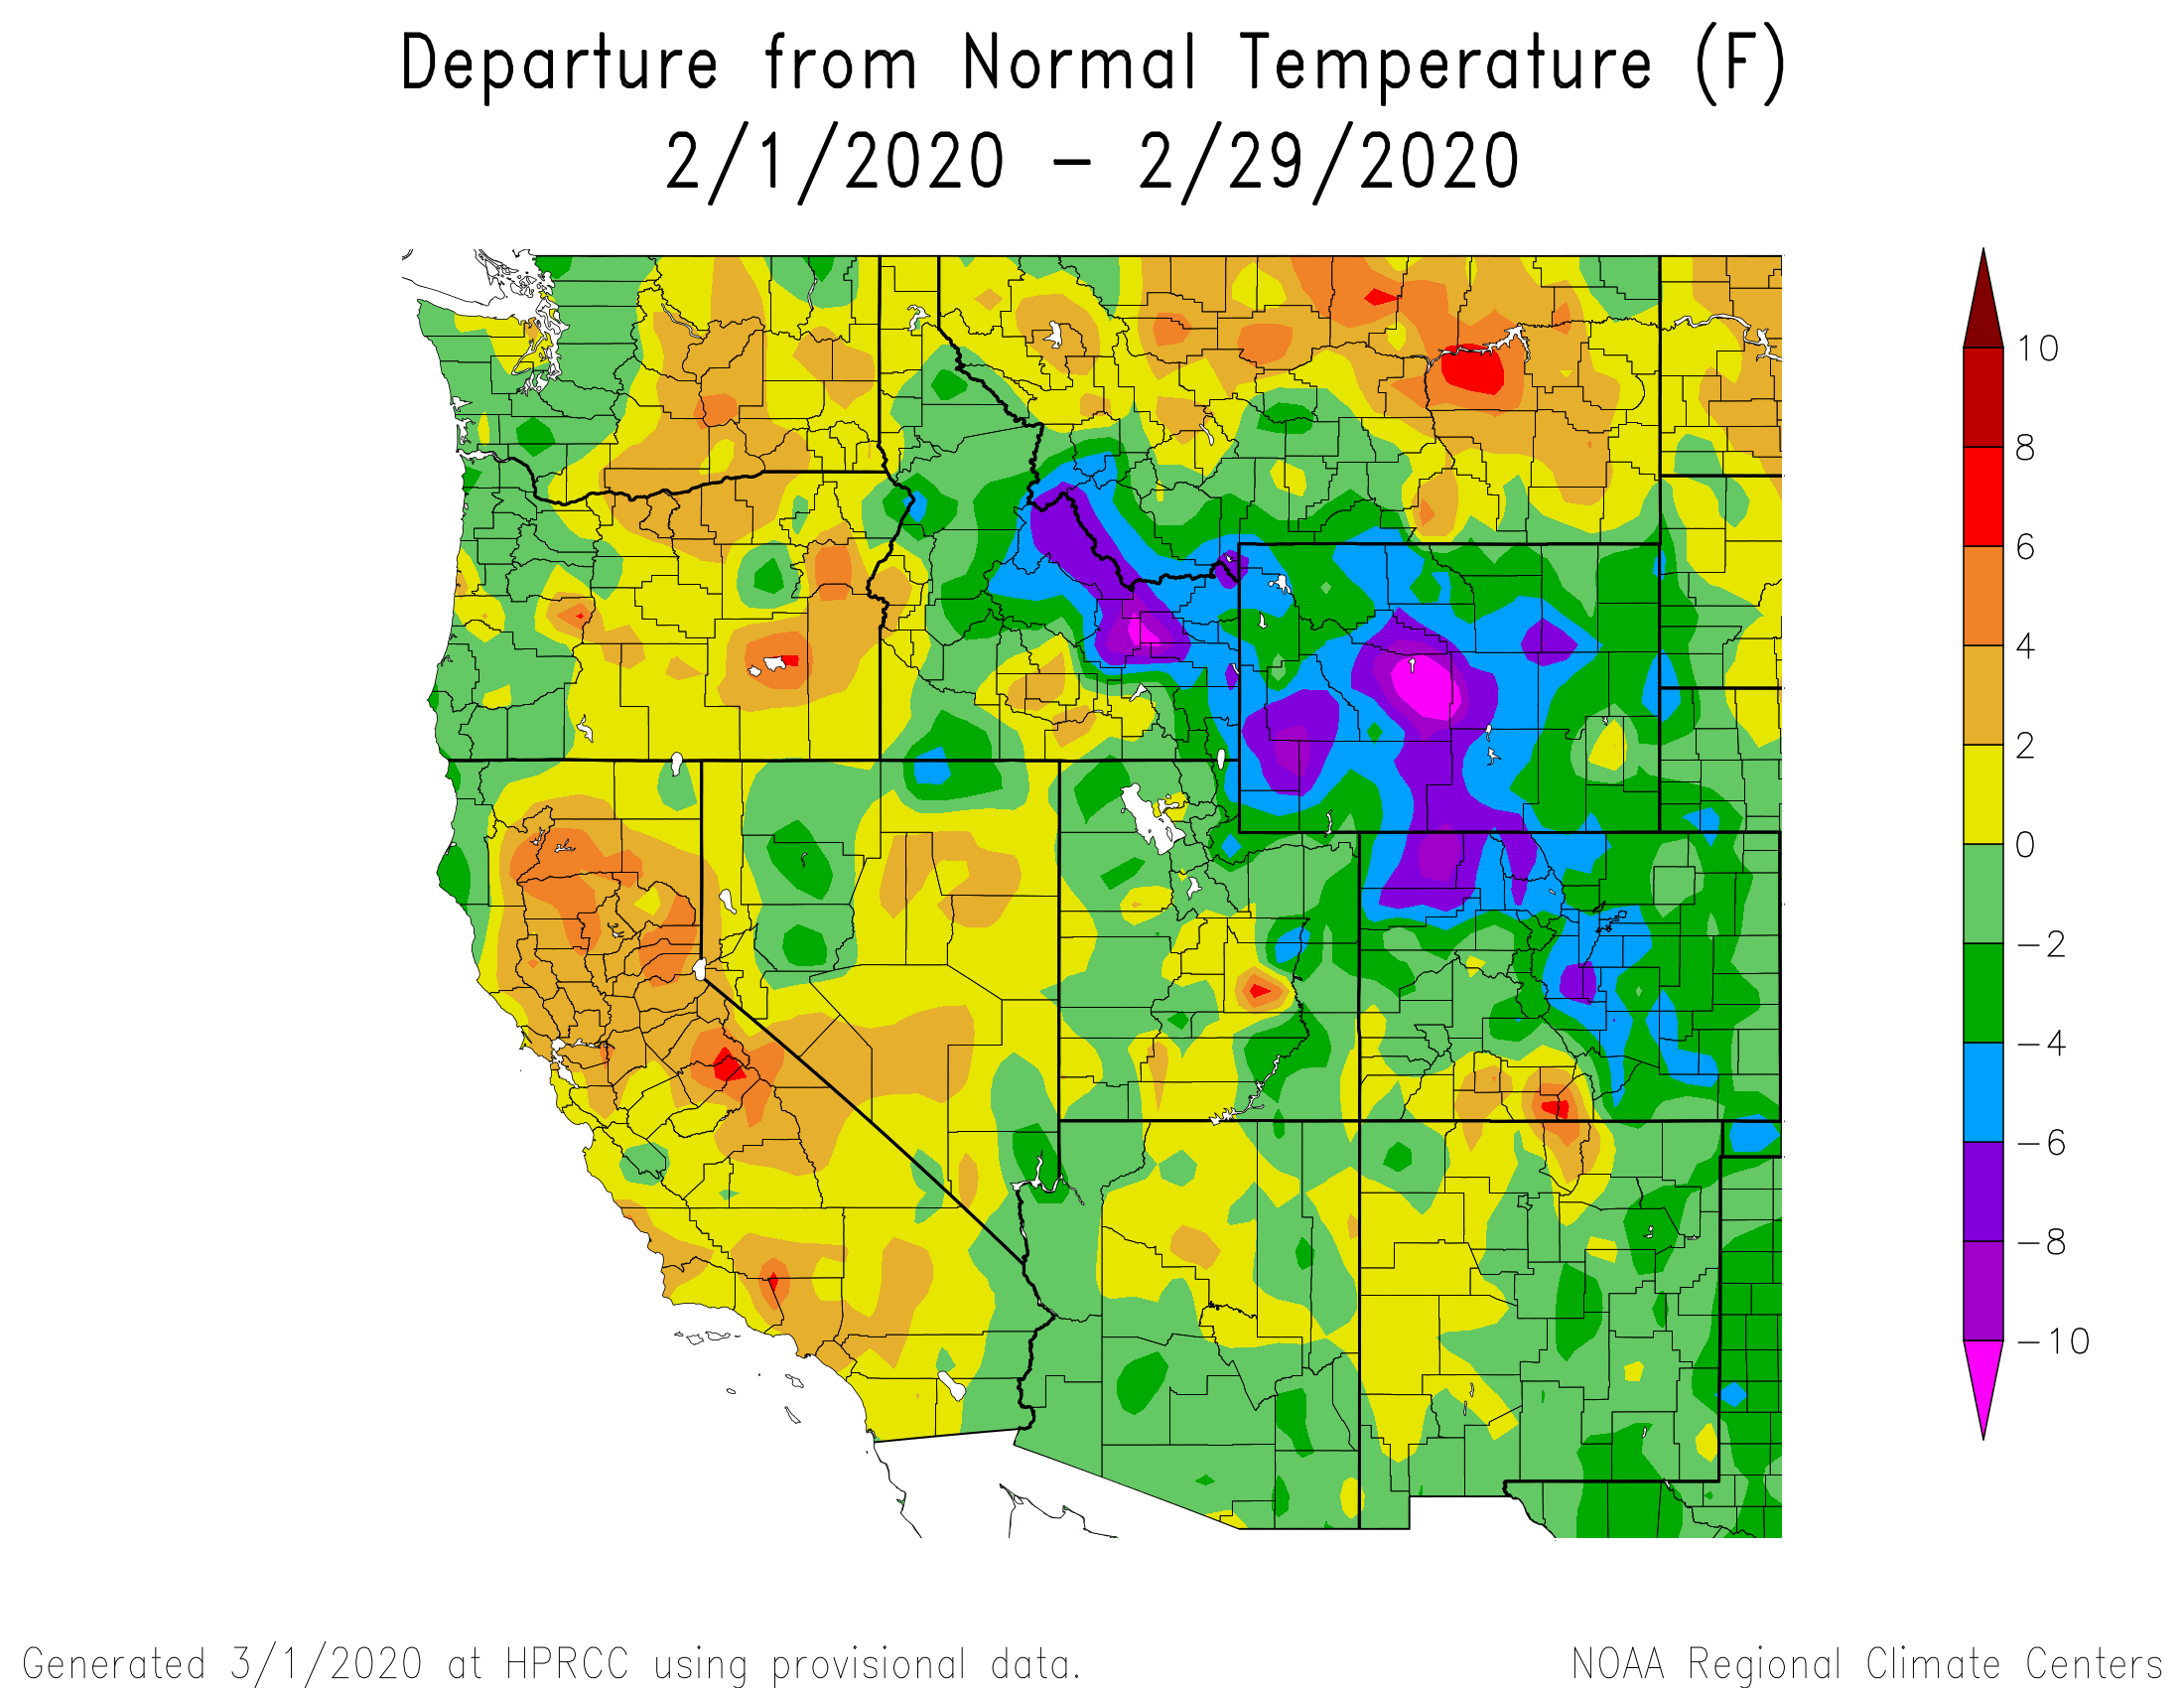
All major Colorado basins tracked just above median SWE until February 6 when a very productive atmospheric river event out of the northwest produced winter storms from British Columbia to Colorado. Northern Colorado greatly benefited from the storm with upwards to 4’ reported in certain areas. The Gunnison and Southern Basins did not see near as much from this highly coveted atmospheric river. The rest of February saw modest increments in SWE, enough to keep pace with the usual median increase, except for Southwest and Rio Grande Basins which continued to struggle with only 2 winter storms for the month. Currently, the San Miguel/Dolores/Animas/San Juan Basins are now below median for the first time since late November.
What is interesting about this season is the amount of precipitation events we received at Senator Beck Basin (SBB) that fell short of being classified as a storm (defined as at least 0.47” precipitation with no break in precipitation greater than 12 hours) Since our first storm on November 20 we have received 20” of precipitation, the amount of that precipitation that fell during a storm event was a total 13”, making 7” the amount we received during a “light-storm” or relatively transient events. However the average number of storms we typically receive by end of February is 15 and this season we received 14 storms, so we are right at average in terms of number of storm events for the season thus far. Just none of the storms have been remarkable, like what Northern Colorado received Feb 6.
A review of winter storms to date can be viewed on the storm reports page on our snowstudies.org website.
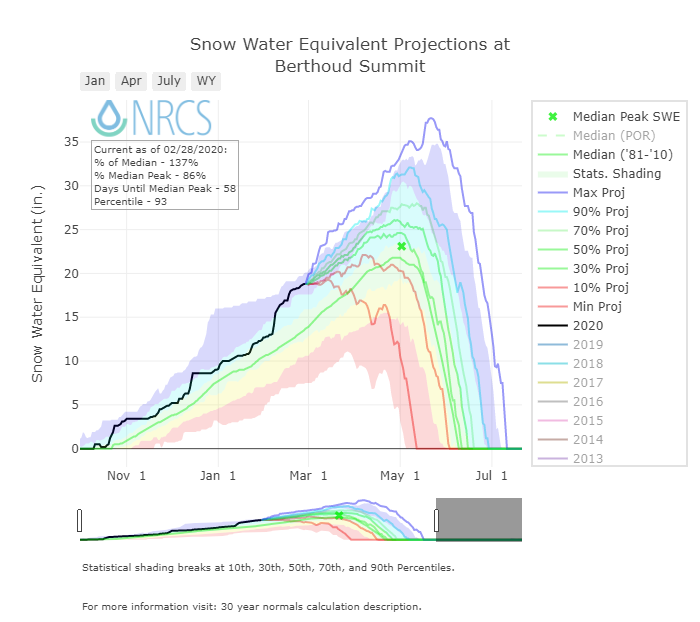
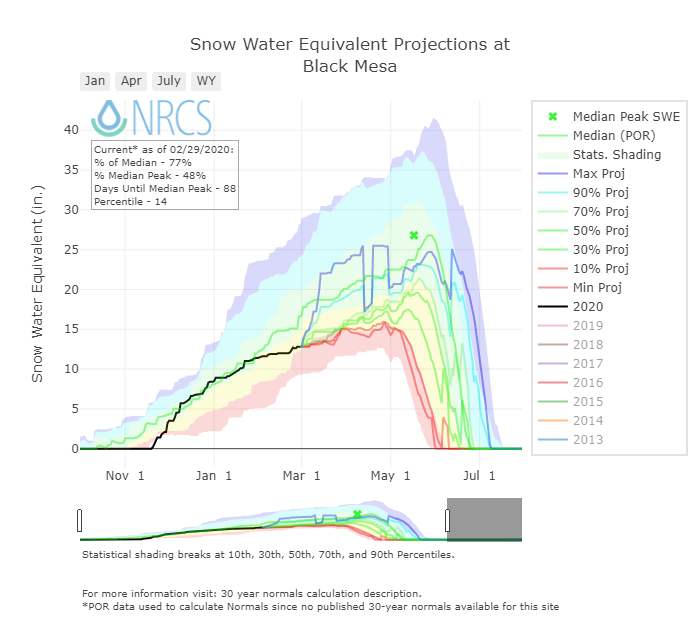
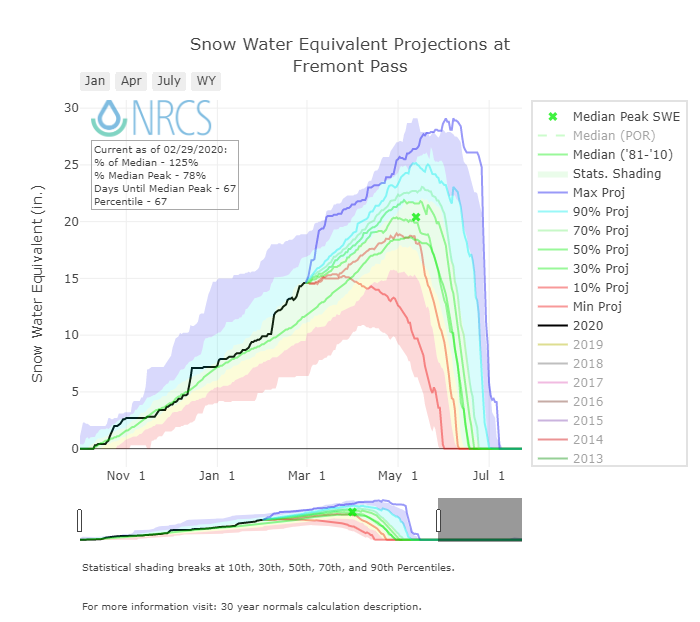
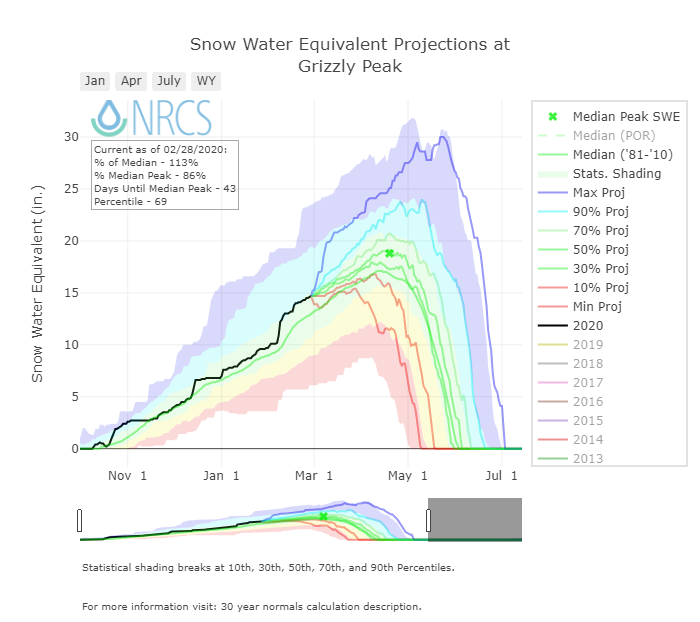
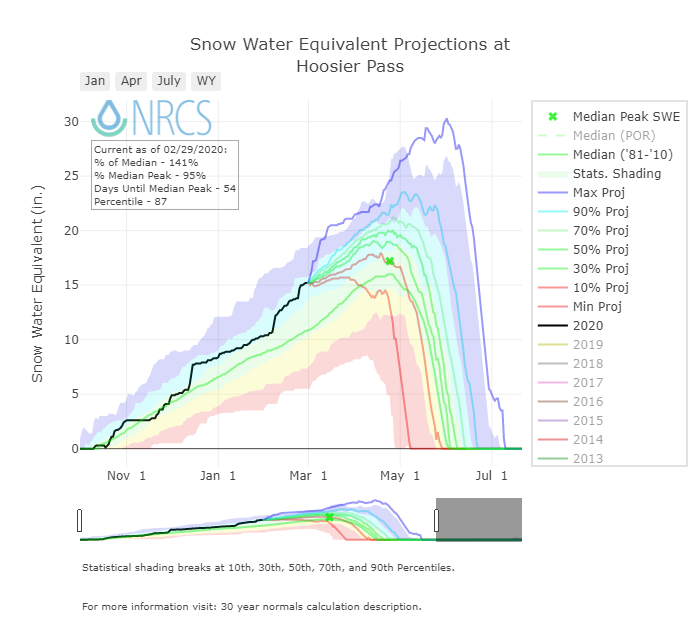
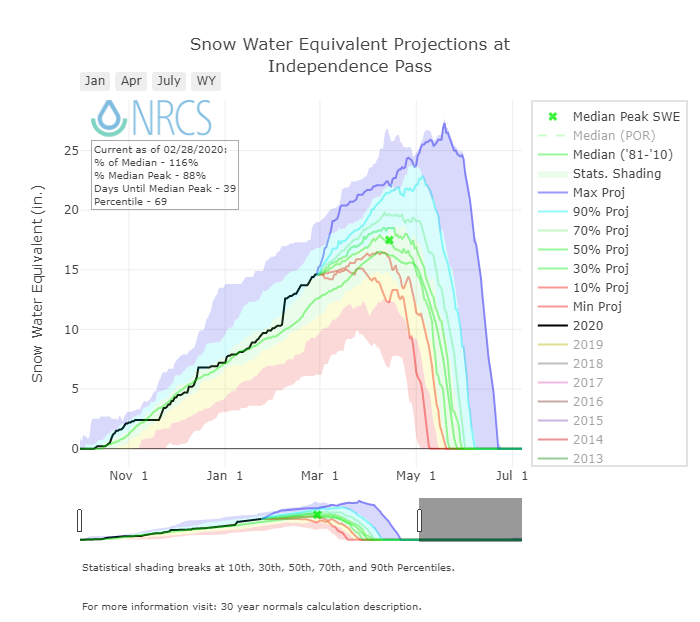
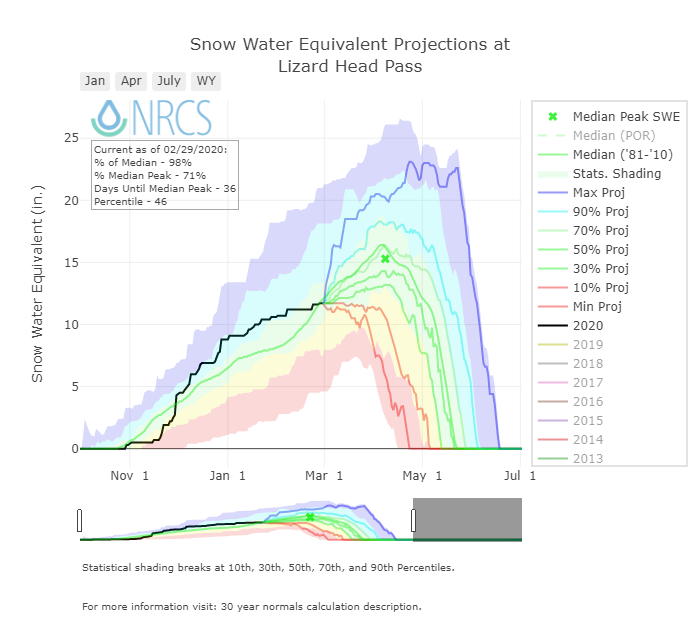
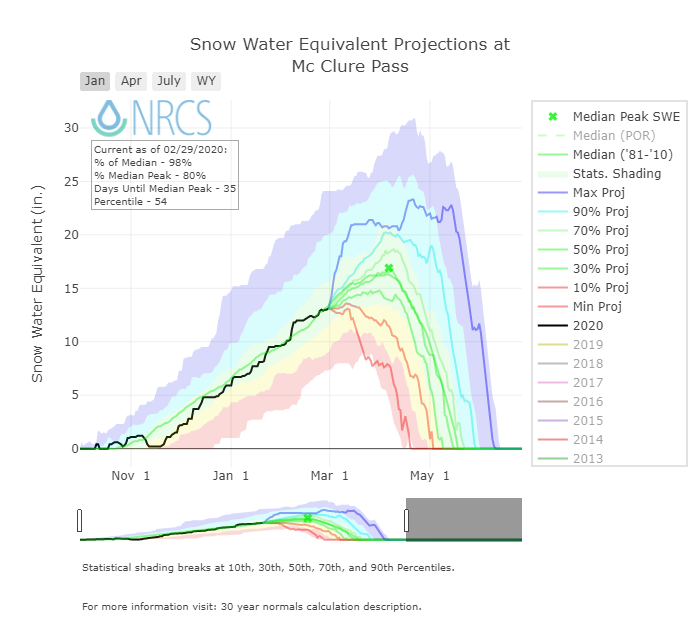
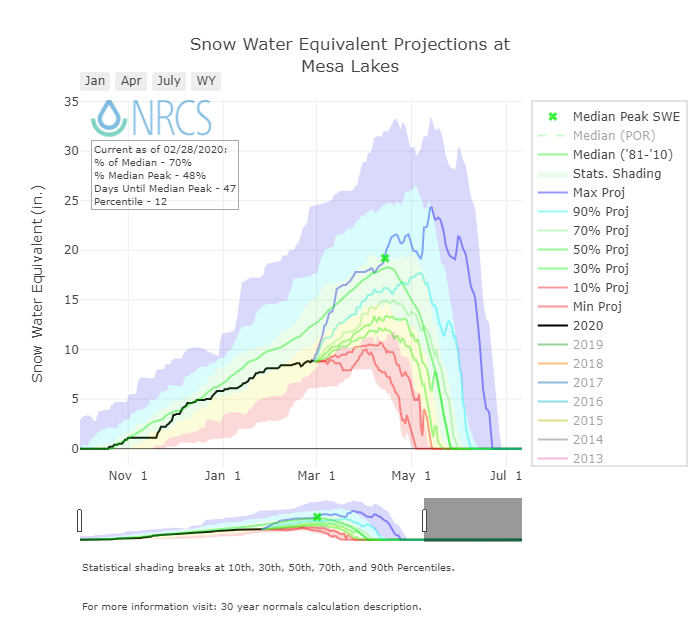
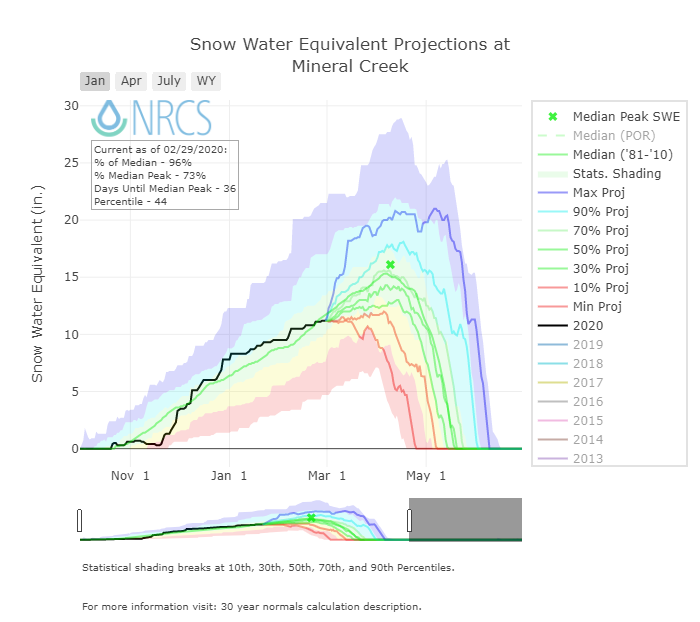
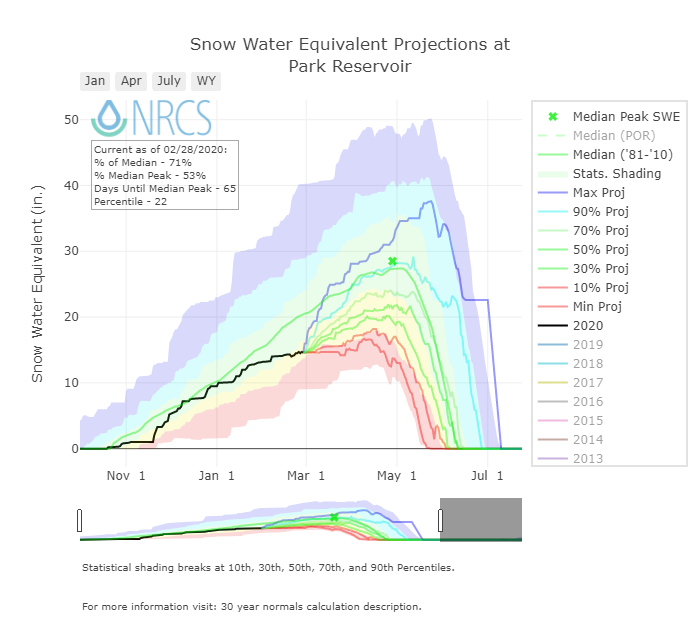
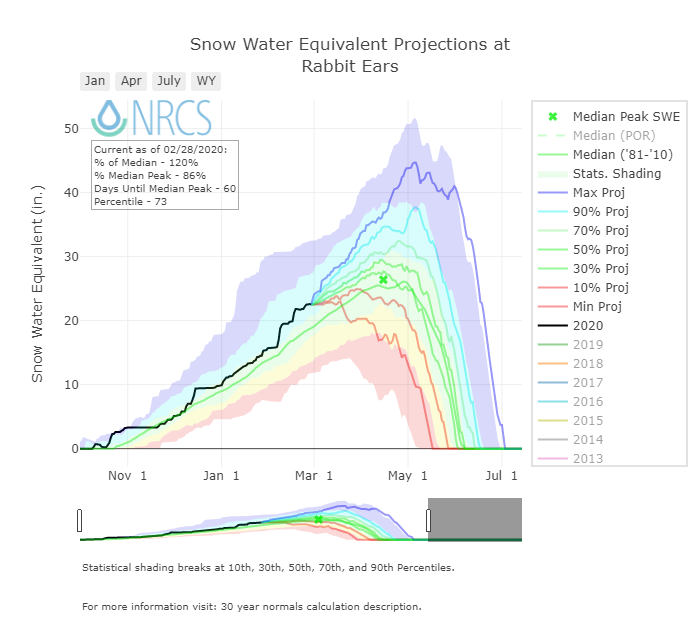
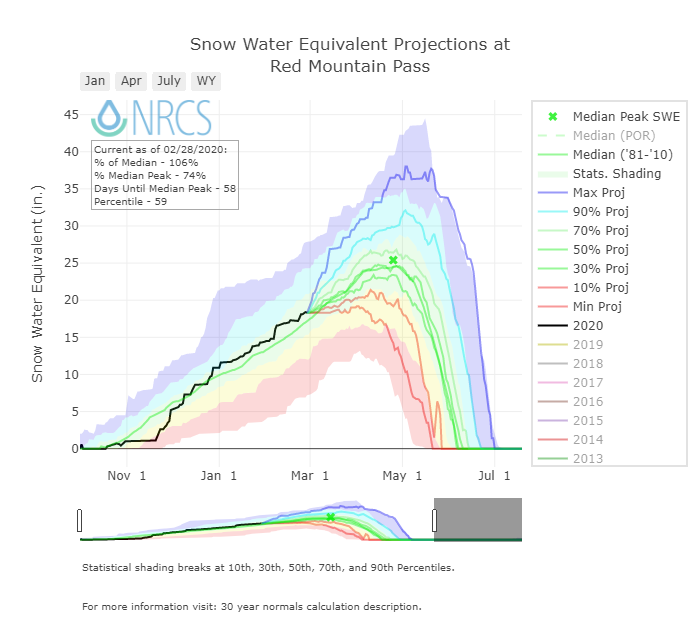
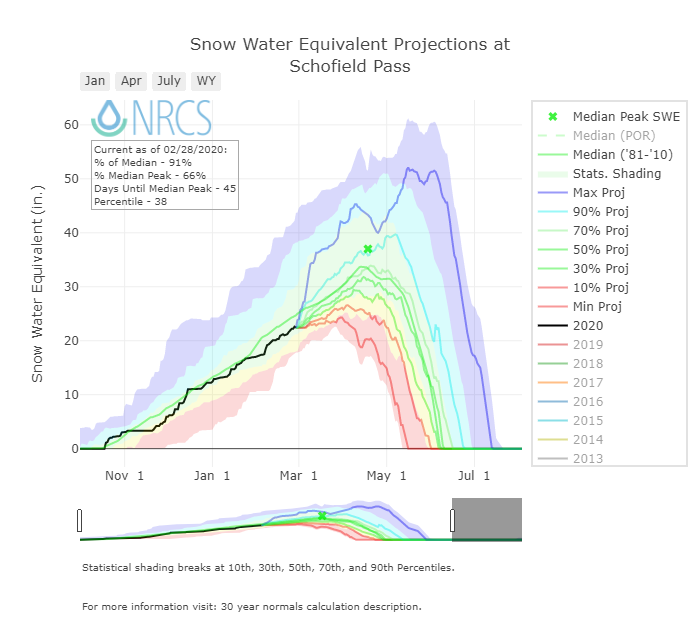
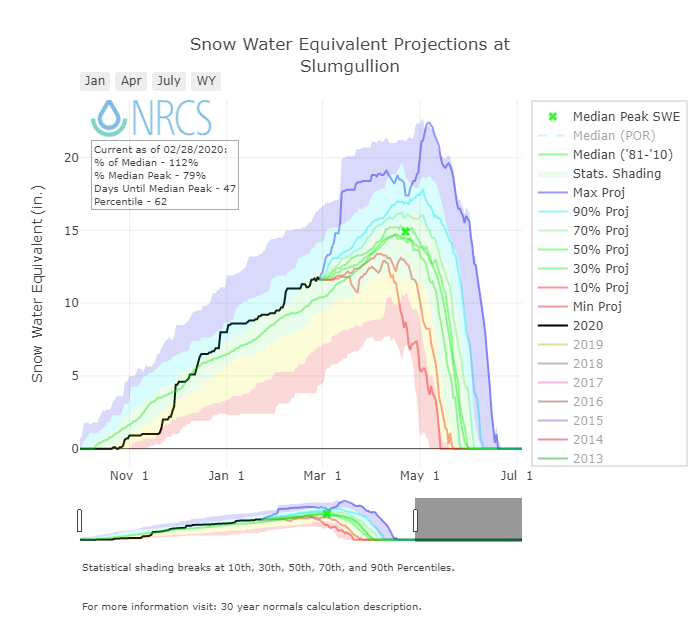
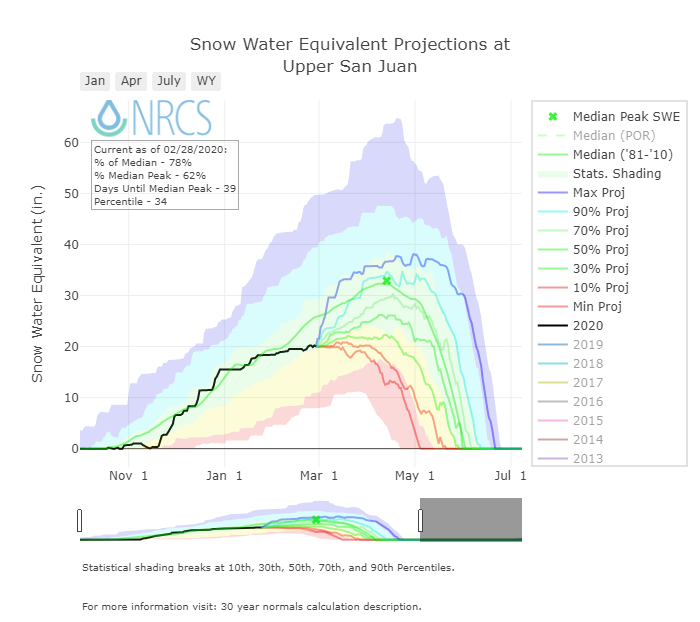
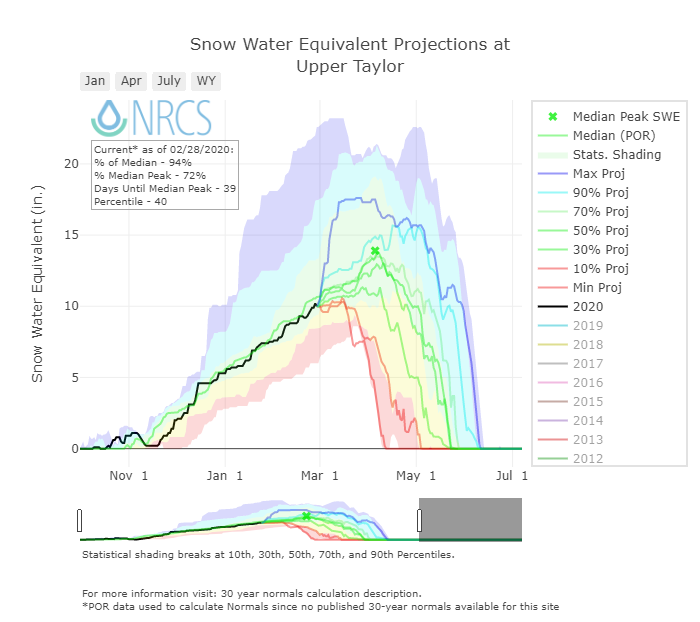
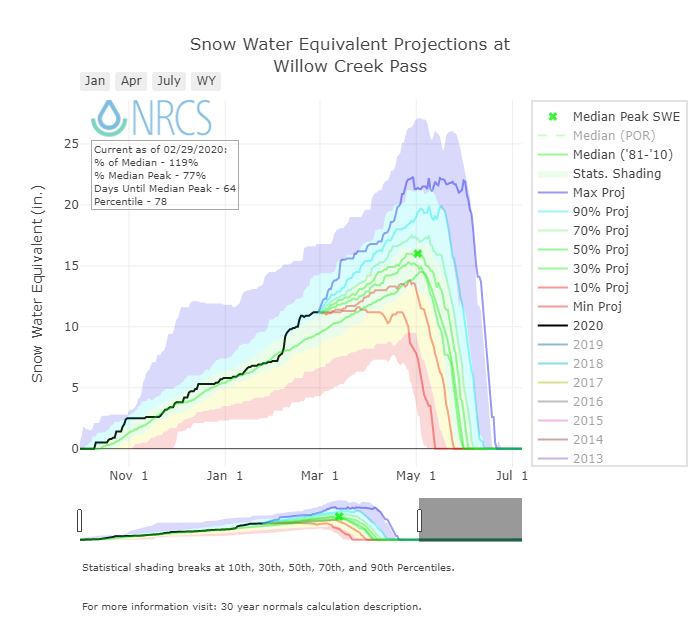
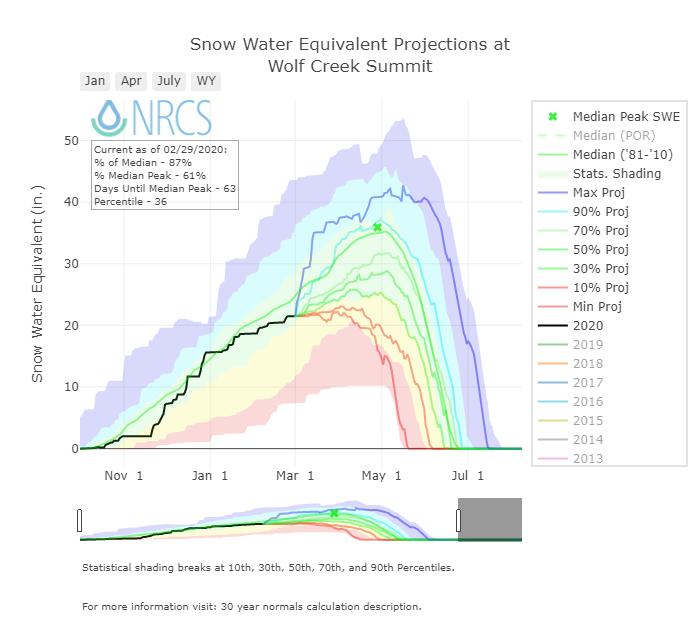
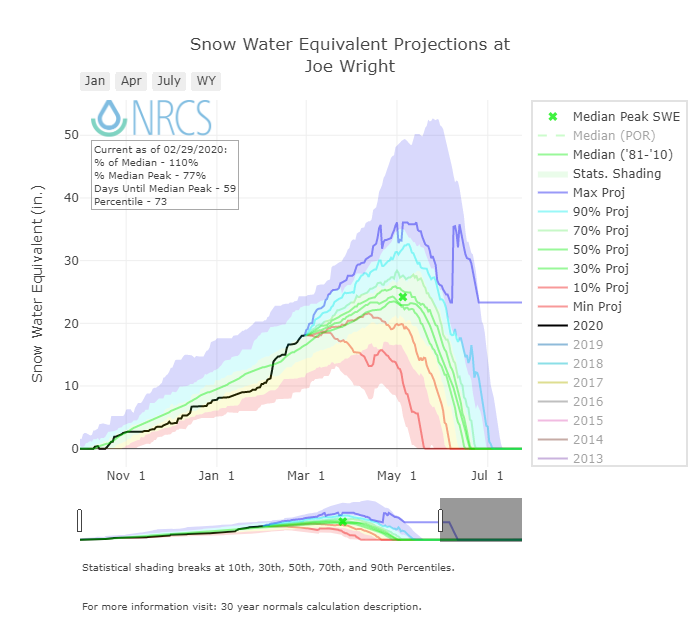
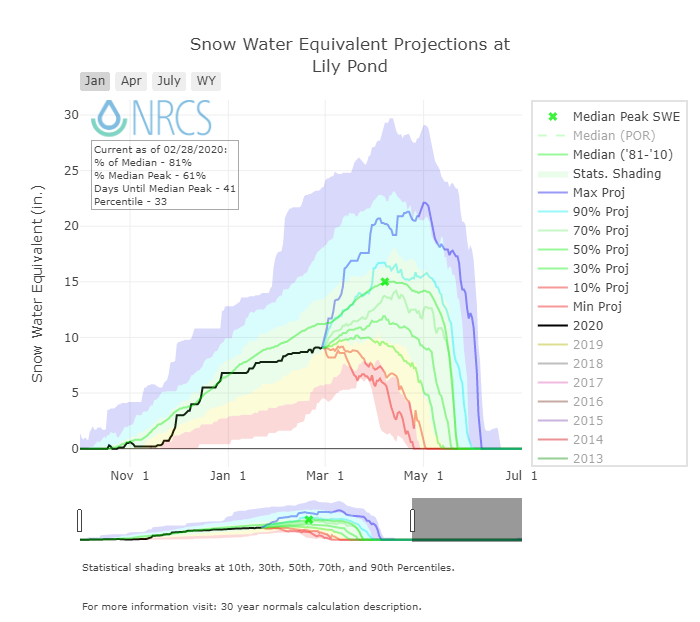
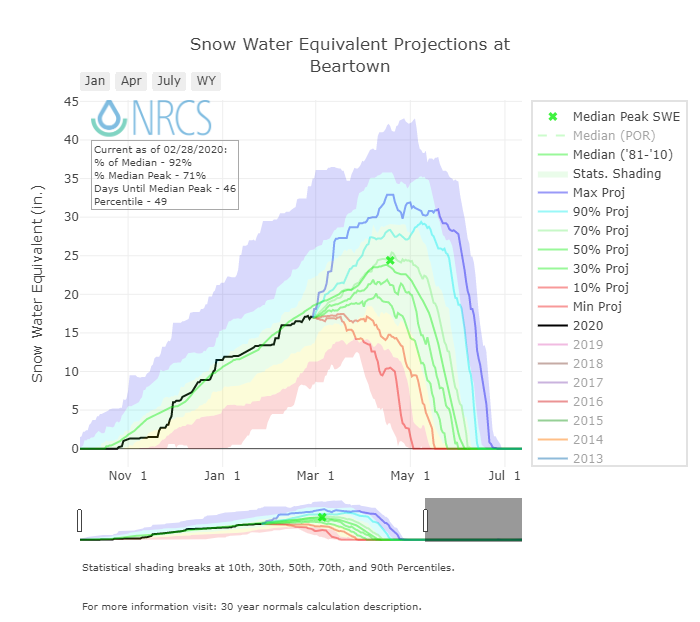
The NRCS basin-scale SWE condition plots below use non-exceedance probabilities to project a range of future snowpack conditions, from the least likely (historical max and min traces) to the most probable (50% trace).


Current DUST-ON-SNOW Conditions AND DERC CLASSIFICATION
Over the course of our 2005-2019 period of rigorous observations, March 1st has marked the beginning of the heart of “dust-on-snow season” for the Colorado Mountains (see the CODOS Dust Log chart of dust events by month). So far for WY2020 community observers reported a very light band of dust near Rico from a likely January storm event. However at SBB, the primary ‘sentry site’ for the CODOS program, we have not observed dust in snow profiles. It is likely that some portion of this dust made its way over to the Red Mountain Pass area, but it appears a negligible amount and will likely have minimal hydrologic consequences come spring. We have not observed or received reports of dust events in other parts of the state.
Unless conditions change, the CODOS team will do our first state-wide dust assessment of the season around March 16-21. We try to time our trips to best capture documenting dust in/on snow conditions, if there is plenty of fresh snow accumulation and minimal dust we delay the tour, but if we feel dust layers are near the snowpack surface we hit the road to determine the potential short-term and latter melt season impacts.
As of March 1st, Colorado SWE remains “high” among majority of basins except for the Gunnison, Rio Grande, and San Miguel/Dolores/Animas/San Juan. DERC “Average” SWE equals median +/- 10%, and deviation above and below those limits are assessed as having “high” or “low” SWE. The basins listed below are classified according to the appropriate DERC classification of either Low, Avg, or High March 1st SWE layer domains.
Basin scale WY 2020 March 1 SWE conditions (NRCS data) classified using the Dust Enhanced Runoff Classification Scheme.
As described on the CODOS website, the DERC framework is utilized to identify prior years with similar patterns of dust-on-snow intensity, March 1st SWE, and spring precipitation conditions, and their associated hydrographs. March 1st SWE analyses have been performed for each CODOS site. From this, hydrographs from 2006-2019 with associated March 1st SWE conditions have been identified and included in the analyses.
An ‘exploded view’ of the Dust Enhanced Runoff Space, separated by March 1 SWE classifications.
CODOS SITE-SPECIFIC ANALYSES
For individual SNOTEL stations associated with our eleven CODOS sites, March 1 SWE ranges from 72%-139% of median levels. March 1 SWE conditions were classified for the SNOTEL station directly associated with each CODOS site, and also for select nearby SNOTEL stations. Prior seasons with similar March 1st conditions were identified and placed within the appropriate dust enhanced March 1st SWE space. Local watershed hydrographs (from 2006-2019) associated with those March 1st SWE conditions are presented as plausible examples of runoff behavior in spring 2020, with the understanding that these prior years exhibit a relative limited variety of 2006-2019 dust and spring precipitation conditions for each CODOS site.
These analyses are presented in PDF format and are available for the watersheds listed below. You can see the entire period-of-record hydrographs as it relates to dust conditions on our CODOS website.
SENATOR BECK STUDY BASIN DATA PLOTS
SBB is located at, or near, the headwaters of four major watersheds (Animas, Uncompahgre, San Miguel, and Rio Grande) and is the only high alpine study site in the region collecting comprehensive snowpack information. We regularly dig snow profiles to assess snow/dust conditions, and our meteorological stations measure the entire energy budget of the snowpack. Being a headwater study basin, the elevations that we collect snowpack information and continue meteorological station monitoring is well above the highest of most SNOTEL stations.
Snowpack at the Swamp Angel Study Plot (SASP) is above average in both snow depth and SWE. The same is true for the Senator Beck Study Plot (SBSP), which is more exposed and at a higher elevation than SASP. Thus far, WY 2020 cumulative precipitation is 21.8" (557 mm), average is 21" (537 mm).


SENATOR BECK STUDY BASIN SETTING
Usually just before spring it is helpful to remind long-time CODOS subscribers and inform new subscribers where Senator Beck Basin (SBB) and it’s meteorological stations are located, so when we refer to data at SASP (Swamp Angel Study Plot) or SBSP (Senator Beck Study Plot) the reader understands the environment in which it was collected.
Senator Beck Study Basin location near Red Mountain Pass near Silverton, CO. Elevation of the Basin ranges from 11,030’ at the stream gauge to 13,510’ at the crest of the peaks. The blue line delineates watershed boundary. Senator Beck Study Plot and Swamp Angel Study Plot are the locations of highly instrumented meteorological stations and are also where snowpack data is collected. This picture was taken from our Putney station, where we collect “free air” wind speed and direction.
