

SUMMARY
Final CODOS visits were conducted at Grizzly Peak (Loveland Pass), Hoosier, Berthoud, and Willow Creek Pass on Wednesday, June 1. During this CODOS tour, comparatively weak dust-on-snow, likely from event D5, was observed at all sites except Willow Creek. “All layers merged” (ALM) samples of this dust were collected at Berthoud Pass, Grizzly Peak, and Hoosier Pass. These ALM samples were sent to our USGS collaborators for chemical and other analyses, for inter-site comparisons.
DUST-ON-SNOW CONDITIONS
During this CODOS circuit of Hoosier, Grizzly Peak (Loveland Pass), Berthoud, and Willow Creek Pass dust was observed at the snowpack surface on all aspects and elevations besides in the vicinity of Willow Creek. All of these sites went the majority of winter without receiving dust until likely D5 (and D4 at Hoosier Pass), occurring on April 23, since that was the only significant dust event since the last CODOS trip. Dust was barely distinguishable on the landscape and, if viewed from a distance, the snowcover appeared “clean”. But dust was easily noticeable where ski tracks, sluffing, or avalanches disturbed the snow surface, exposing the clean snow underneath. To the southwest, surface dust loadings appear greater along the Collegiate Peaks and near Monarch Pass. This all means a slight but still meaningful reduction in snow albedo and accompanying increased absorption of solar radiation for the remainder of the snowmelt period.
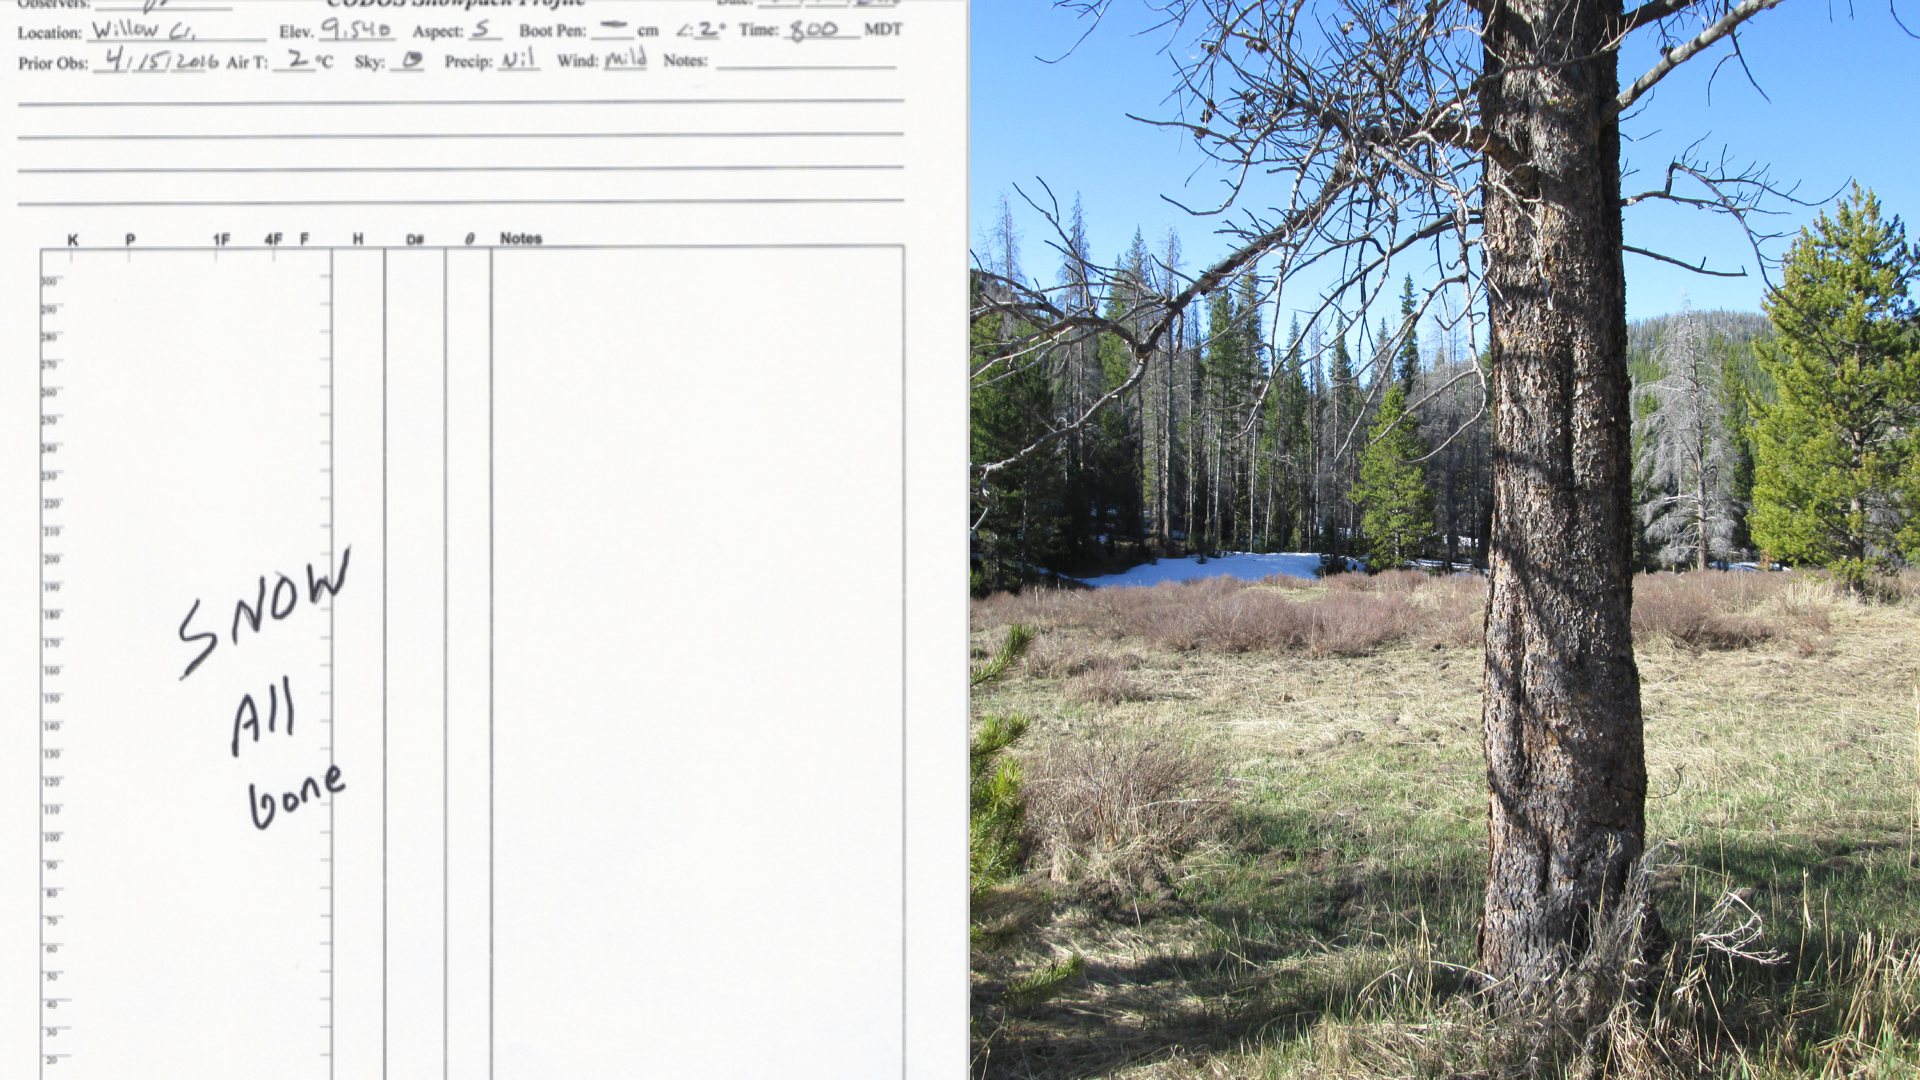
WILLOW CREEK PASS:
The Willow Creek Pass CODOS snow profile site in the foreground, completely clear of snow. Willow Creek Pass SNOTEL, located in the trees in the far part of the picture, shows 5” of remaining SWE.
Willow Creek Pass CODOS sample area. Besides north facing, heavily treed areas, snowcover has mostly retreated to higher elevations.
Willow Creek Pass looking towards Parkview Mountain.
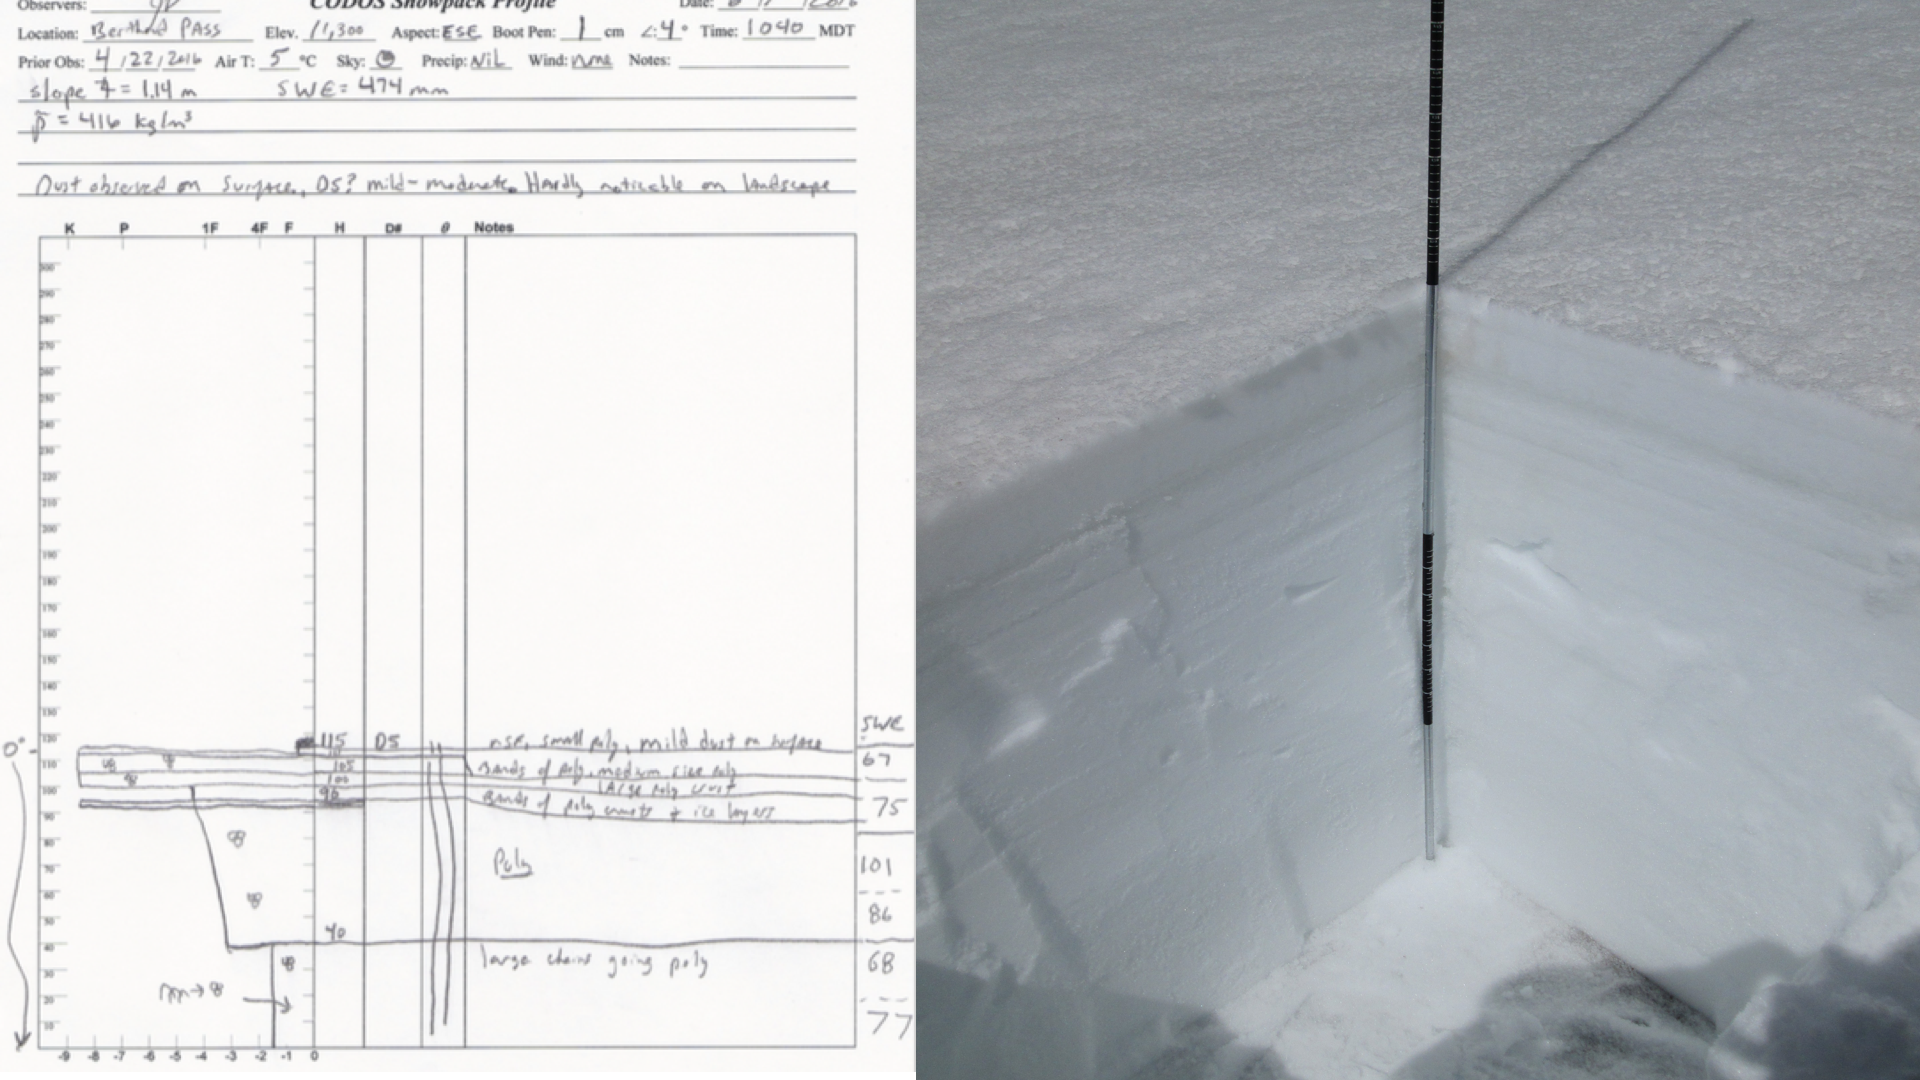
BERTHOUD PASS:
Berthoud Pass CODOS sample site. The beginnings of the snow pit show the contrast between the slightly dusty snow surface and the cleaner snow underneath.
Berthoud Pass CODOS sample area. Higher concentrations of dust are seen in slight depressions of the snow surface.
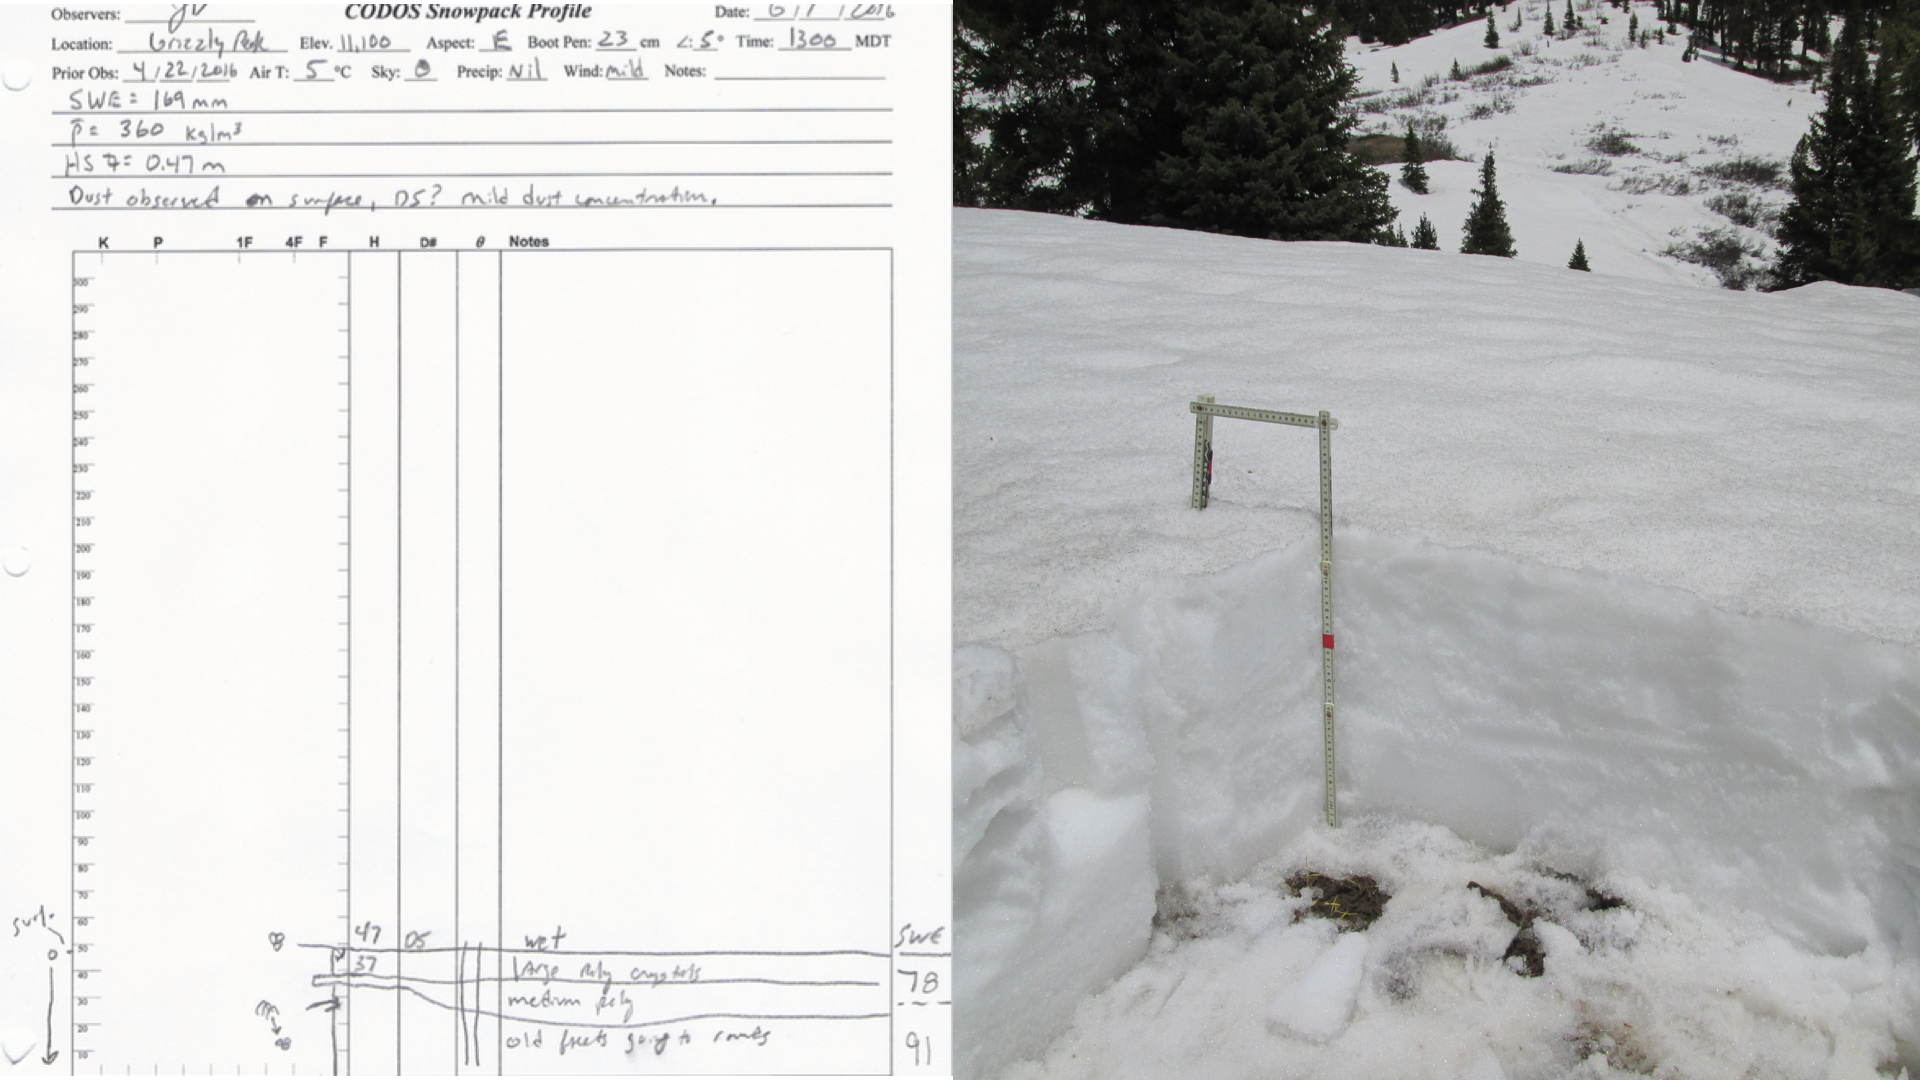
LOVELAND PASS (GRIZZLY PEAK):
Grizzly Peak CODOS snow profile.
Picture taken from Grizzly Peak sample site on June 1. About 1.5’ of snow depth (6.6” of SWE) remains at the CODOS site, located in a clearing a few hundred feet from Grizzly SNOTEL, next to the tower visible in the background. Grizzly SNOTEL reported 5.4” of SWE on June 1. Over the past 8 days since May 26, SWE has decreased a total of 5”.
Loveland Pass on June 1. With thinning snowcover, solar radiation absorbed by the ground and vegetation are then re-emitted as thermal (longwave) energy, and rapidly accelerating snowmelt around their perimeter.
Loveland Pass on June 1. Slight dust present but not visible in photo.
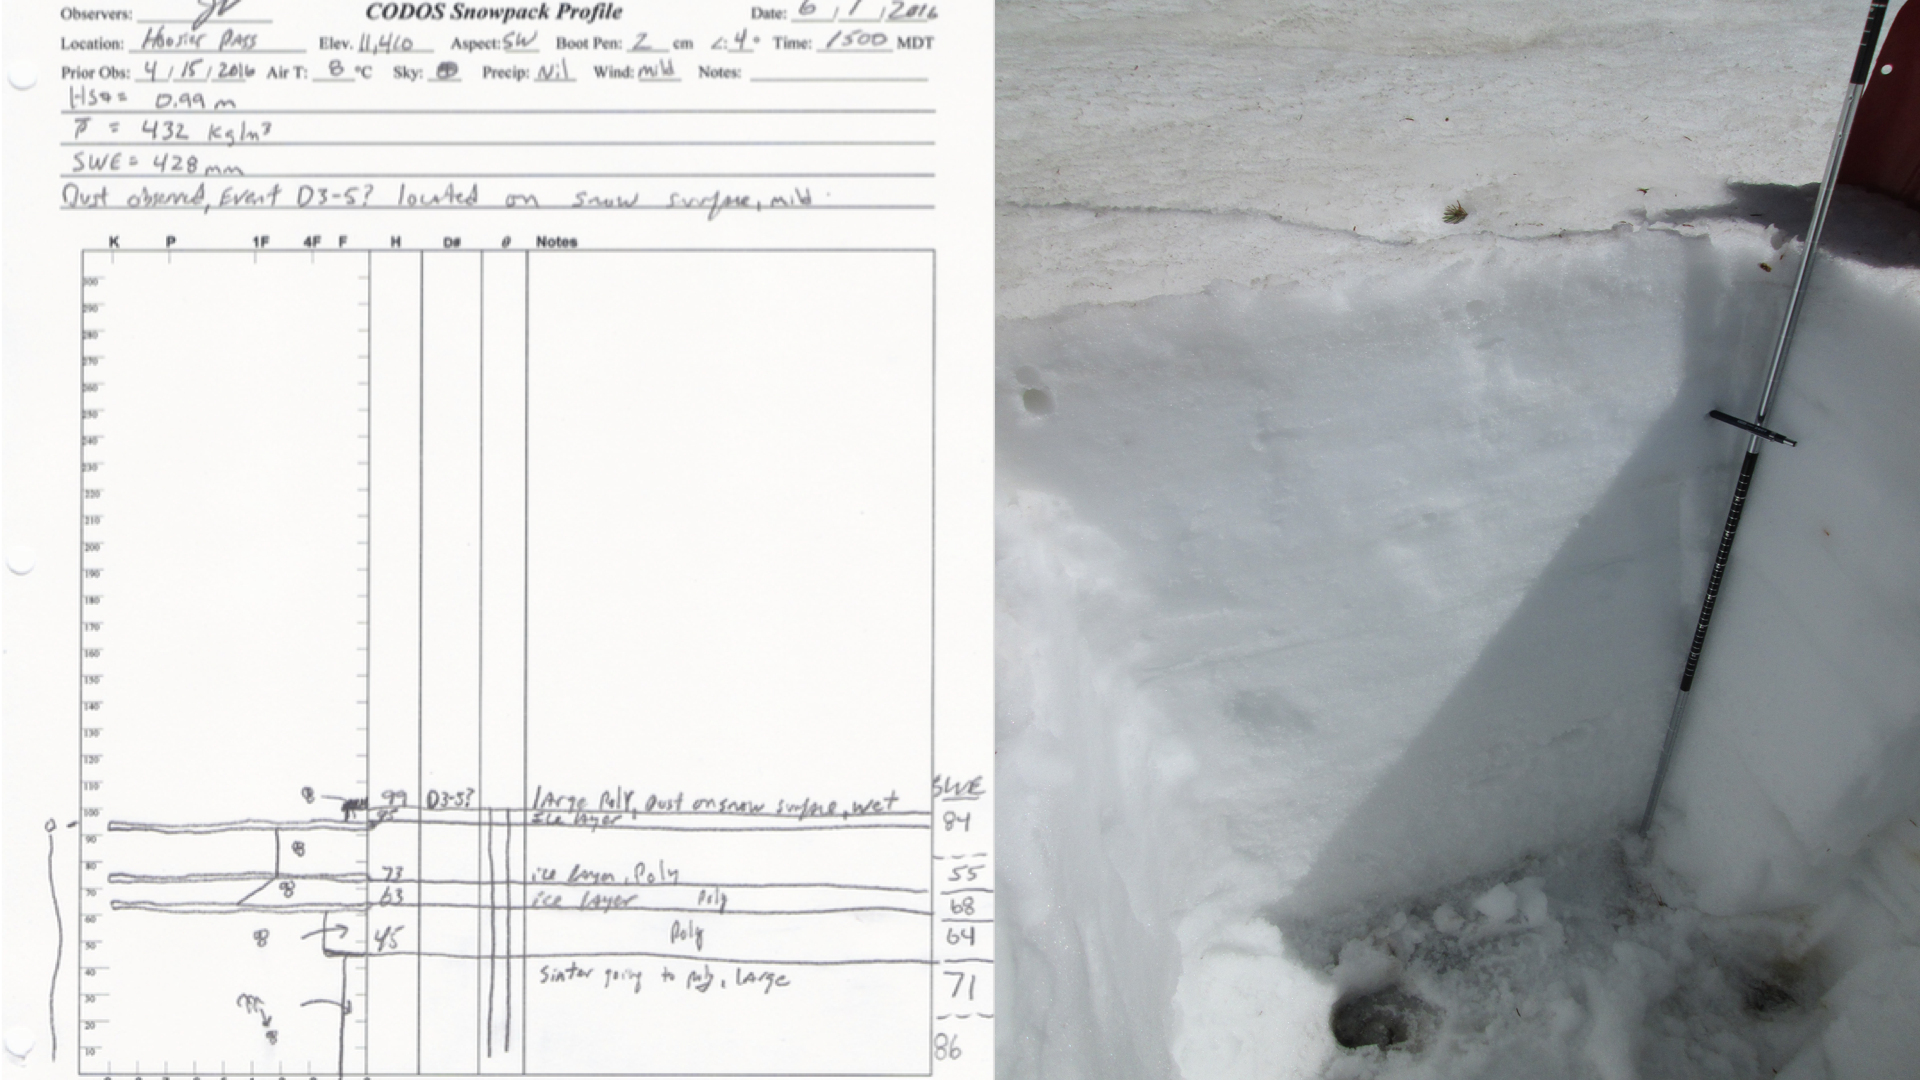
HOOSIER PASS:
Hoosier Pass snow profile. Dust event D4 was noted at this CODOS site on April 15. Since then, with Loveland and Berthoud Pass having received dust from event D5, it was very likely deposited in this location as well, combining with D4.
Photo of Hoosier Pass CODOS sample area. The cleaner blocks from the snow pit can be seen in the foreground.
Photo taken from Hoosier Pass CODOS site looking at Mt. Bross. Similar to Berthoud and Loveland Pass, dust deposition in this area is light. Further to the southwest the Collegiate Peaks received a greater amount of dust deposition.
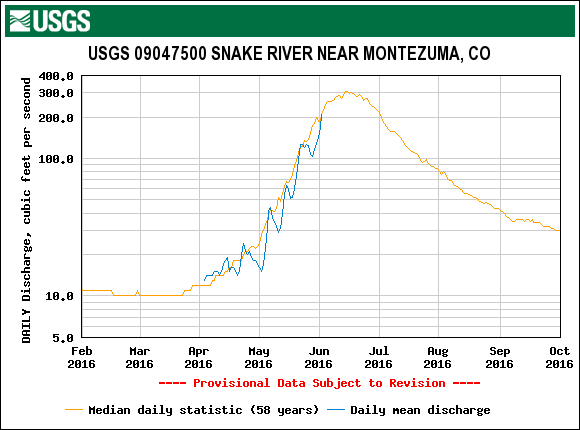
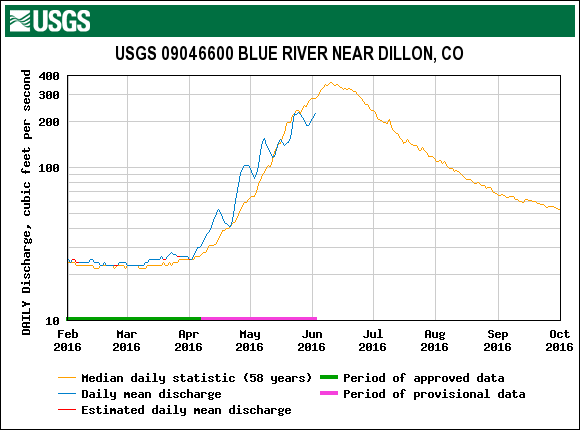
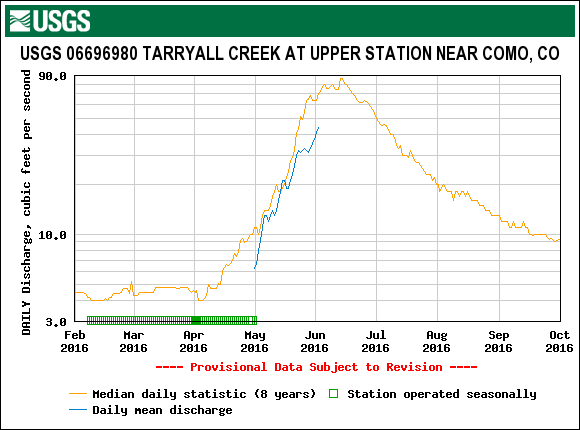
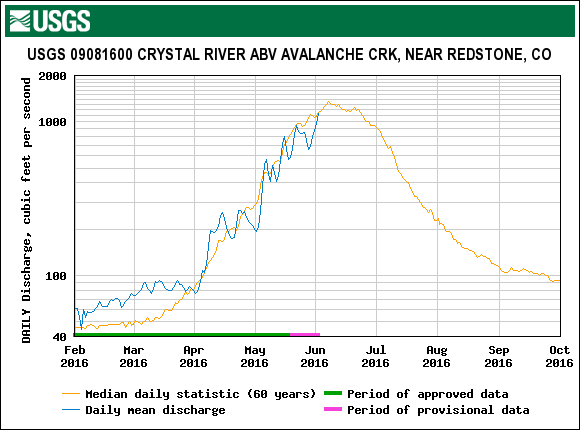
PRECIPITATION AND STREAM DISCHARGE
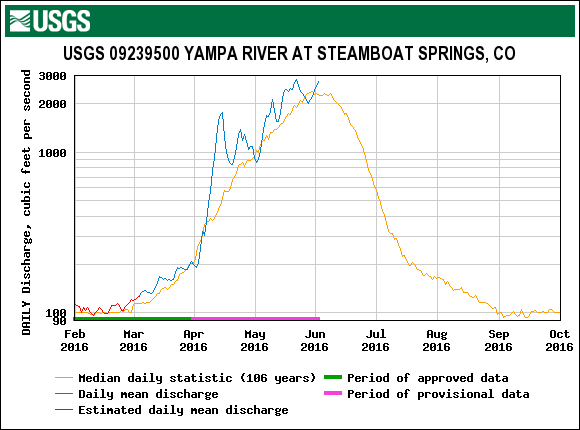
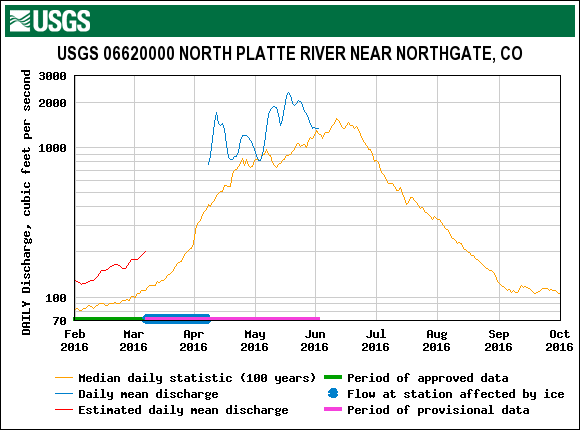
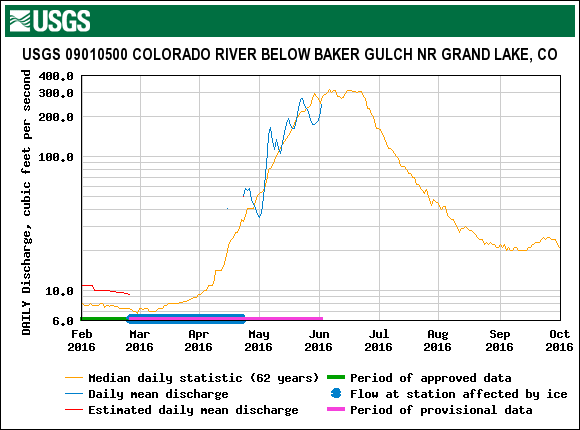
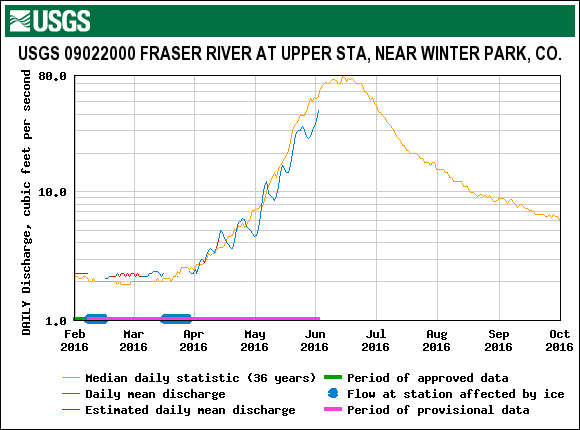
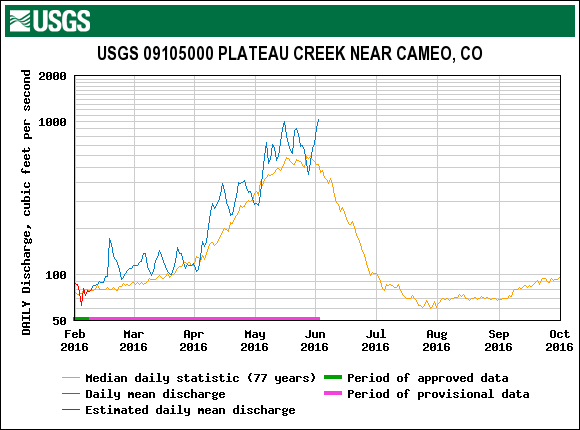
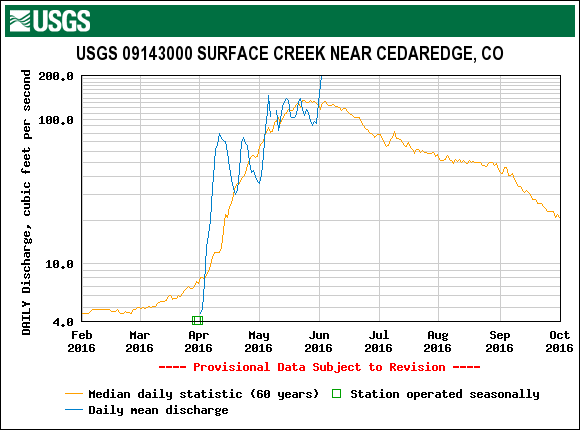
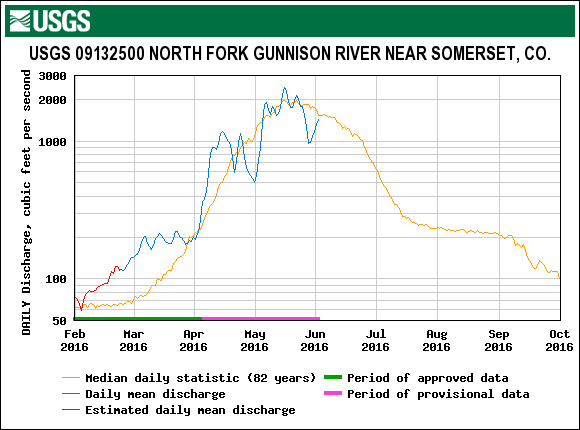
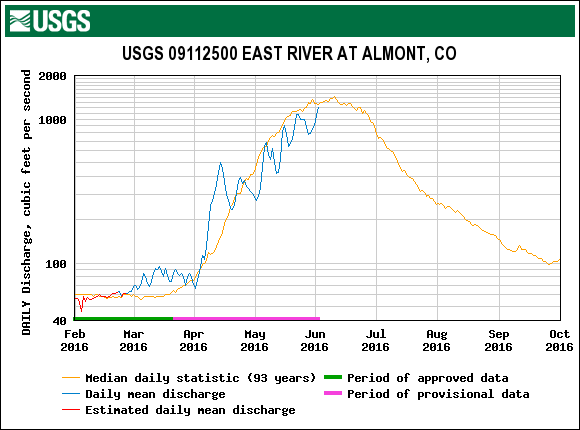
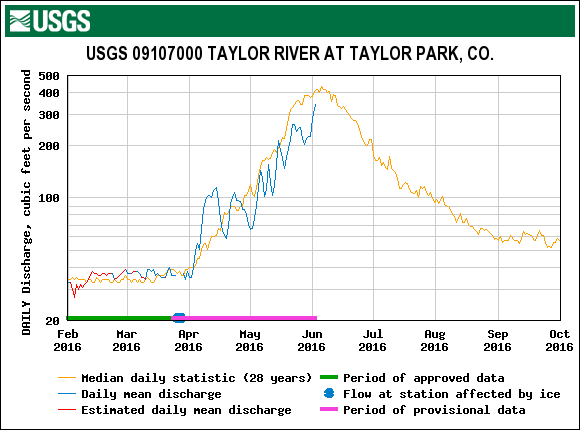
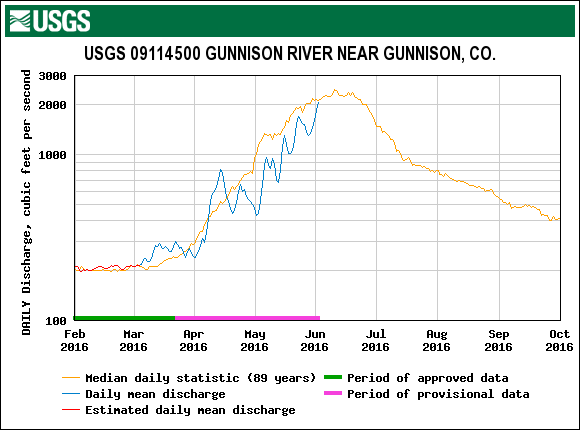
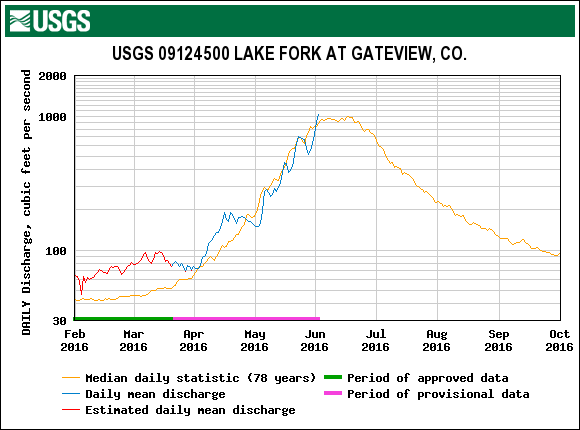
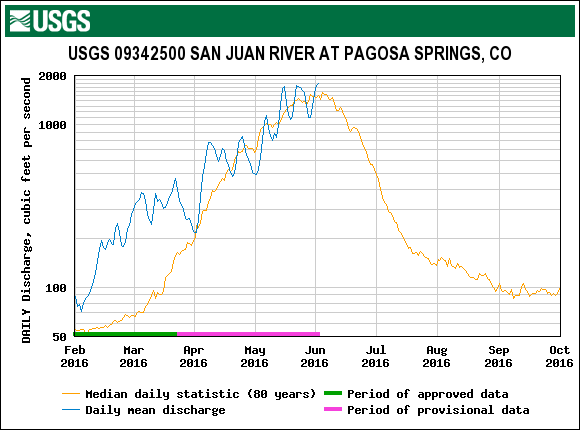
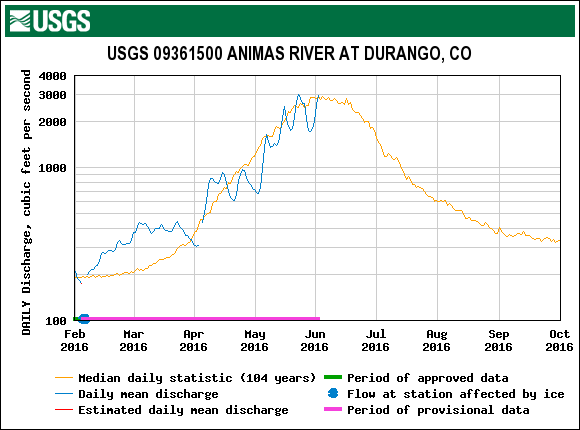
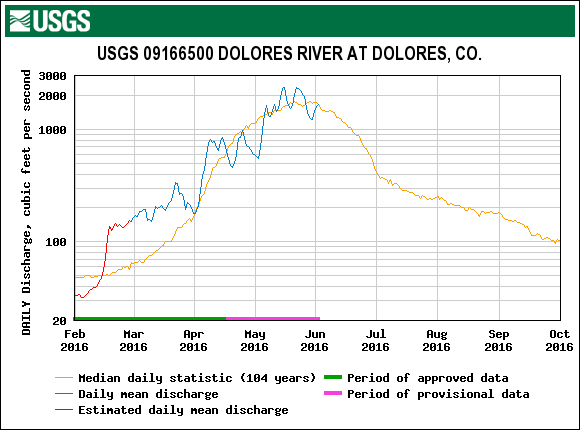
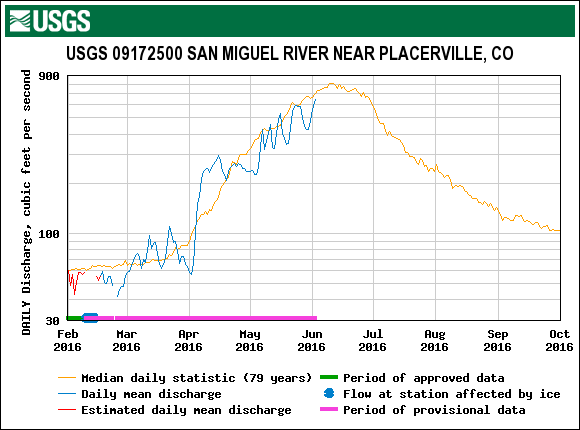
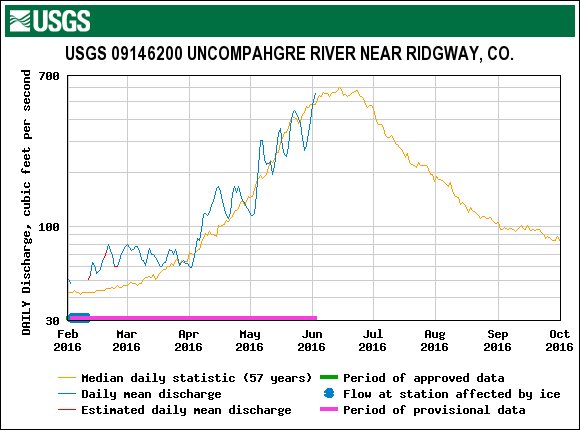
Looking at spring precipitation (see Mar/Apr/May Precip Variance plot below), the Central and Southern Mountains recovered pretty well from a dry February and March. All major watersheds experienced a series of storm events since mid-April that resulted in further snowpack development. Many SNOTEL sites, particularly in the Southern Mountains, were exhibiting deficits on May 15 that since have largely recovered by June 1. The Northern Mountains, with the exception of Grizzly Peak, have seen spring precipitation on average 25% above the long term mean. The overall average variance for the 15 stations is 3% above the long term mean, with a maximum range between stations of 51%.
Current cumulative precipitation for WY2016 at Senator Beck is the third highest, albeit not by much, in our 13 year record. Yet, WY2016 is ranked only ninth highest in cumulative winter storm count (see plots below). One explanation is we have received a number of storms this winter season that barely fell short of our definition of a storm, requiring at least 12 mm of precipitation with no gap in precipitation greater than 12 hours. Also, on at least one occasion we received multiple storm systems with no gap in precipitation, making it difficult to designate precipitation totals for each storm.
Combined March, April, and May precipitation, through June 1, 2016. On May 15, 2016, precipitation had fallen short of average for ten of these fifteen SNOTEL stations adjacent to or near CODOS monitoring sites. Since May 15, all stations recorded improved cumulative totals, with average change in percent deviation from the mean increasing 12%. Overall, the average variance for the 15 stations is 3% above the long term mean.
Cumulative precipitation as of June 1, 2016. WY2016, so far, is the third highest (barely) in our 13 year record.
Cumulative winter storm count for 13 years at Senator Beck Basin. WY2016 is currently ranked ninth in the number of documented winter storms.
These final precipitation data will change the CODOS Dust Enhanced Runoff Classification (DERC) for a number of hydrographs. Within the DERC model, there are many instances where WY2016 classification does not have a previous water year equivalent. Nonetheless, the next best prior water year(s) may provide useful insights into the remainder of the spring 2016 snowmelt runoff cycle (see CODOS site webpages for updated hydrographs and for the complete DERC hydrograph database for these watersheds). An updated chart is provided below. Items highlighted in bold indicate there was no prior water year that fits the current WY2016 scenario for that particular watershed: