CODOS Update APRIL 24, 2026: Storm Report analyses, snowpack update
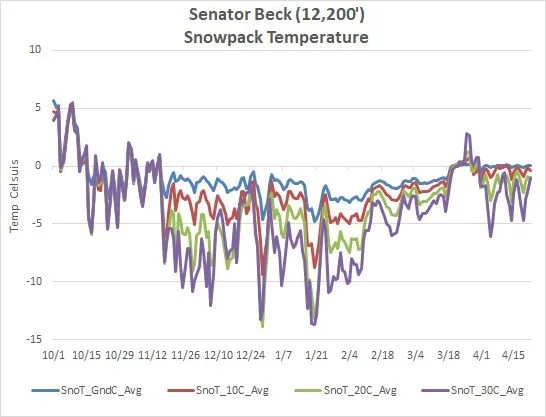
Since the latter March heatwave the snowpack has been pretty much in an arrested state with a few bits of added SWE from a few storms. For a number of days during the heatwave nighttime temperatures were higher at Senator Beck (12,200’) than Swampy (11,060’), and both were above freezing. Since then closer to normal temperatures prevailed and even a few days of minimum temps of 5-19 degrees F. A lot of snow from the meager snowpack melted in March to create the early season streamflow surge. Now only a few inches SWE remains at high elevation SNOTEL and CSAS’ monitoring sites. The forecast includes some snow on Sunday in the San Juans while the entire week looks to snow in Northern Colorado. Now with just upper elevation snow remaining, it would take a period of warm/sunny conditions to see a significant surge in streamflow. If precipitation events steadily come and go without a period of more intense snowmelt we could see something like WY2002 where streamflow just kind of fumbled along.
Please see below for a look into what our storm reports, that we have been creating since 2004, are telling us.
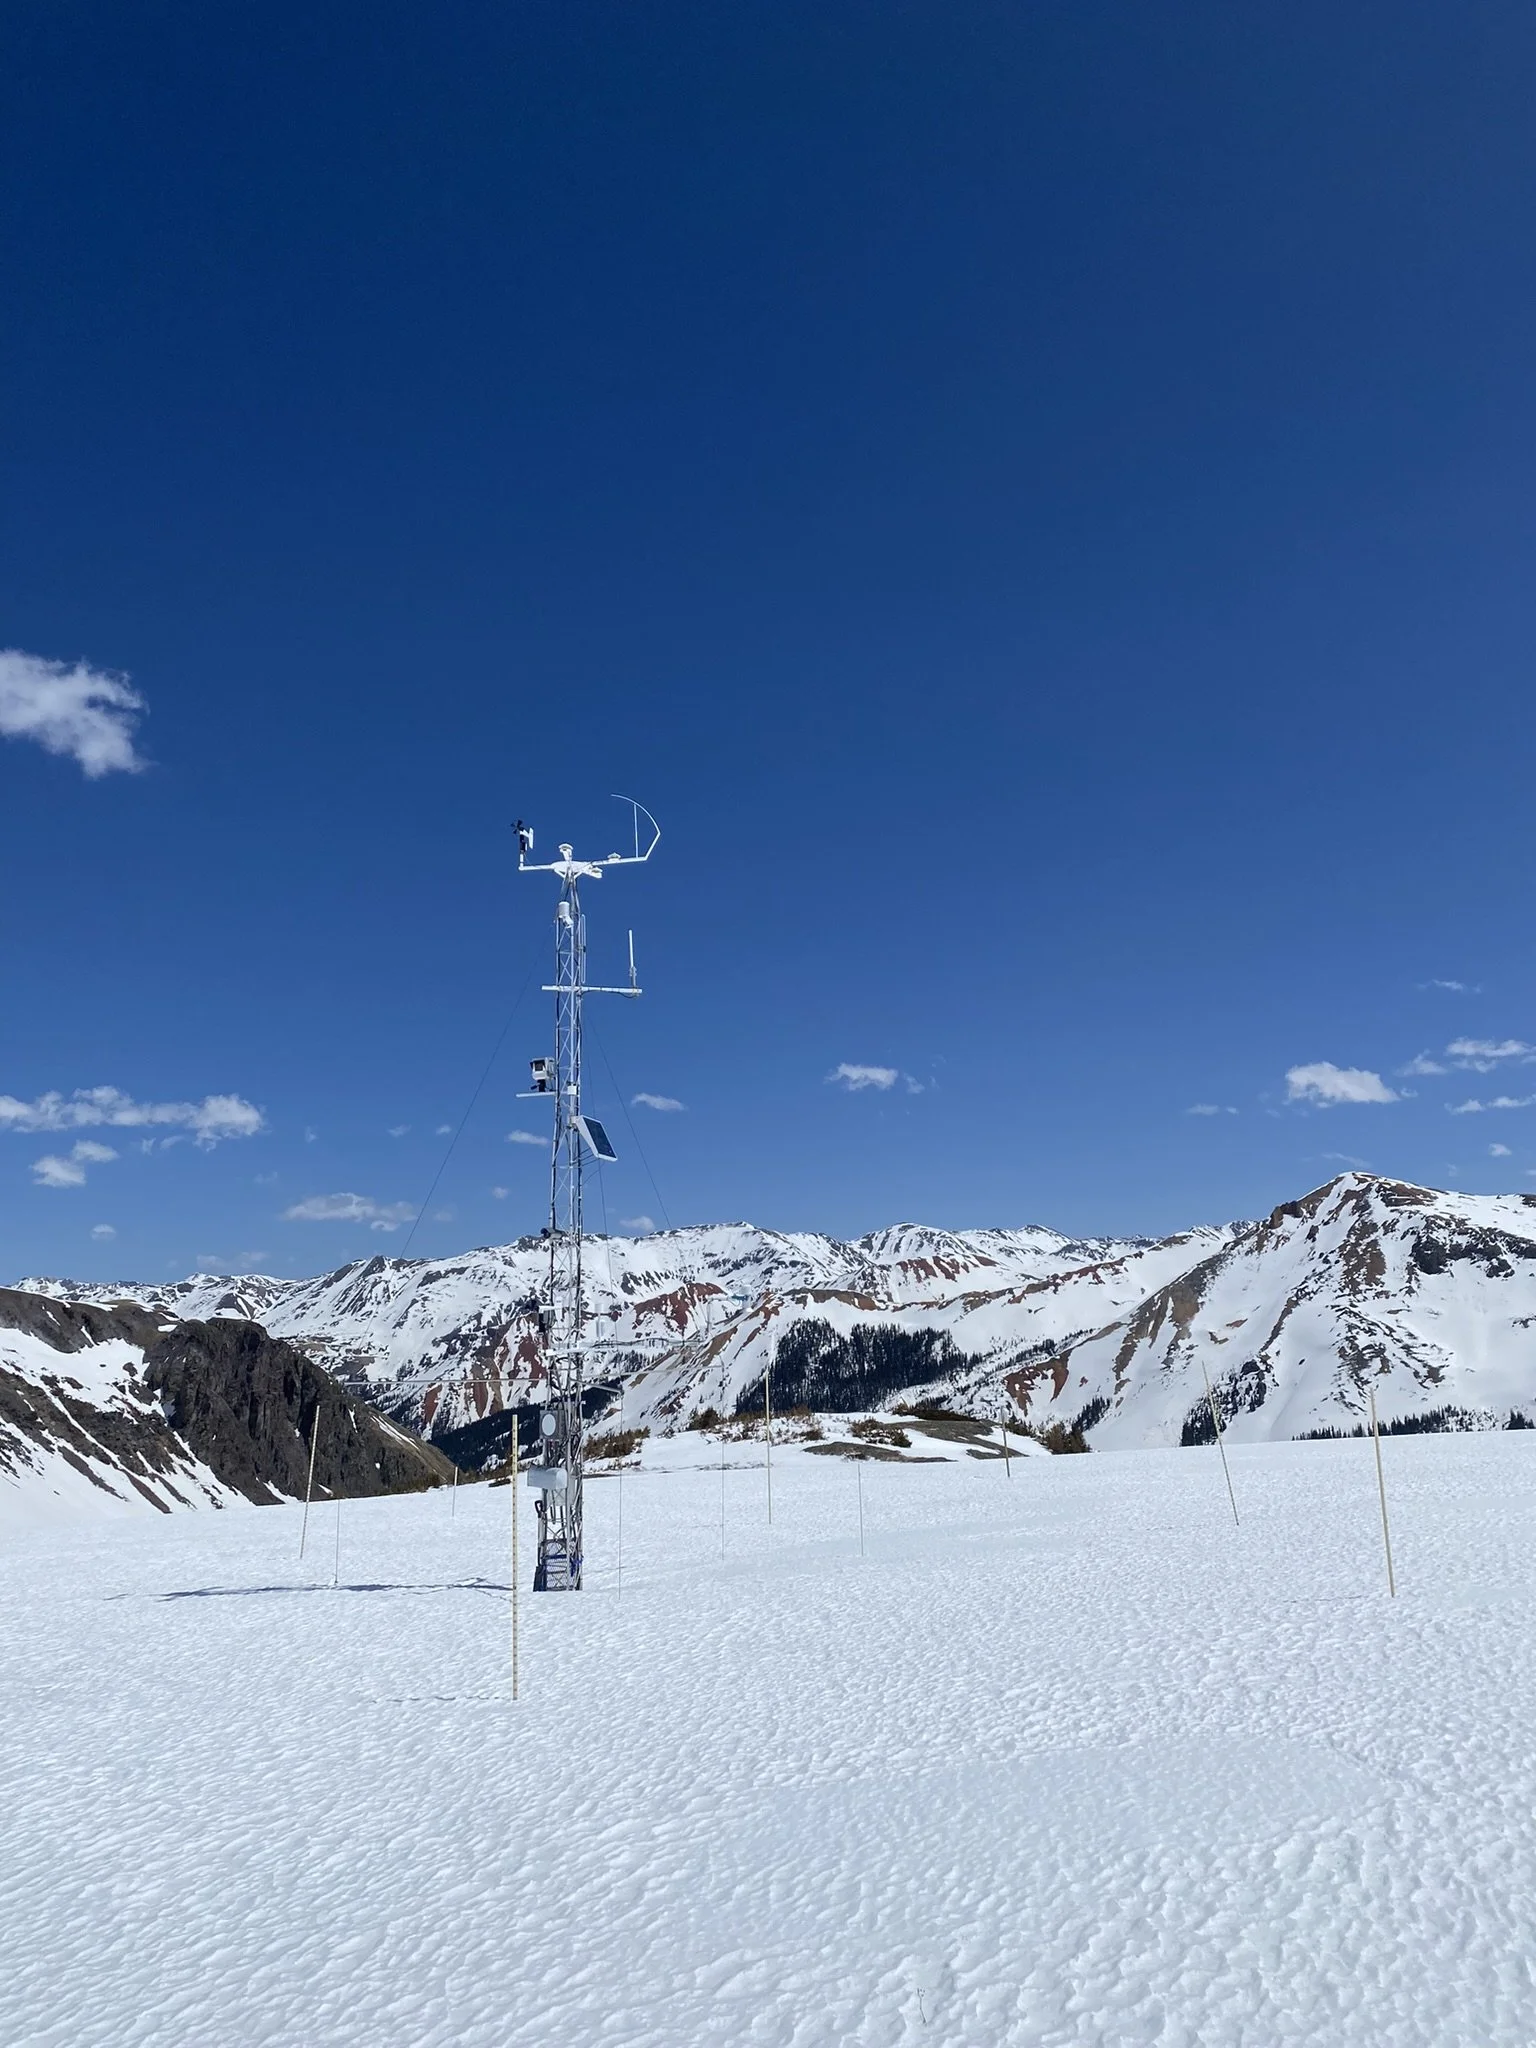
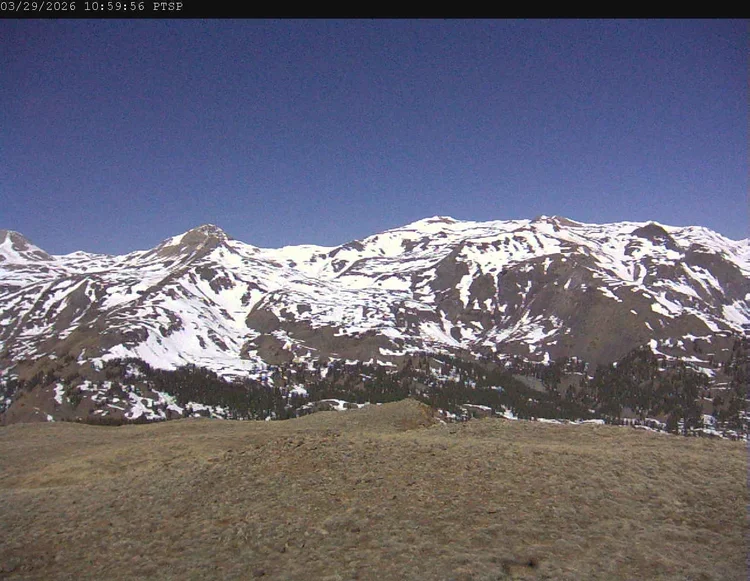
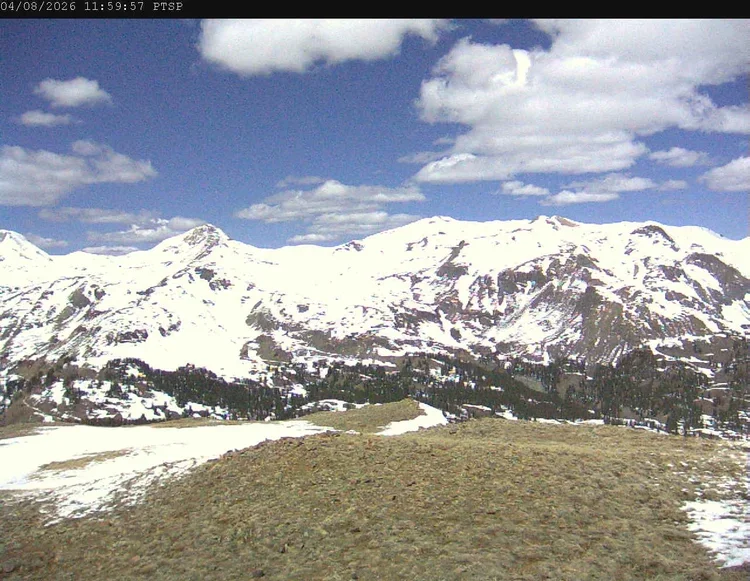
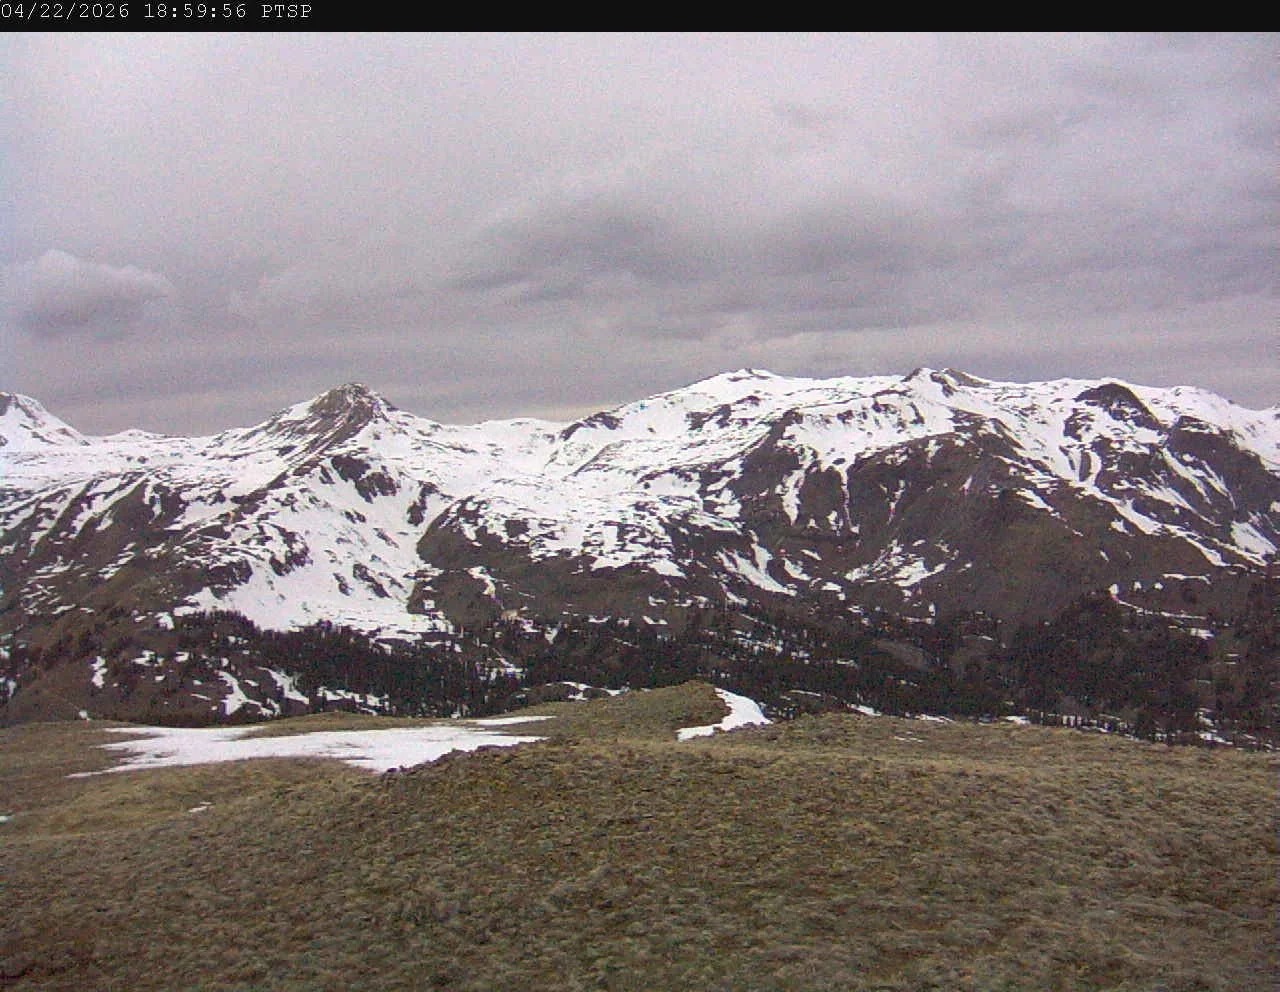
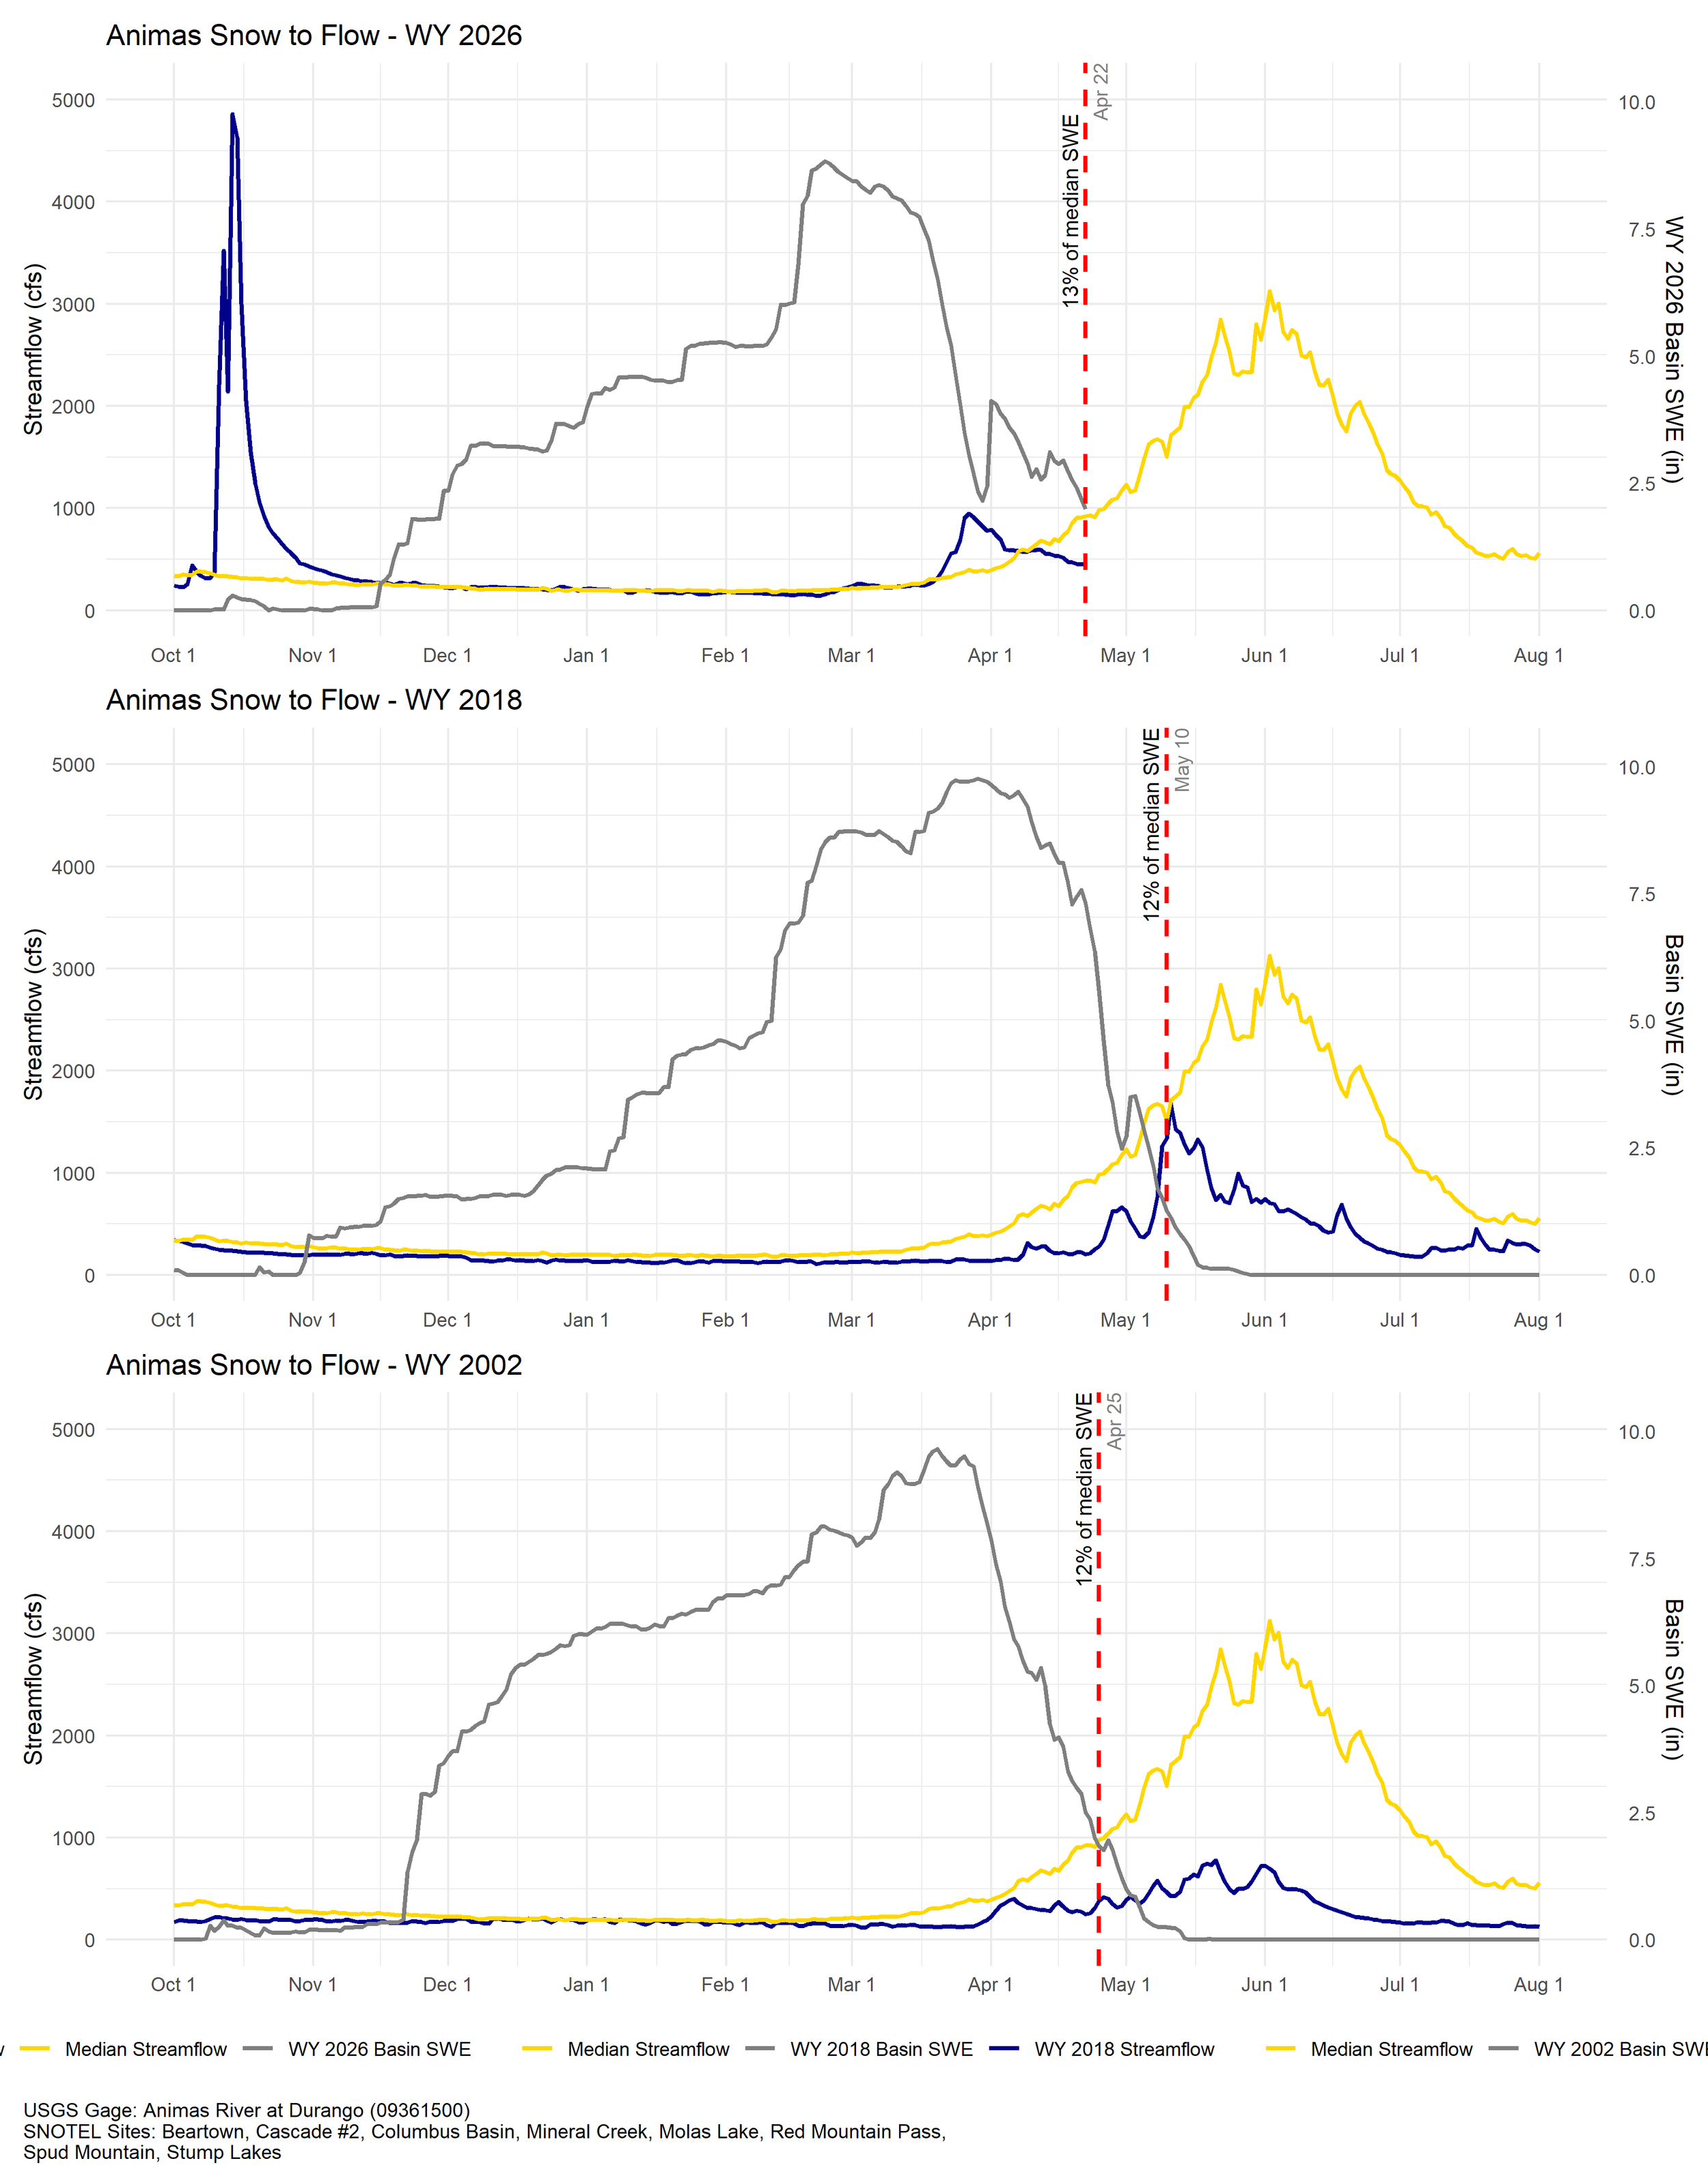
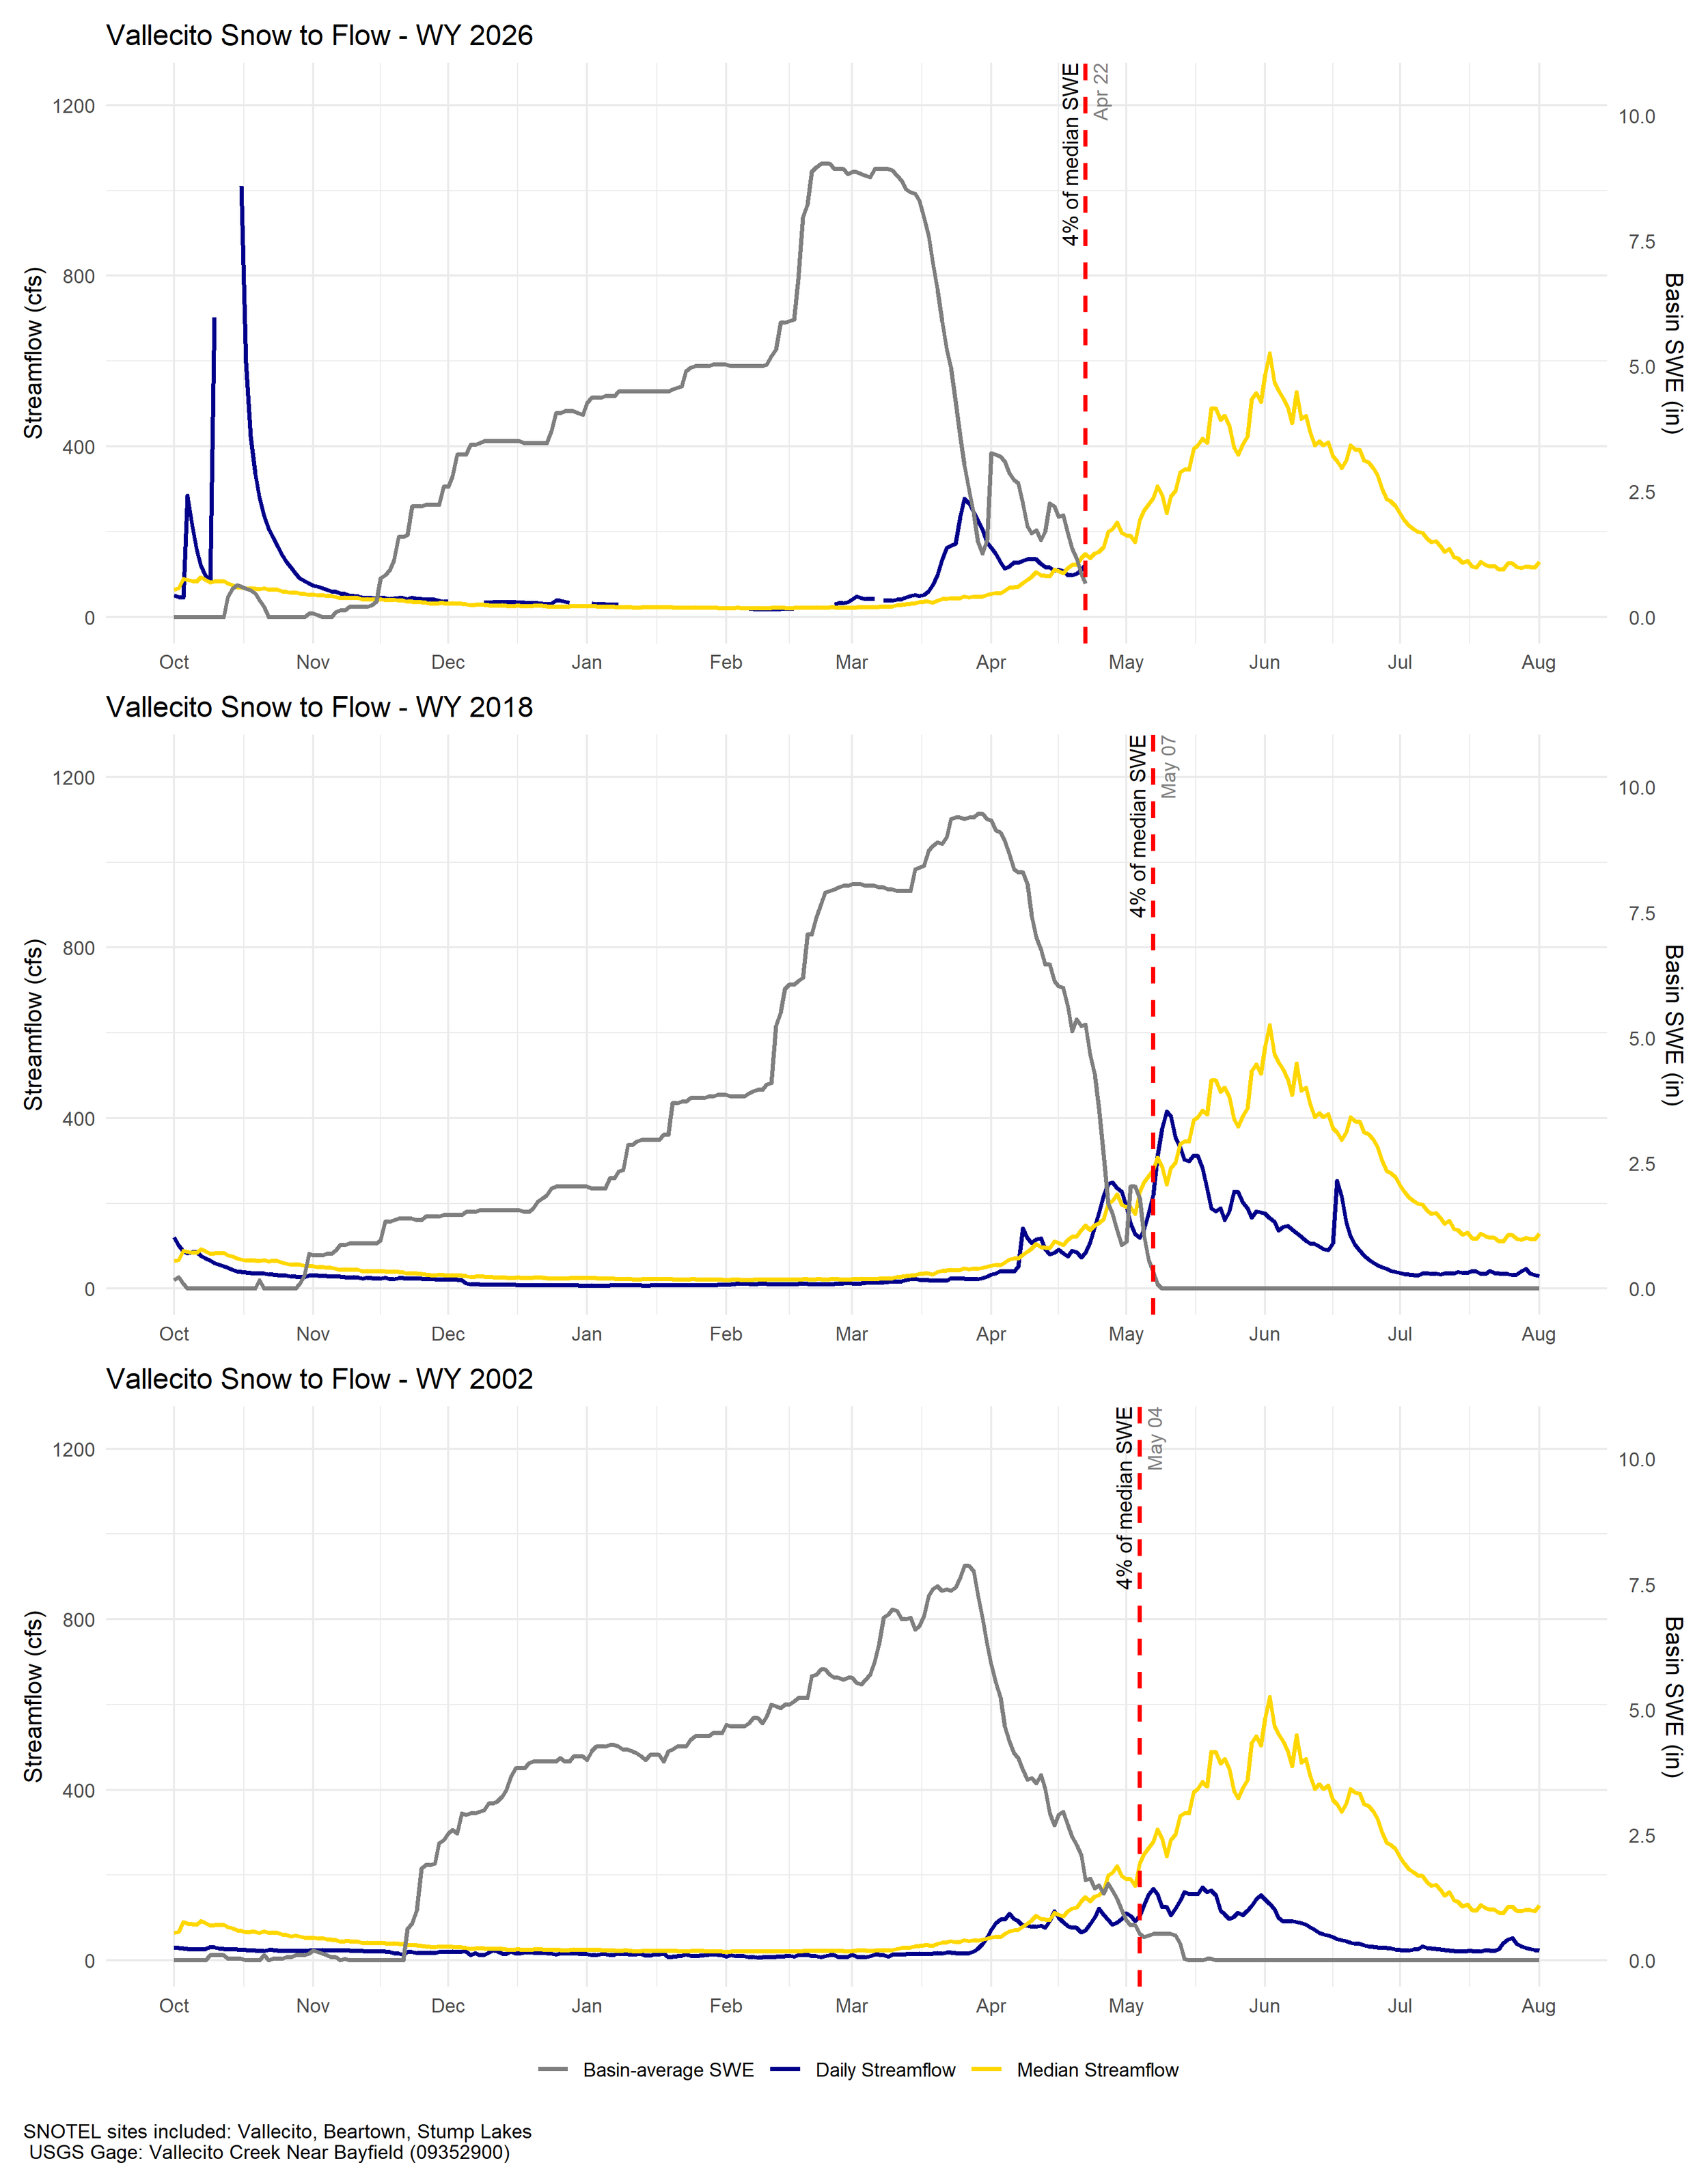
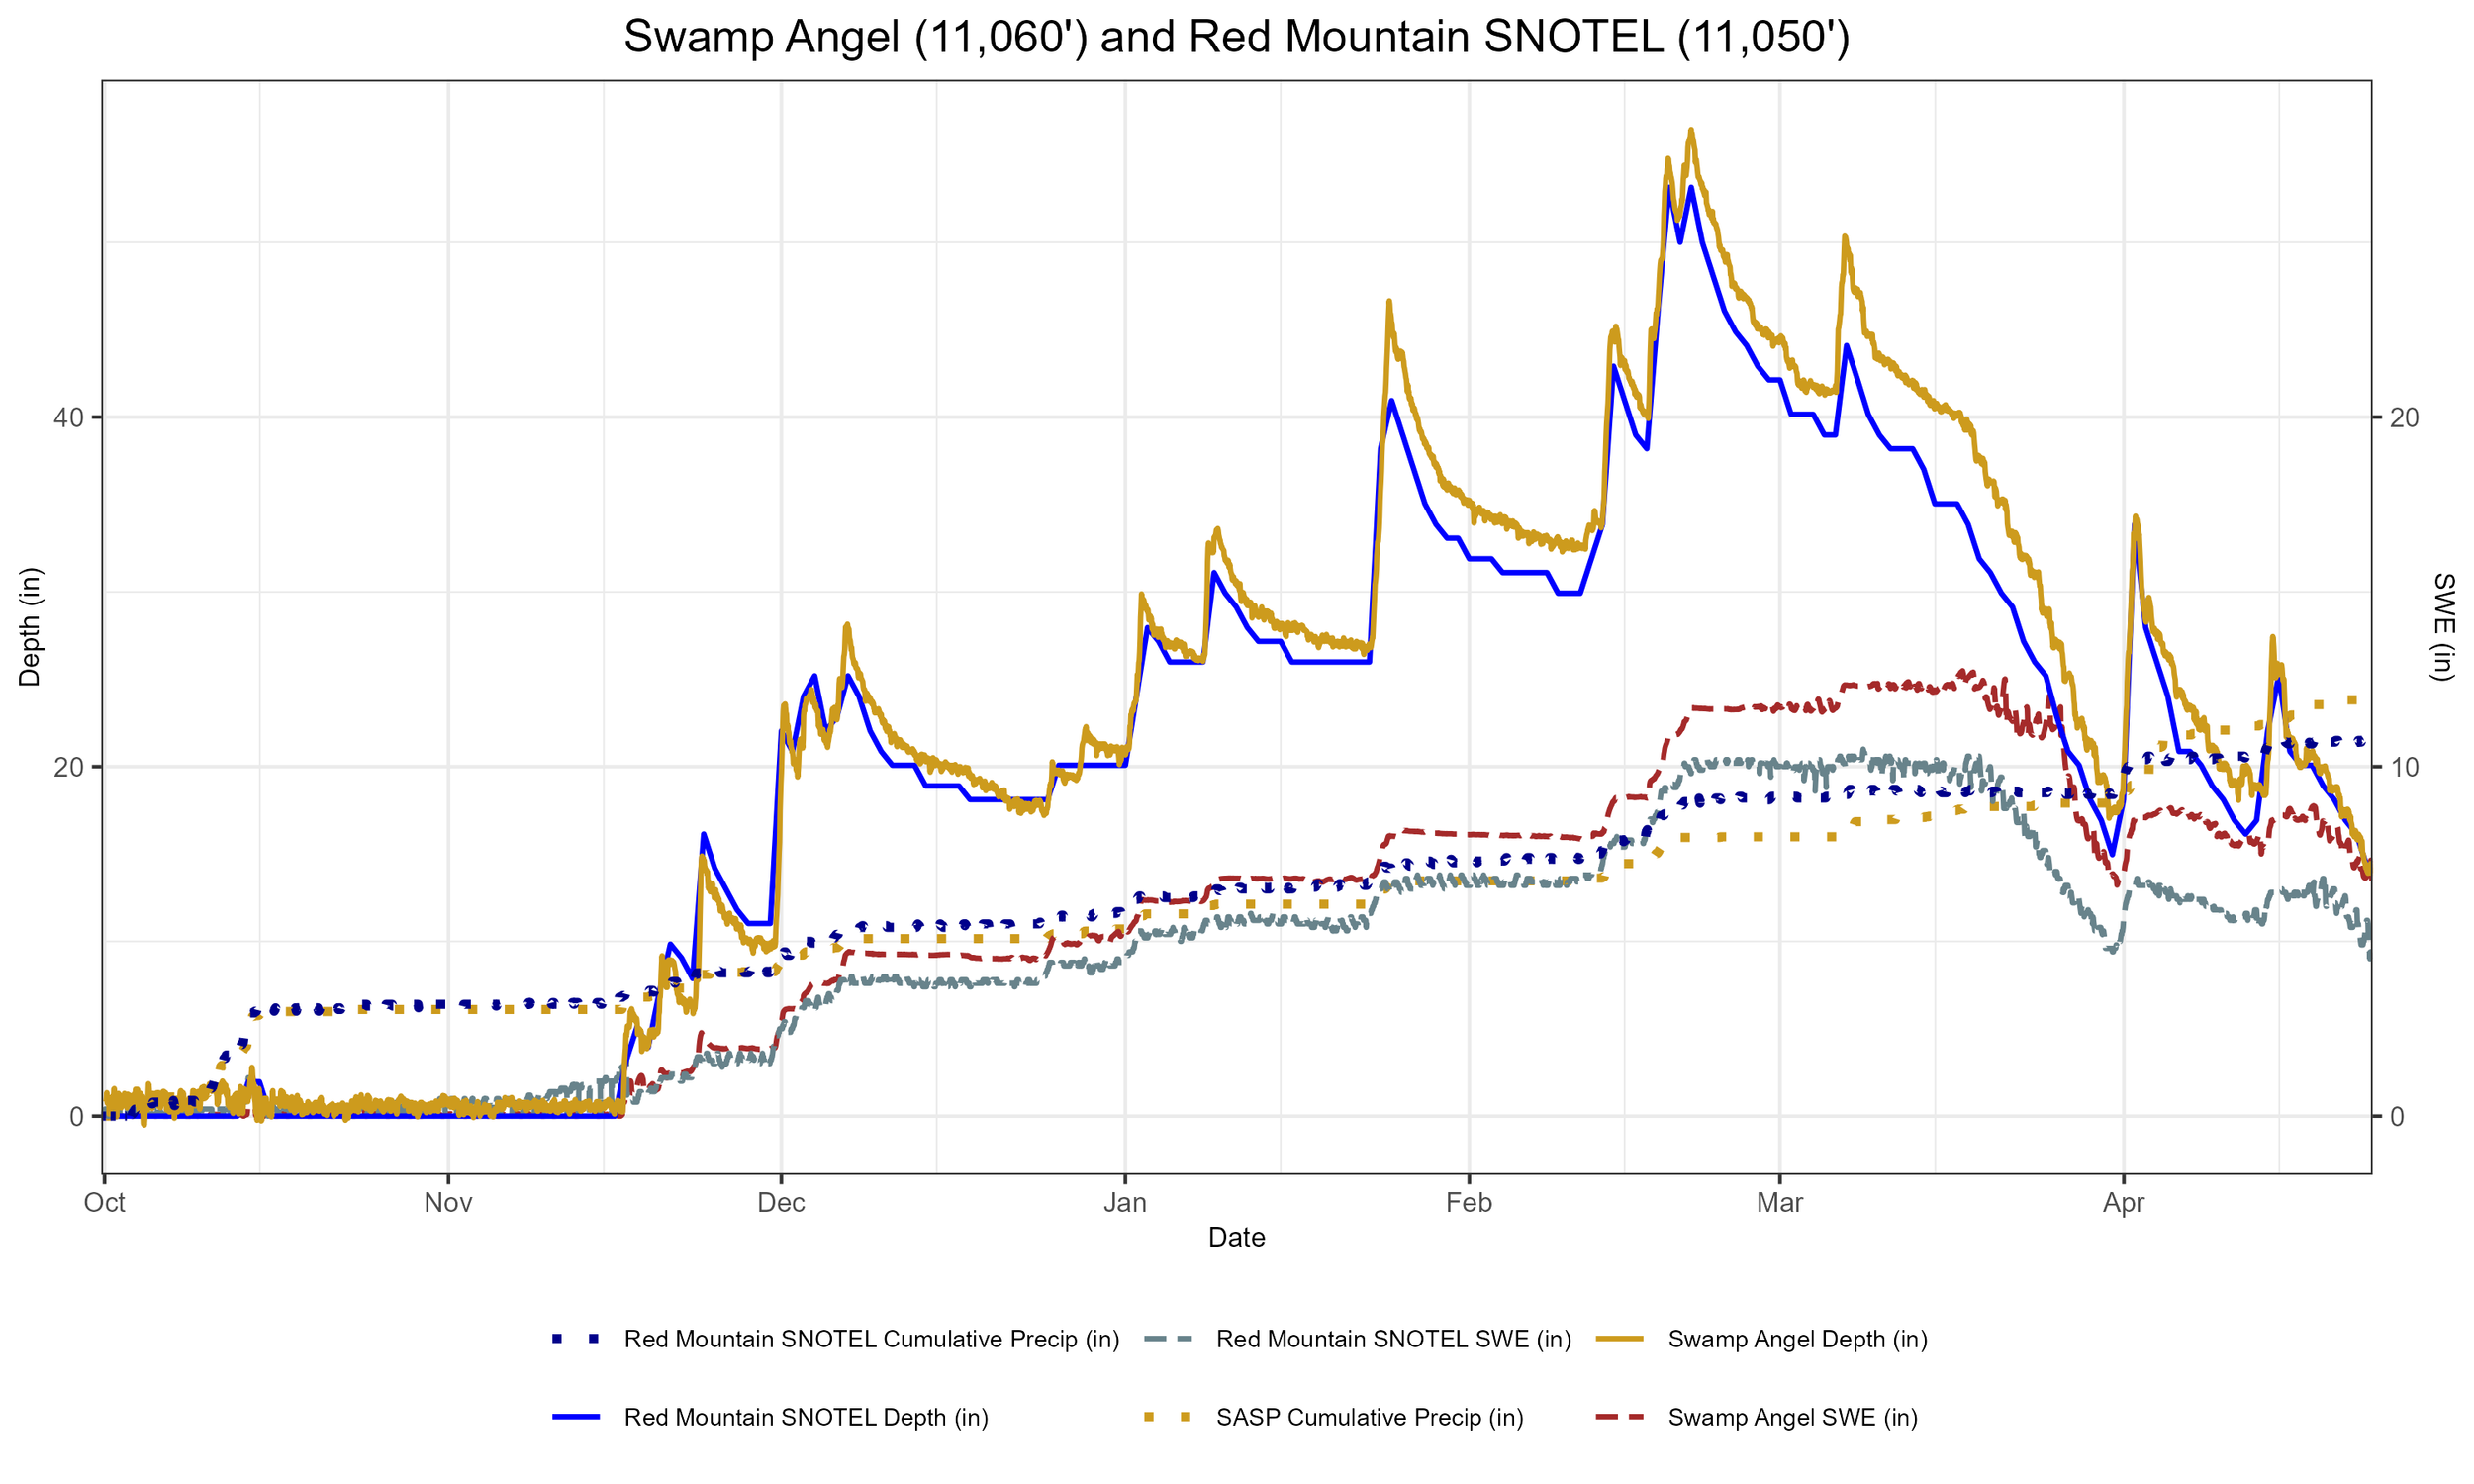
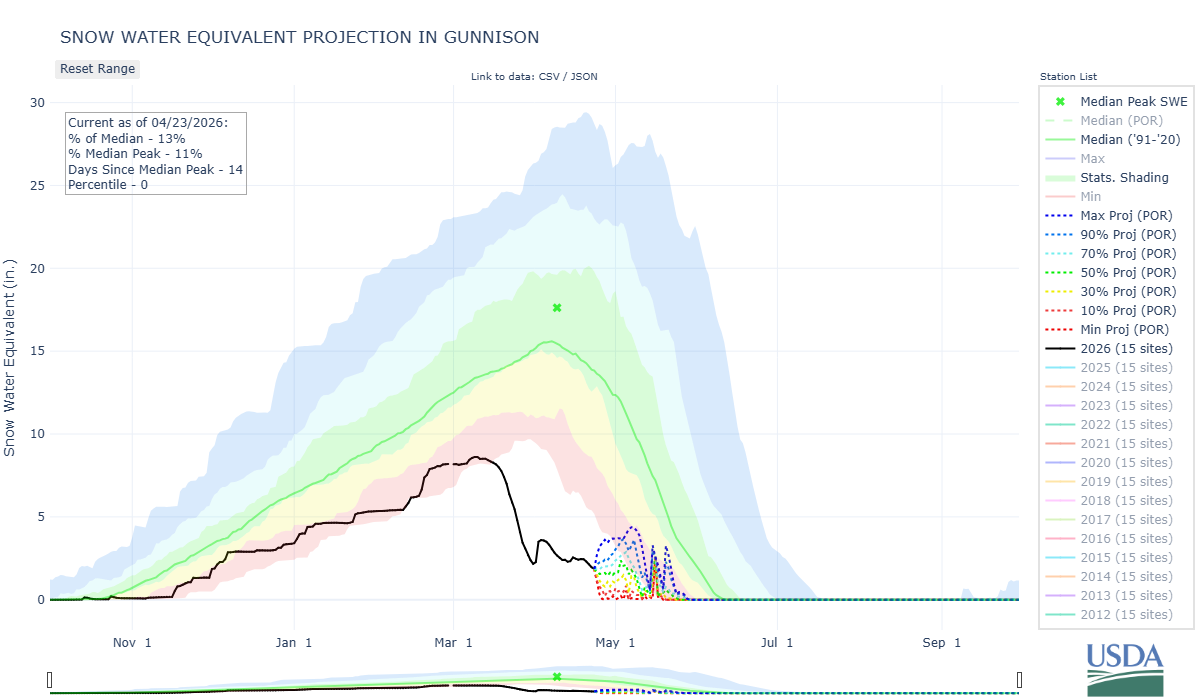
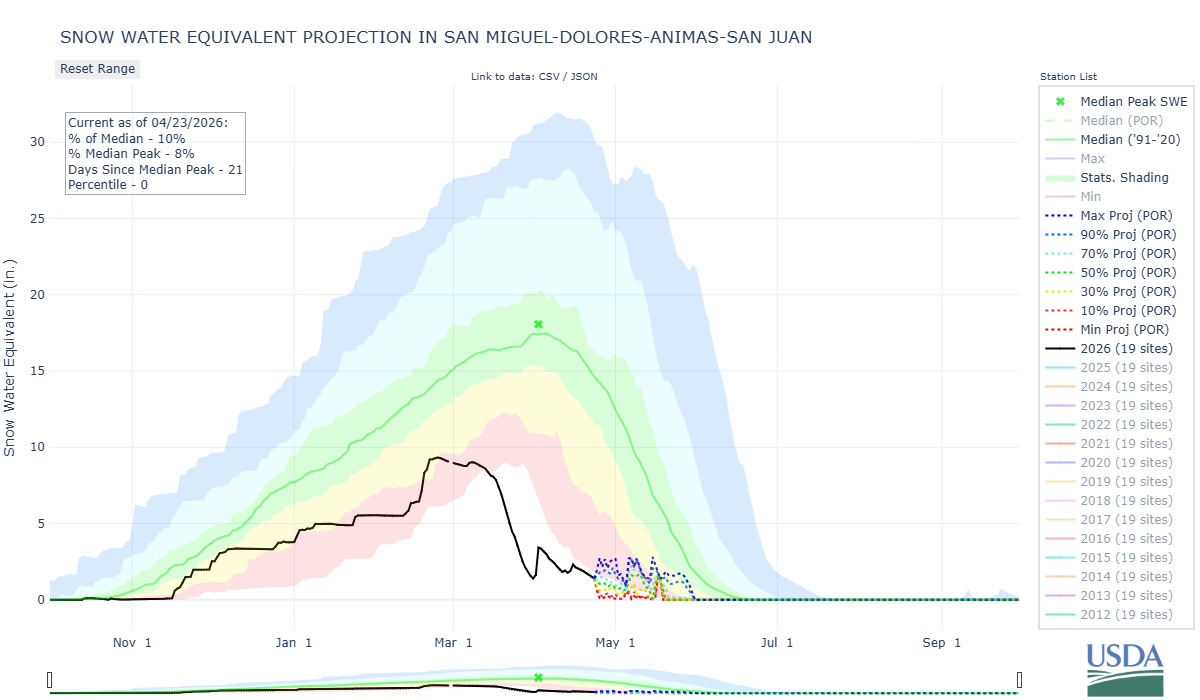
Below: Photos of Senator Beck Basin on March 29, April 8, and April 22, from left to right. After a couple storms the first week of April we are back to where we were the end of March in terms of snow covered area. Station data shows the same, see snow depth and SWE plots below. The Animas Basin is at 12-13 % SWE (plots show this water year, WY 2018, and WY 2002). Vallecito on the right shows just 4 % of median SWE.
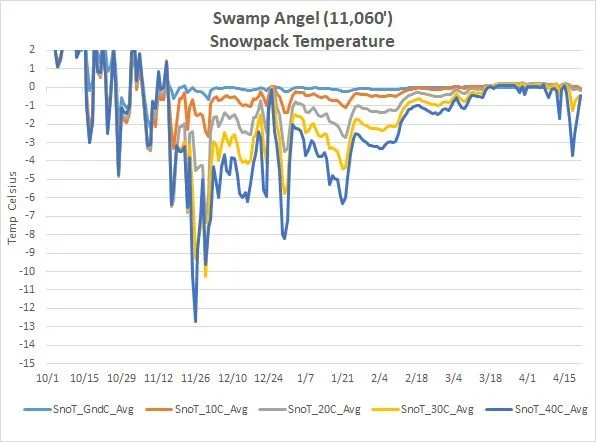
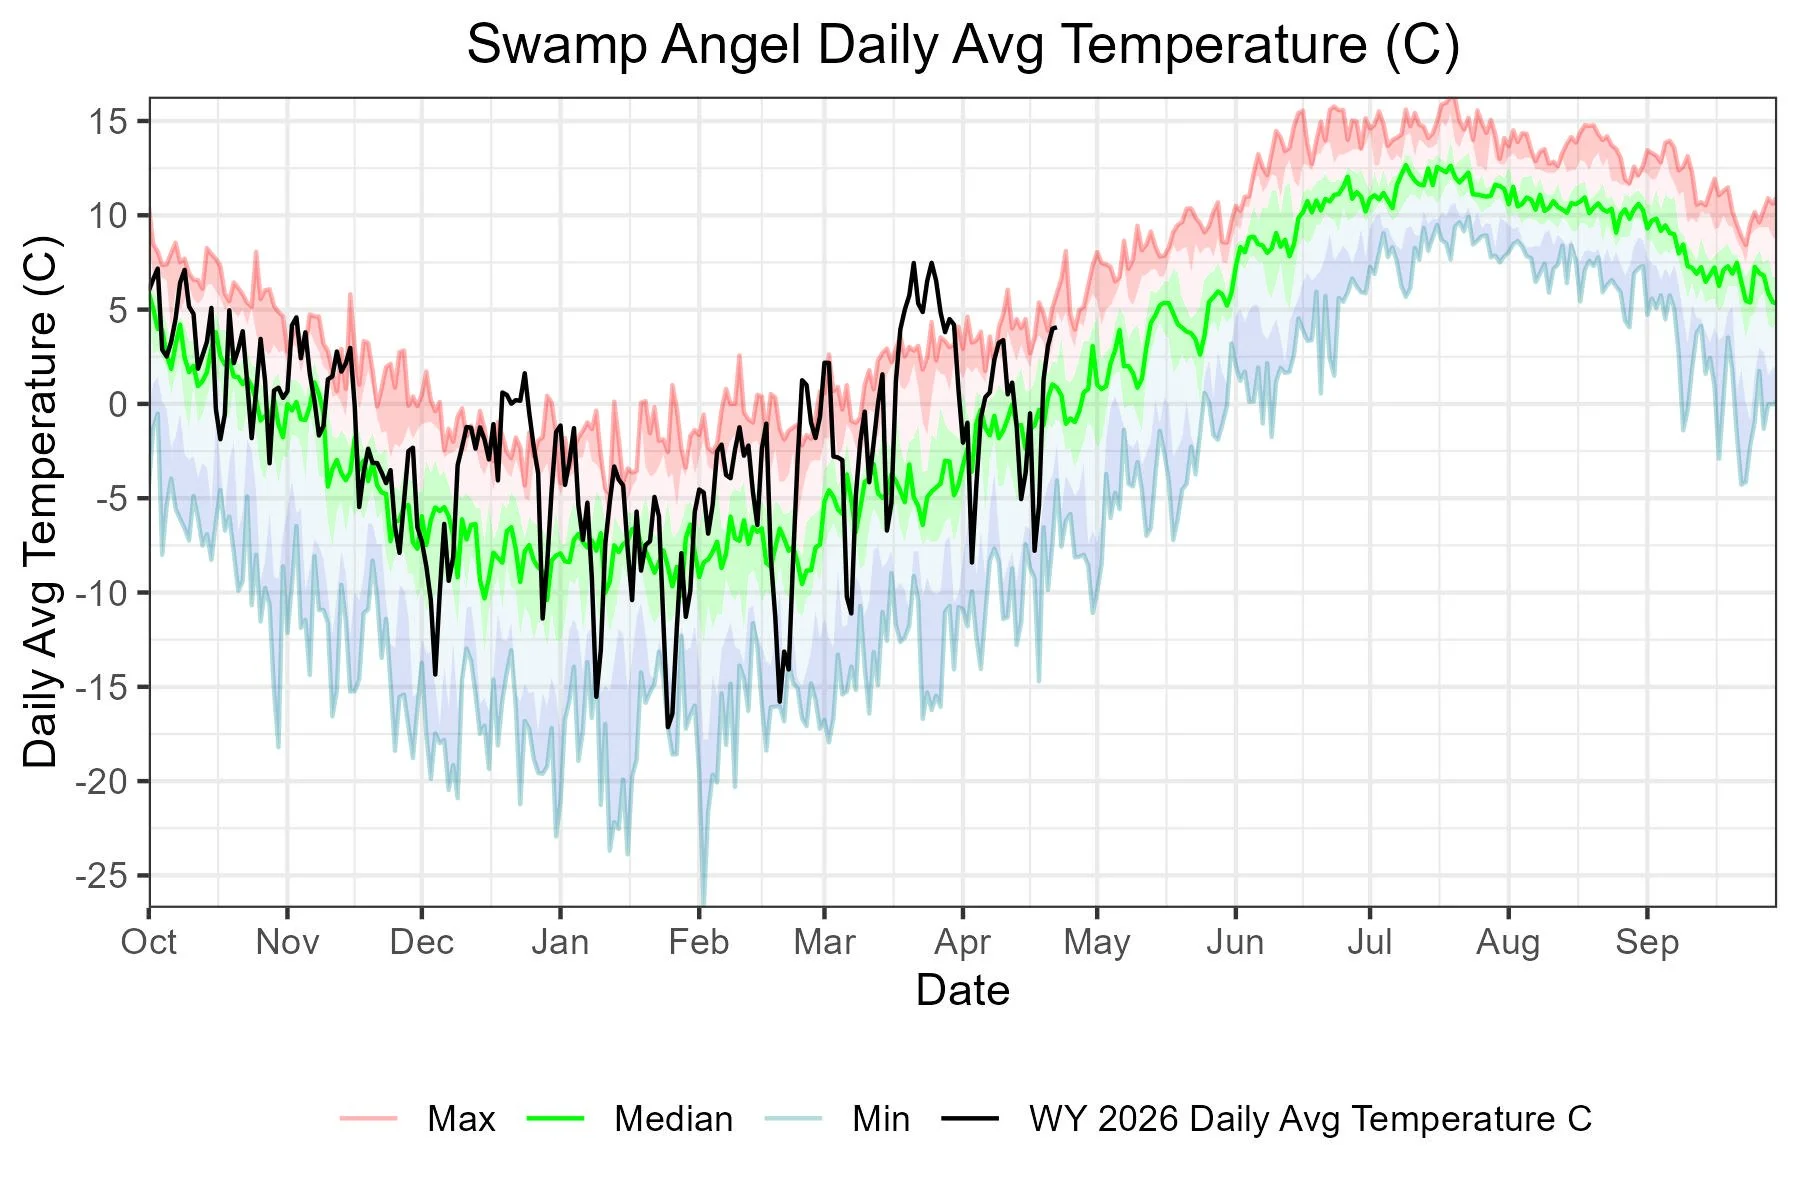
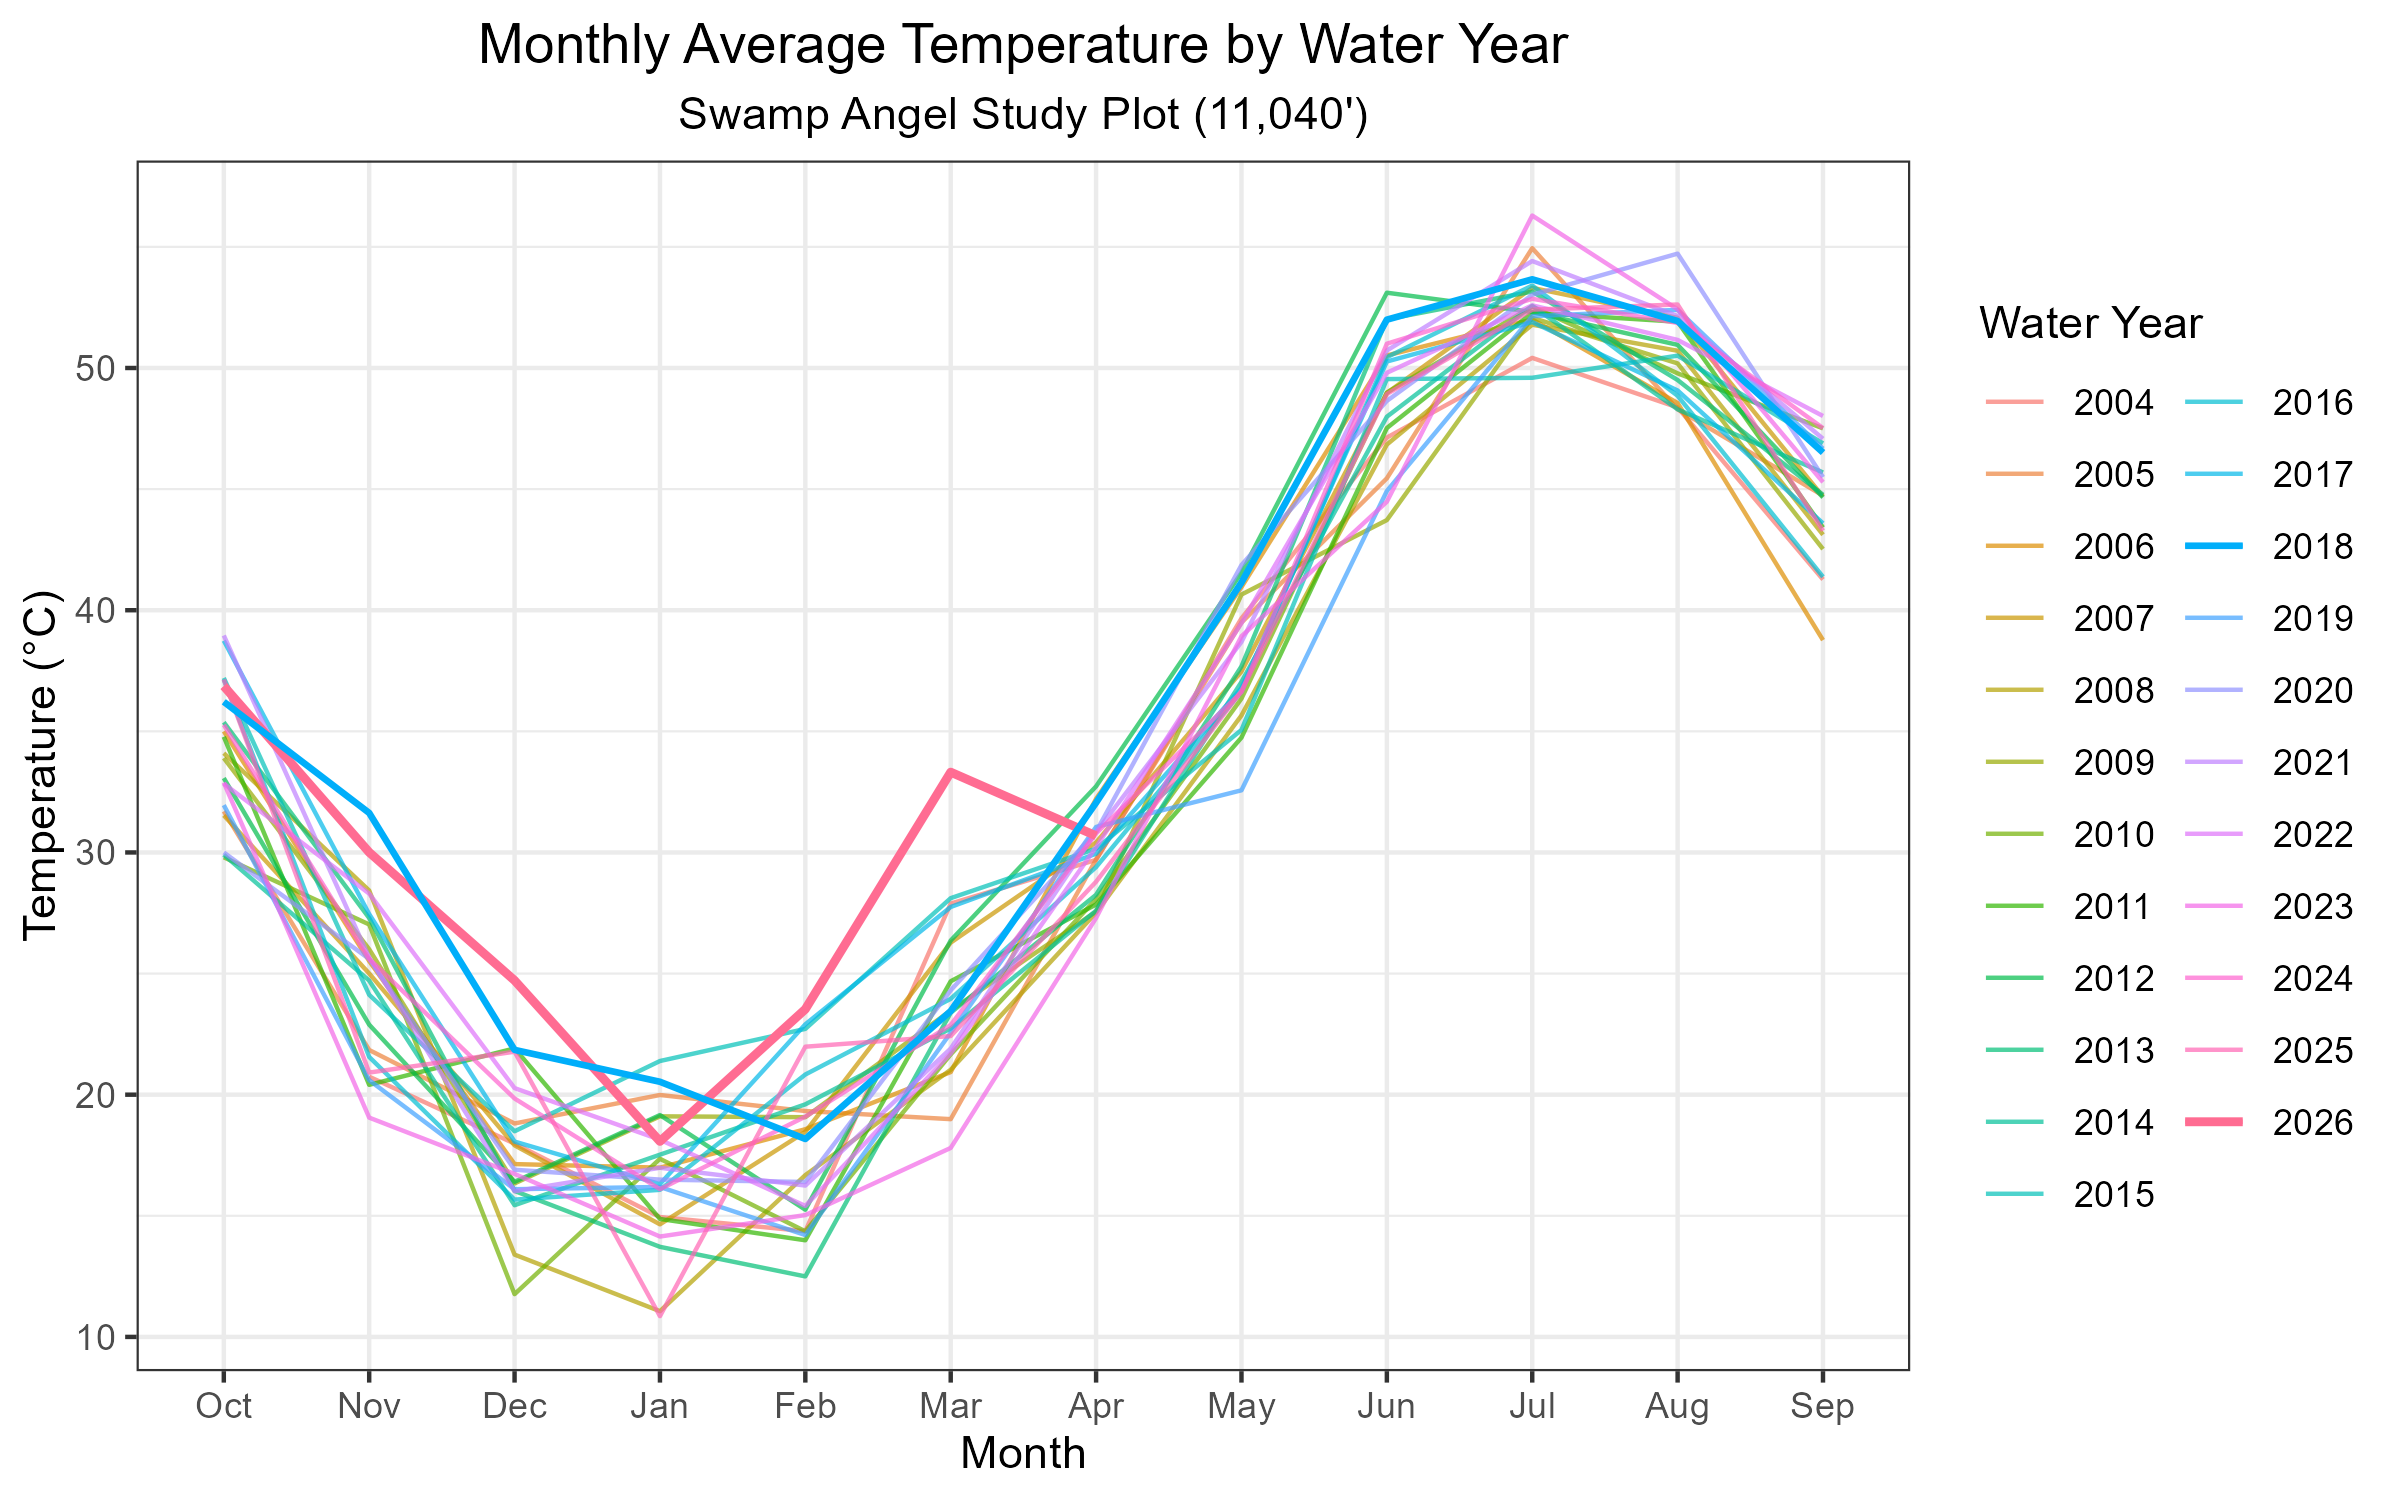
Below: Snowpack temperatures near surface have cooled a bit due to a return to more normal temperature conditions, particularly in the evening.
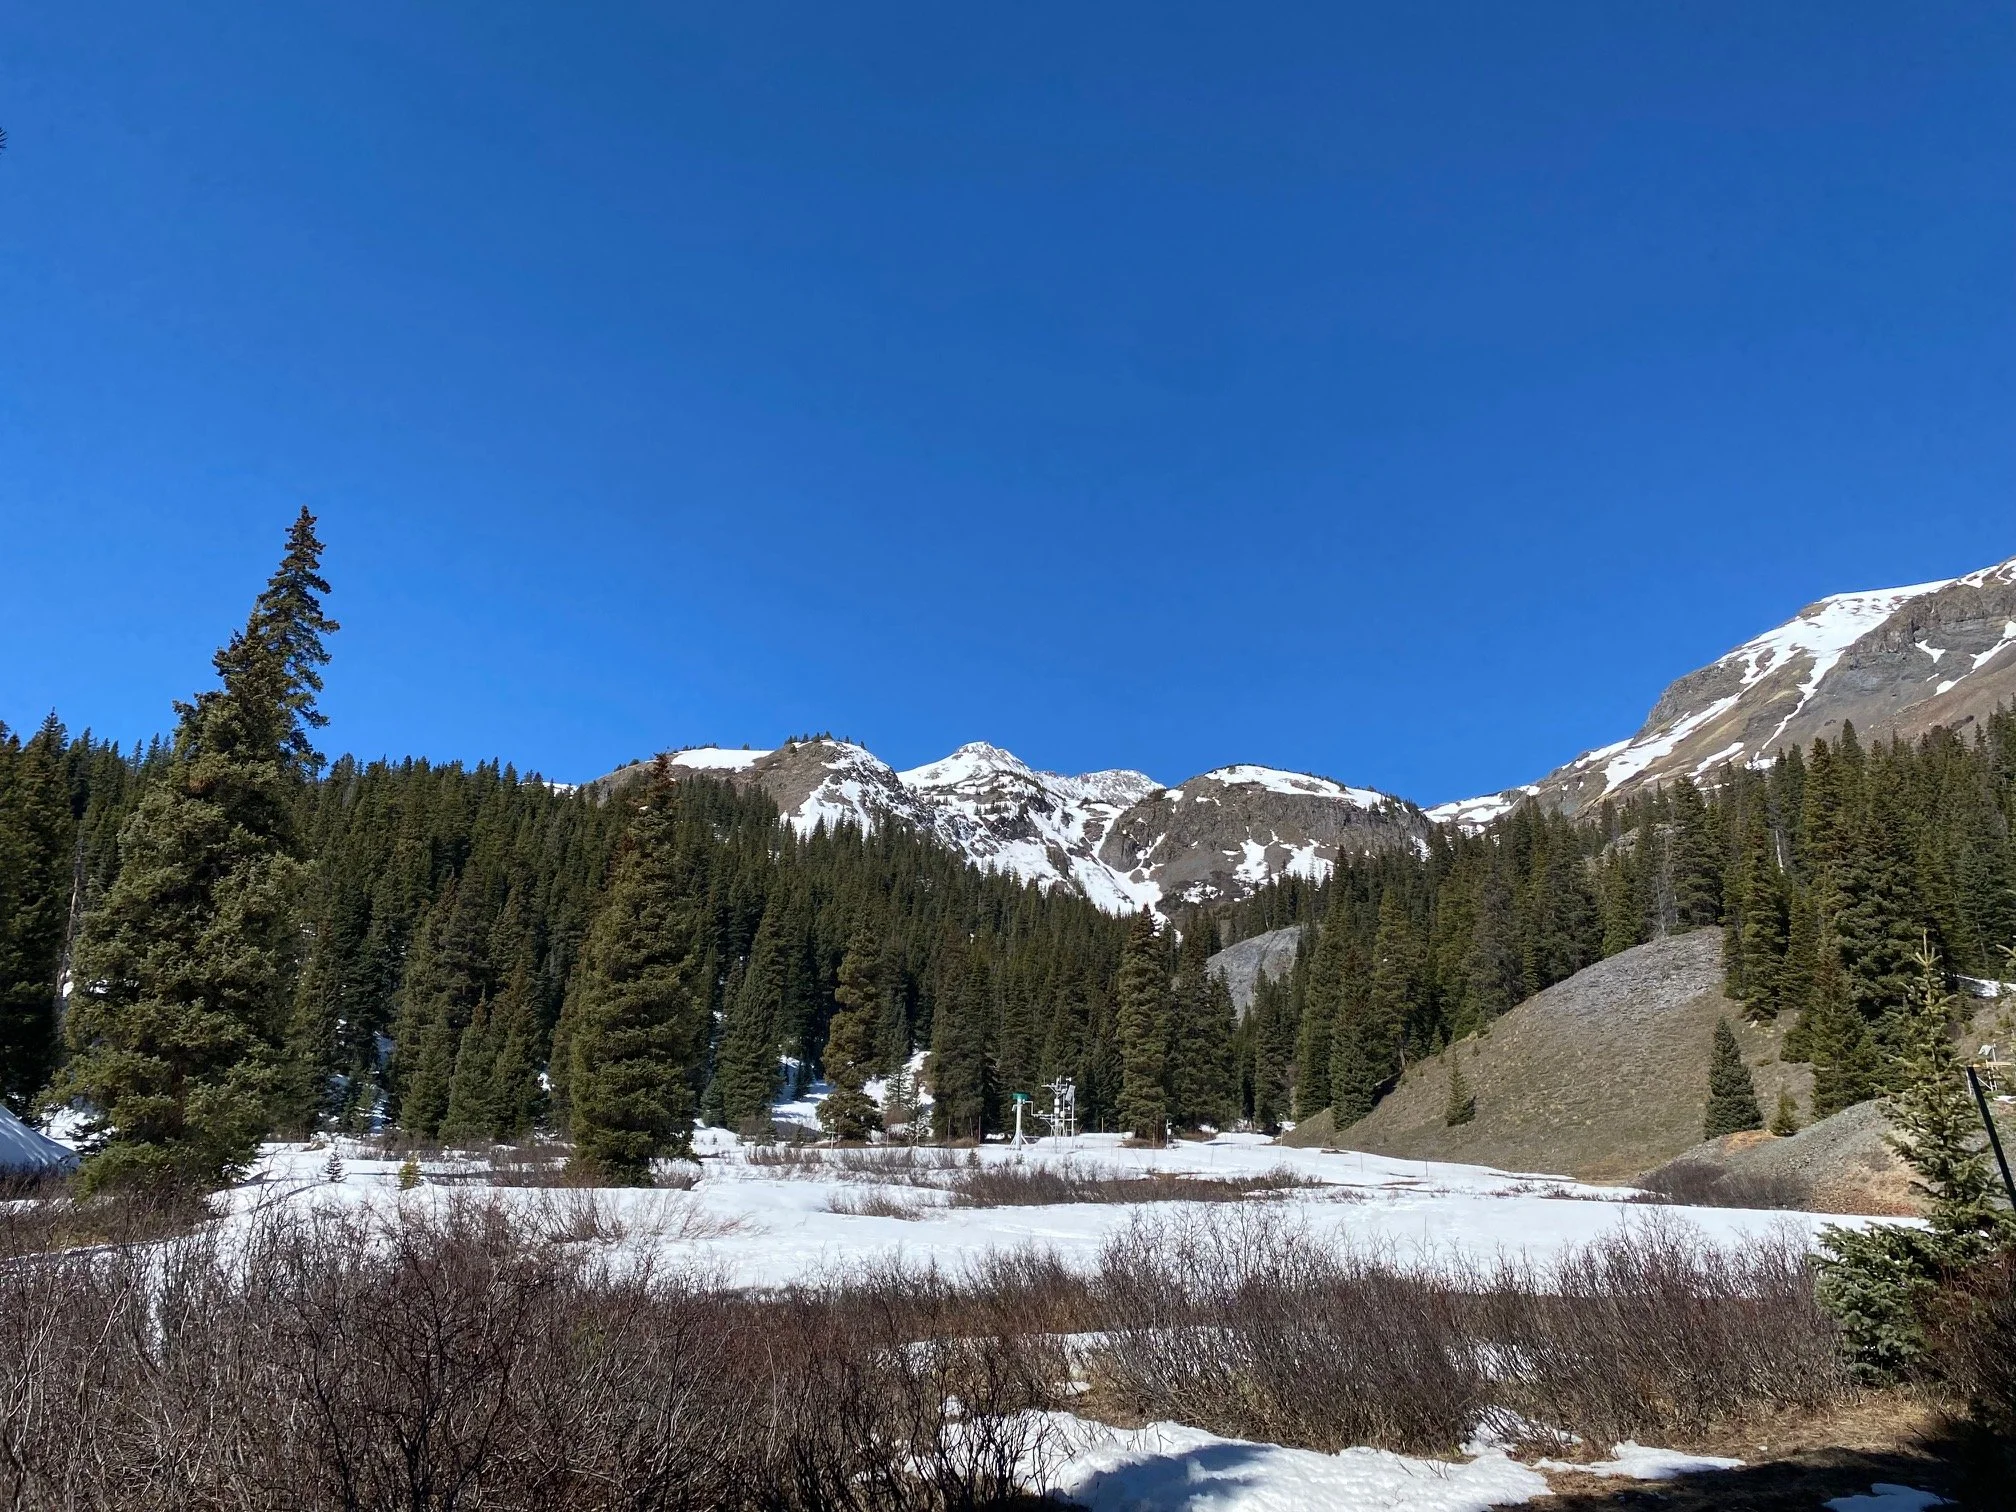
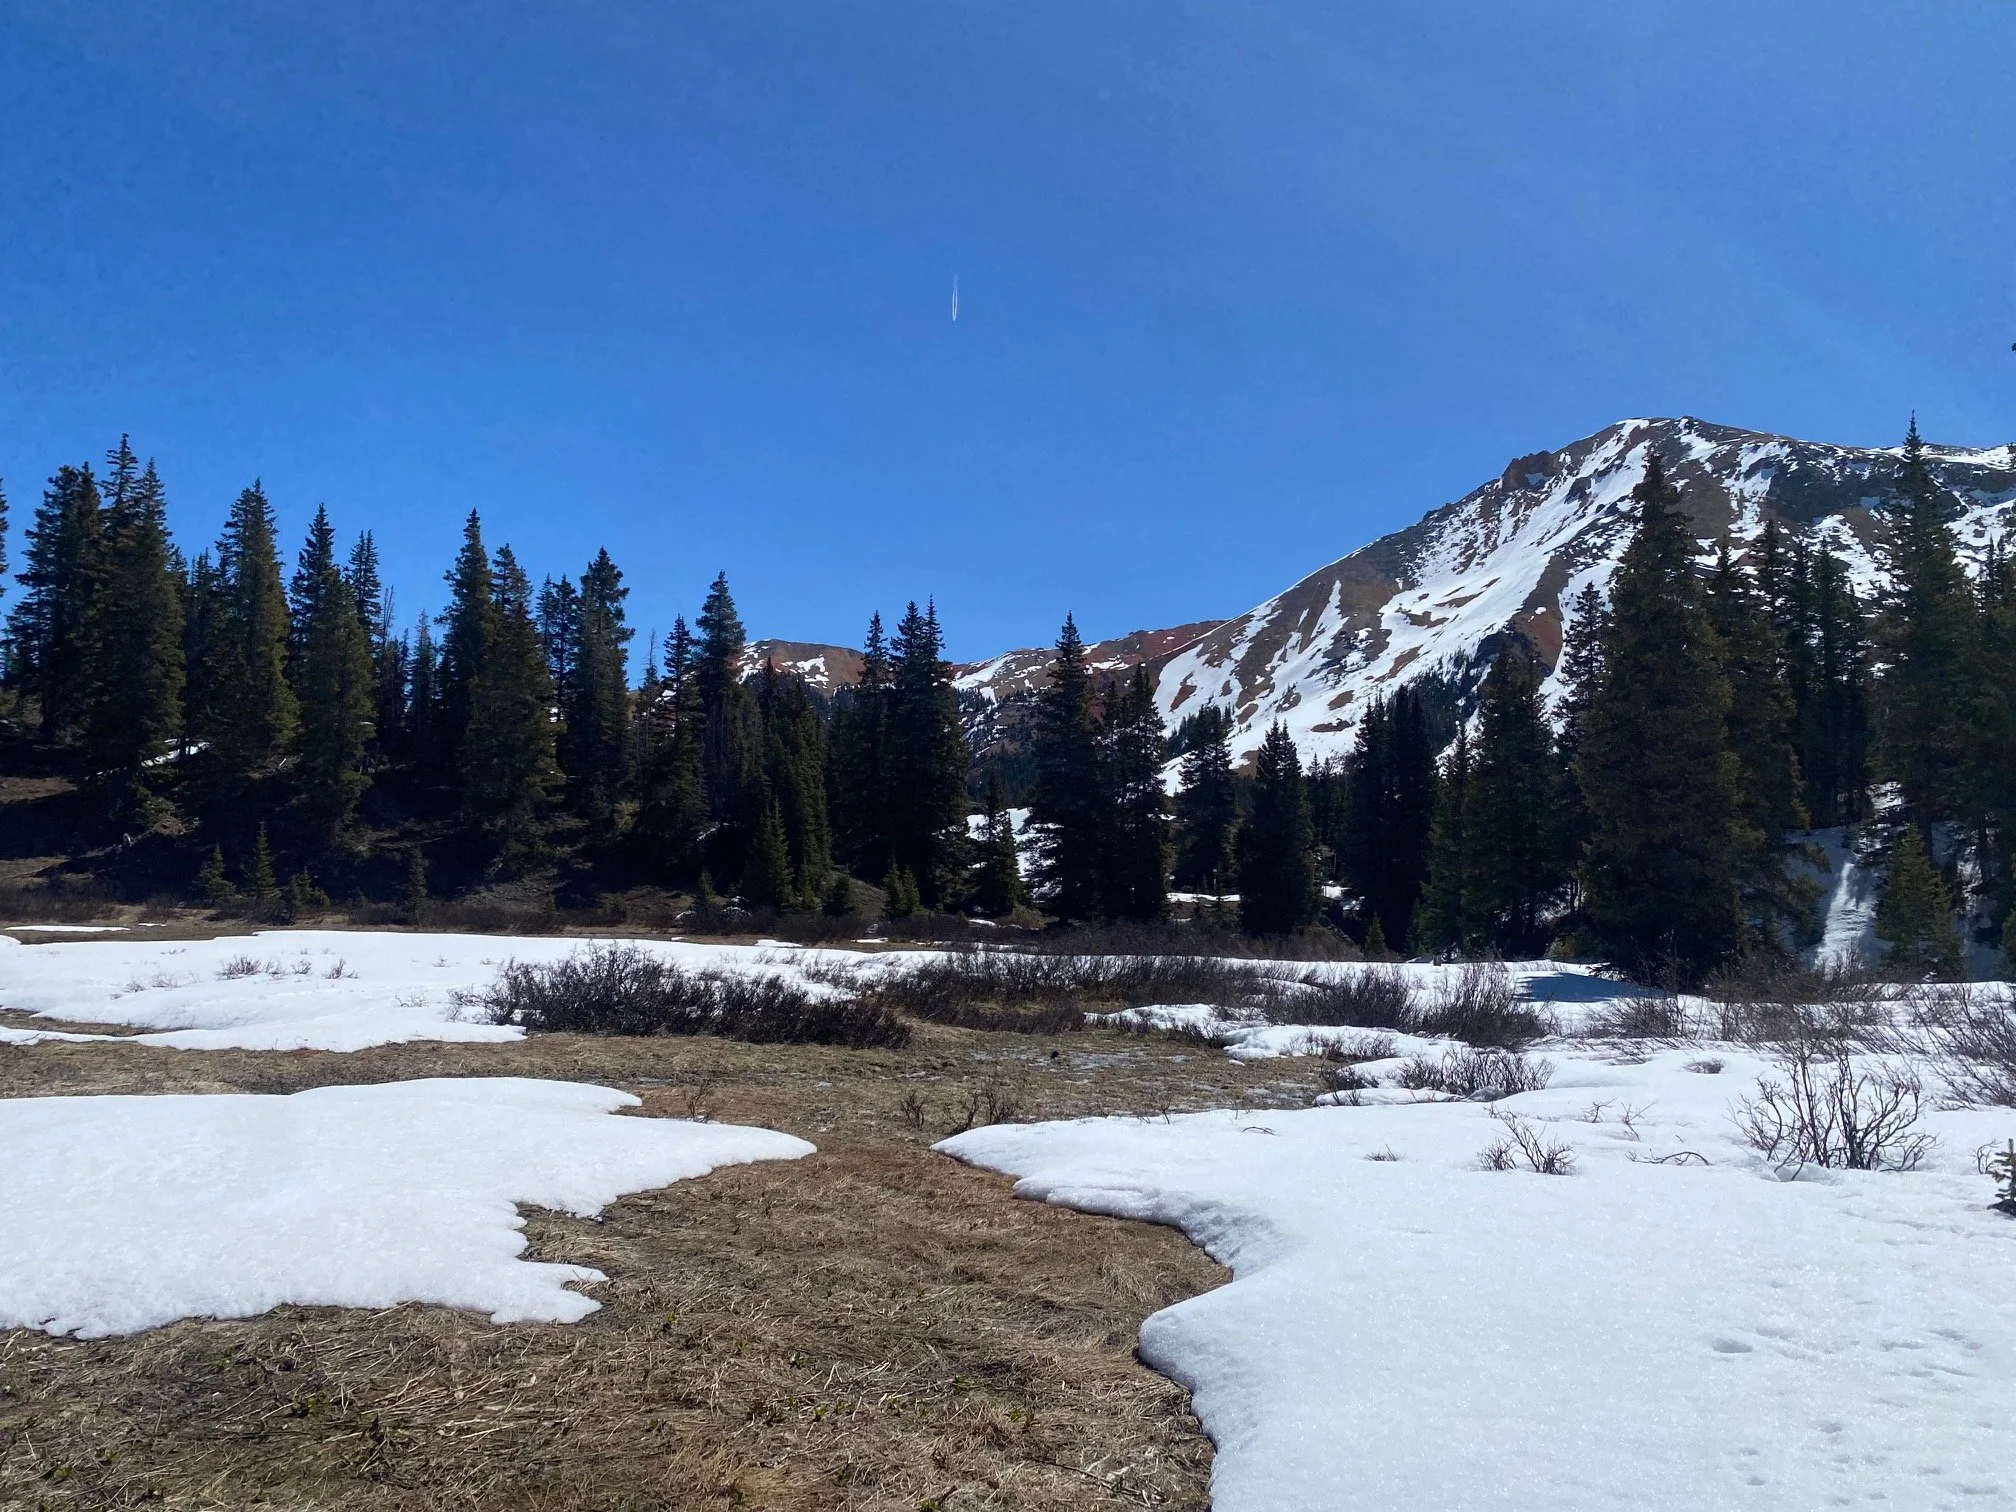
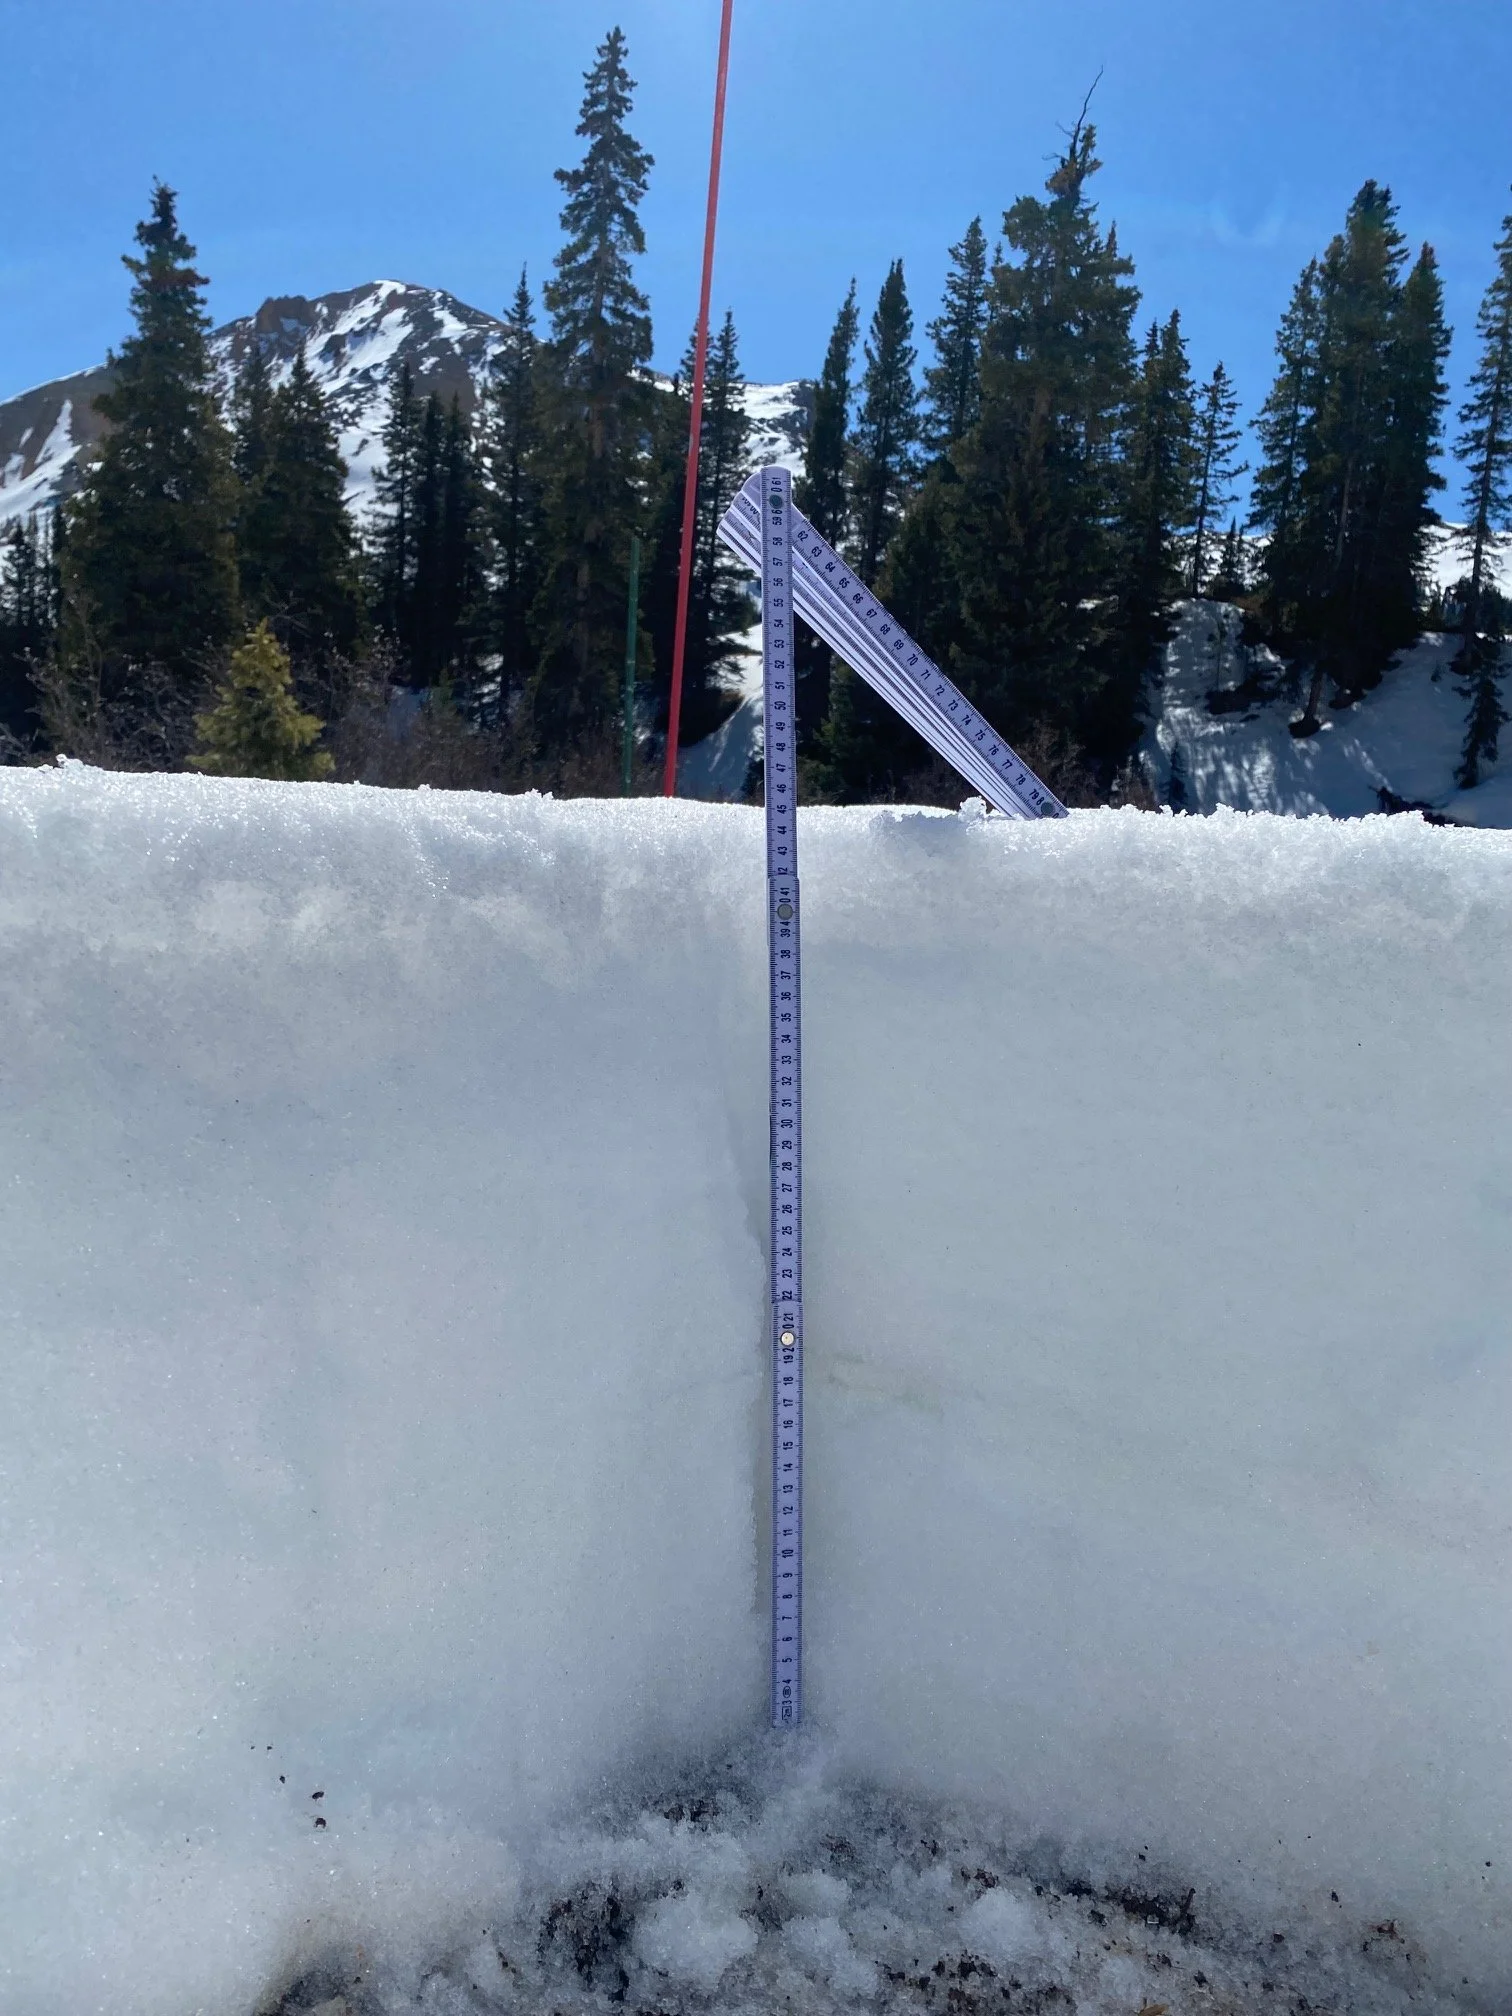
Below: Swamp Angel on April 24, 2026. Snow very near gone. Maybe the forecasted snow this Sunday will delay full melt a few days?
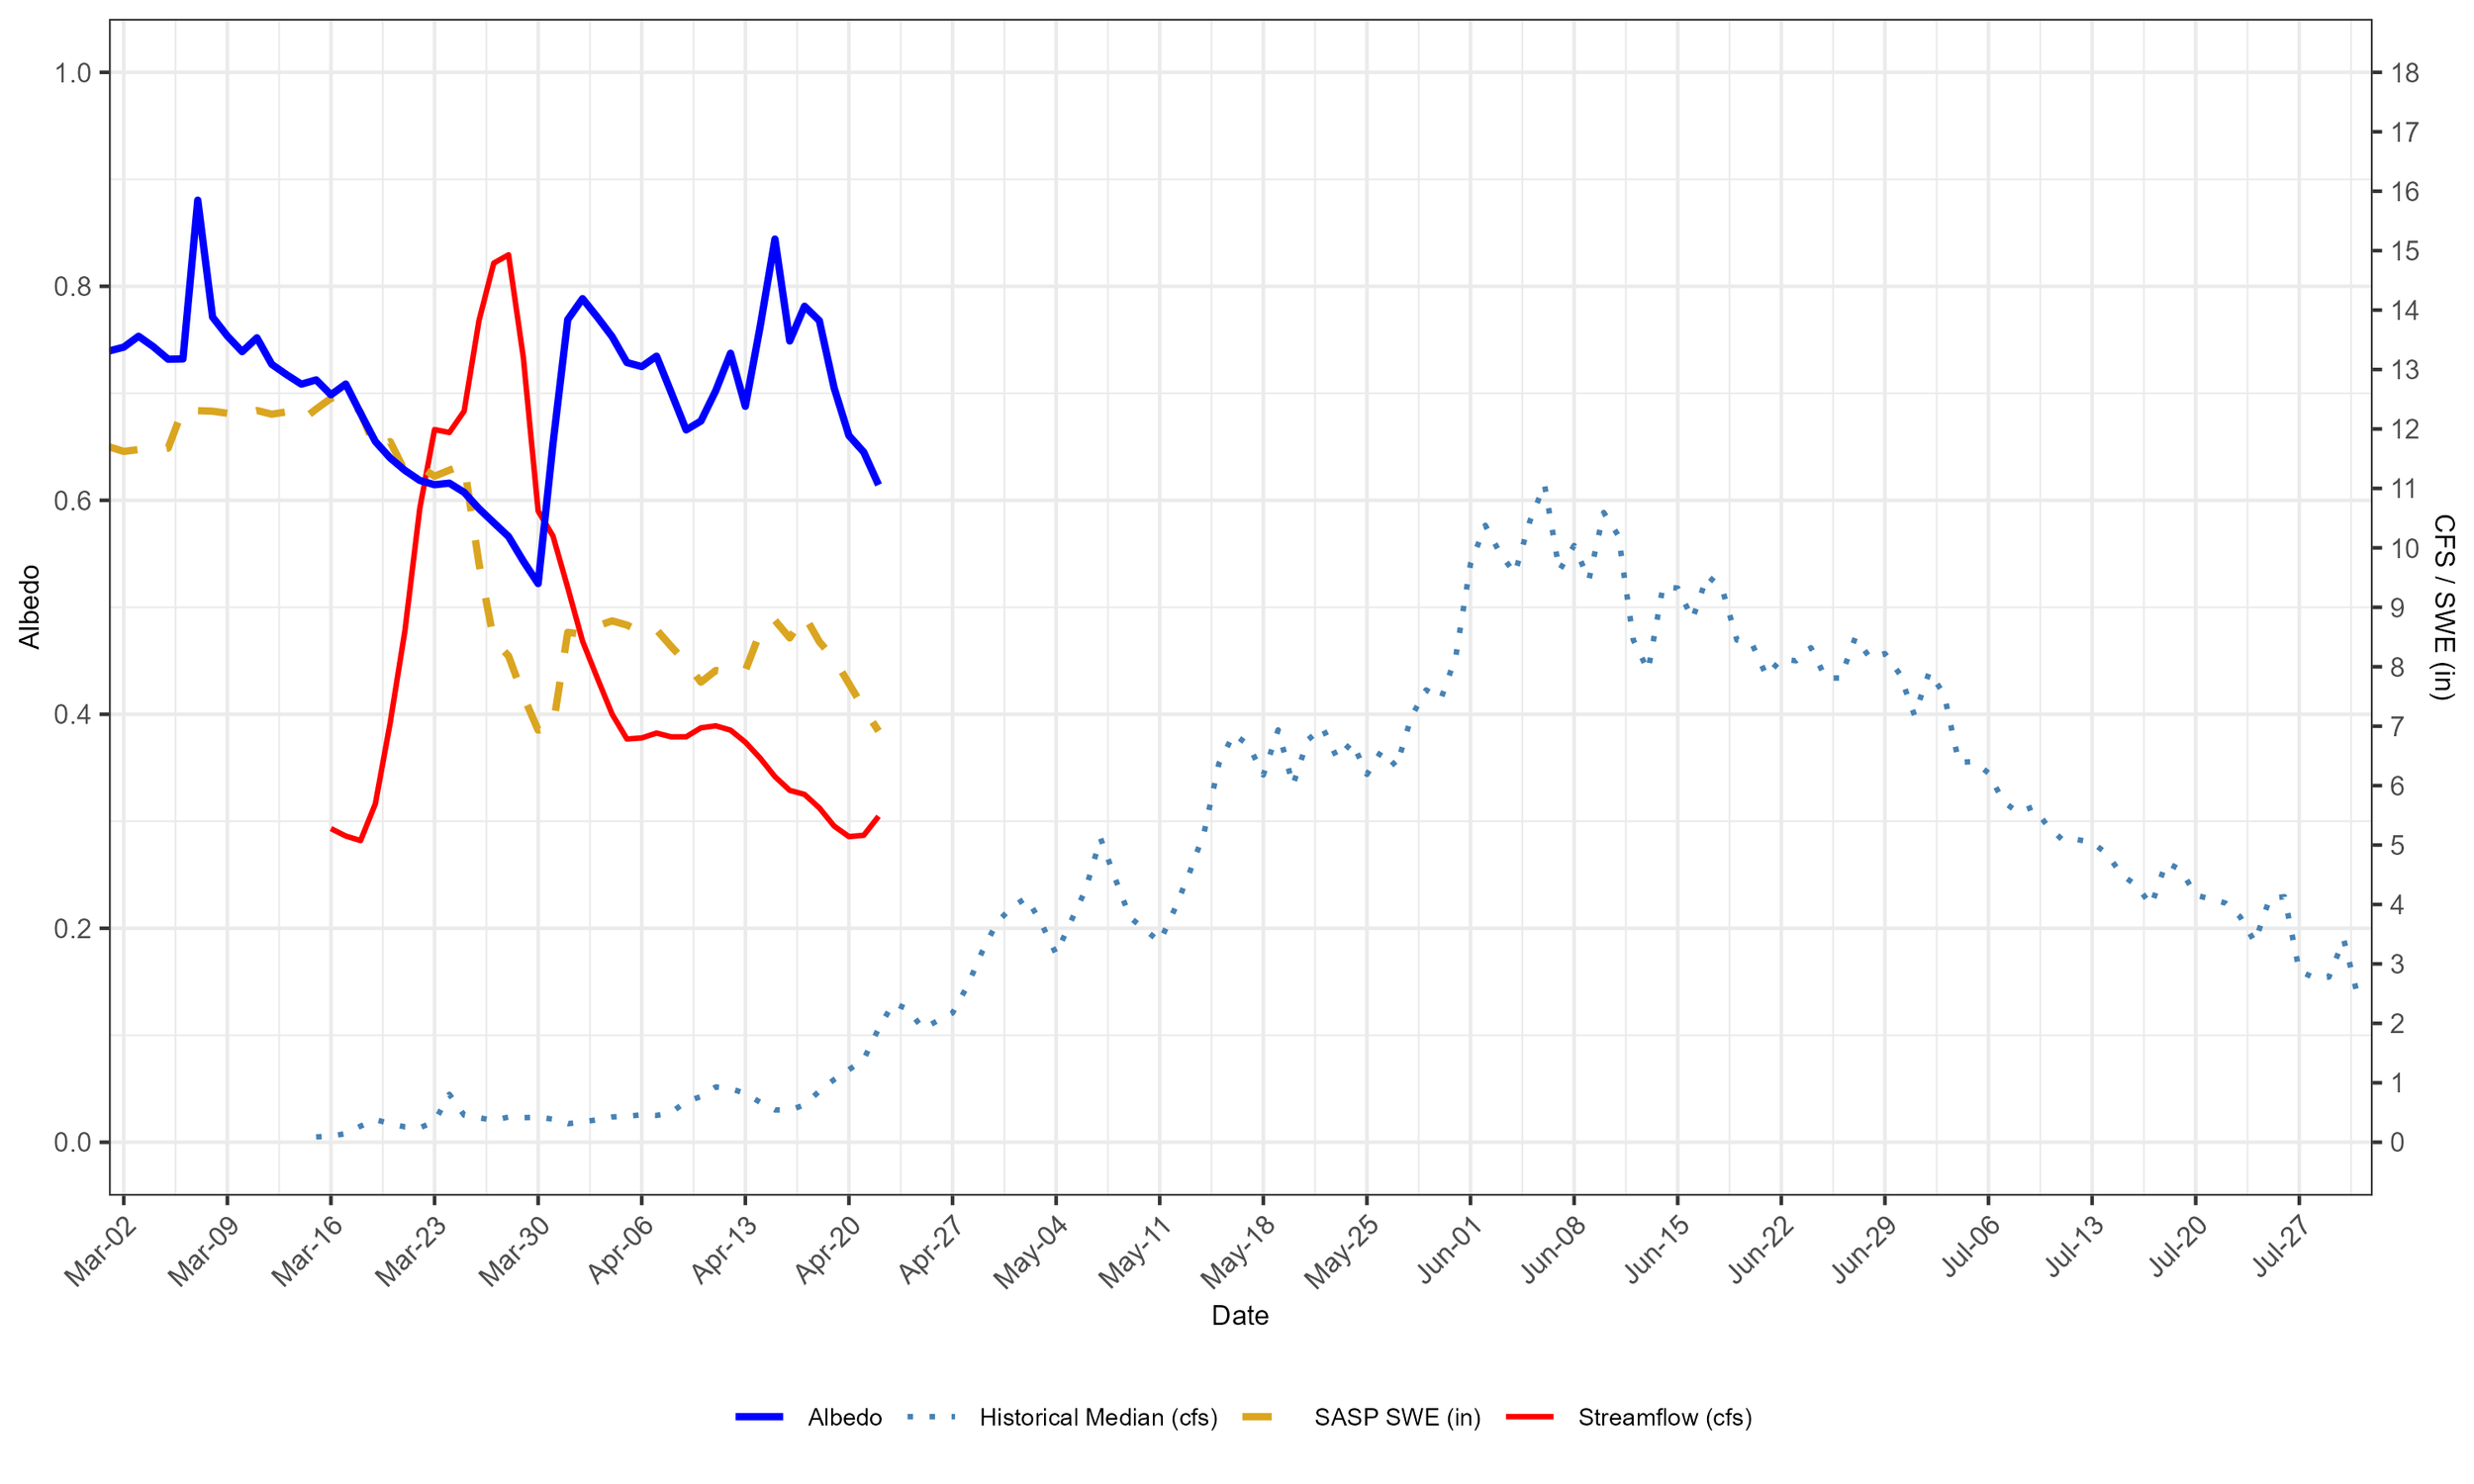
Below: With very little dust and no real storms we saw albedo slowly degrade the month of March just due to an aging snow surface. The storm the end of March bounced albedo back up again. Since then we have seen albedo and streamflow largely move sideways and with the forecast that is likely to continue for a little bit. In the last few days the Rio Grande at Del Norte has seen an increase in flows surpassing their March peak.
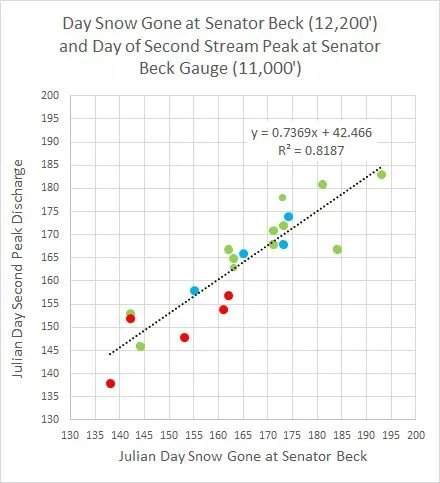
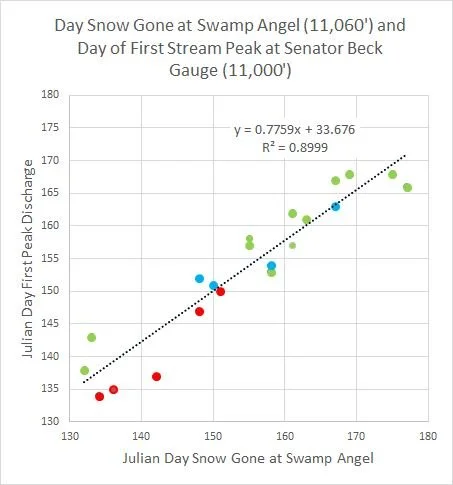
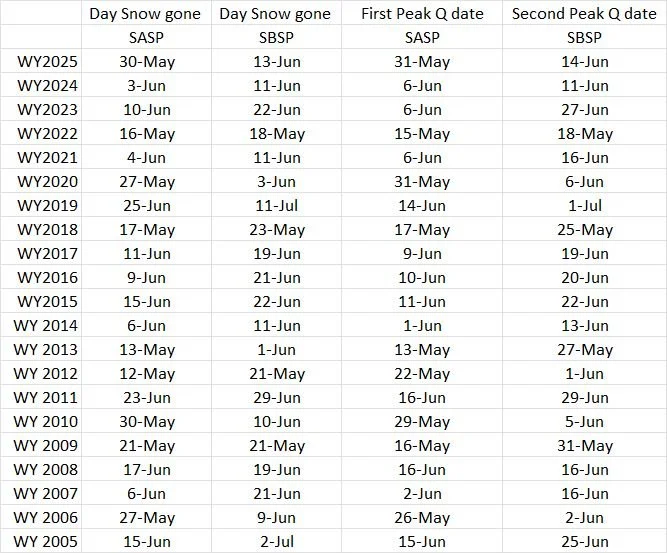
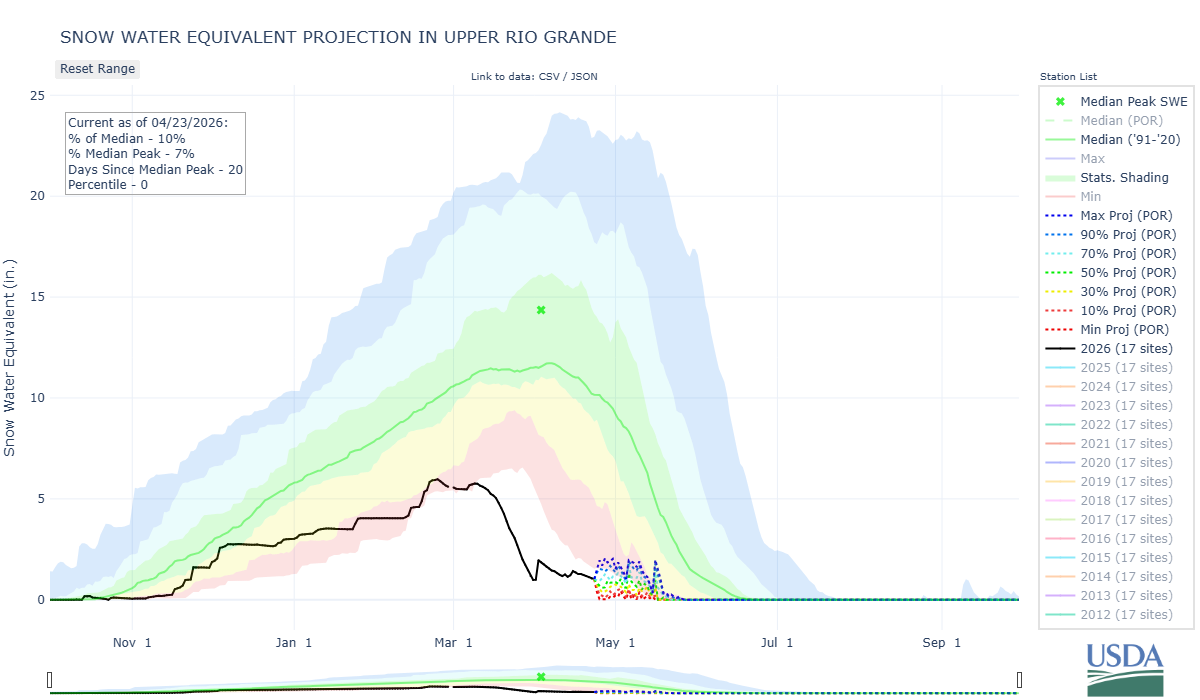
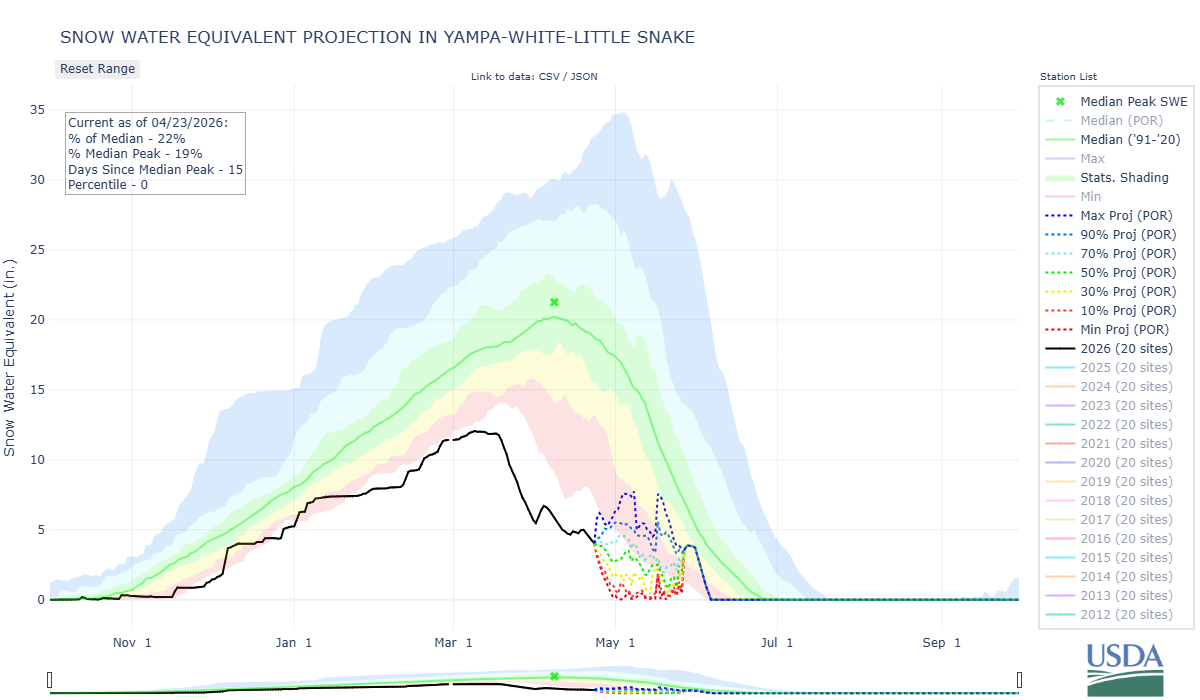
Below: Have we seen the peak in Senator Beck, Animas, Uncompahgre, Rio Grande? Typically we see streamflow peaks when meltout is compete around 11,000’ and 12,200’ (Senator Beck and Swampy currently have 1’ snow remaining). I like to think of these relationships as modern day yukigata. If we don’t see at least a minor streamflow peak when that happens this year it will be the first in our POR. Which could happen, remember the biggest forecast errors occur in the most extreme years.
Questions About Storms and Precipitation Patterns
We have a unique dataset at CSAS that characterizes winter storms. Here are the first in a series of visualizations of this data.
First, what makes a storm? CSAS defines a winter storm as receiving 12 mm (0.47”) of precipitation with no break in precipitation greater than 12 hours. You can see a past log of our storm reports throughout the years here, and current season winter storms here. We record a number of data about these storms including: storm water content (precipitation), mean and max precipitation intensity (mm/hr), accumulated snow depth, average wind direction and speed, and peak gust speed.
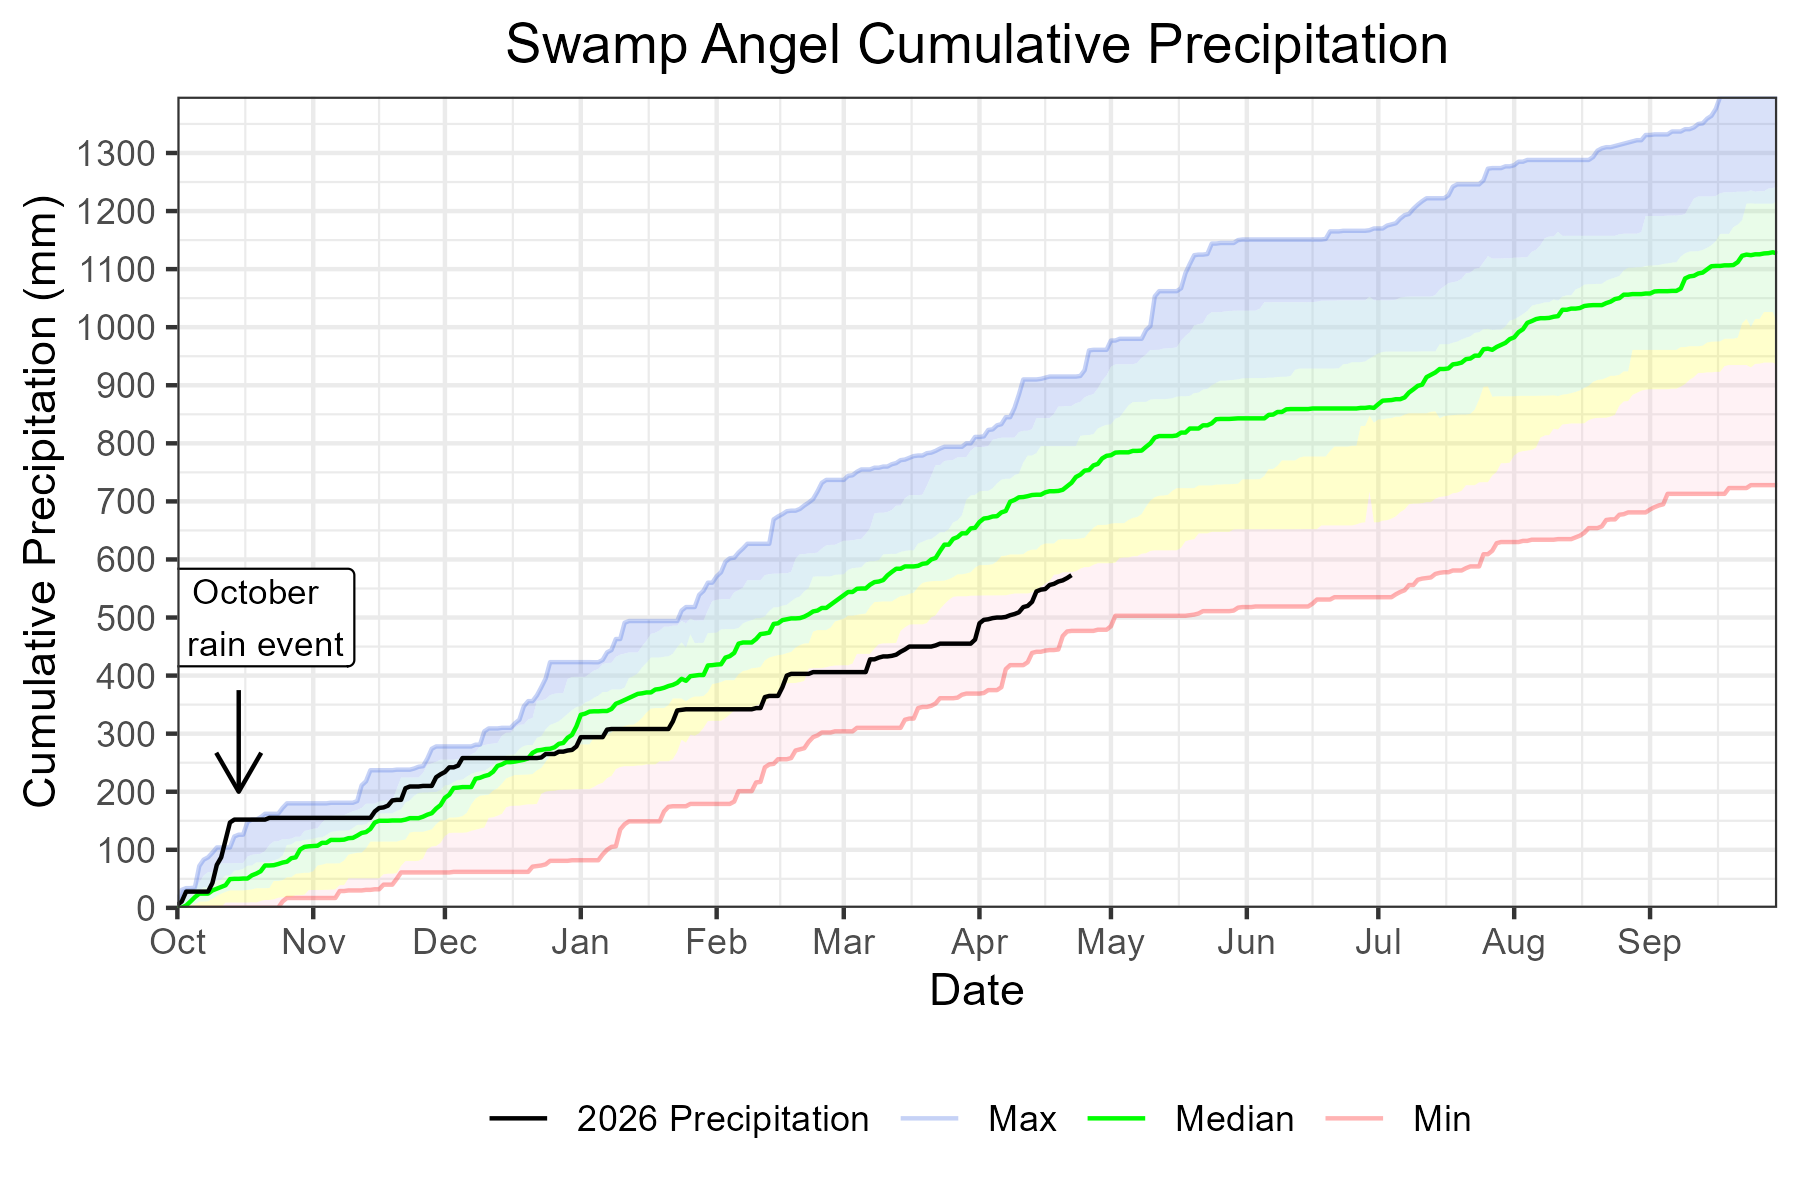
Thinking about this year’s dearth of precipitation and subsequent record-low snow water equivalent, we had a few questions to ask of our data, which goes back to Water Year 2004. Specifically, are there any visual trends in the data on storm precipitation and frequency? Are there any visual trends or correlations between prevailing wind patterns, peak gust averages, and dust on snow events?
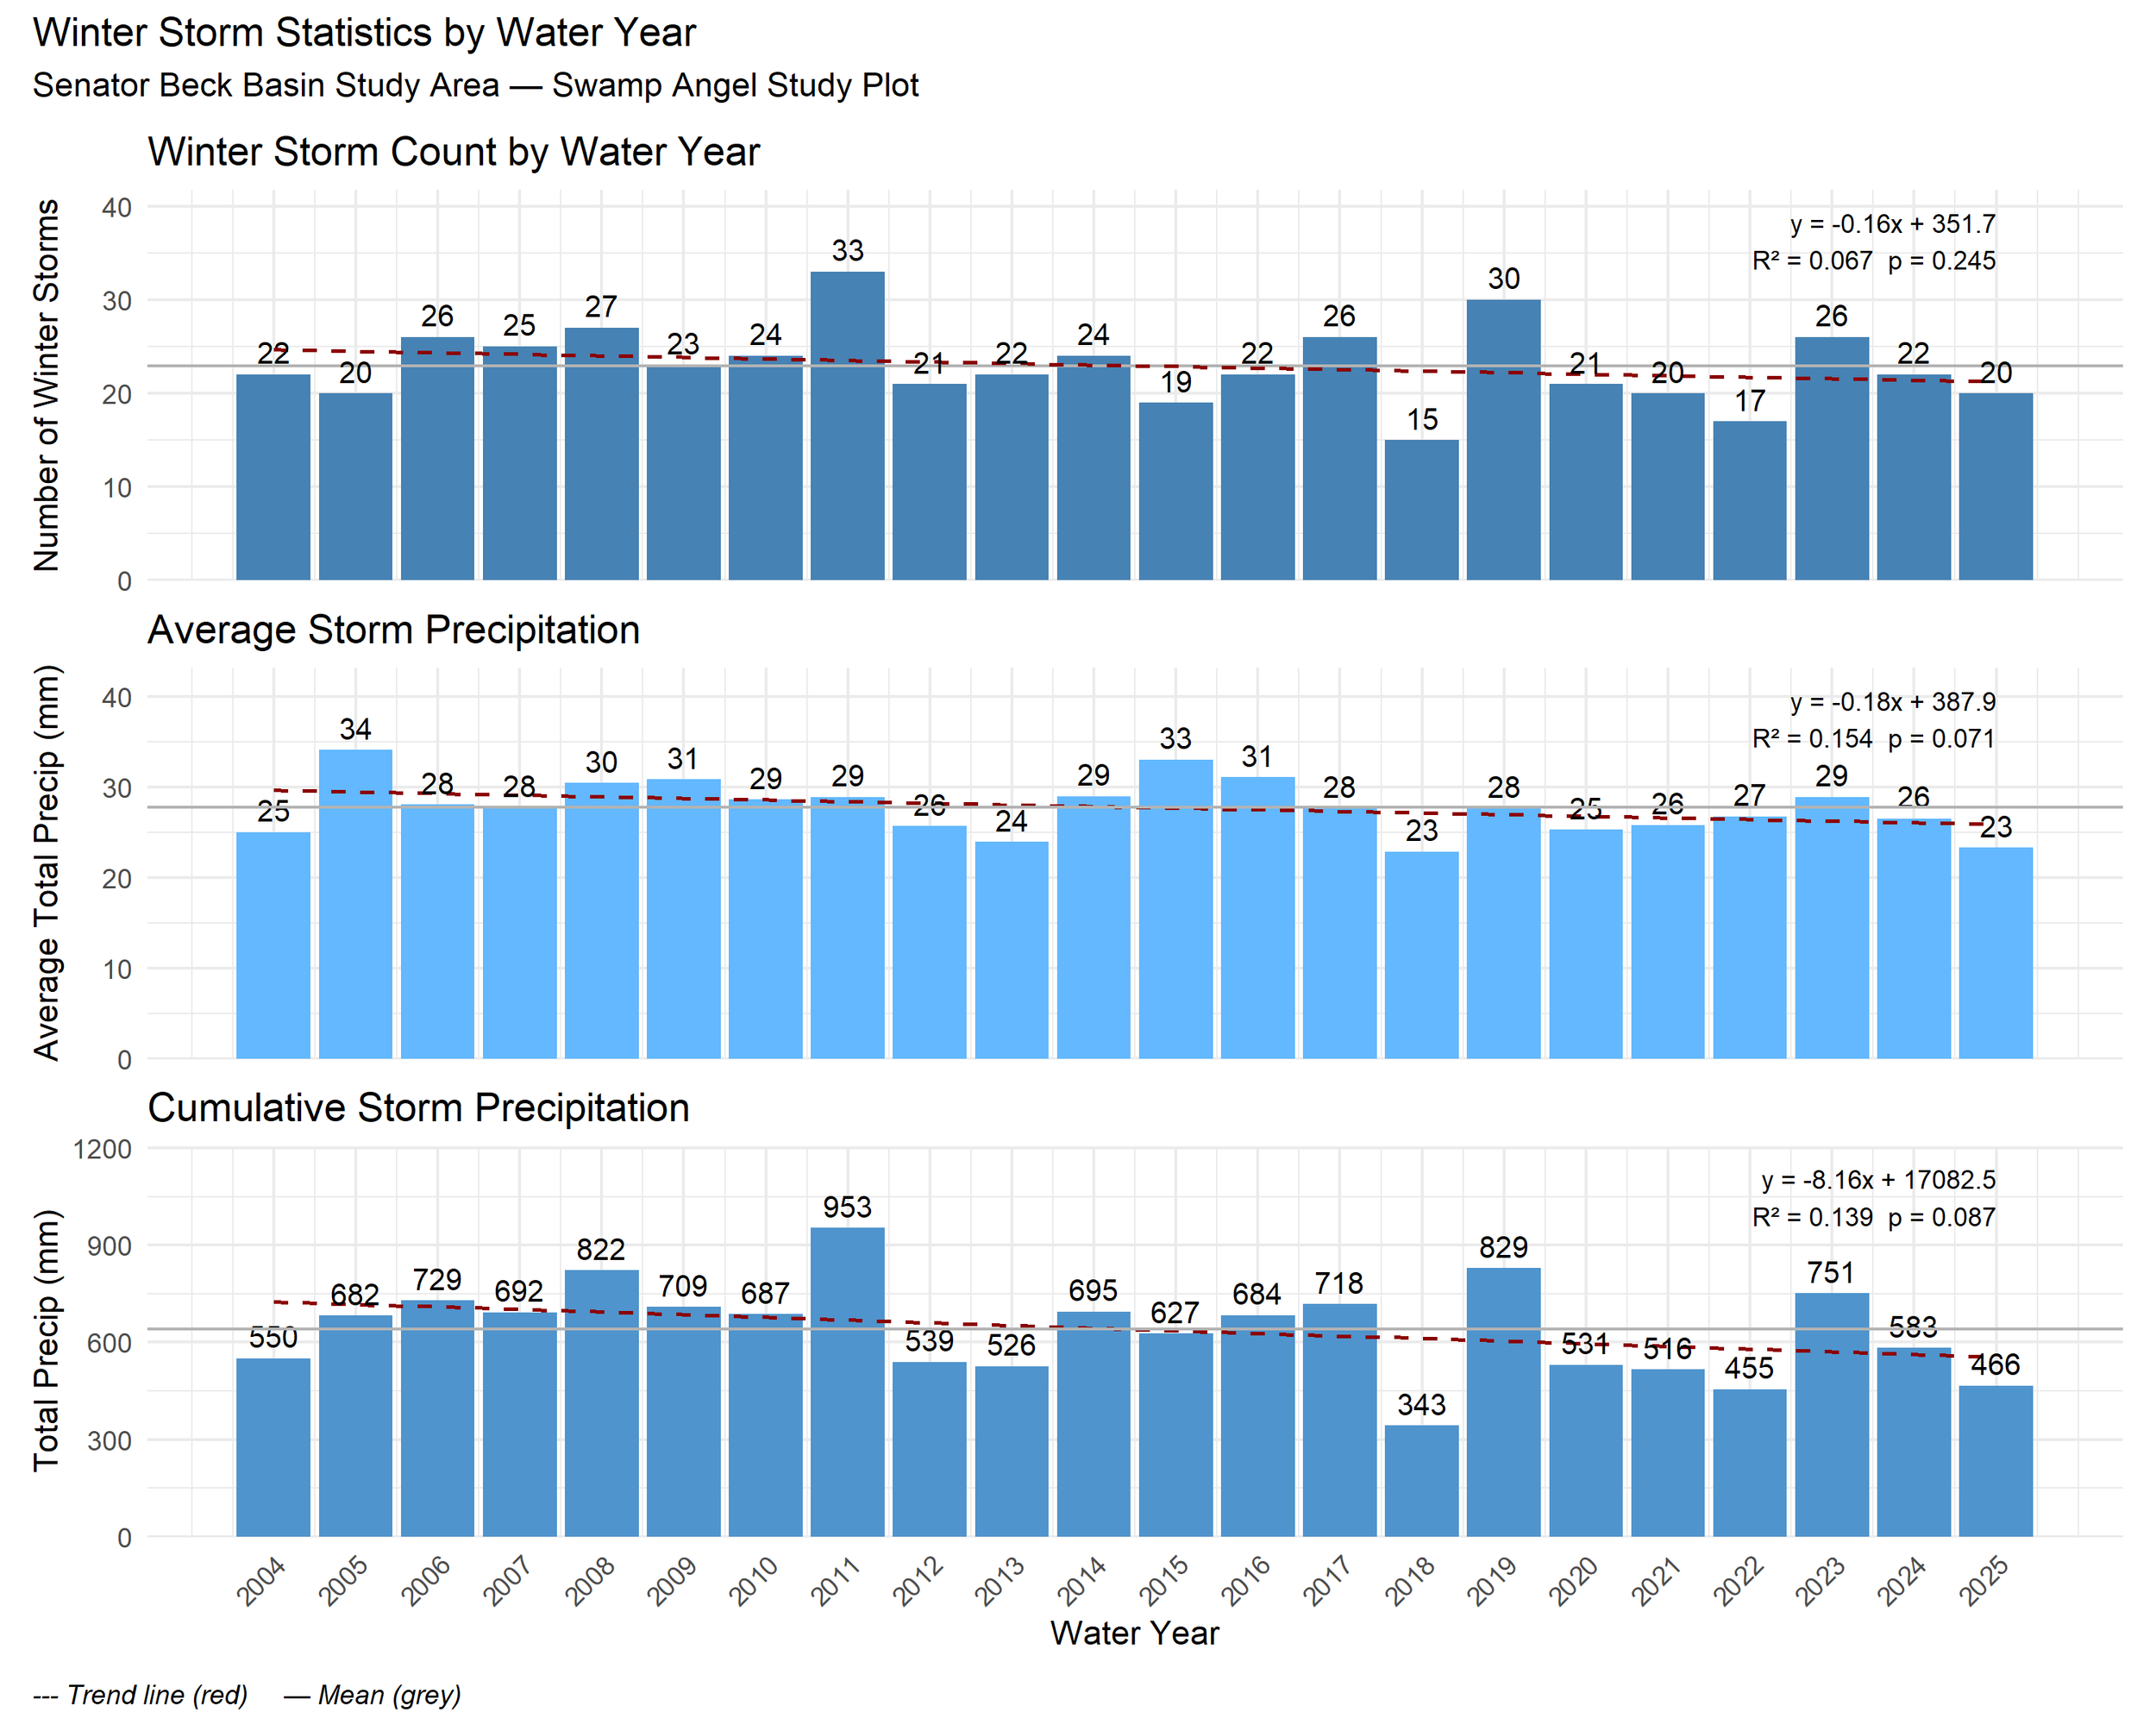
Below: Number of winter storms per year, average amount of precipitation per storm, and total storm precipitation of all winter storms for the water year are plotted below on stacked bar graphs. There are multiple water years where both low storm count and low average precipitation resulted in below average season, such as WY 2012, WY 2013, and WY 2018. Conversely, high storm count and high average precipitation resulted in above average snowpack years, like in WY 2008, WY 2011, WY 2019 and WY 2023. In a few instances, low winter storm count was made up for by above average storm precipitation: WY 2005, WY 2015. In no instances did high winter storm count make up for low average storm precipitation.
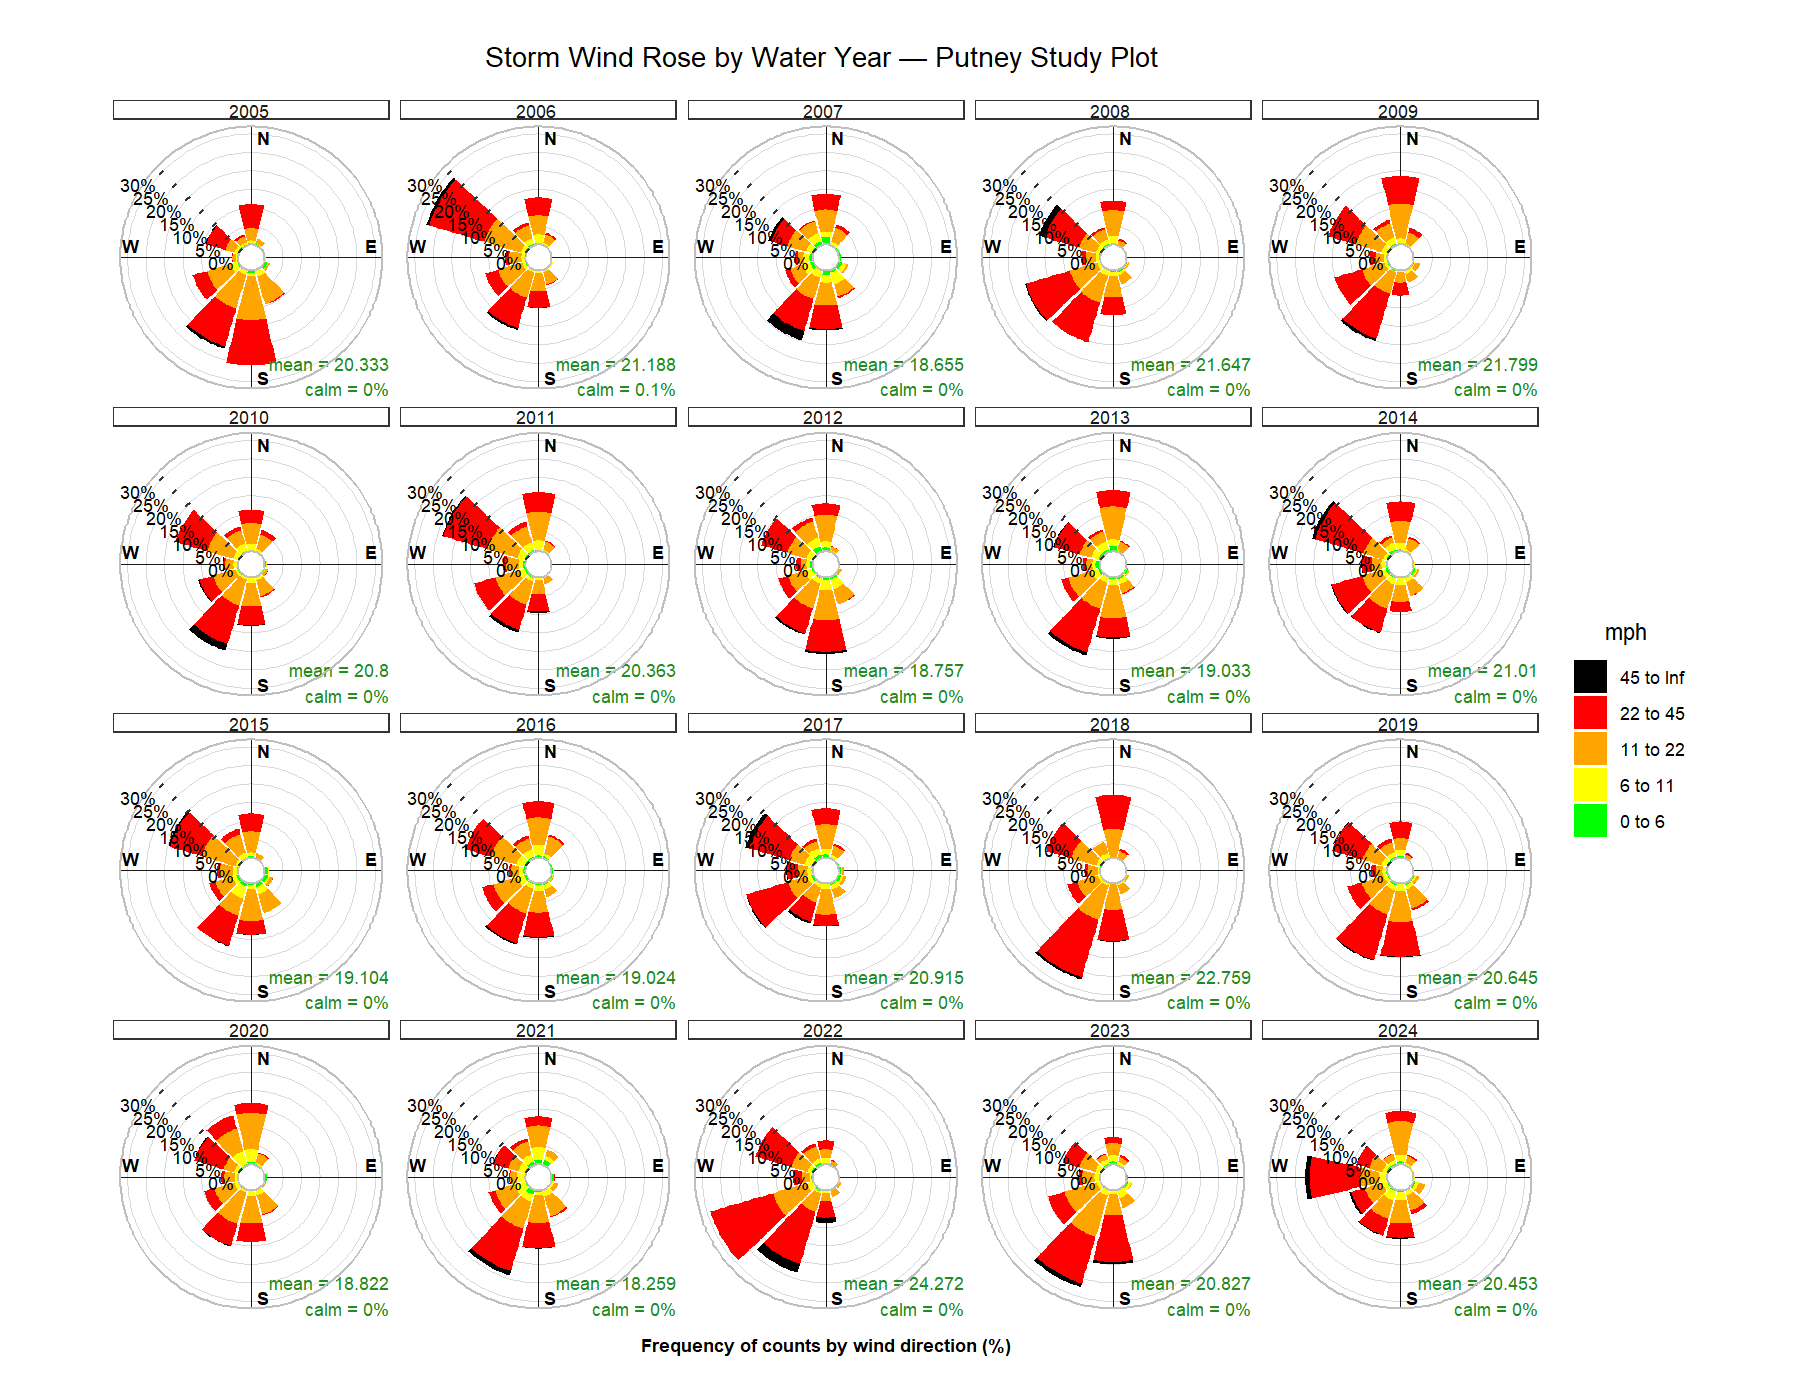
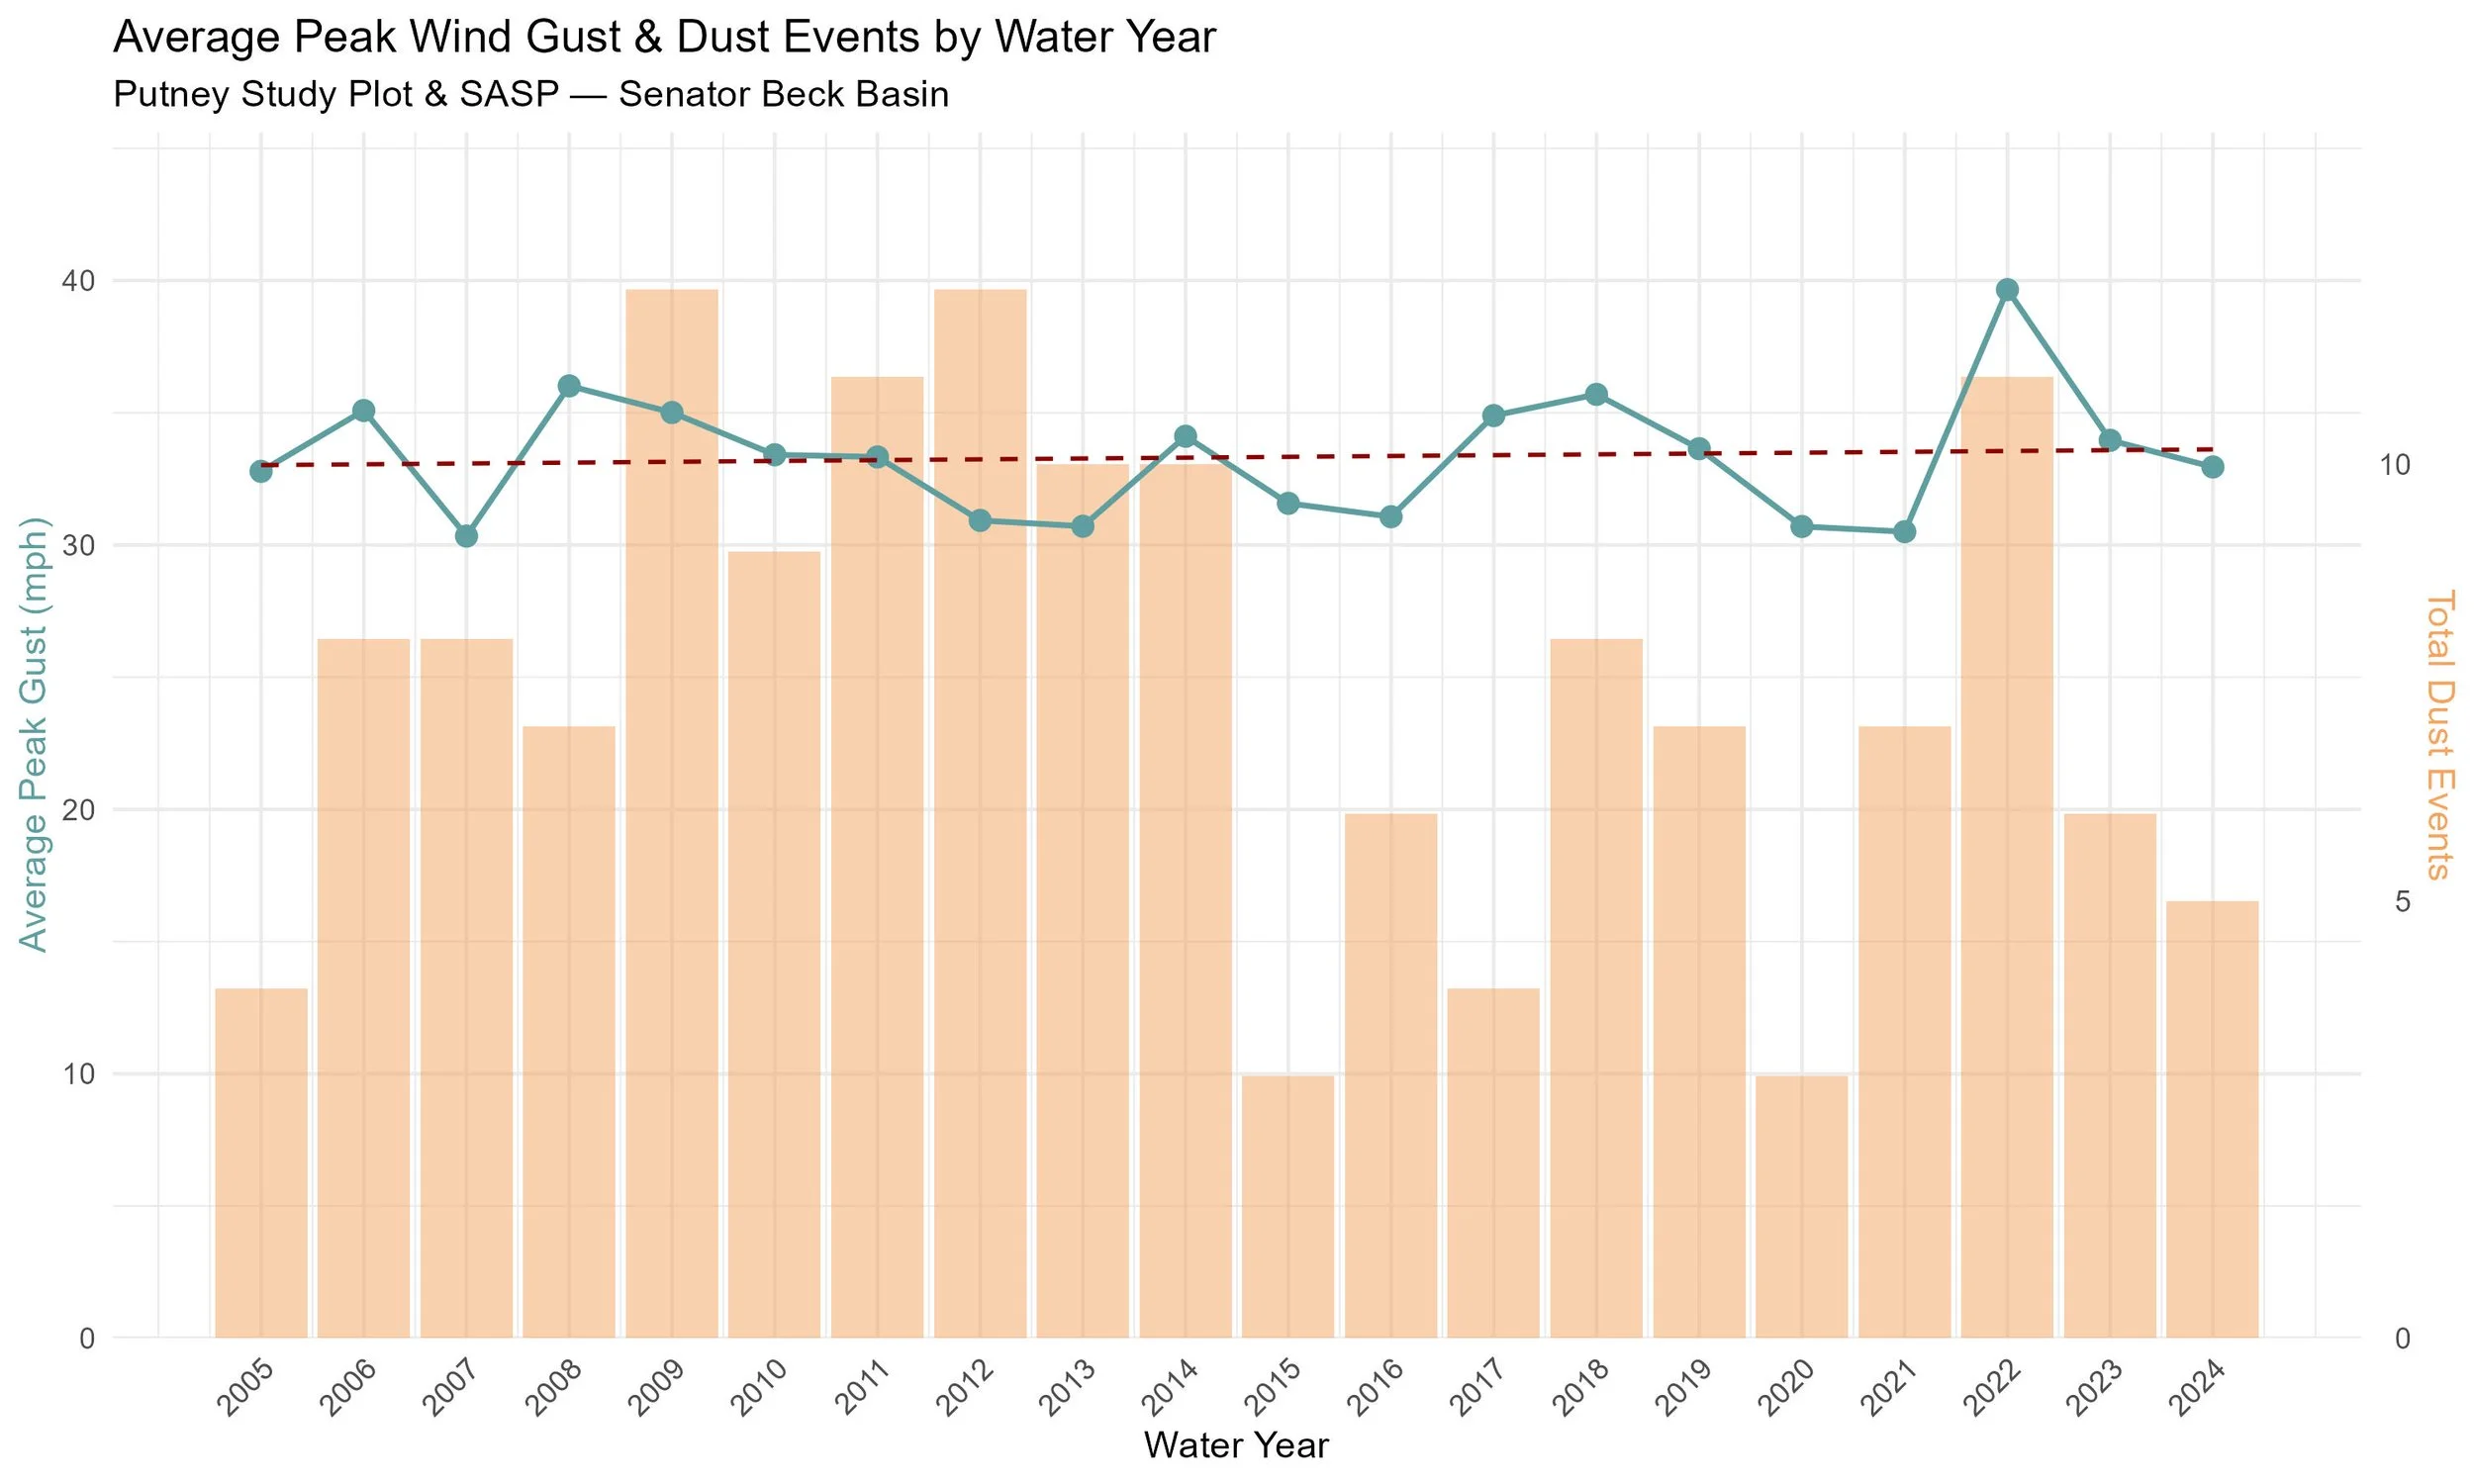
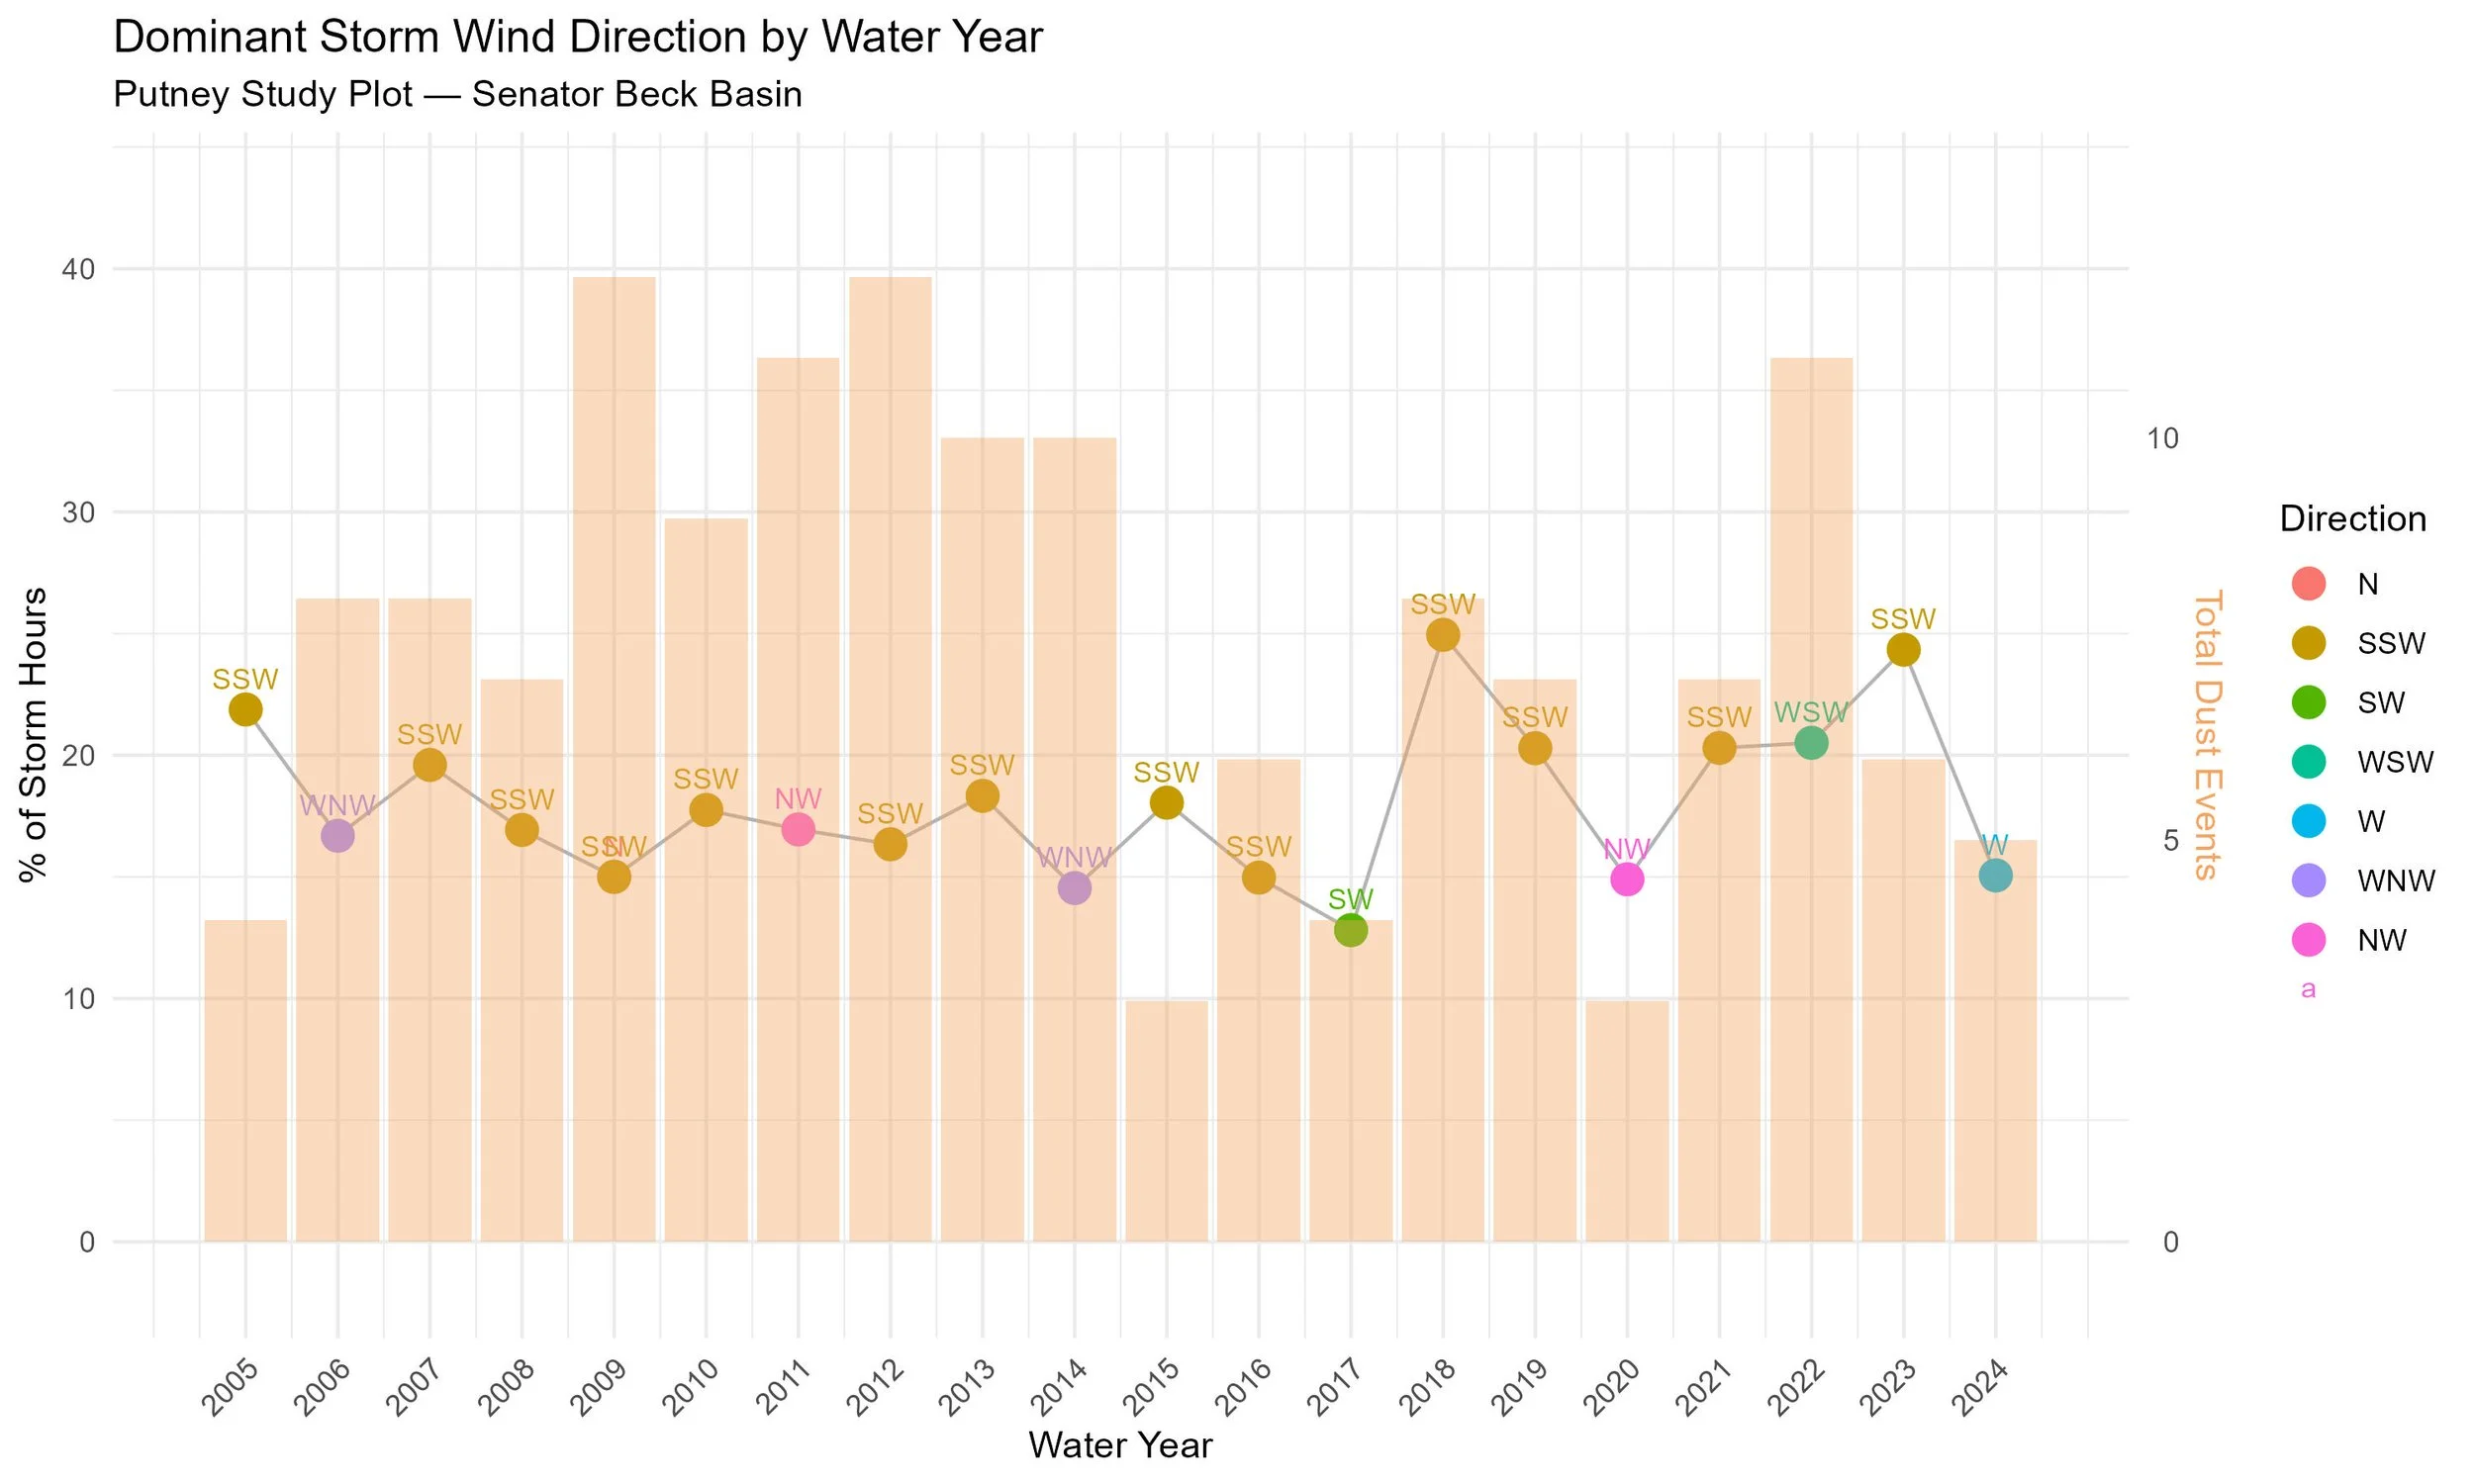
Below: The prevailing wind direction of storms for the water year and peak gusts were evaluated in the below plots, overlayed with the dust events throughout our period of record. The first graph plots dominant storm directions, so, the percent storm hours axis shows the most frequently occurring cardinal direction and the percent of storm hours that occurred in that direction –higher percentages mean there was a more consistent wind pattern throughout the year. The peak gusts plot shows dominant storm direction and average peak gusts that occurred during storms for that water year. There is slightly negative trend line displayed, though it is not significant (p = 0.74). No consistent pattern emerges from these plots. The biggest takeaway might be the change in dust events pre and post 2014, the variance of which is not explained by either average storm direction or average wind speed. An analysis of each specific dust event and storm would likely be more informative and could be part of a future CSAS update. The final plot is an all-storms per water year wind rose, further displaying wind directions and speeds during winter storms.