
SUMMARY
Water Year 2026 will be etched in everybody's memory for the rest of time. We’ve been reading about the effects of climate change globally (need we remind everyone of Arctic sea ice retreat, permafrost melting, loss of glaciers and snowpack changes, sea level rise, ocean acidification and temperature rise, extreme weather), all coming at a rapid pace. Climate scientists have been ringing alarm bells in the mainstream for the past 30 years. In our corner of the world, we’re asking ourselves if this winter is the first in a dramatic shift in our local climate norm, if this winter has arrived as a pioneer and a harbinger of what is to come. It is estimated that this dry winter was four times more likely to happen due to climate change, and has a 15% chance of occurring again every year moving forward for the Western US. In hindsight, will the megadrought these past 26 years seem like the idyllic days we long to get back to? This year uprooted any notion of “normal” and the feeling of being in “uncharted territory” really began to sink in. We may look back and say, “WY2026 was the first year that ushered in an unrecognizable climate norm”, with extreme changes beyond the imagination of the average person. We will see, but that is the direction we are heading.
For now, in this season summary, we will review WY2026 which has made such a profound mark in the data record. Thermometers don’t lie, neither do tree rings, ice cores, or isotopes, and neither does the snowpack as we return year after year visiting the same spot to take measurements for the past 10, 20, 50, 100 years. This is what we do here at Center for Snow & Avalanche Studies. We collect the data, make the observations, and try and assess what it all means, and this year there is a lot to digest.
The water year began in October and in that month southwestern Colorado was hit with one of the largest rainfall events ever recorded that caused widespread flooding. Record heat and dryness followed resulting in our documenting the first storm of the winter about 3 weeks later than usual. It was still so warm in December it rained on Christmas day in Silverton and many other high elevation locations around Colorado. It rained again on New Years Day. The abnormal year persisted, staying hot and dry for the remainder of what is usually the snowy months (with surprisingly minimal dust events), eventually resulting in record low streamflows. And of this writing in July, widespread forest fires are burning across all of North America.
The information below comes from many different data sources including our Colorado Dust-on-Snow Program’s monitoring sites located throughout Colorado and our Senator Beck Study Basin located in the headwaters of the San Juan Mountains.
MONTHLY WEATHER CONDITIONS
October
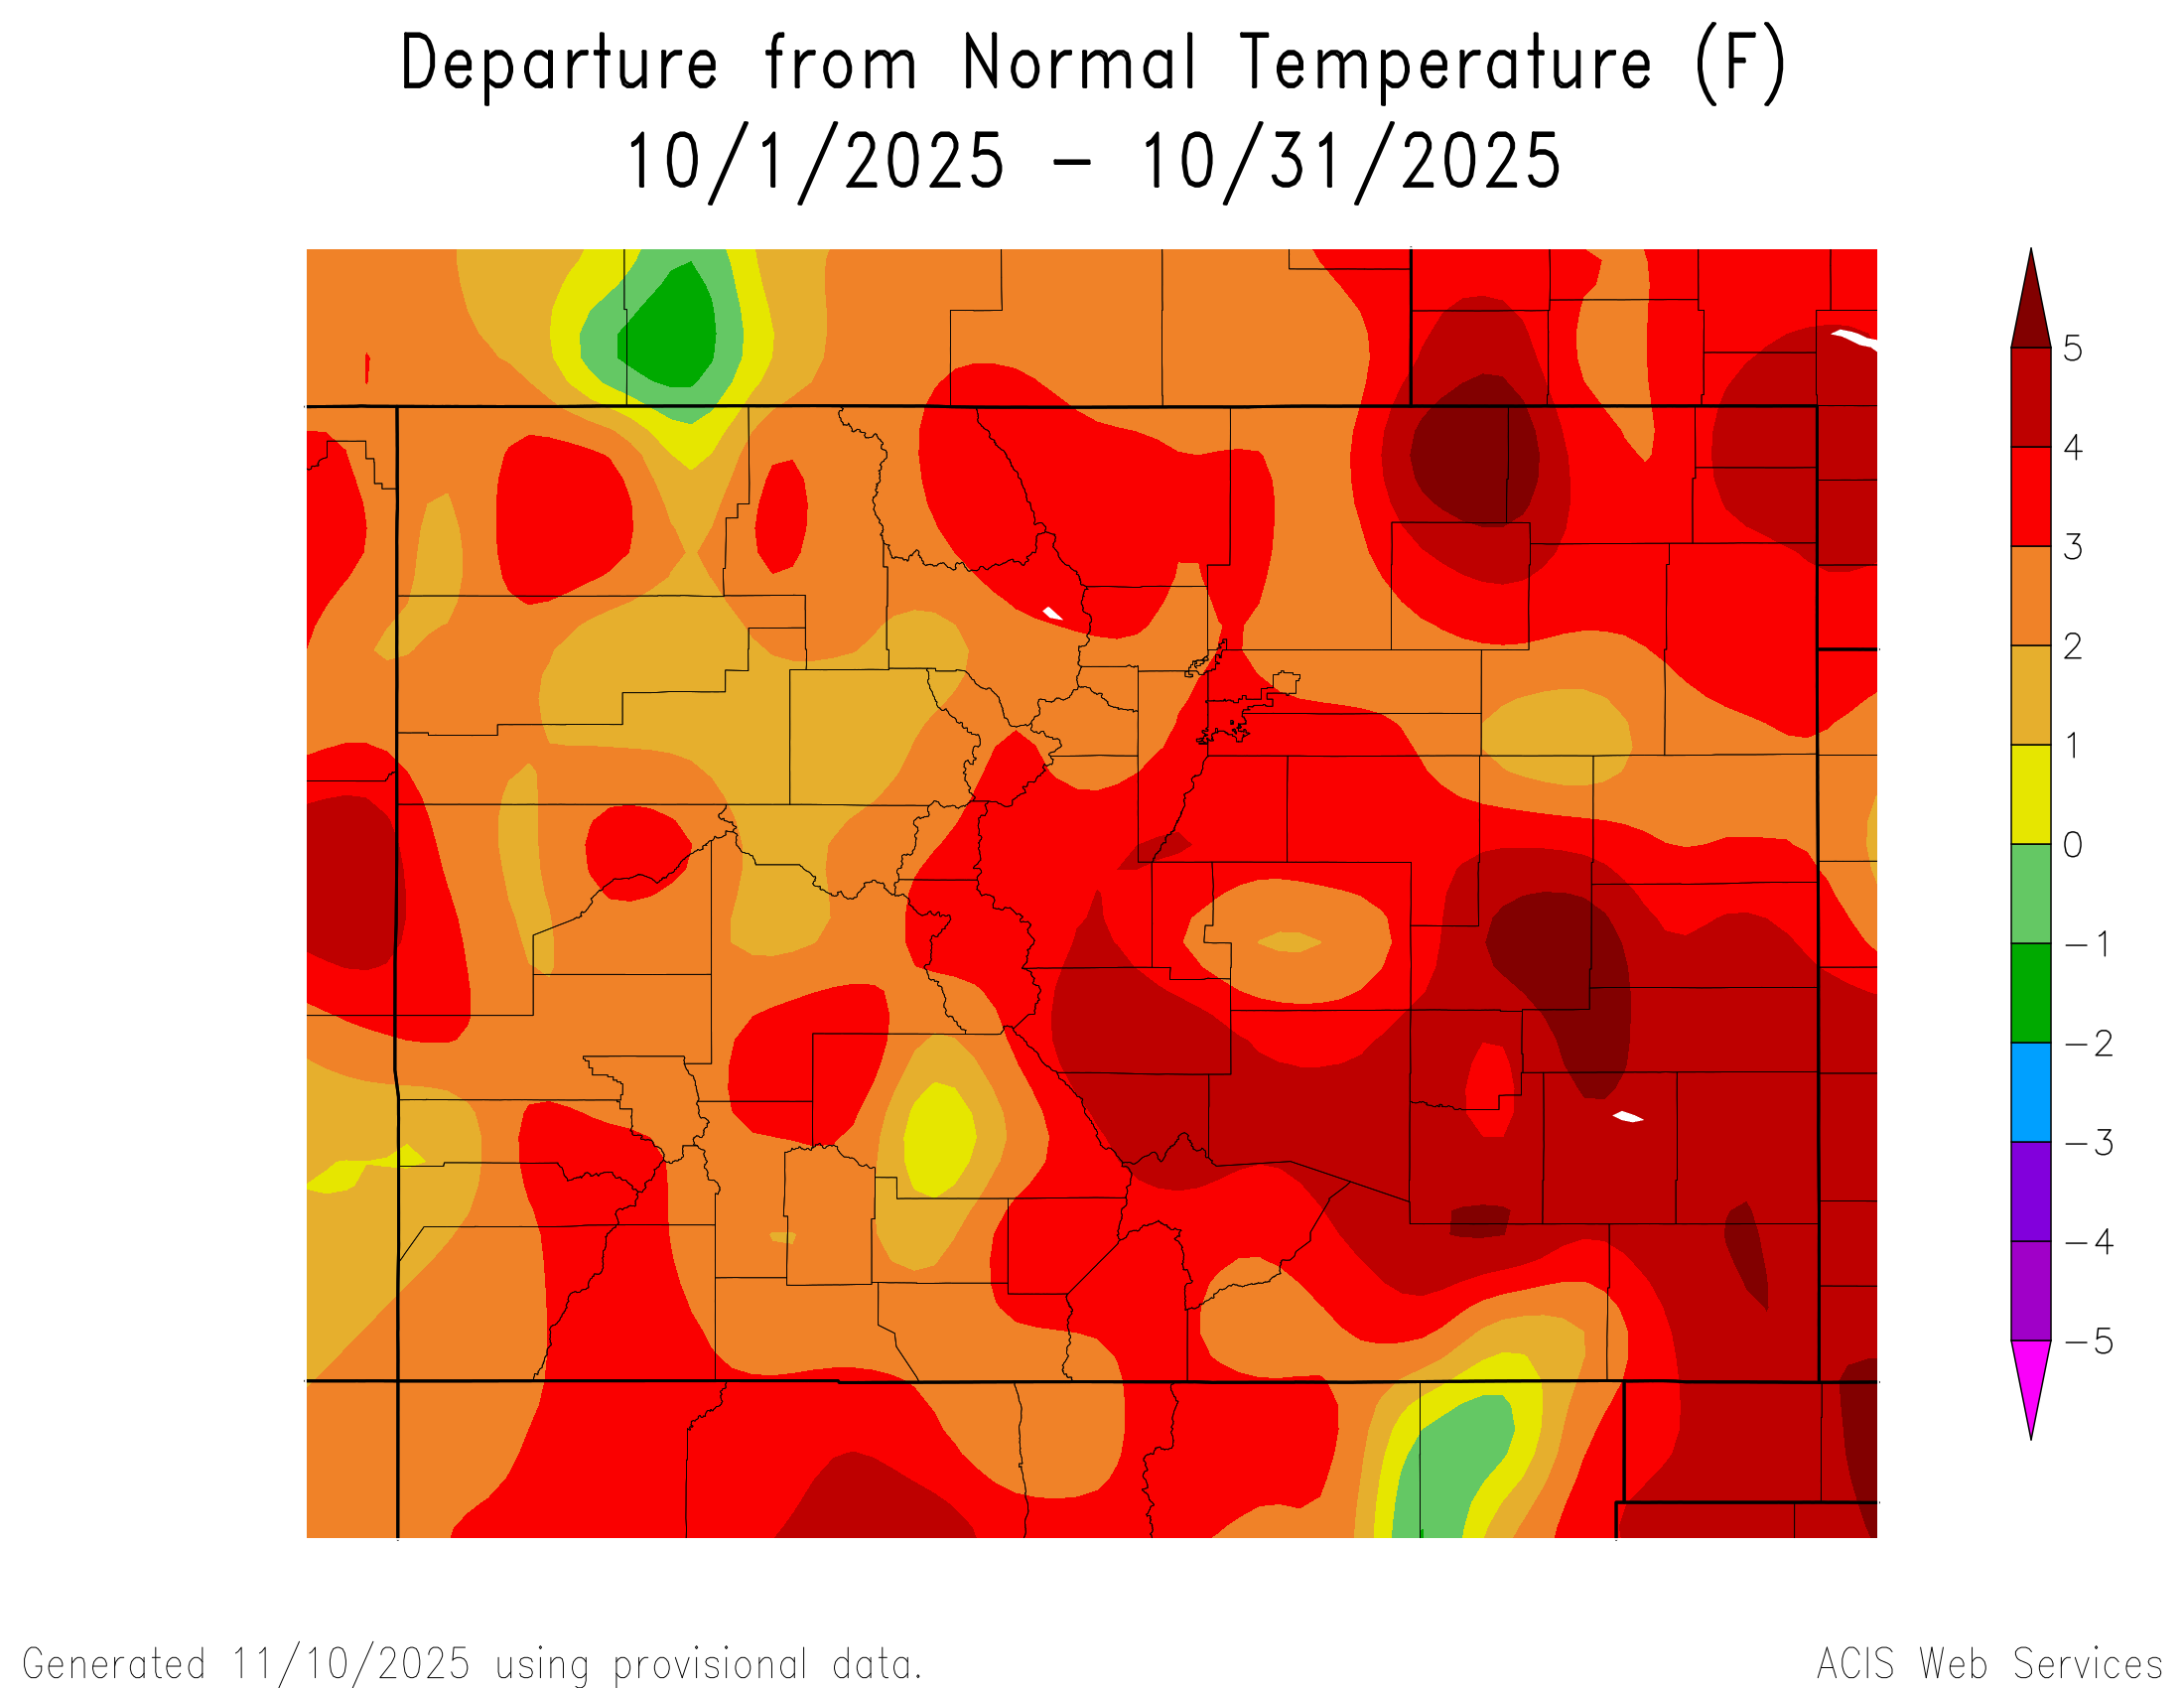
The first month of the water year brought one of the largest rainfall events ever recorded in southwestern Colorado, with totals from 2-4+” in two days, remnants of a hurricane in the eastern Pacific Ocean. Drought conditions in the southwestern Colorado saw a 2 to 3 class improvement, though we would have preferred this amount of rainfall over a few weeks. October was warm for the state of Colorado as a whole, continuing a trend, with areas of more than 4°F above average observed. At Swamp Angel Study Plot (11,060’), snow fell in the higher elevations during the month, but did not stick around. The average temperature at Swamp Angel was 36.9°F. We began this water year with La Niña conditions which were expected to continue through early winter before returning to neutral.
November
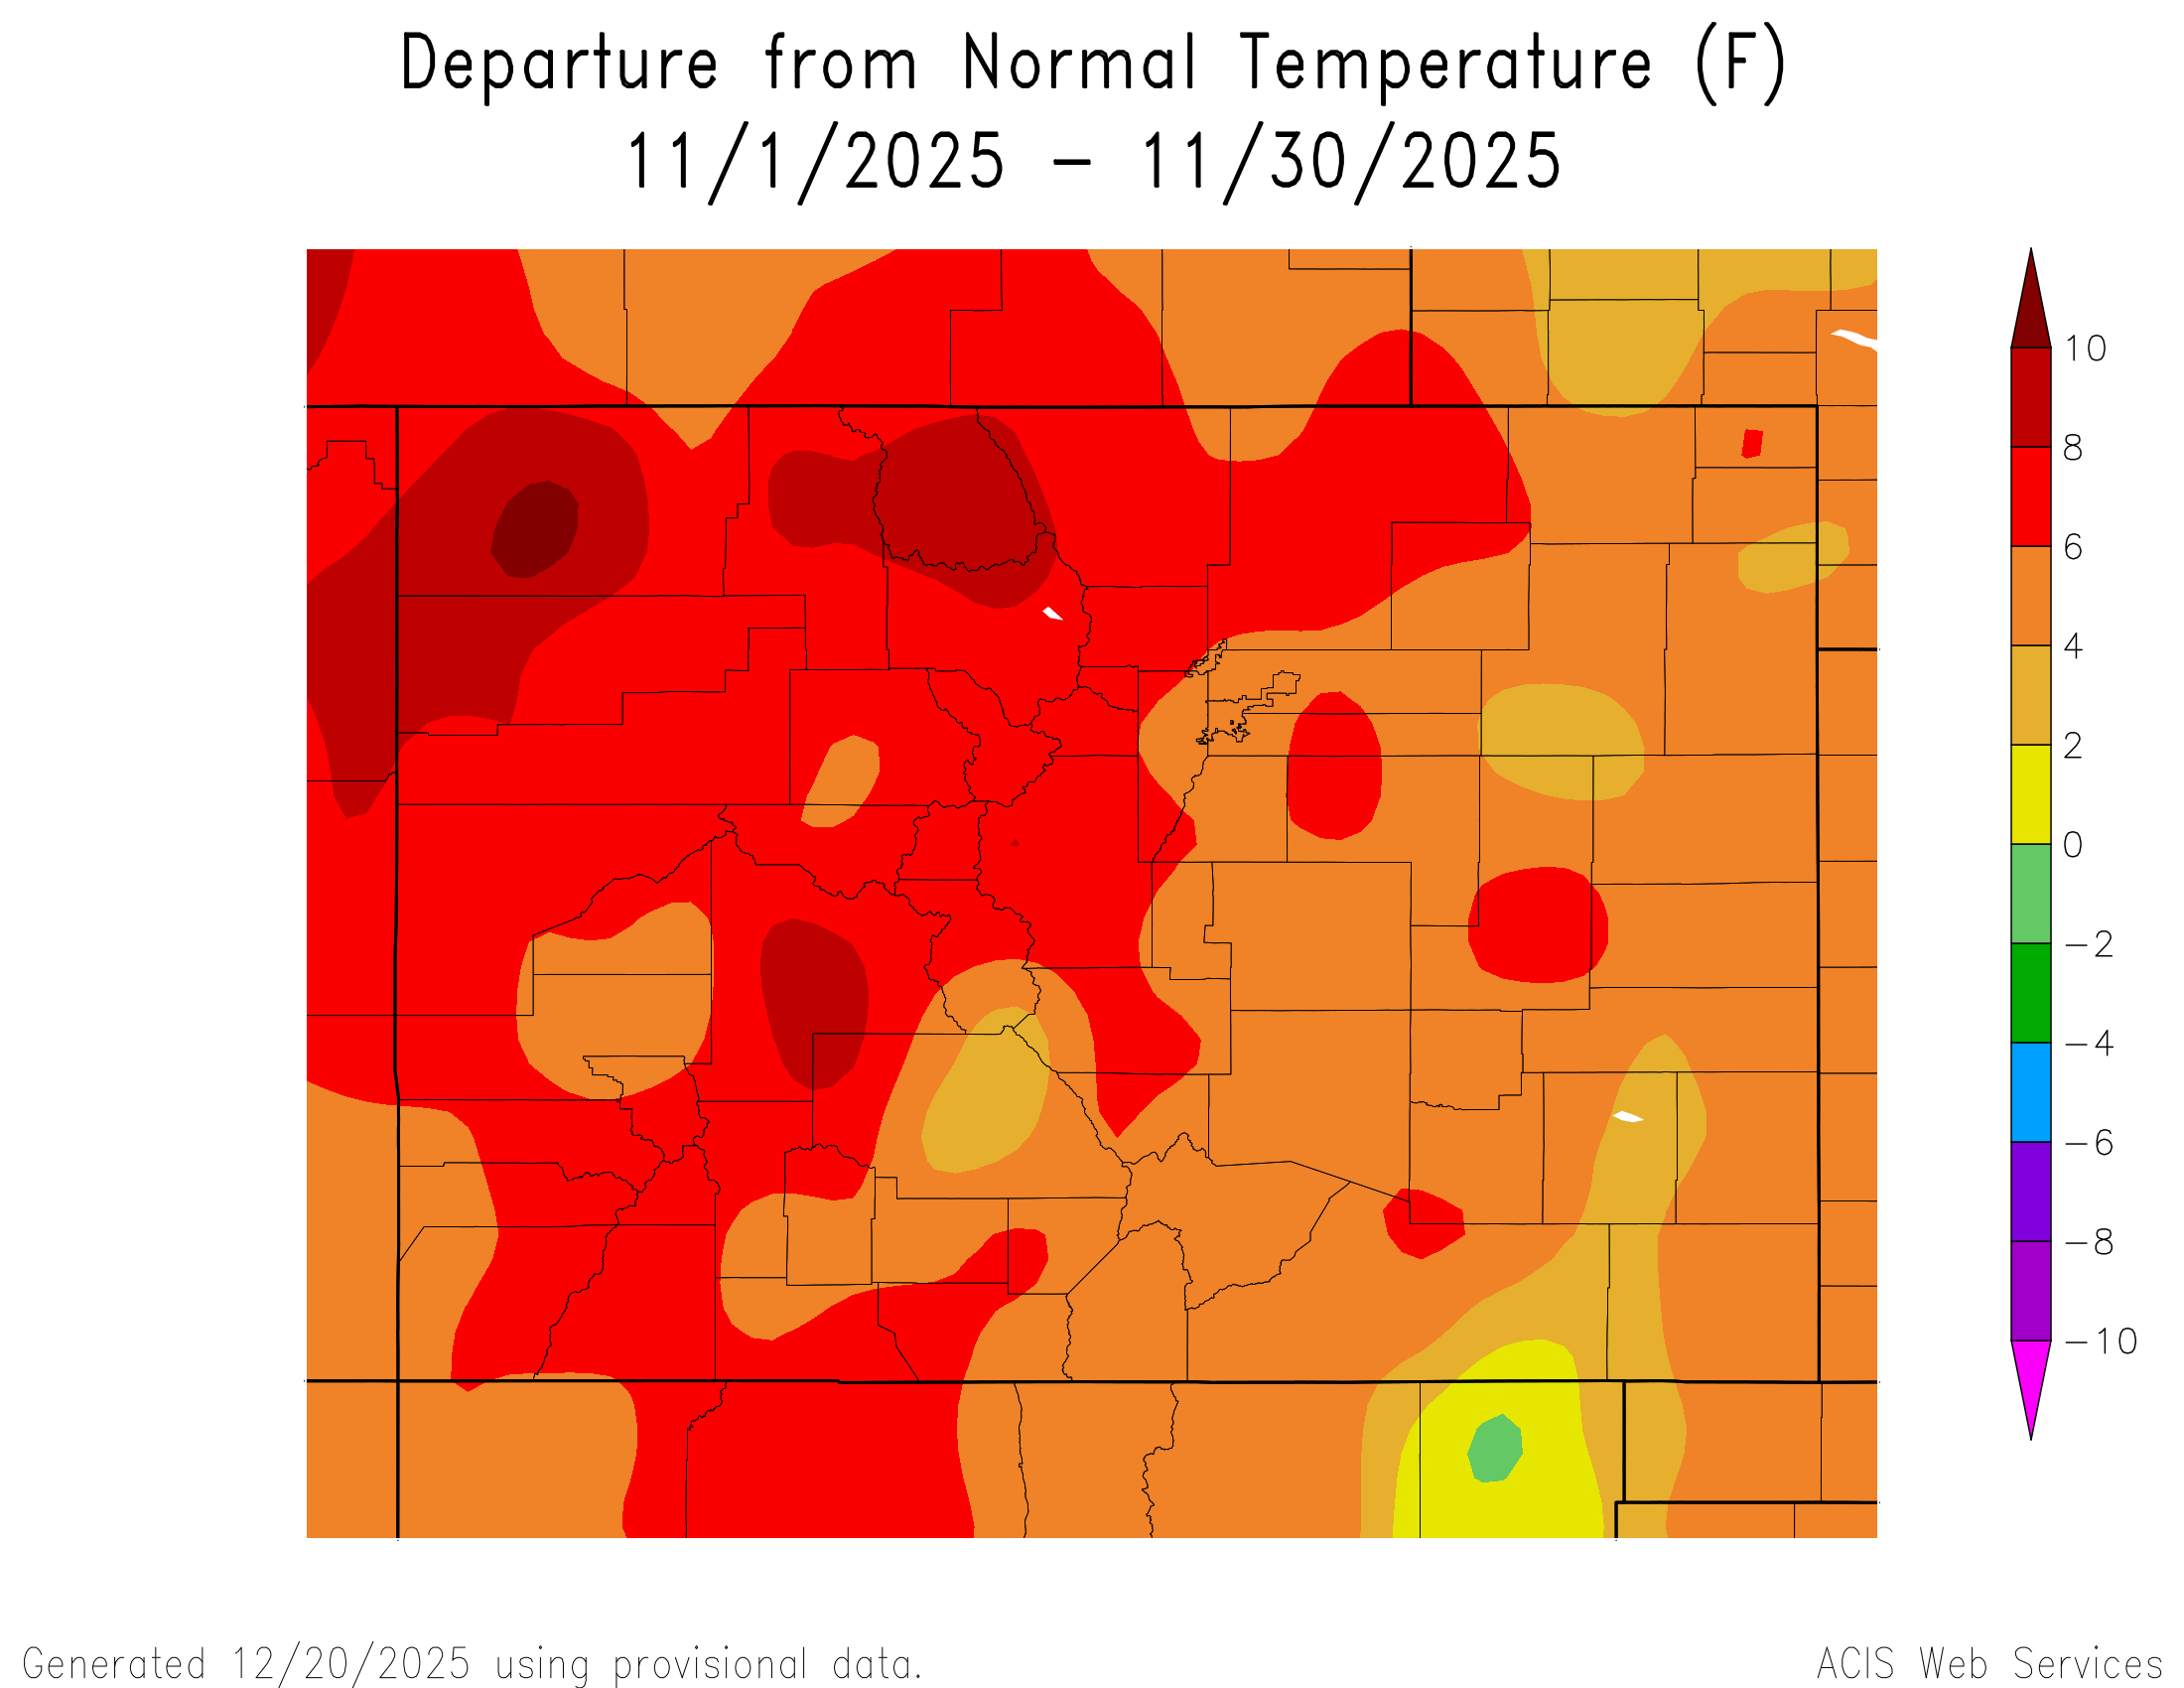
November was extremely warm throughout the state of Colorado, the 3rd warmest on record in 131 years of records. Precipitation was below average for much of the state, except the San Luis Valley and the eastern Plains. Our first official winter storm arrived November 15th at Swamp Angel, which is two to three weeks later than the median first storm date. At the end of month, we had 9.8” of snow depth at Swamp Angel, with 1.9” SWE and an average monthly temperature of 30.0°F.
December
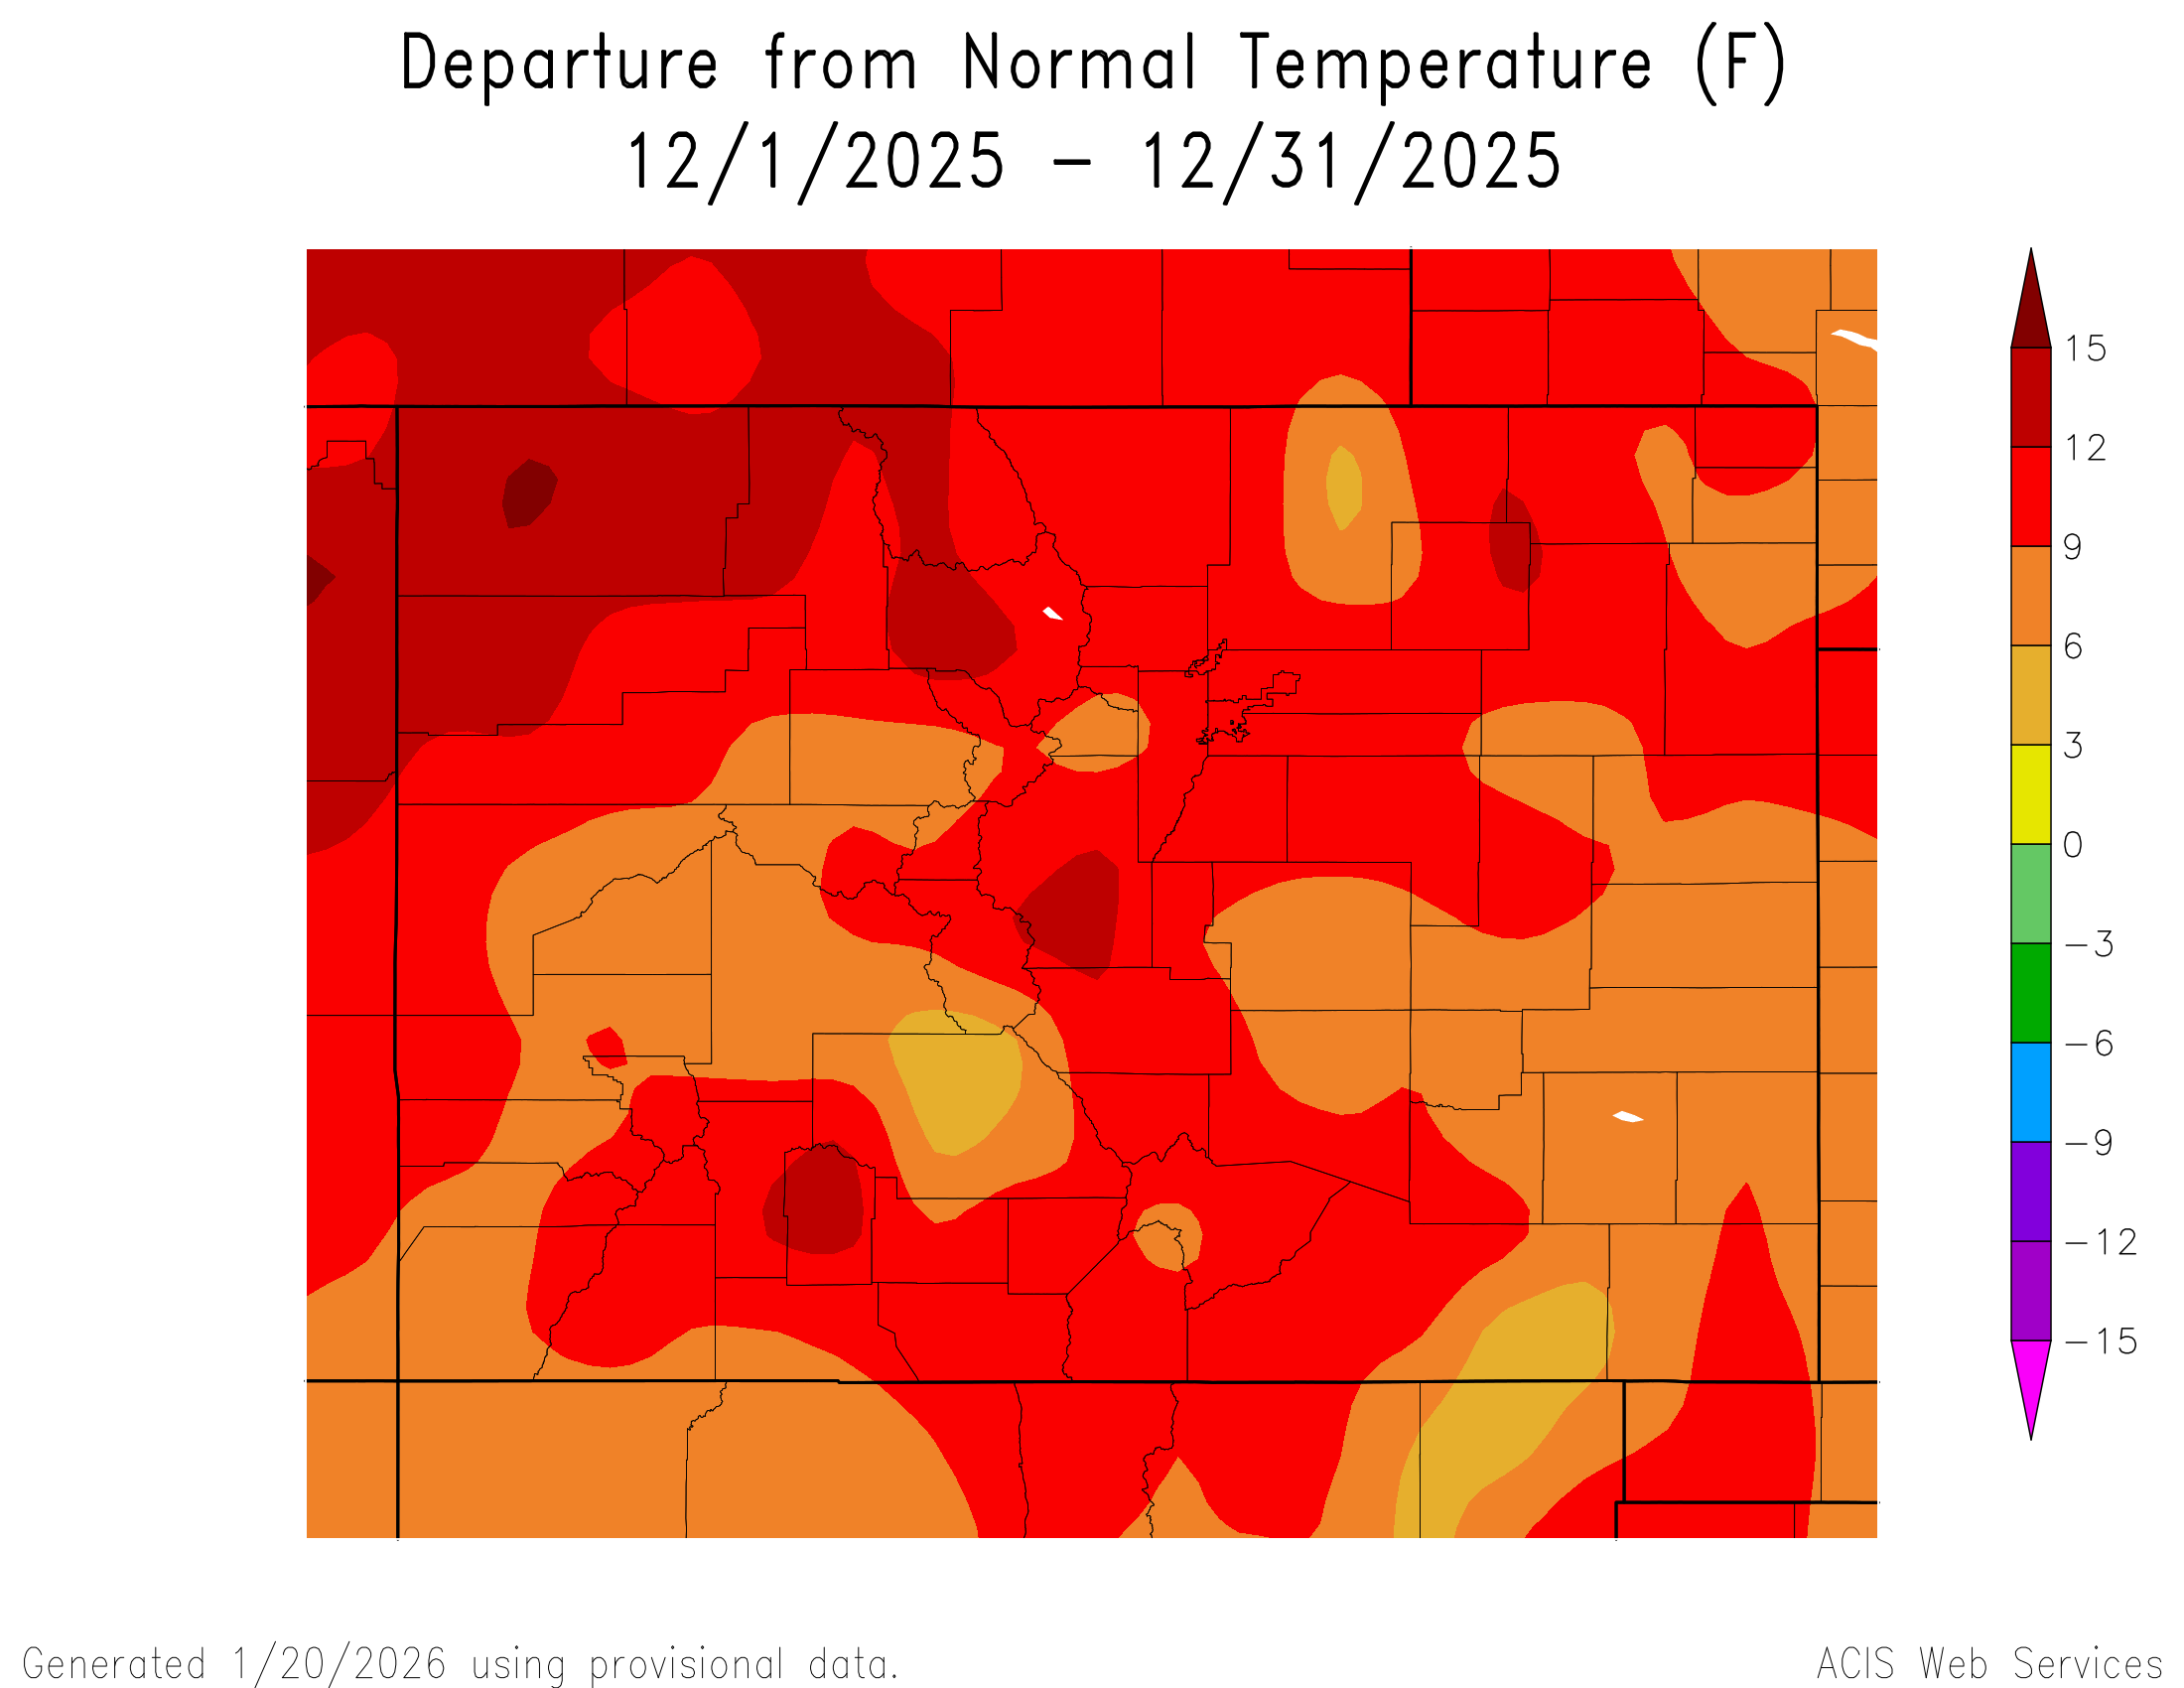
In December, the unusually warm temperatures started to really feel weird. The Colorado Climate Center reported over 1000 daily max temperature records were set statewide. Not only was it hot, it was dry; and the precipitation that did fall was rain at much higher elevations than is typical. In Silverton, it rained on Christmas day. Swamp Angel broke daily maximum temperature records for eight days in a row from 12/19 through 12/26. Snow depth at the end of the month: 20.9”, SWE 5.4”, and the average monthly temperature was 24.6°F.
January
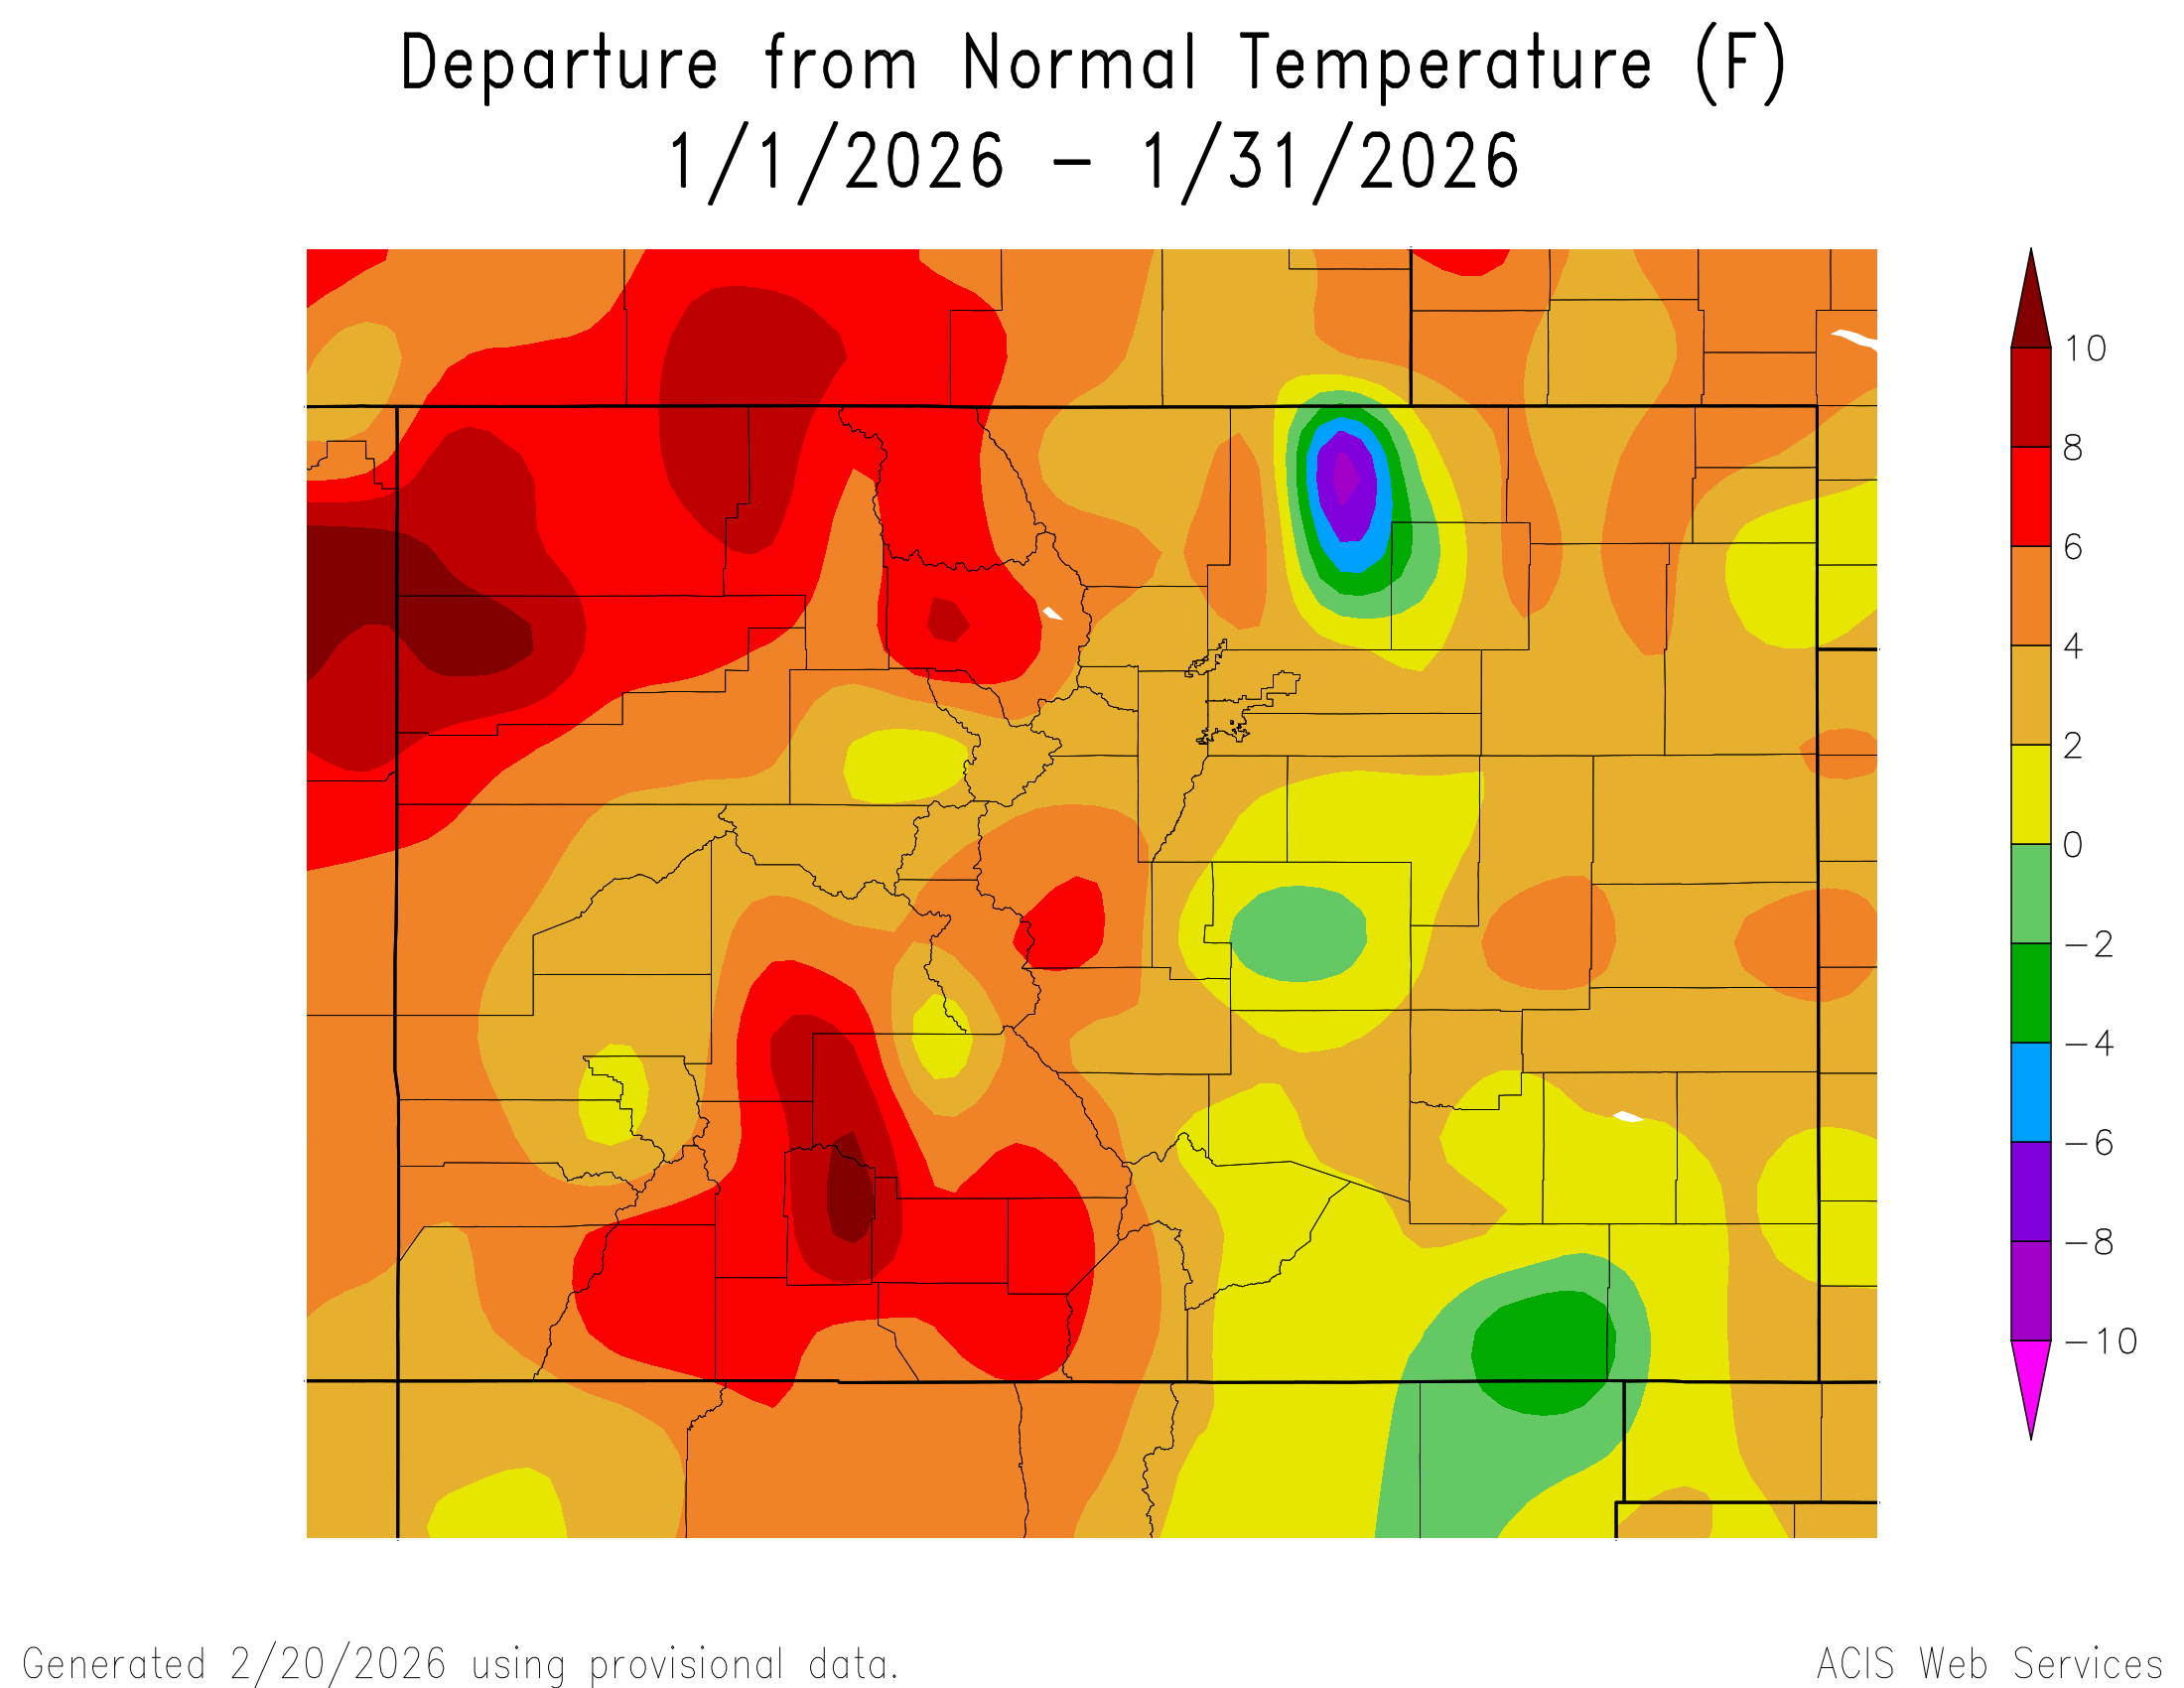
Temperatures in January were warmer than average in most parts of the state, continuing the trend. To kick off the month, it rained in Silverton on New Years Day. Despite the warm temperatures, we were hopeful for a ‘pattern change’ and the snow to really pick up and stay up for the rest of the year. However, though January was snowier than previous months, the extremely low snowpack did not make many gains, and state of Colorado percent of median SWE dipped into record-low territory towards the end of January. Snow depth at Swamp Angel Study Plot at the end of the month was 35”, SWE was 8.1”, and the average monthly temperature: 18.1°F.
February
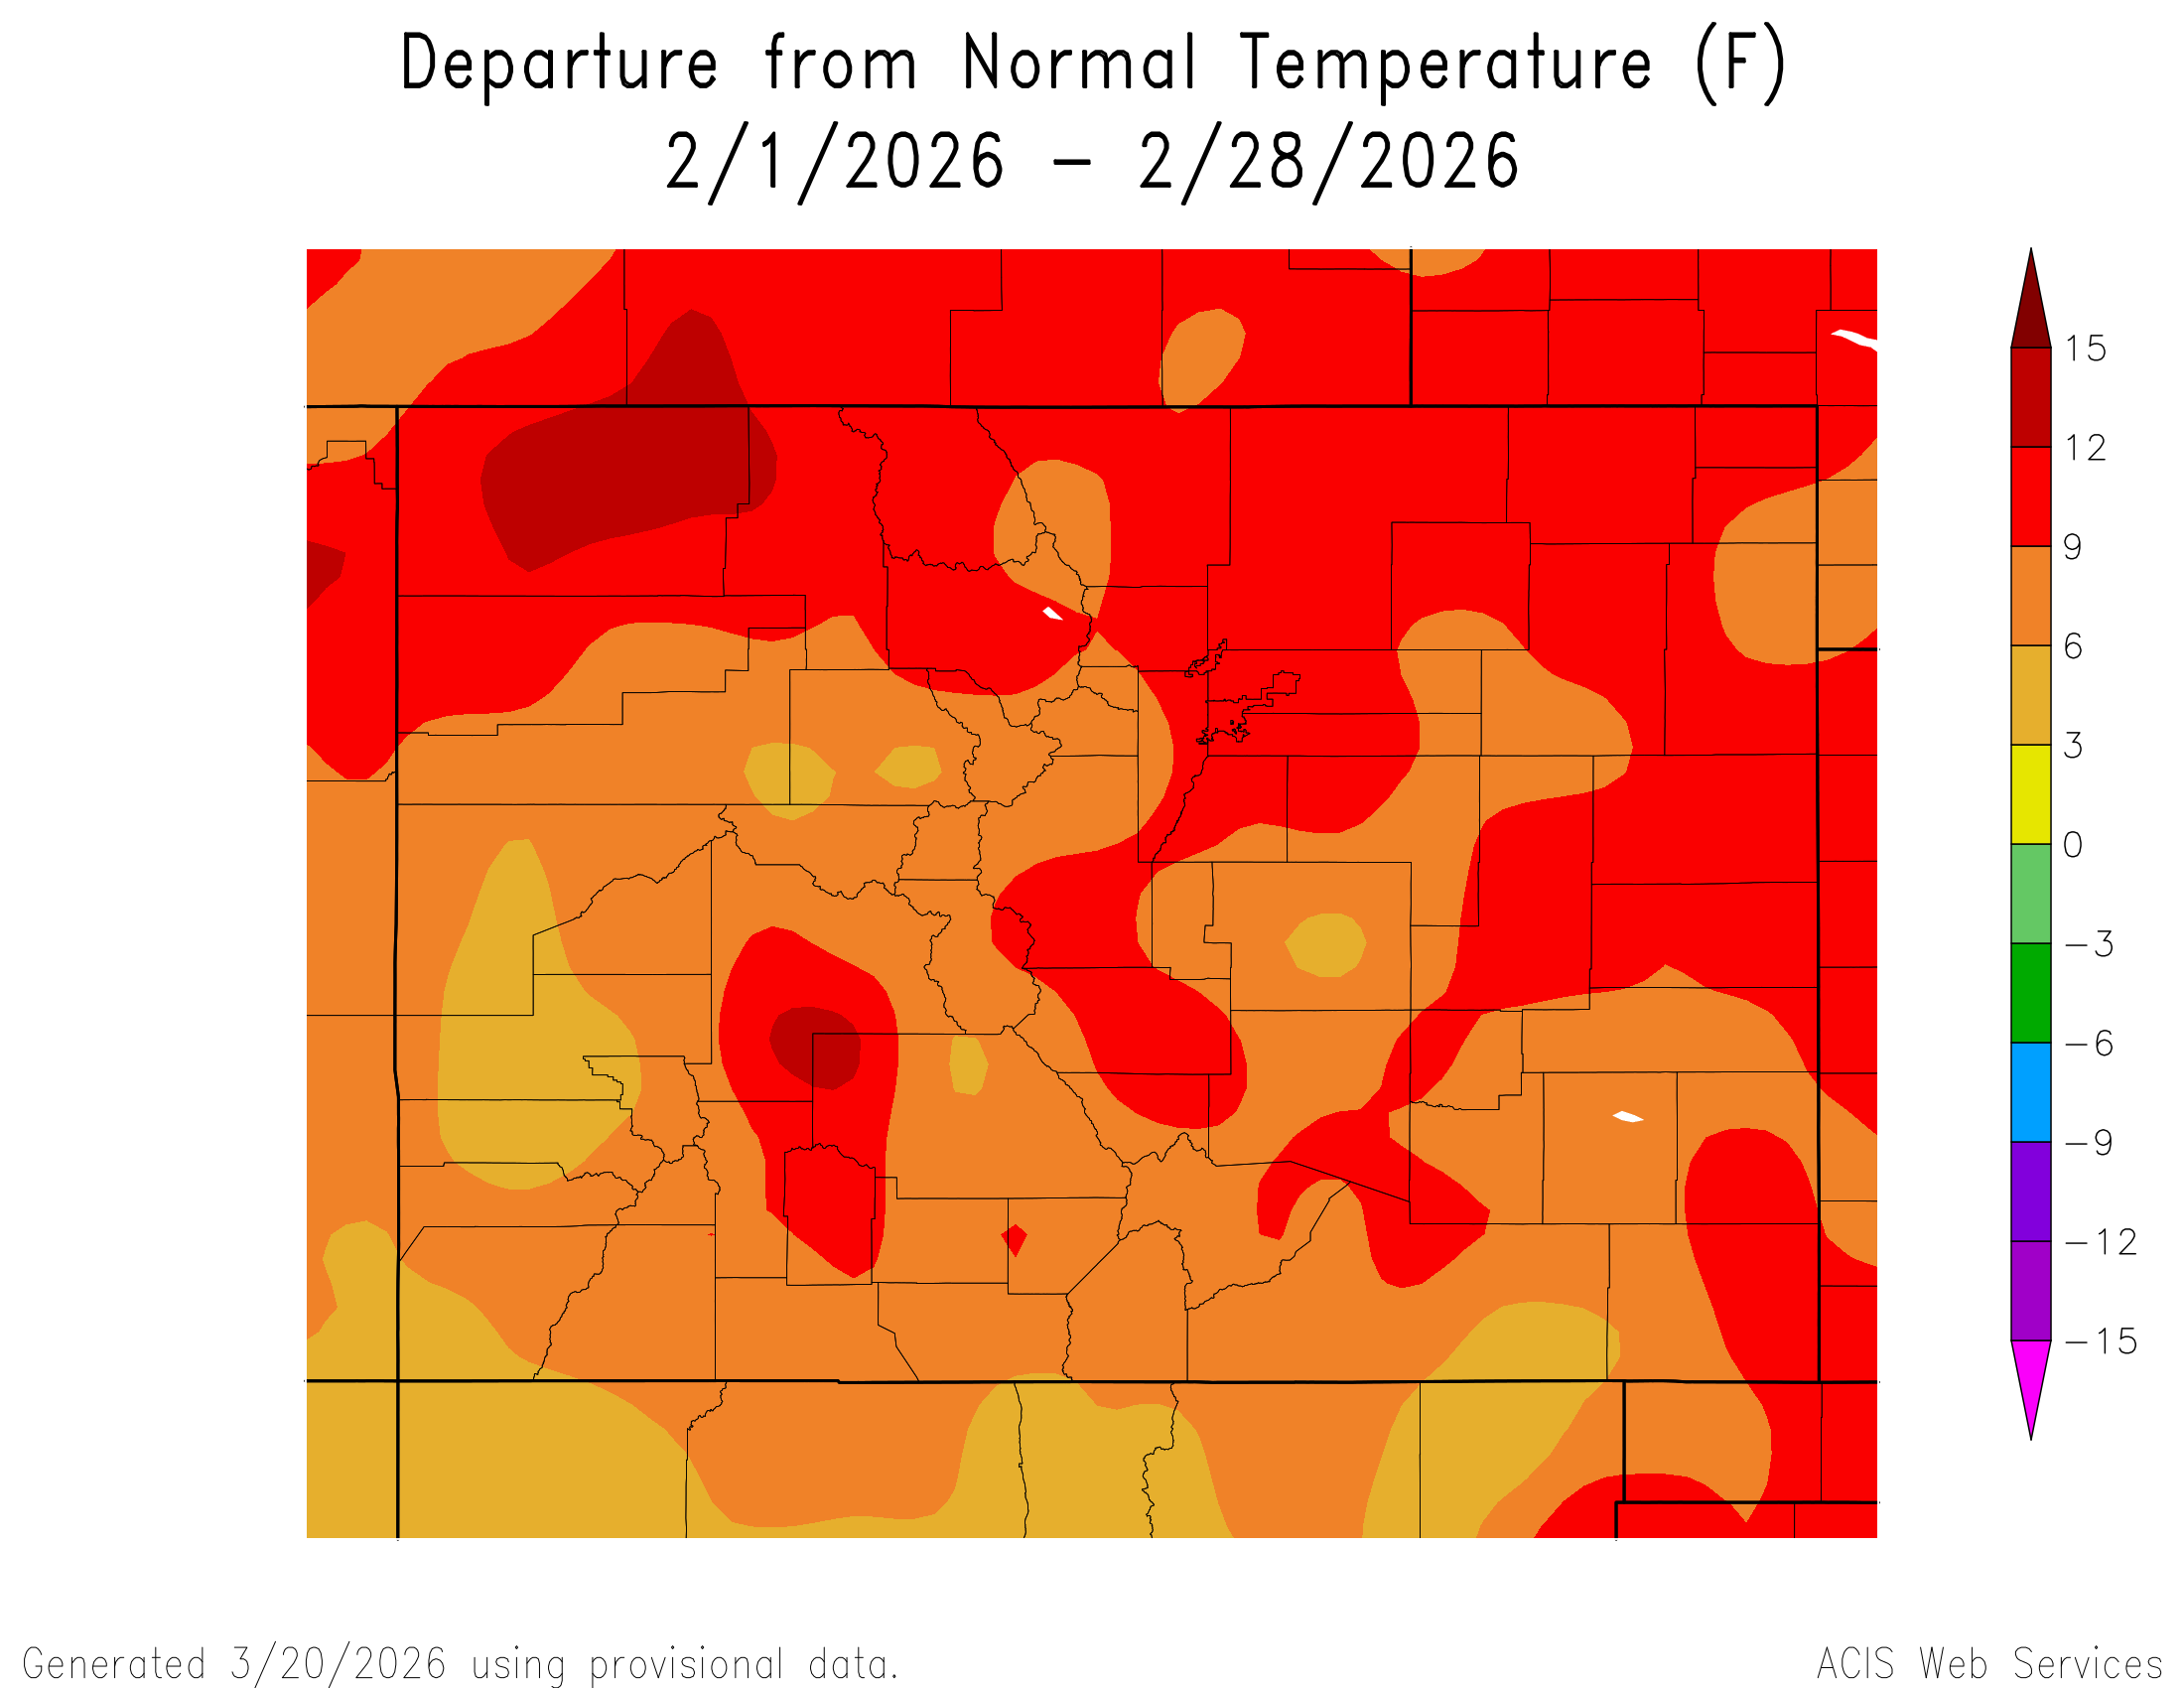
Colorado had the warmest February of the last 132 years with temperatures 7-9 degrees above normal. The state of Colorado snowpack was determined to be the lowest in 40 years. In the southwest, we had a few winter storms but the scale of the deficit was too big for those storms to be very meaningful. Most watersheds in Colorado ended the month with 60-70% of median SWE, and the lowest was the Arkansas River Basin which had only 46% of median SWE. Some stations in the southwest of Colorado hit peak SWE at the end of February. Swamp Angel Study Plot hit a peak snowpack depth of 56” on February 20th. Notably, there were no dust events to record yet this winter. Snow depth at the end of the month was 45” with 11.7” SWE and an average monthly temperature: 23.5°F.
March
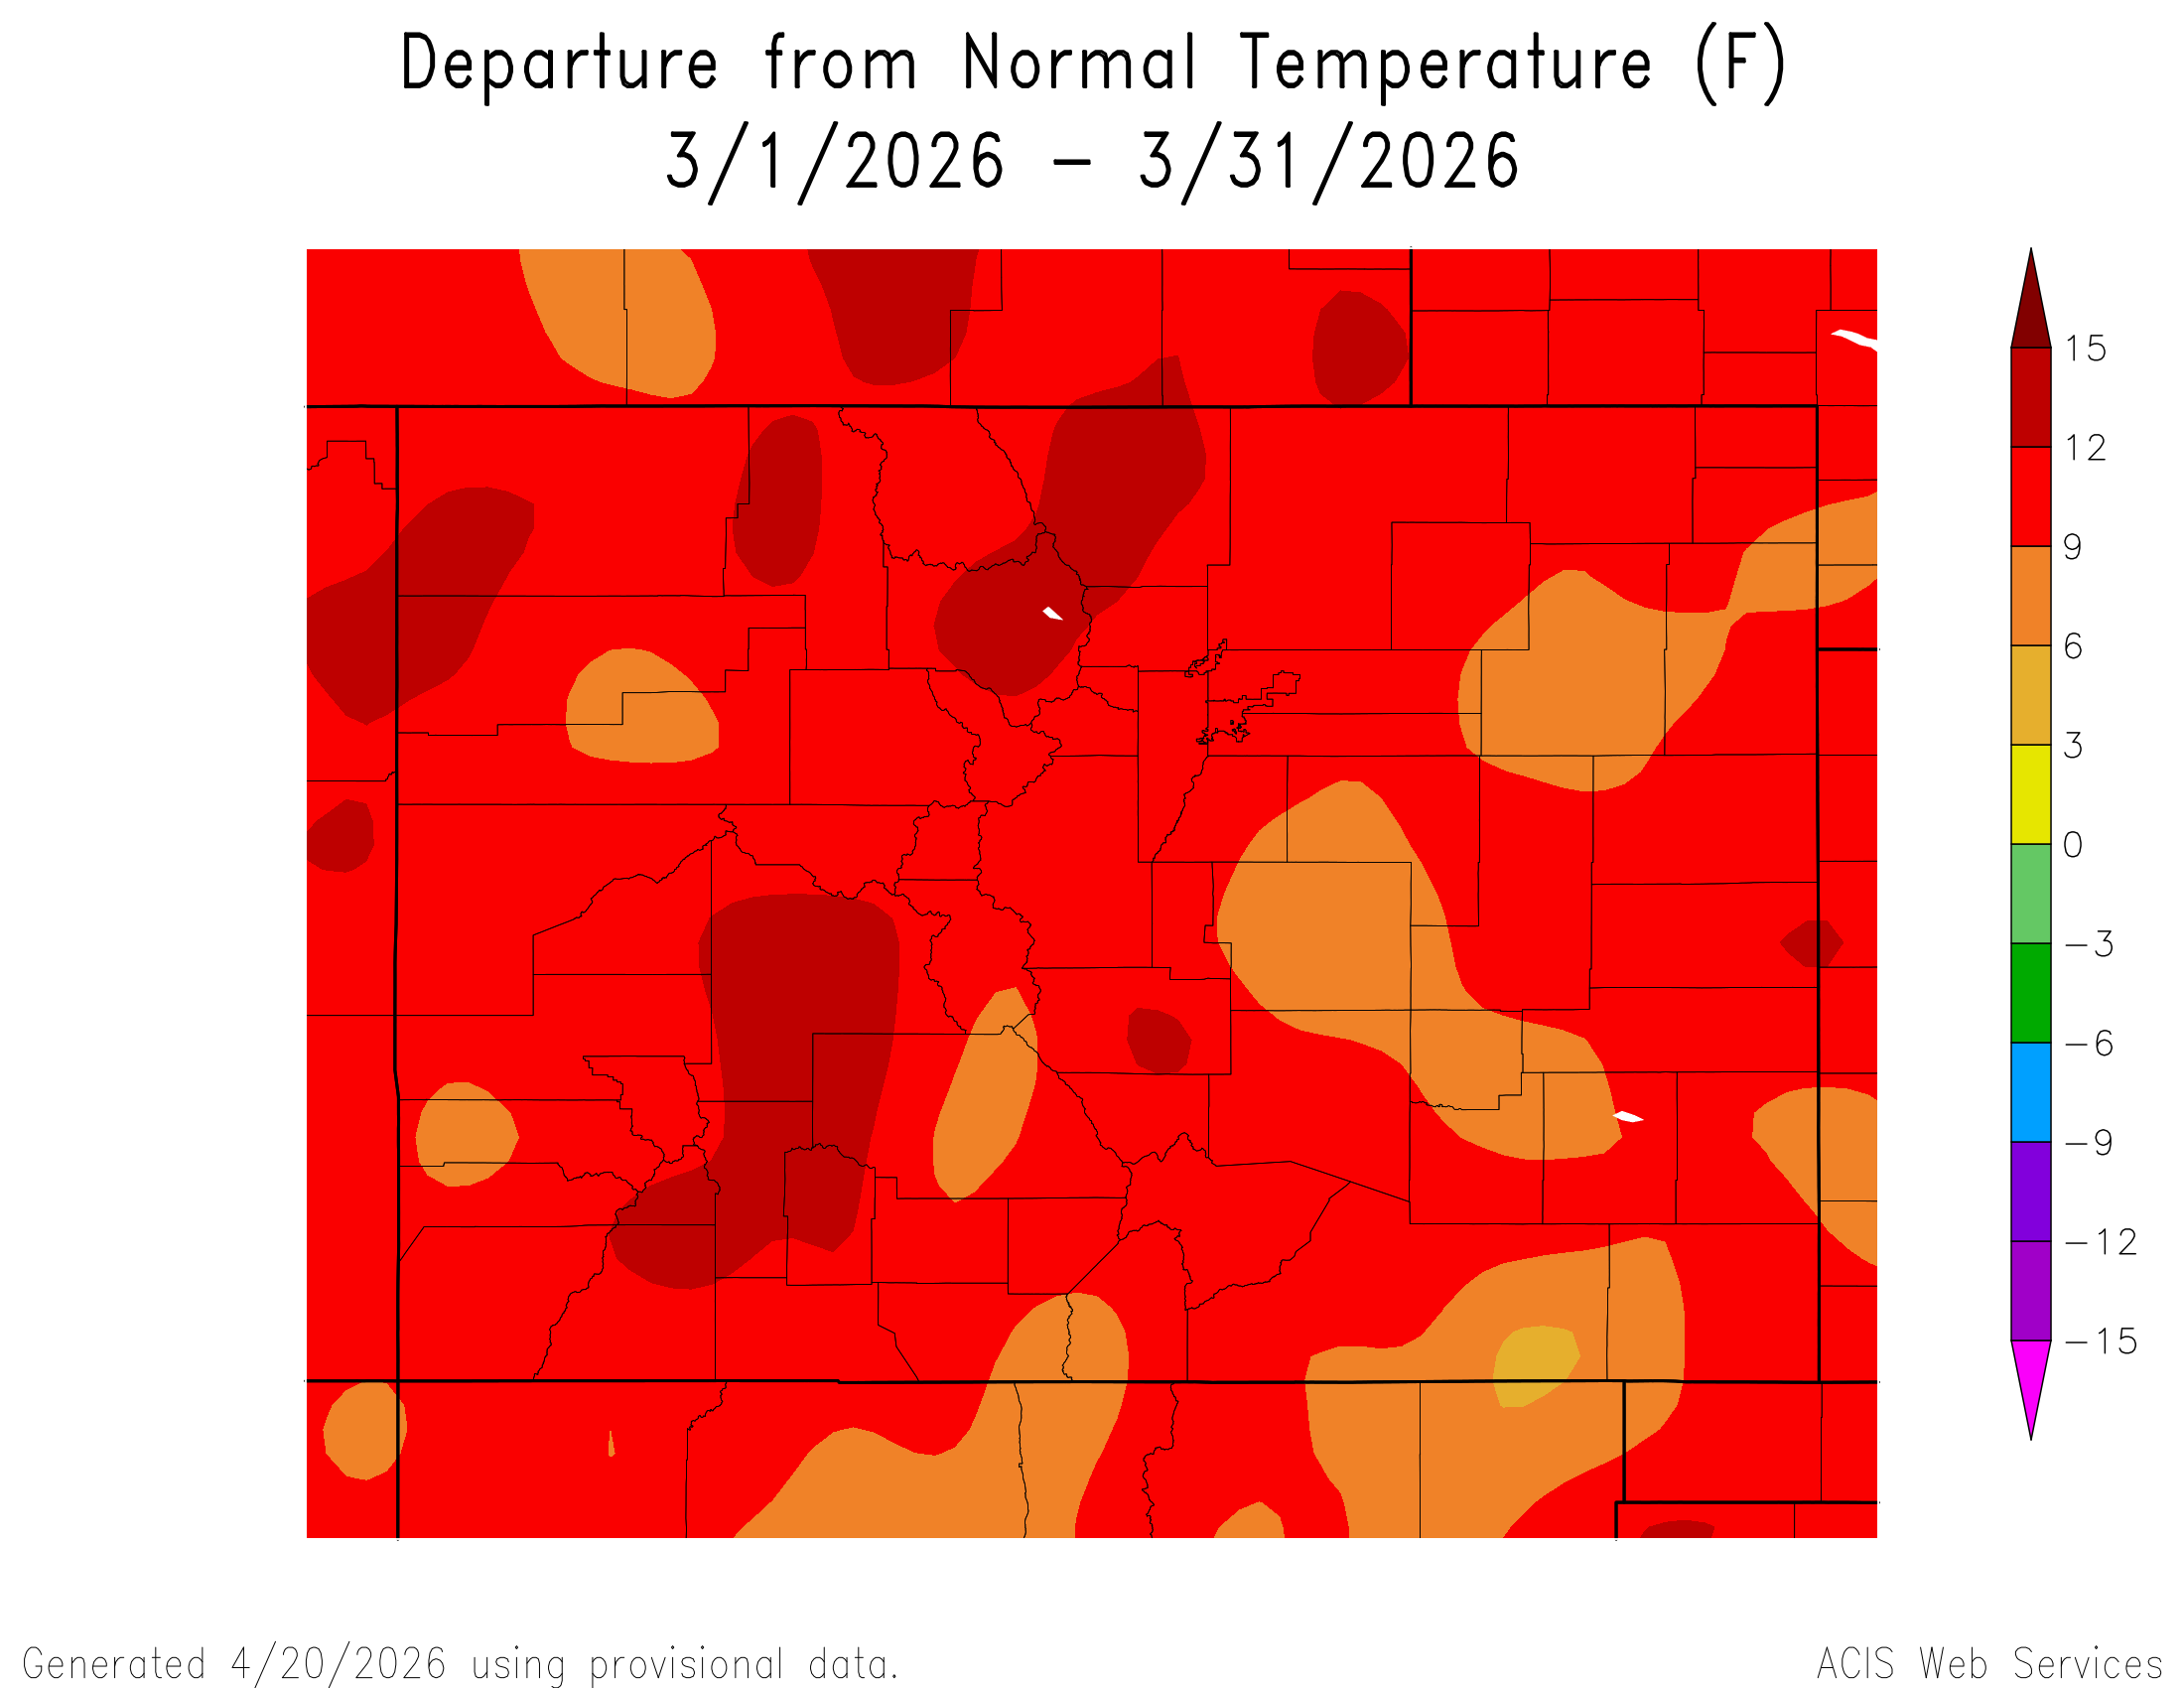
March followed in February’s footsteps and became the warmest March on record for the state of Colorado. In our part of the state, the sun and heat felt relentless, and evening air temperatures at Senator Beck station (12,186’) were above freezing while Swamp Angel (11,060’) was only a degree or two below freezing. The prolonged lack of precipitation kicked snowmelt into drive and SWE plots across the state nose-dived, resulting in an uptick in streamflow in many rivers which we thought could possibly be peak flow. Snow depth at the end of the month had decreased to just 20” with 7.0” of SWE. The average monthly temperature was above freezing, at 33.3°F. March 21 we documented the only dust event of the season. It came out of the southwest and curved around the San Juan Mountains and mainly hitting the Grand Mesa, Roaring Fork, and dissipating but still reaching some of the Front Range observation sites.
April
We did our second CODOS tour at the turn of the month finishing April 3rd, rather than the second week of April, which in a more normal year would capture conditions close to peak SWE. This year, we were flirting with snow all gone at many of our sites, and therefore mobilized to collect our dust samples before that happened. Conditions were a month and a half ahead of the normal schedule. Some faint buried surface dust was found in the snowpack at Berthoud, Loveland, and Rabbit Ears. Some sites, including Grand Mesa, had surface dust from the March 21 dust event. We received the pattern change we were hoping for as April progressed, but no season-saving snowstorms arrived. Instead, in the southwest, we had overcast weather, some precipitation, and more normal temperatures. This stalled the nose-dive of SWE plots and returned streamflows to holding steady or slightly declining. Snow depth at Swamp Angel at the end of April was just 13”, with 6.5” SWE, and an average monthly temperature of 30.2°F.
May
While southwestern Colorado was still warm, the rest of the state of Colorado finally got back to more normal temperatures. A few days into May, the dry conditions returned, especially in the southwest, and we saw streamflows rise and peak as the rest of the snowpack sped towards melt-out after the April stall-out. A couple of our CODOS sites saw decent snowstorms in the central mountains, but the rest continued their melt-out. Snow all gone at Swamp Angel was May 13, the earliest date in our 22-year record. Snow was gone at Senator Beck by May 28. The dust season remained the mildest on record, with the only distinct layer present in the Roaring Fork and Grand Mesa region. Very mild surface dust was observed at other sites, some of those dust sources were likely more local or very mild regional events. Average monthly temperature at Swamp Angel was 38.8°F.
June/July Weather Summary: June was warm and usually dry. Multiple forest fires kicked up across the Western U.S. Fortunately the monsoons arrived mid-July benefitting southern Colorado the most but all of Colorado to a degree as of this writing.
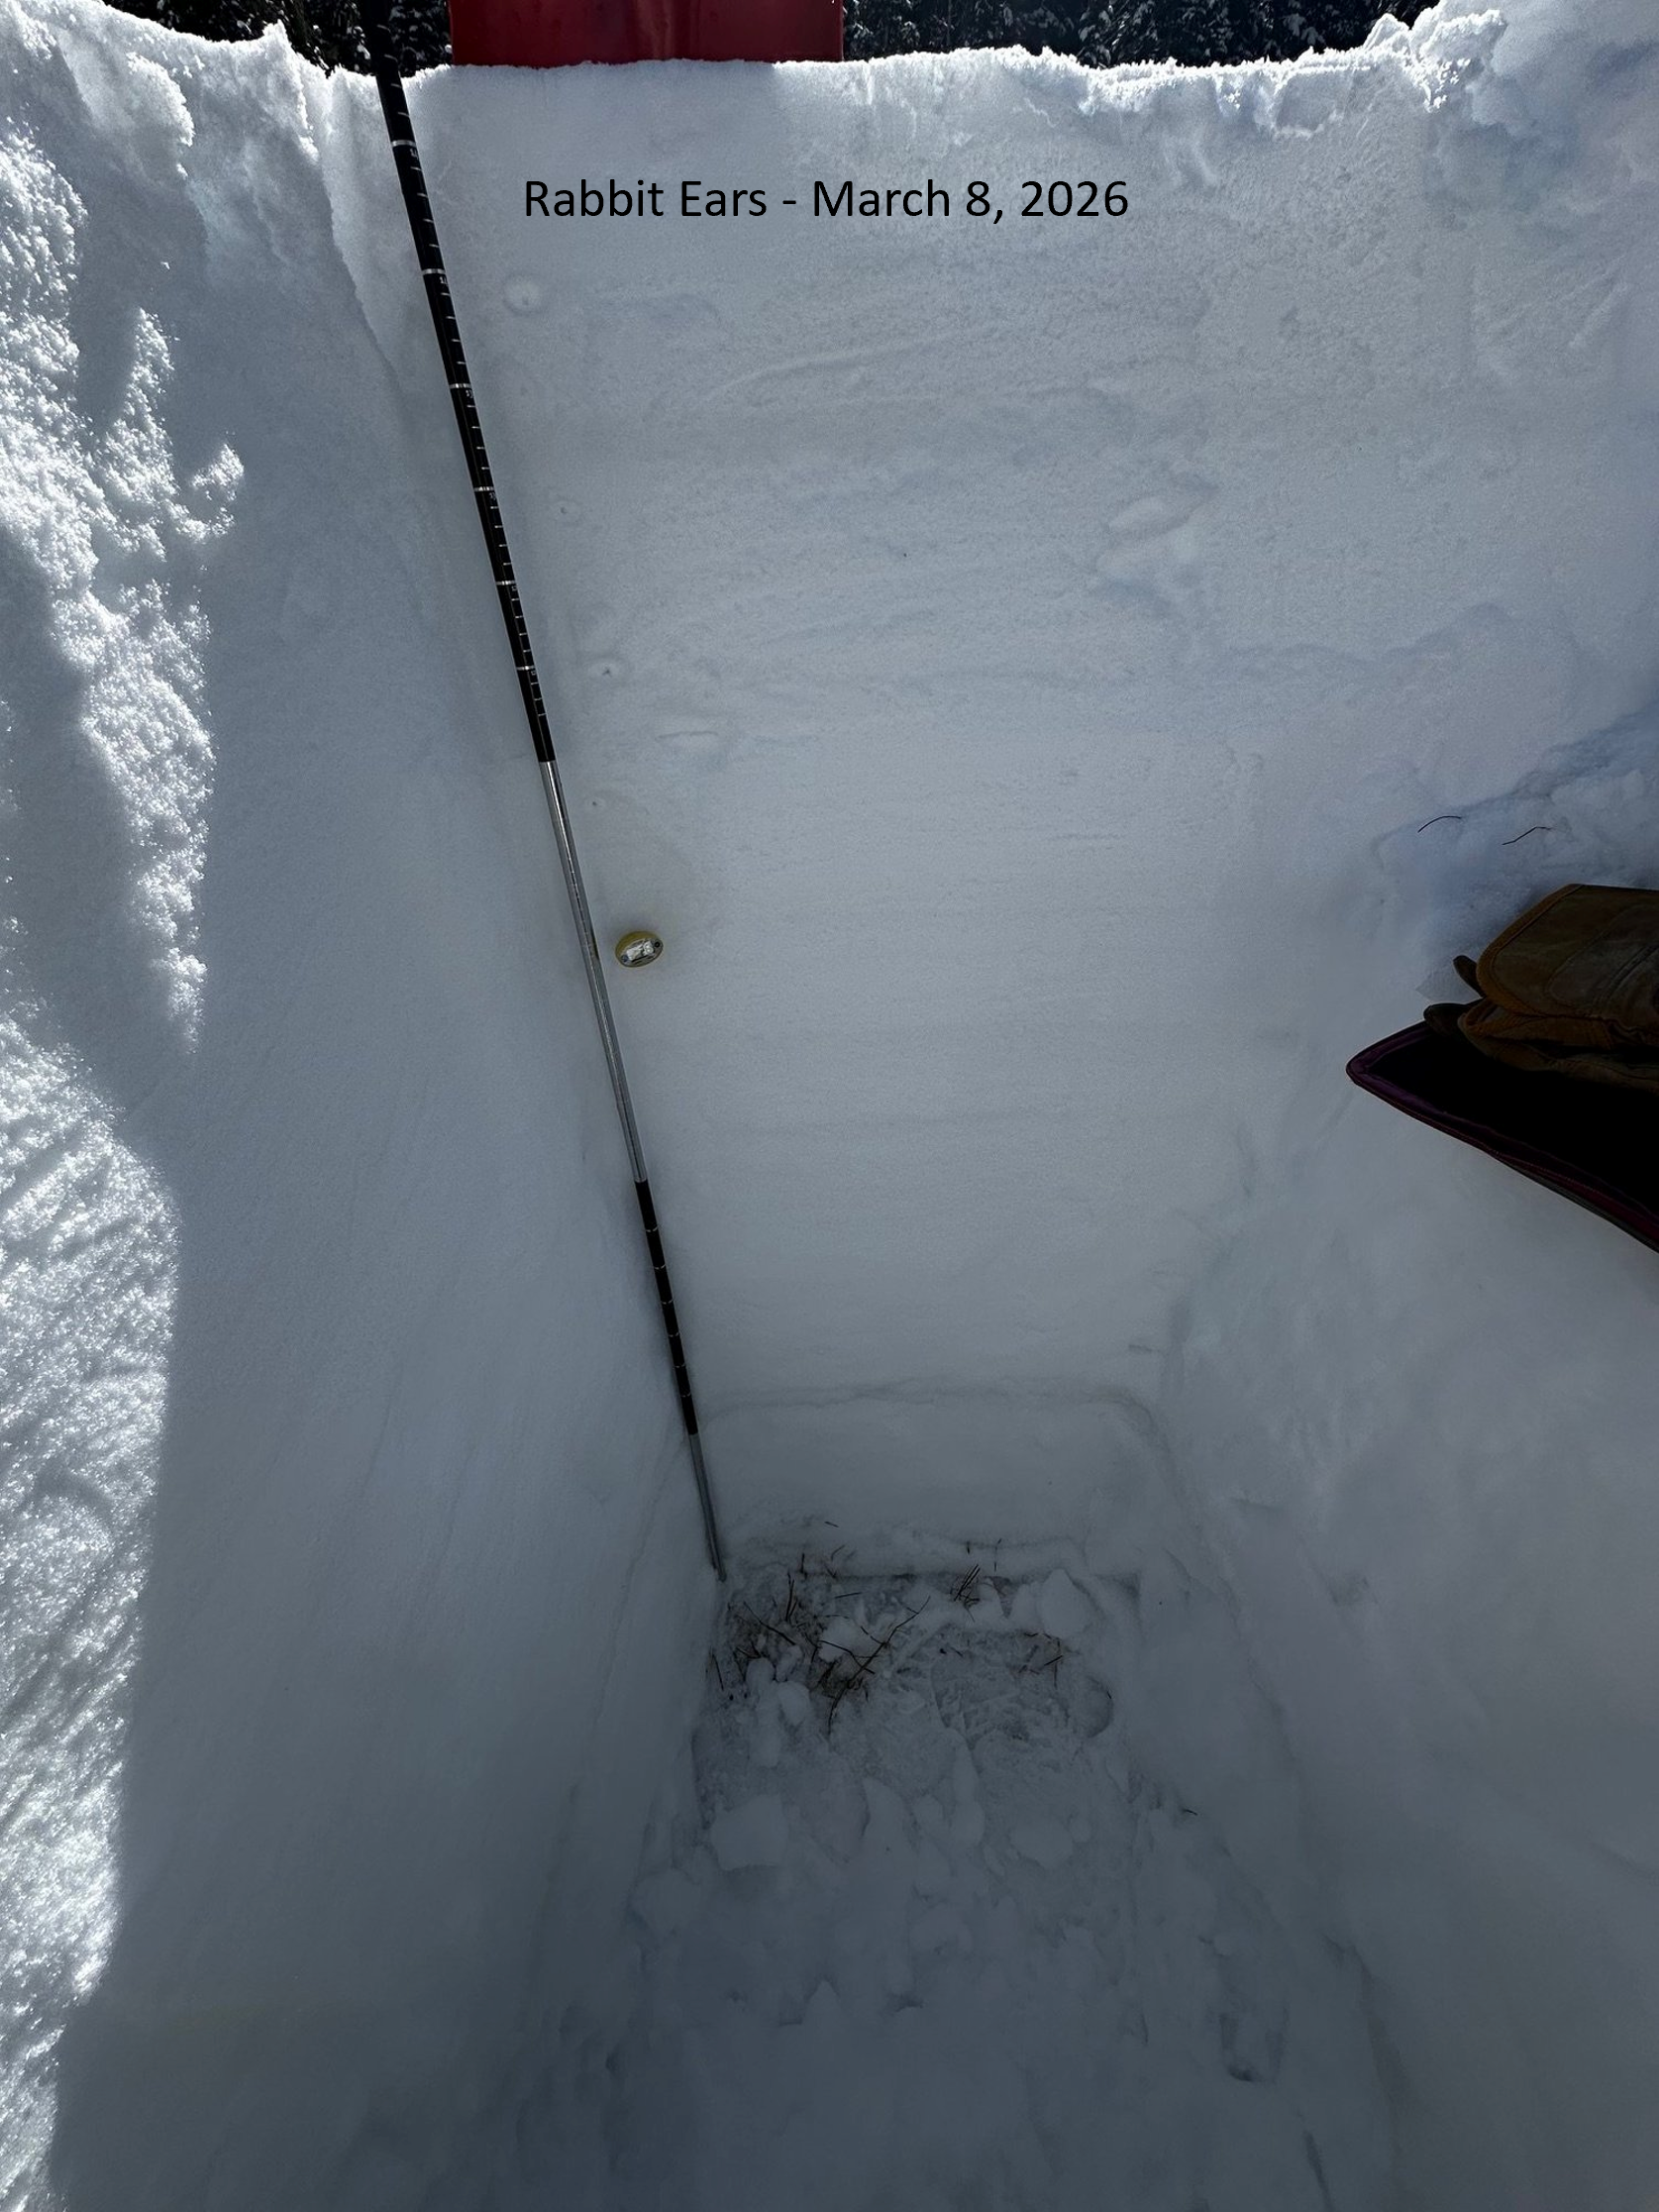
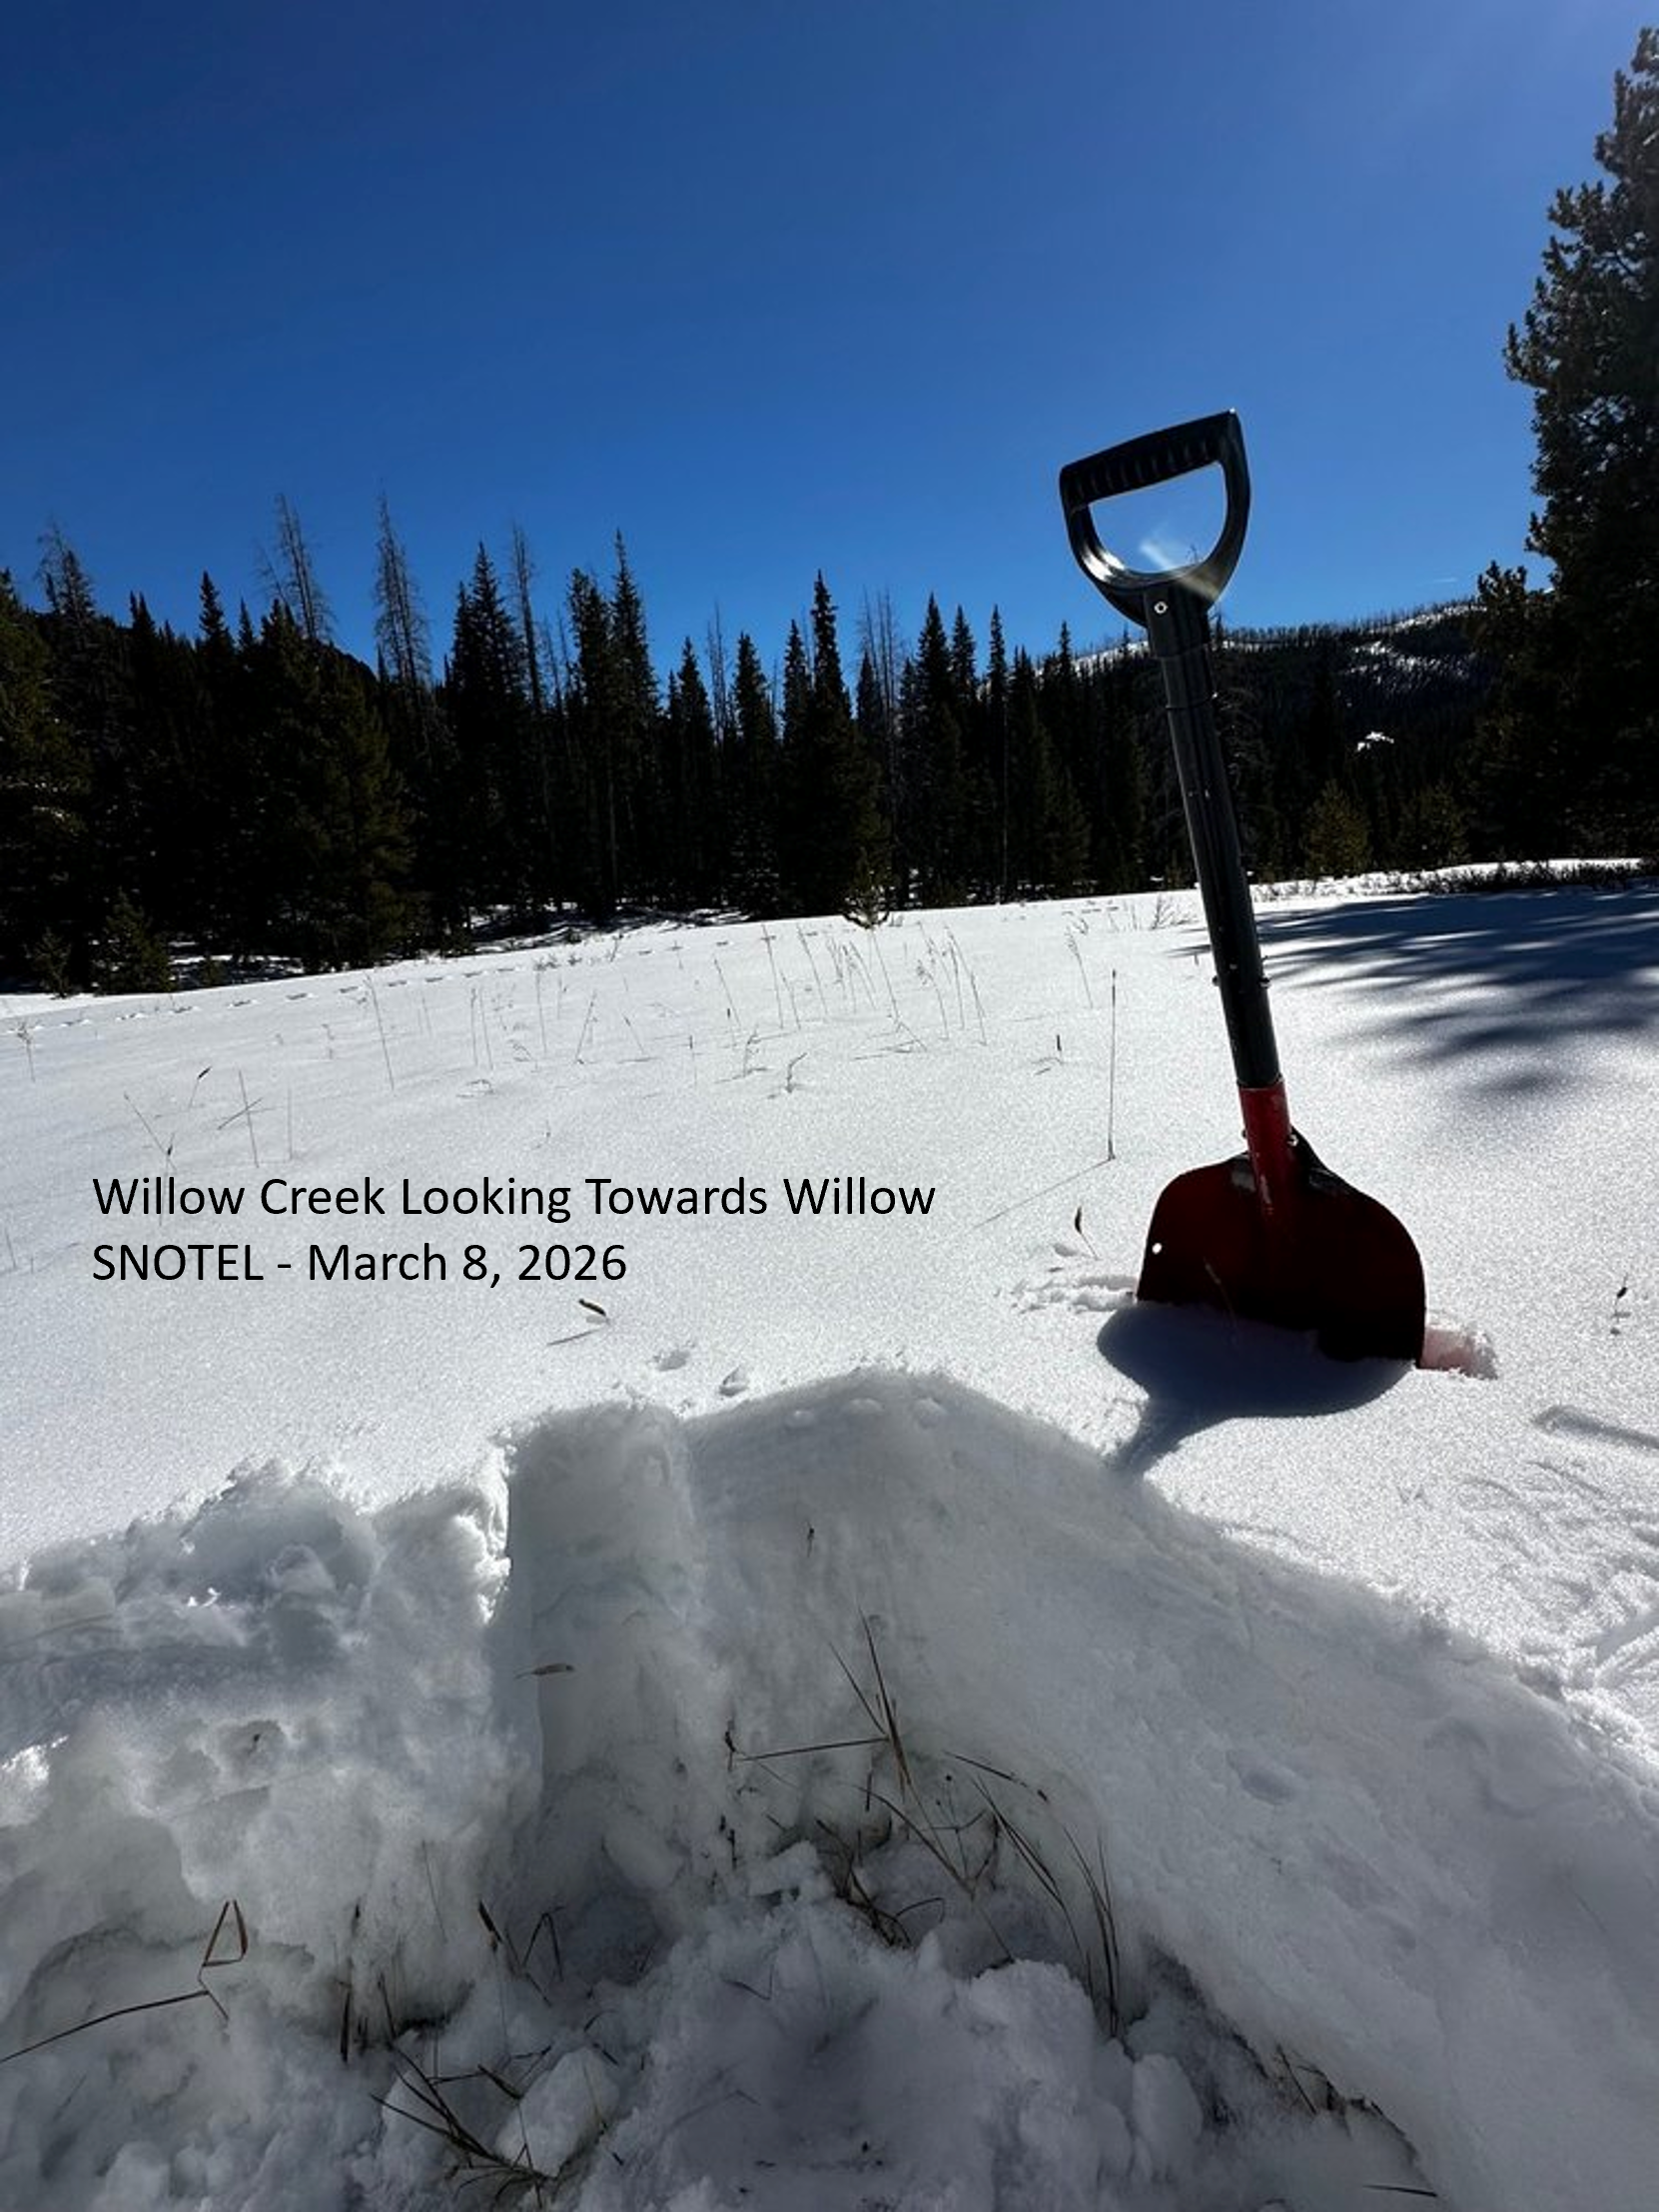
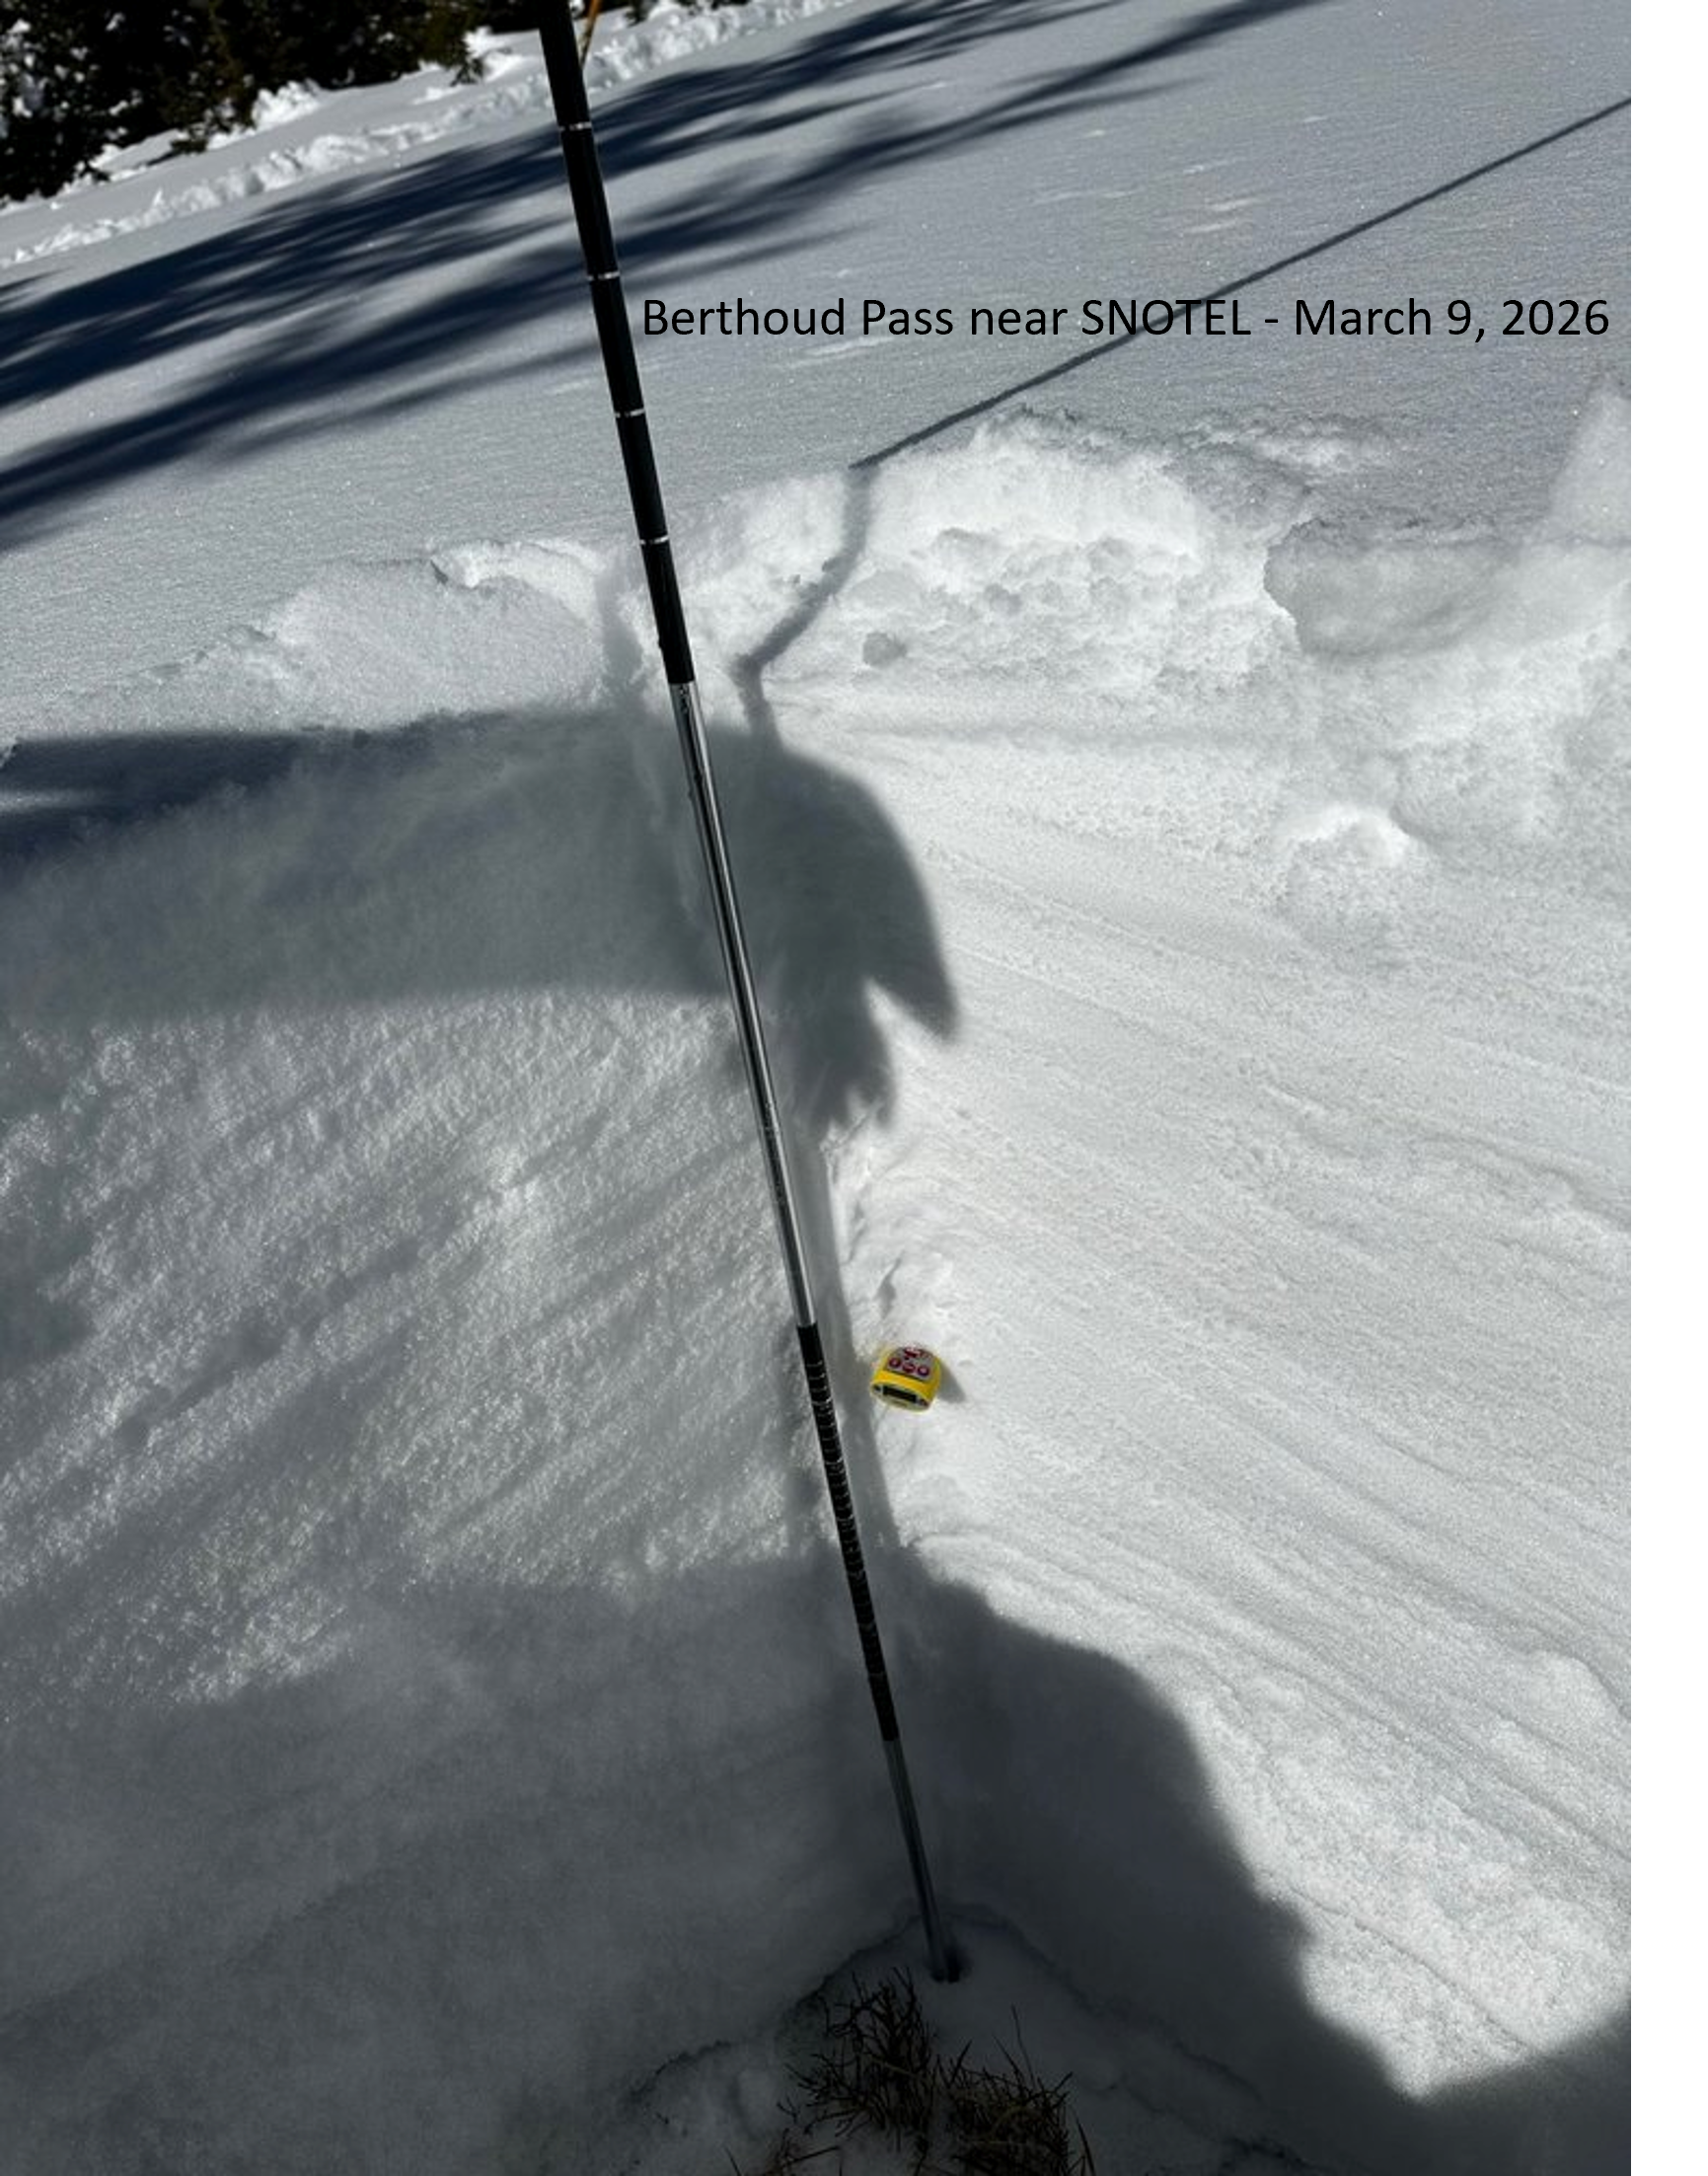
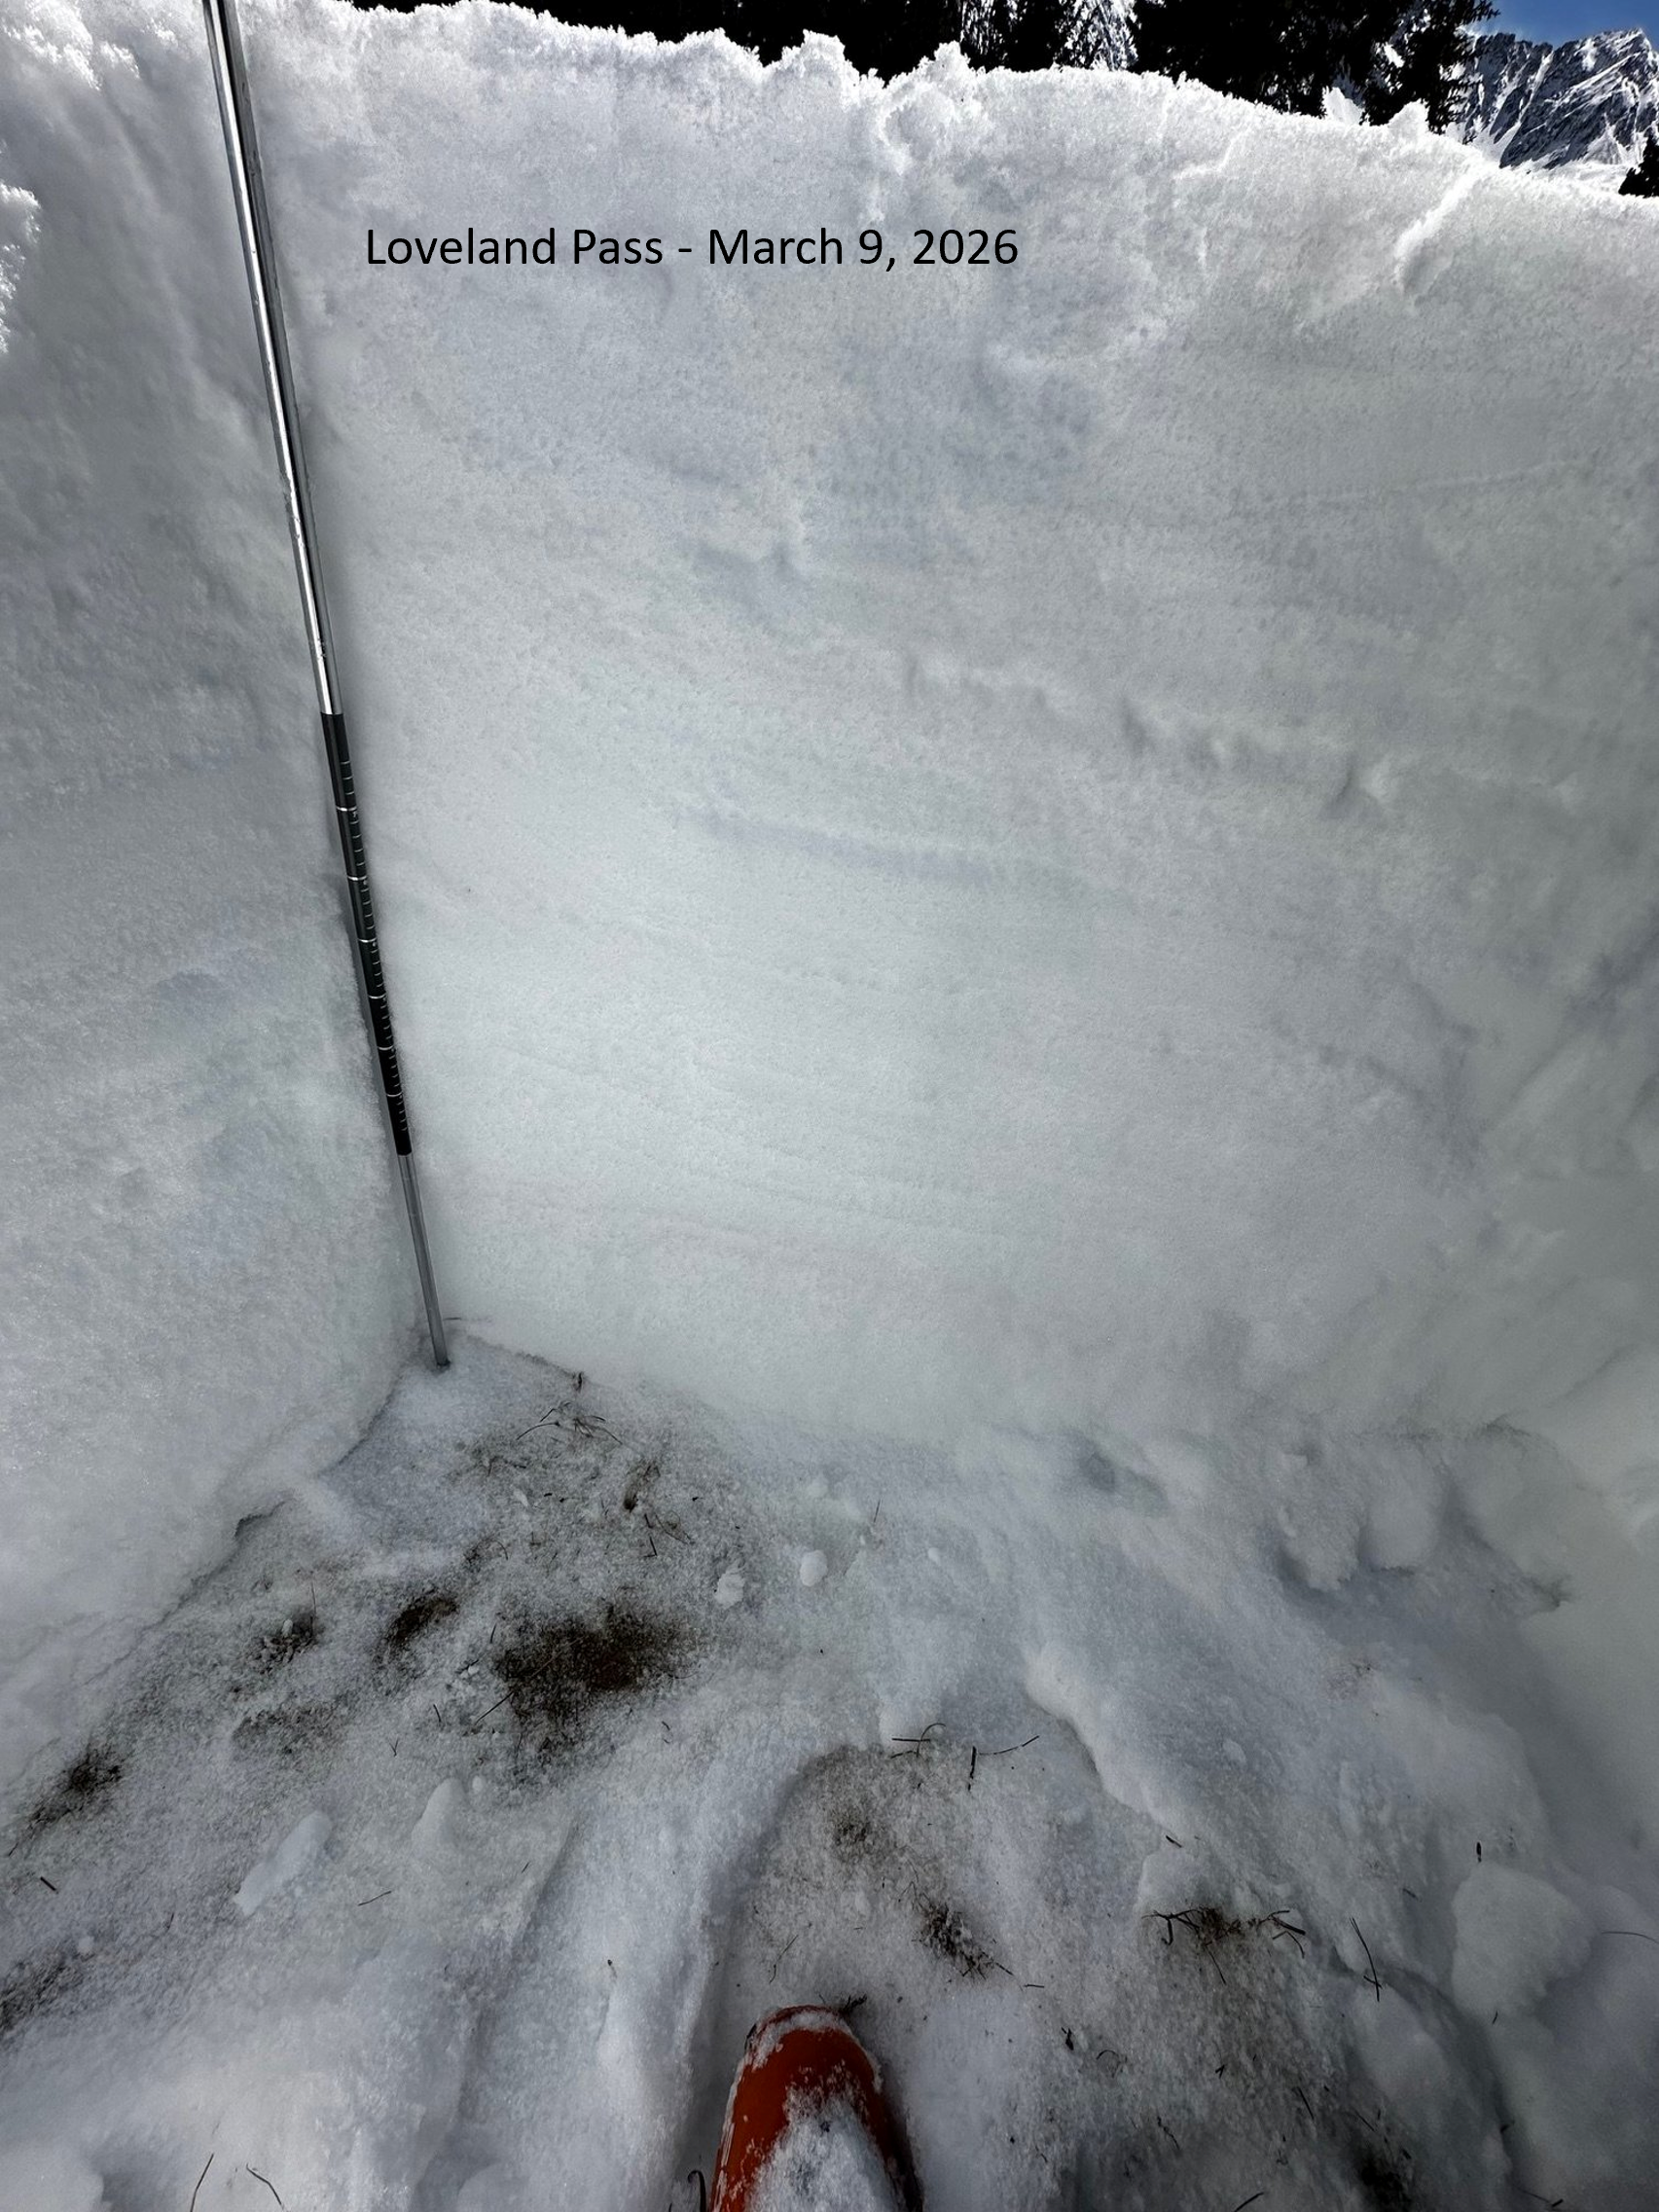
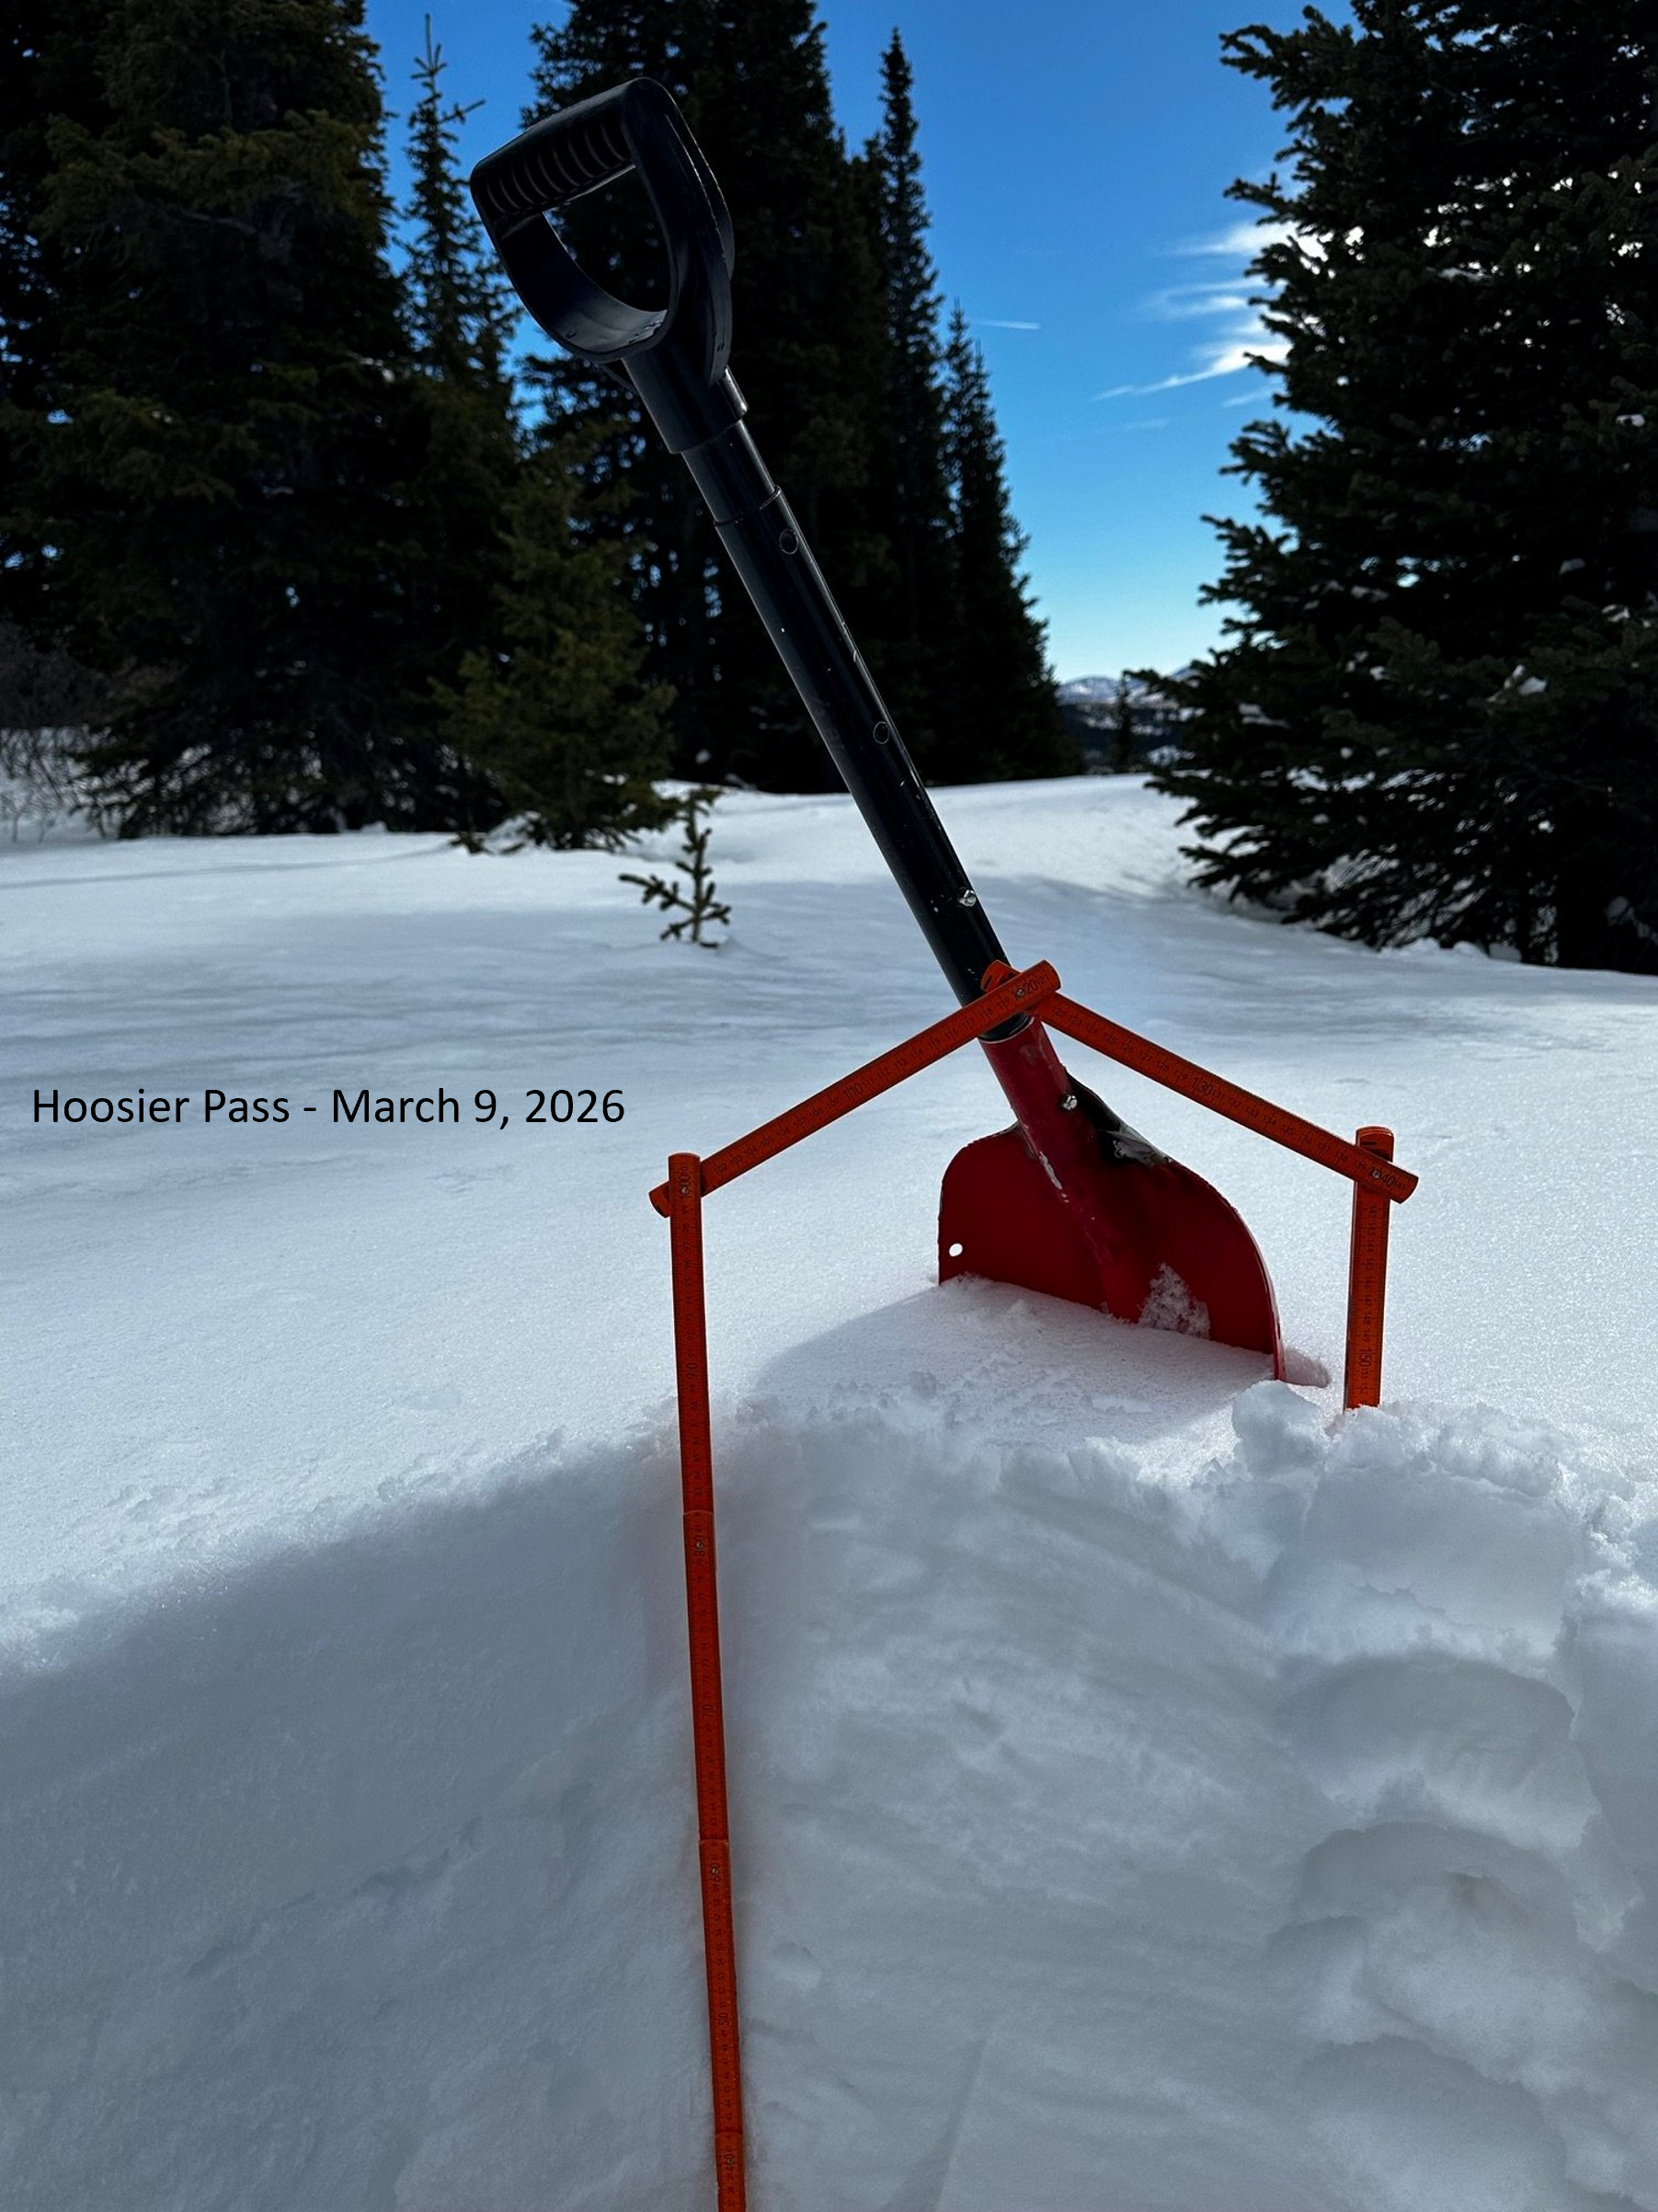
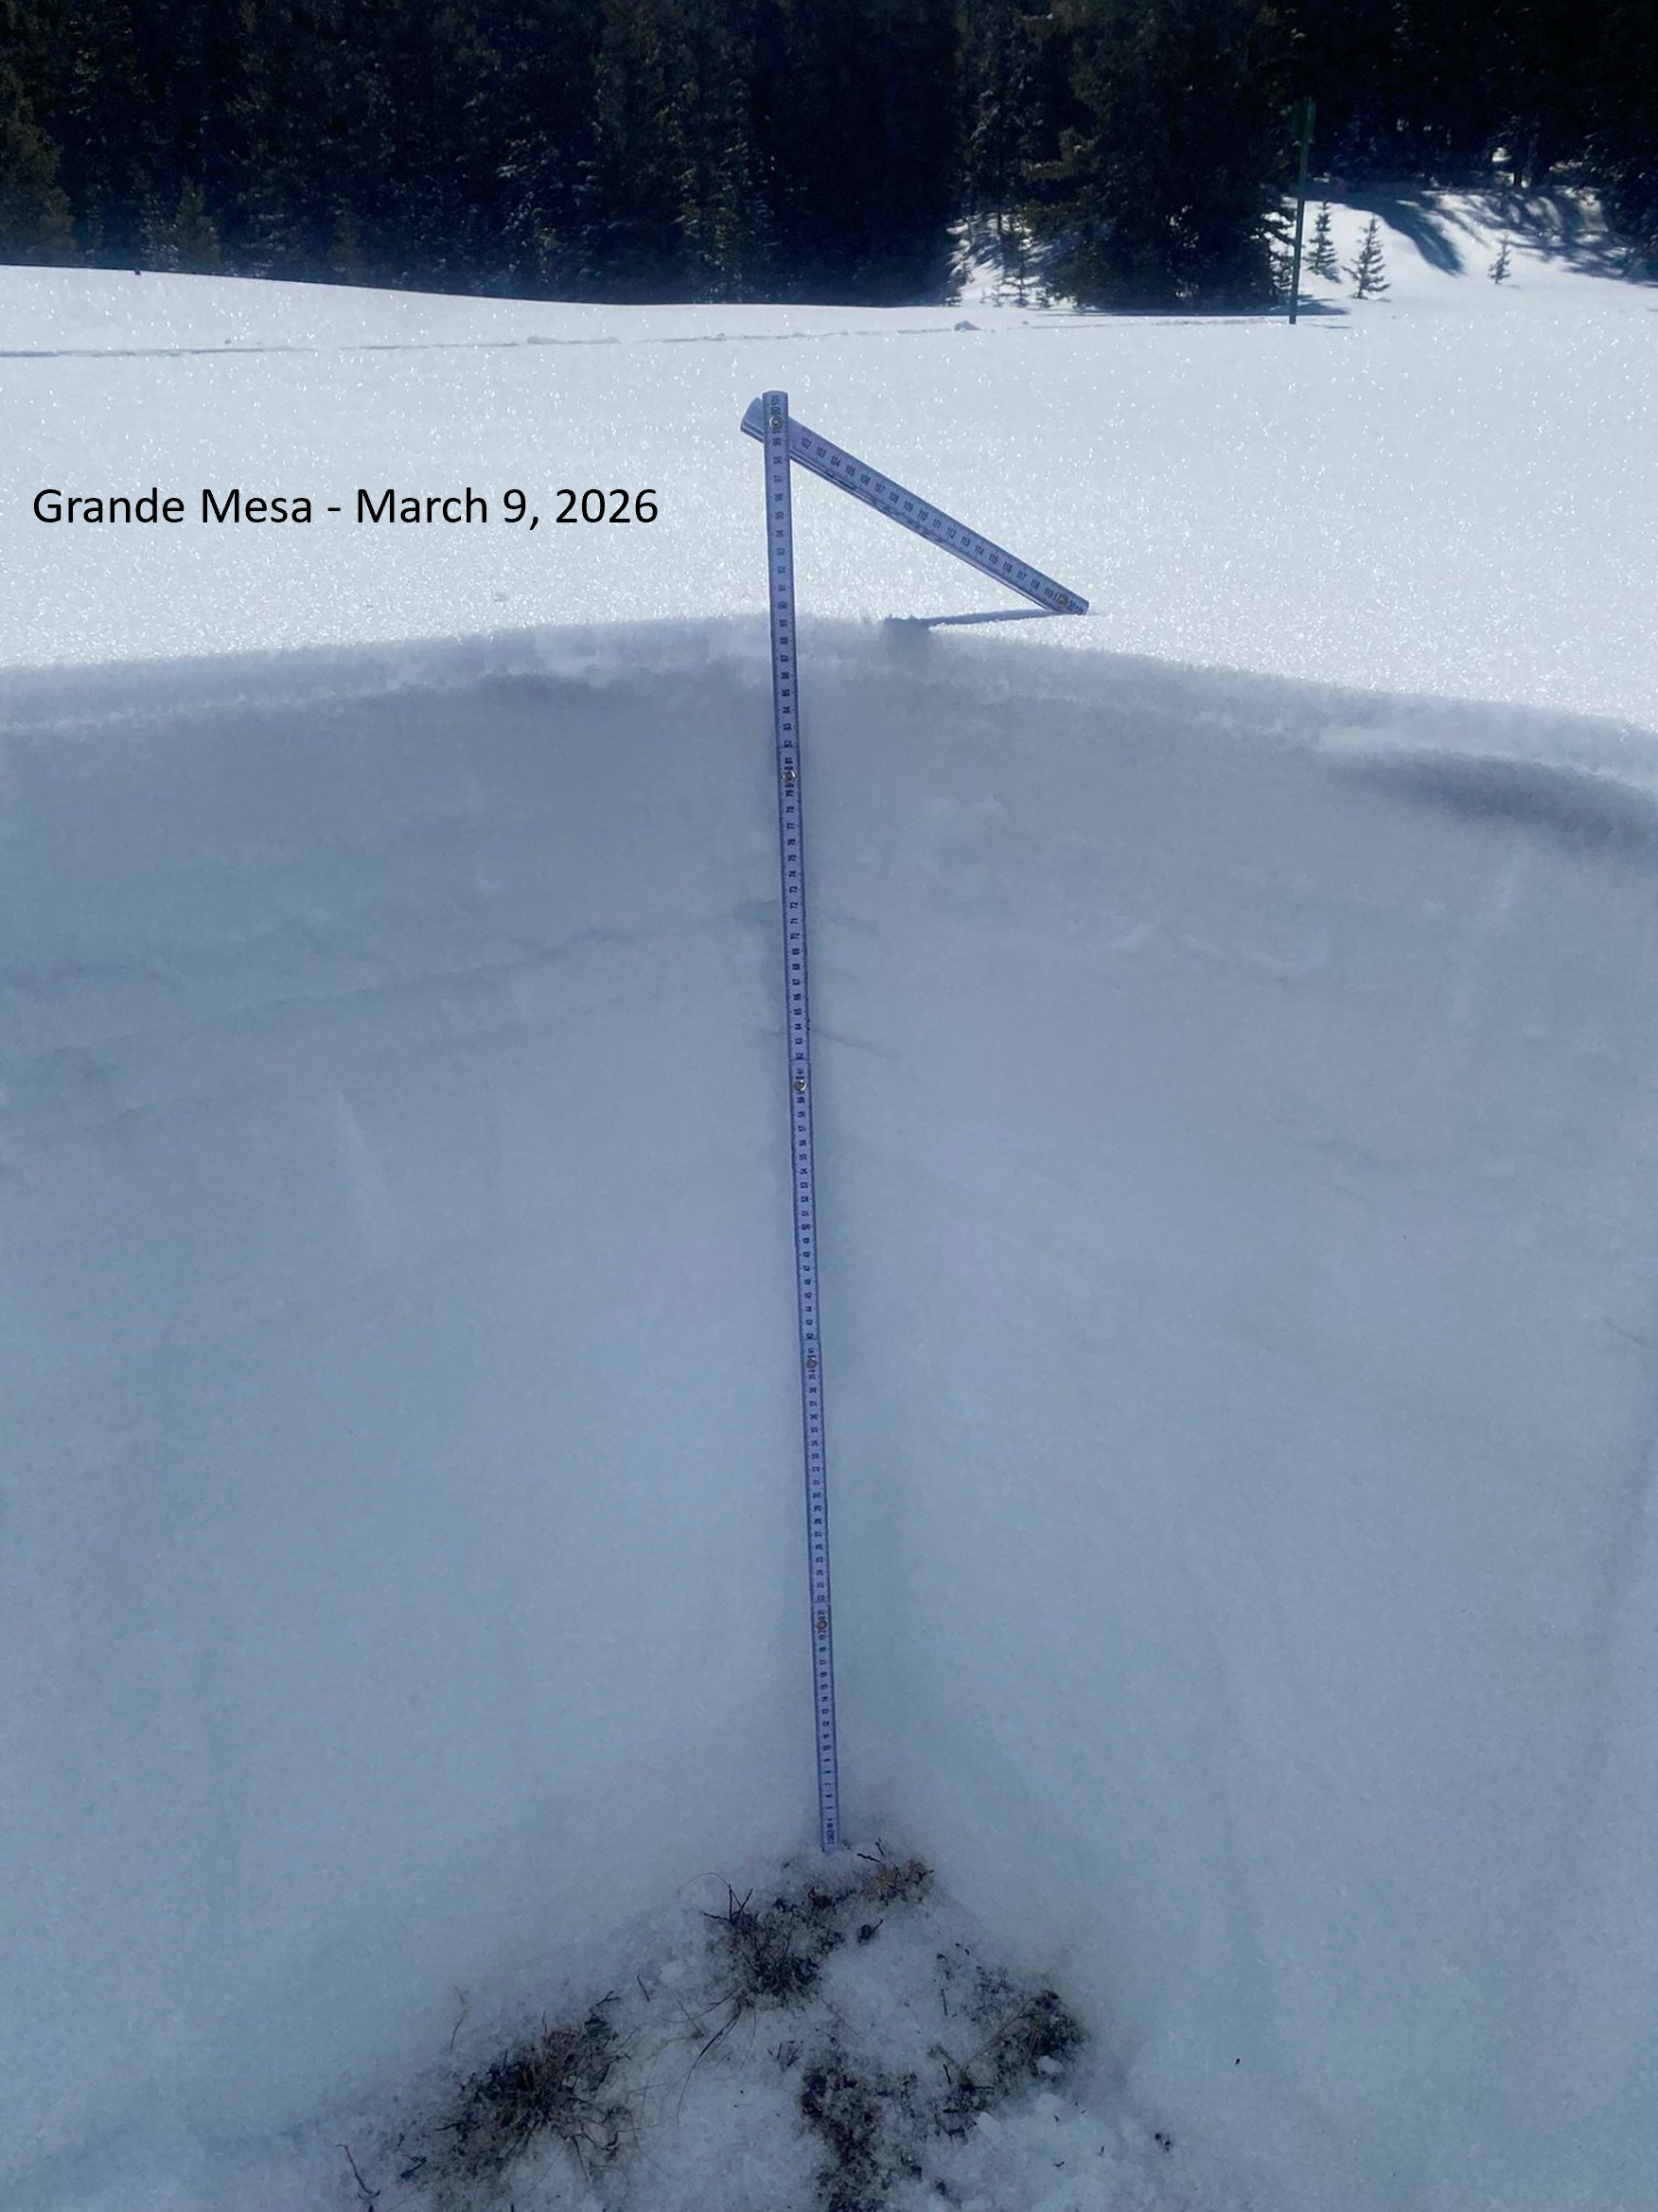
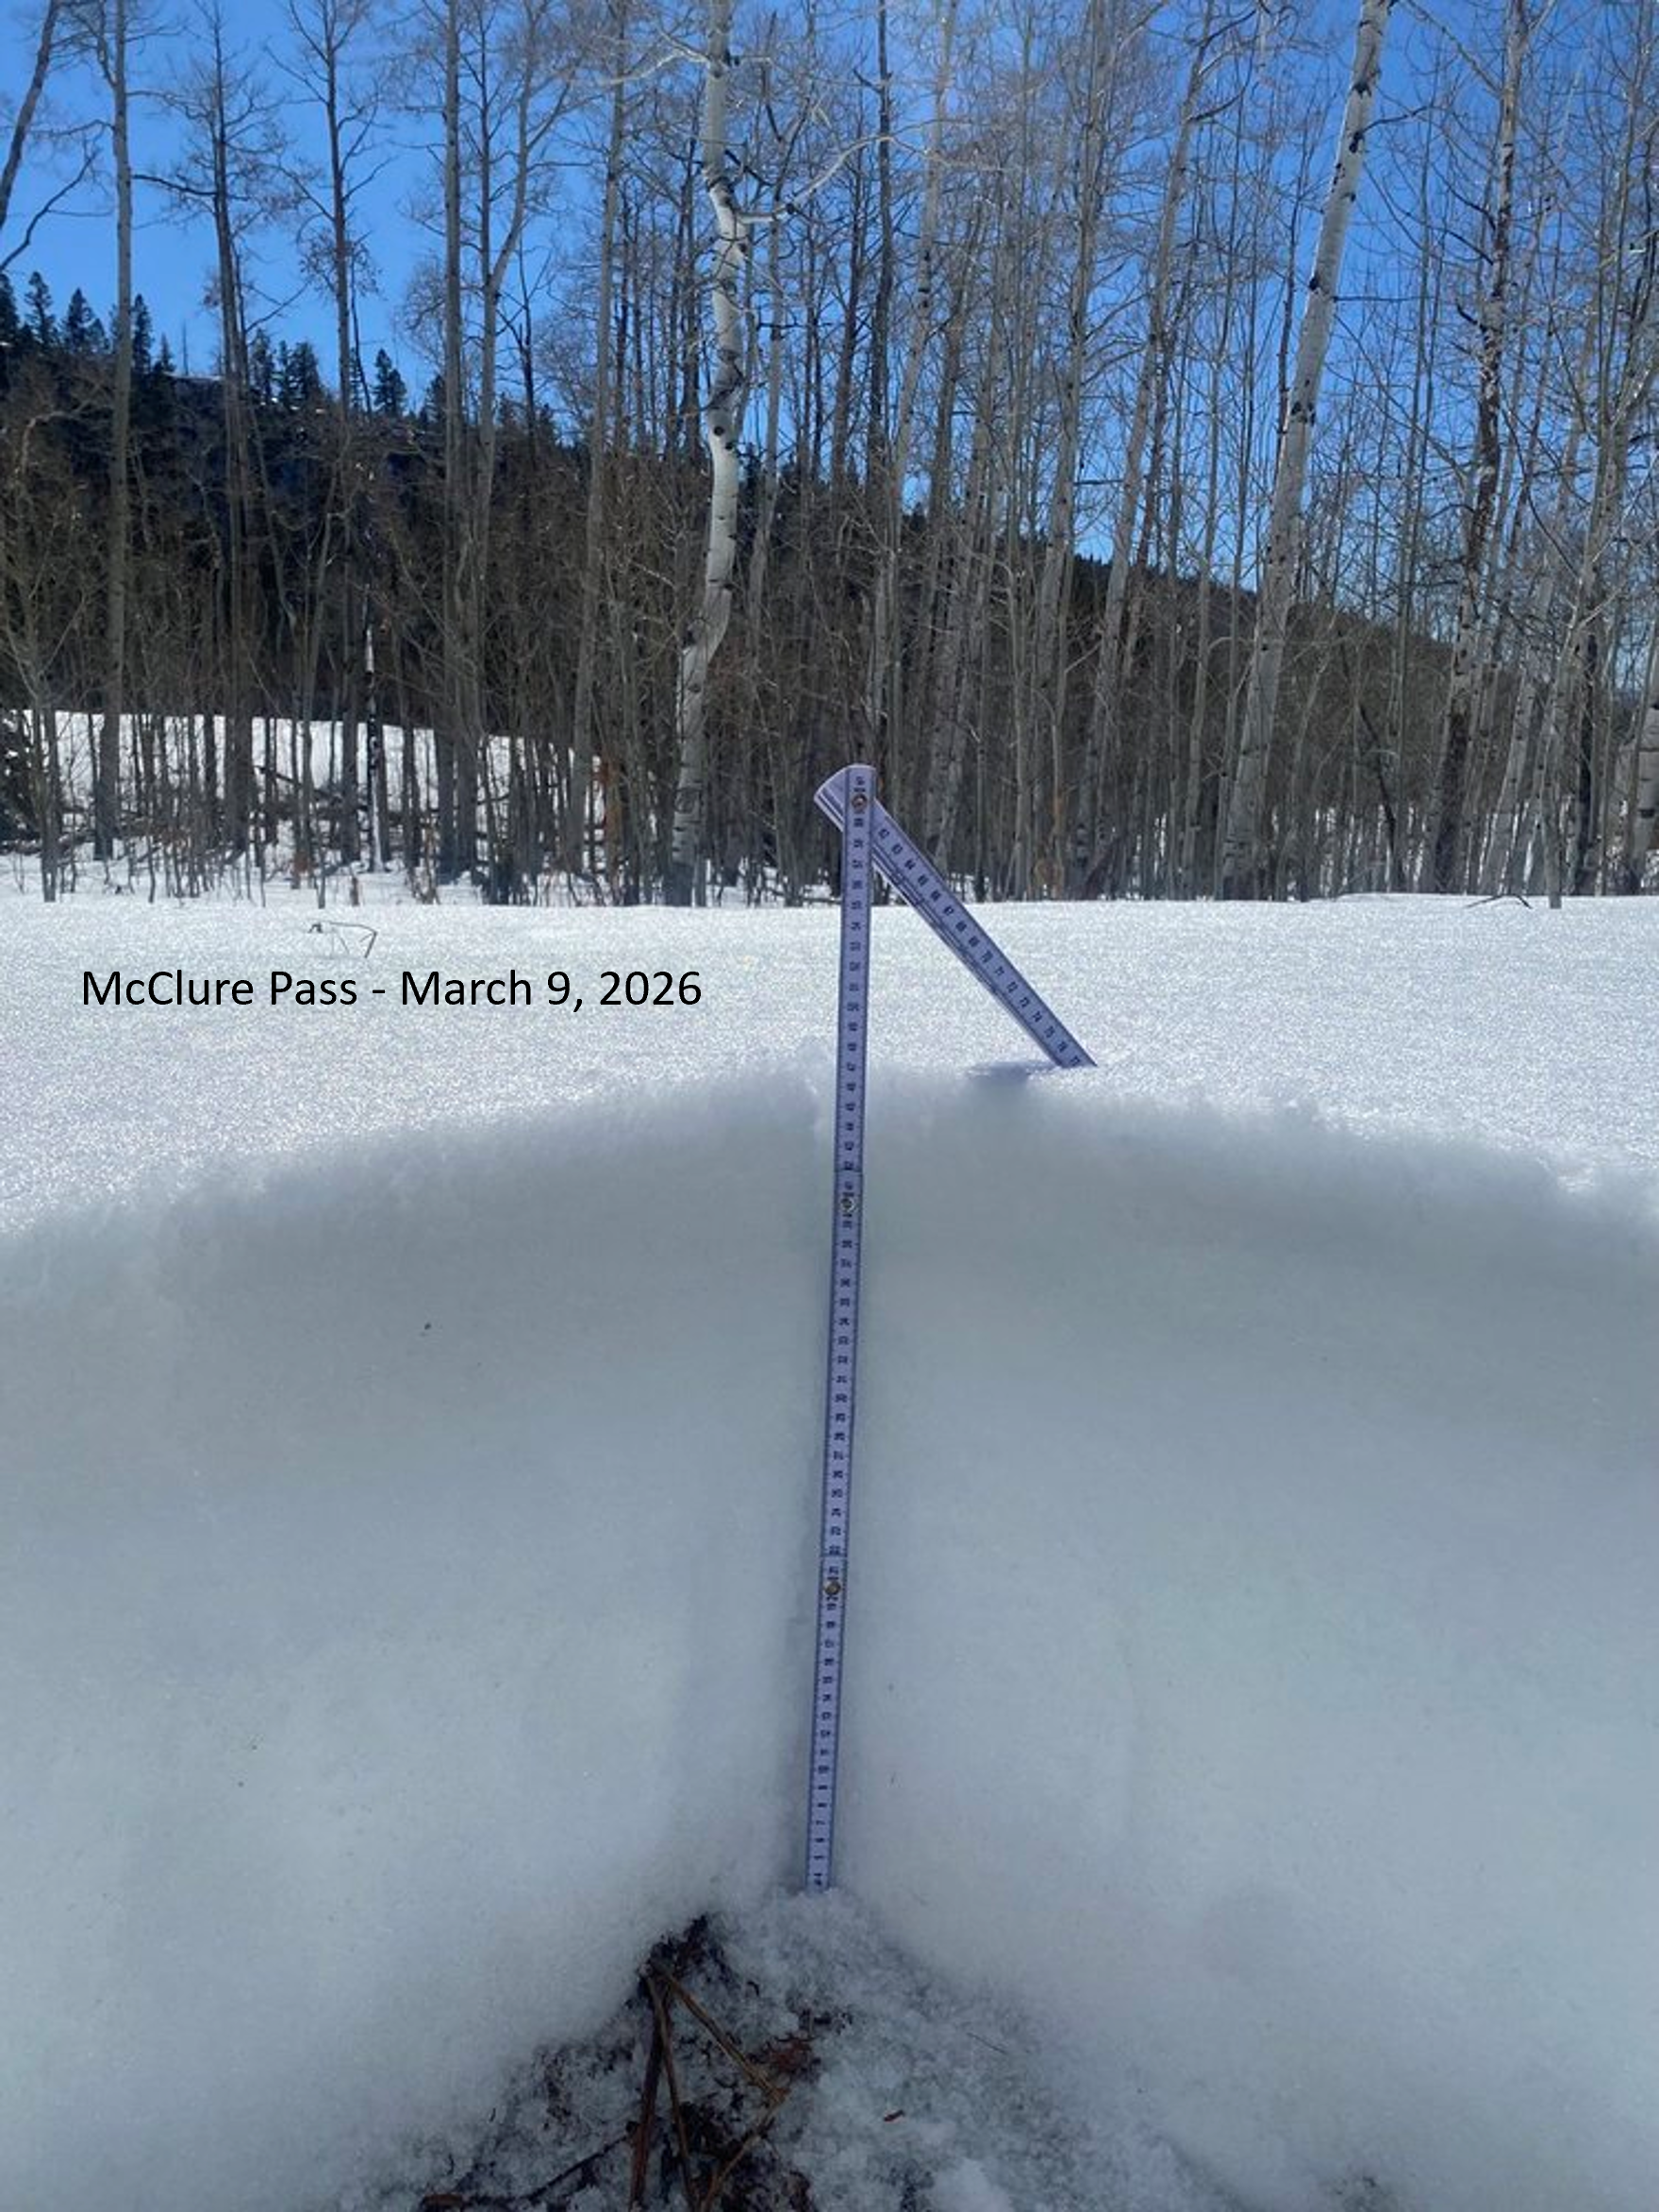
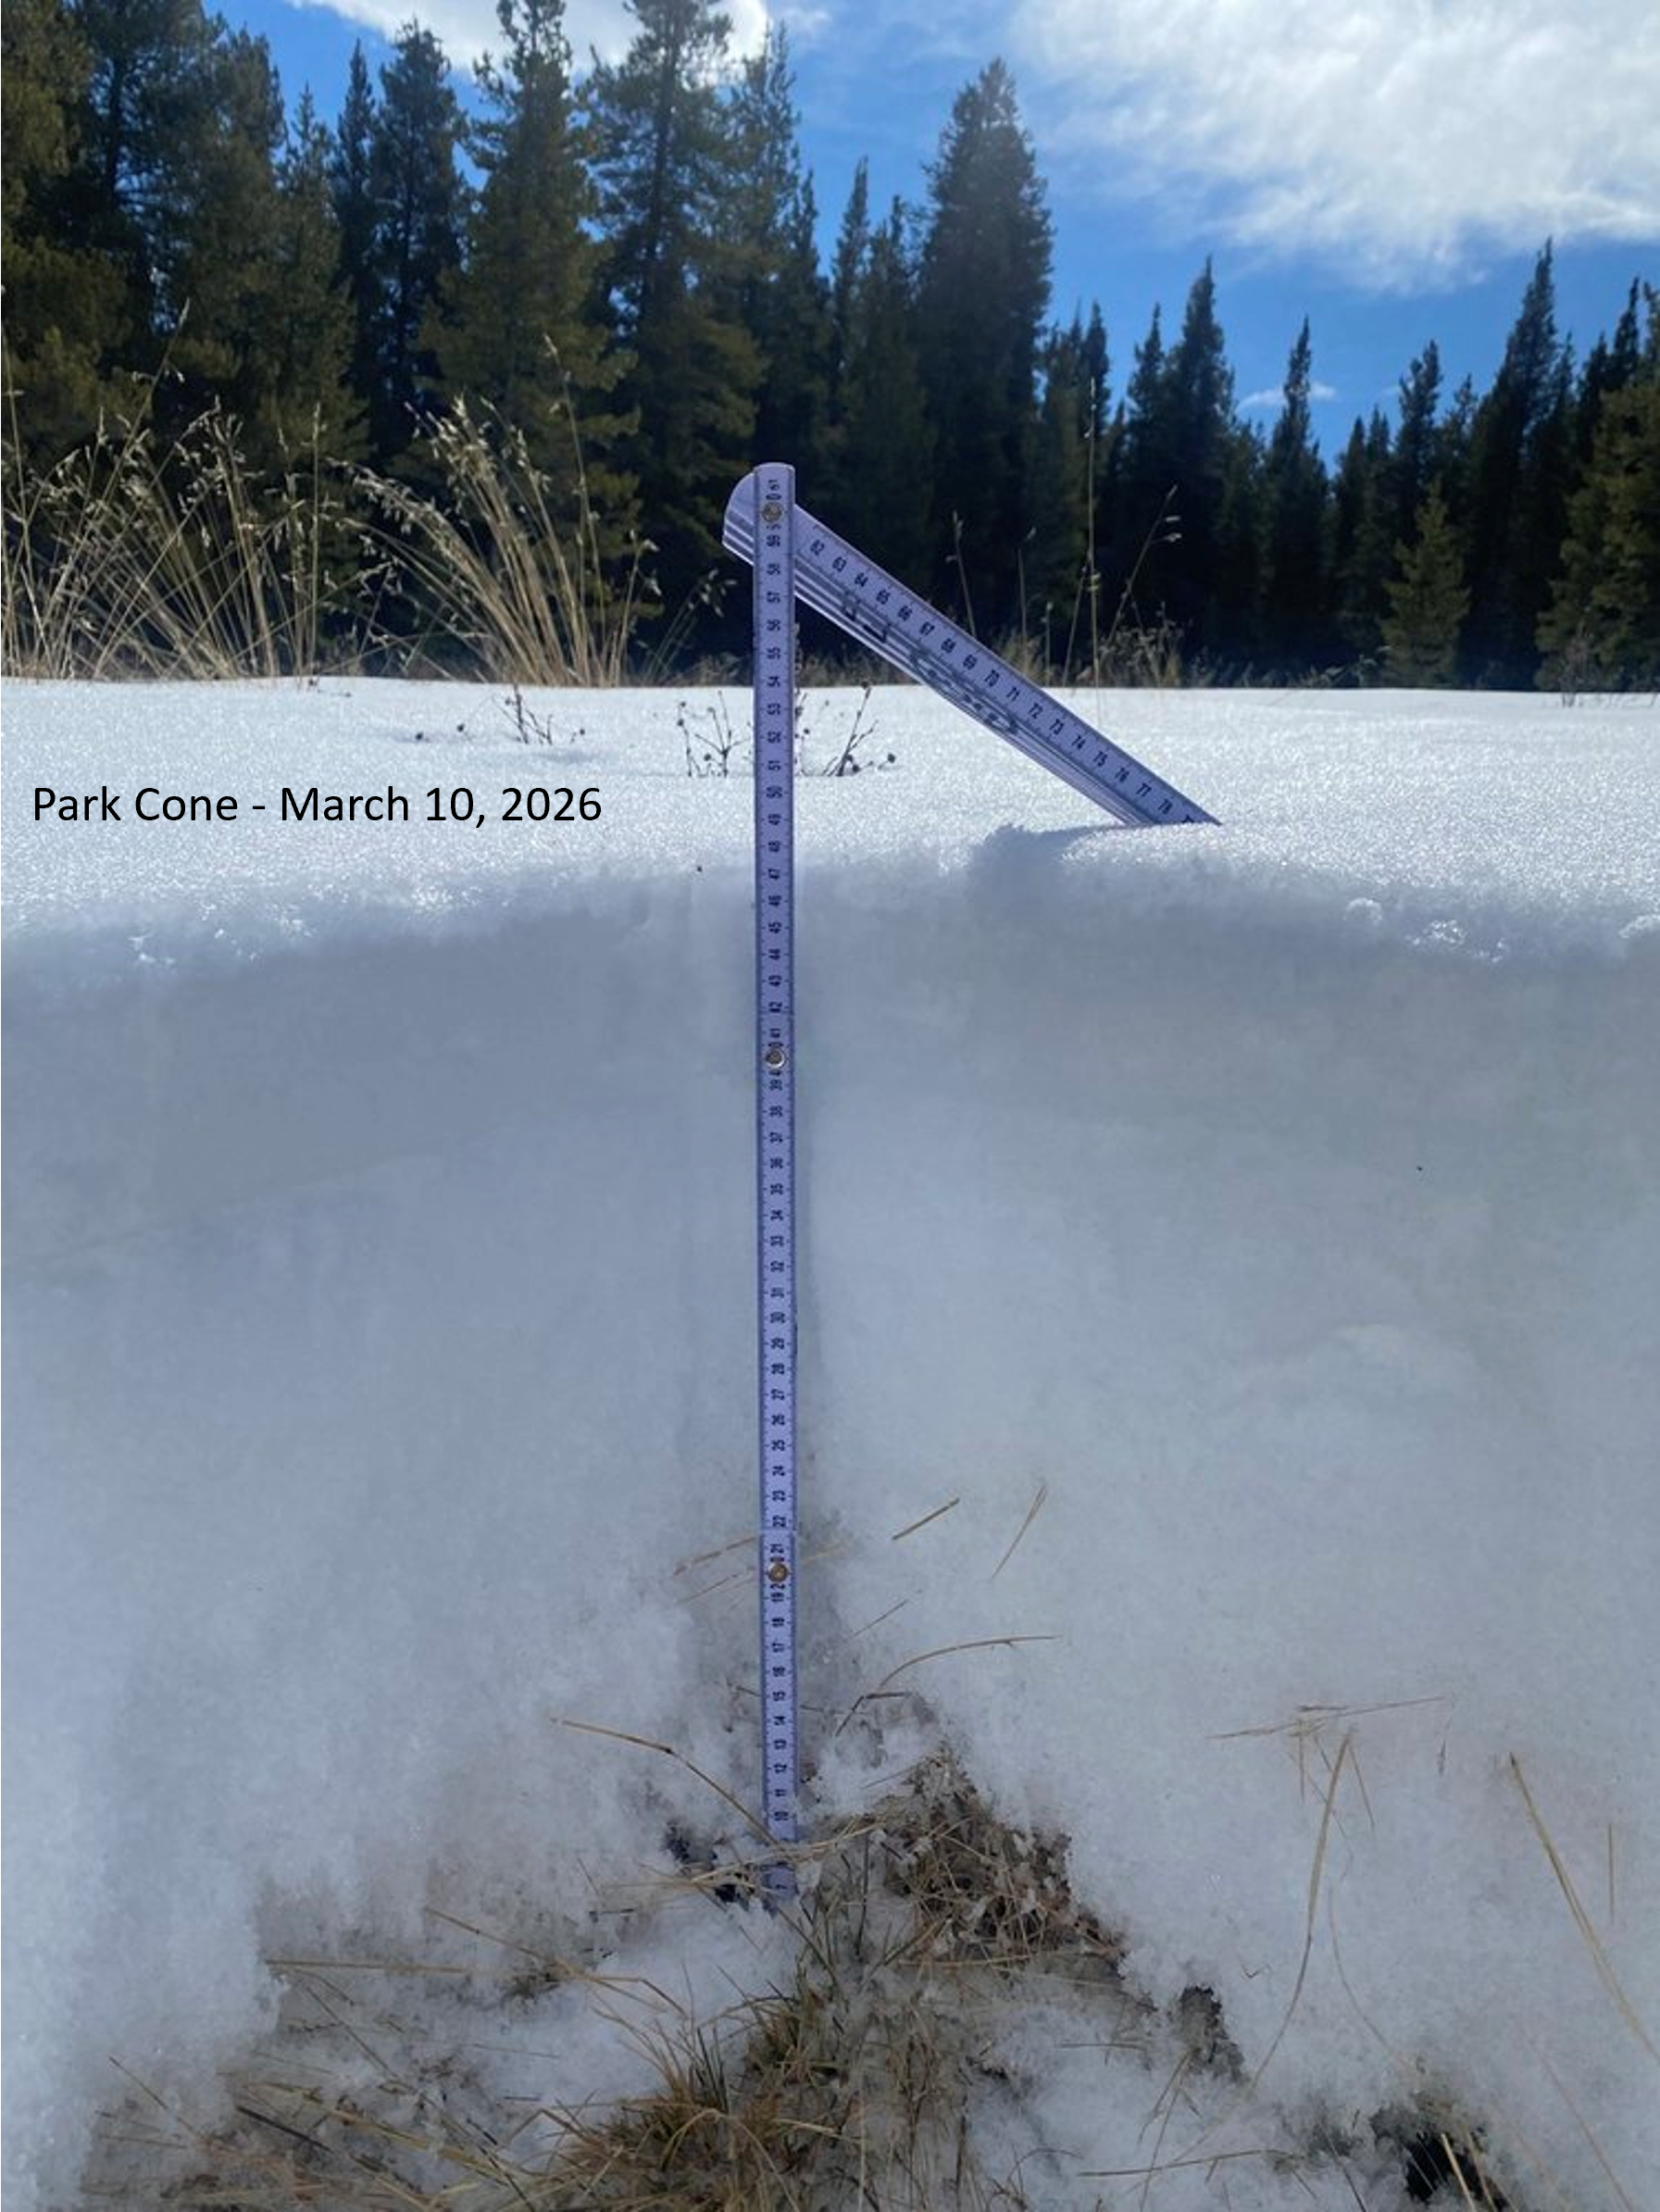
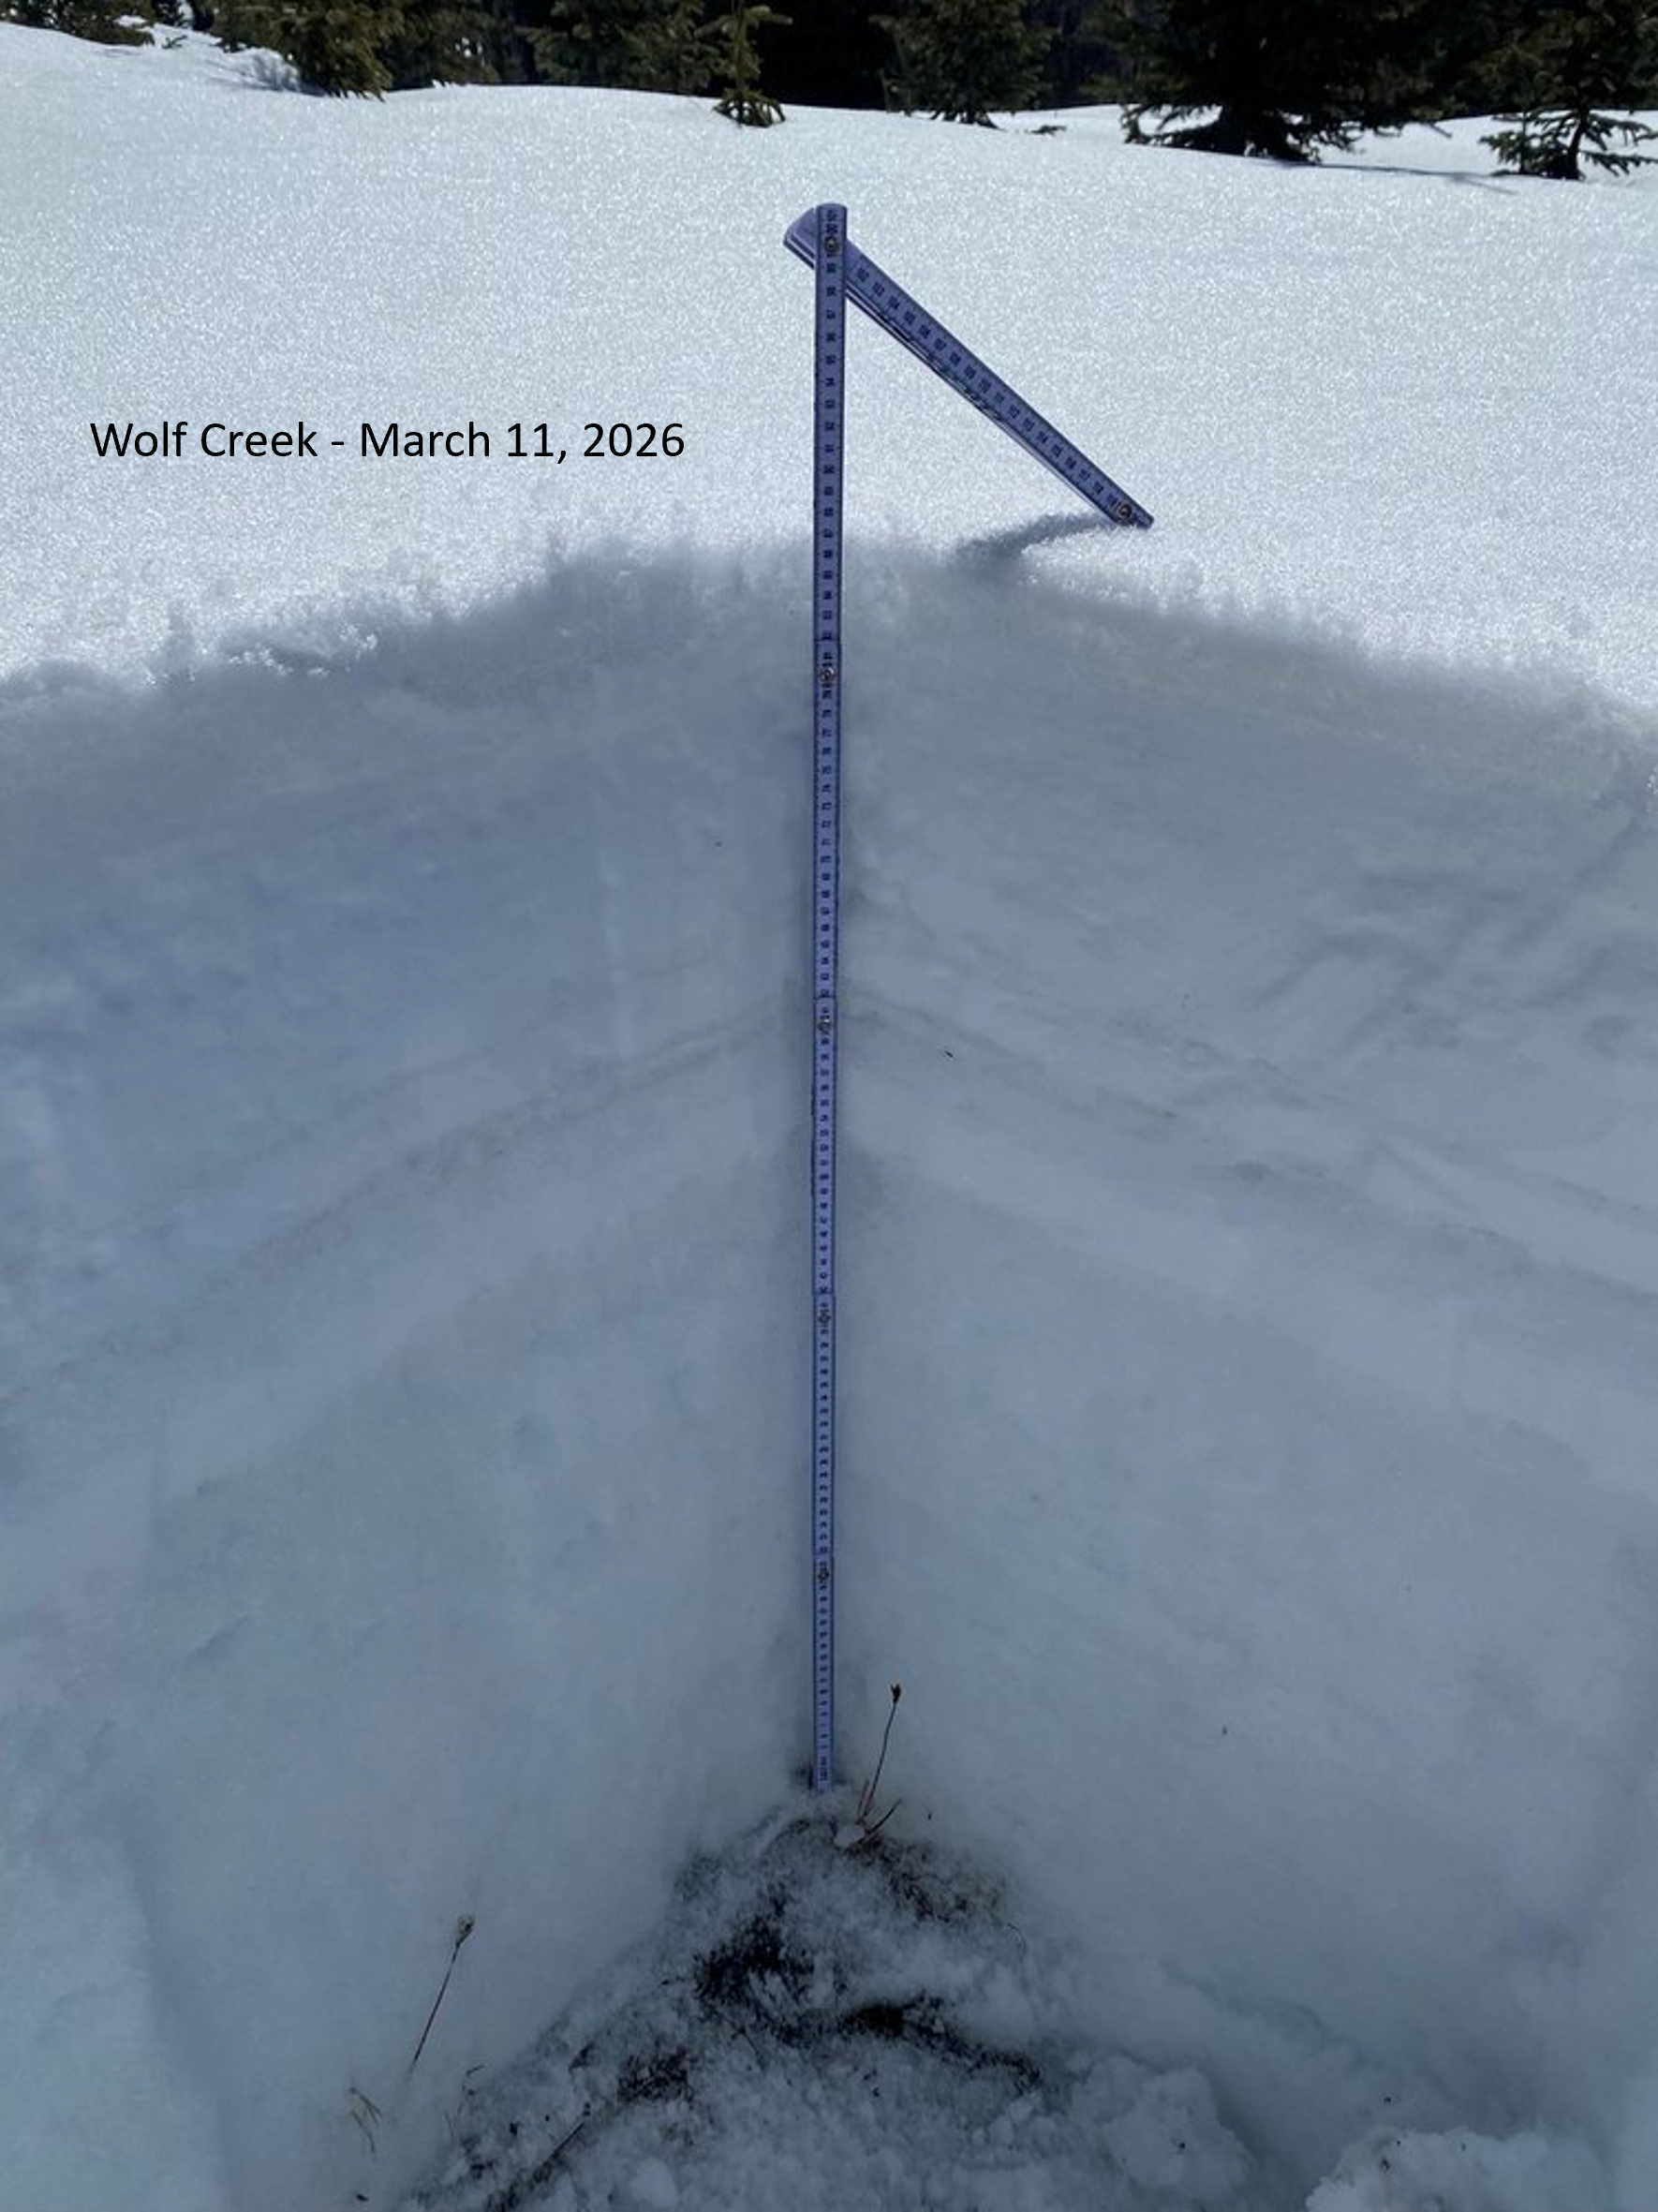
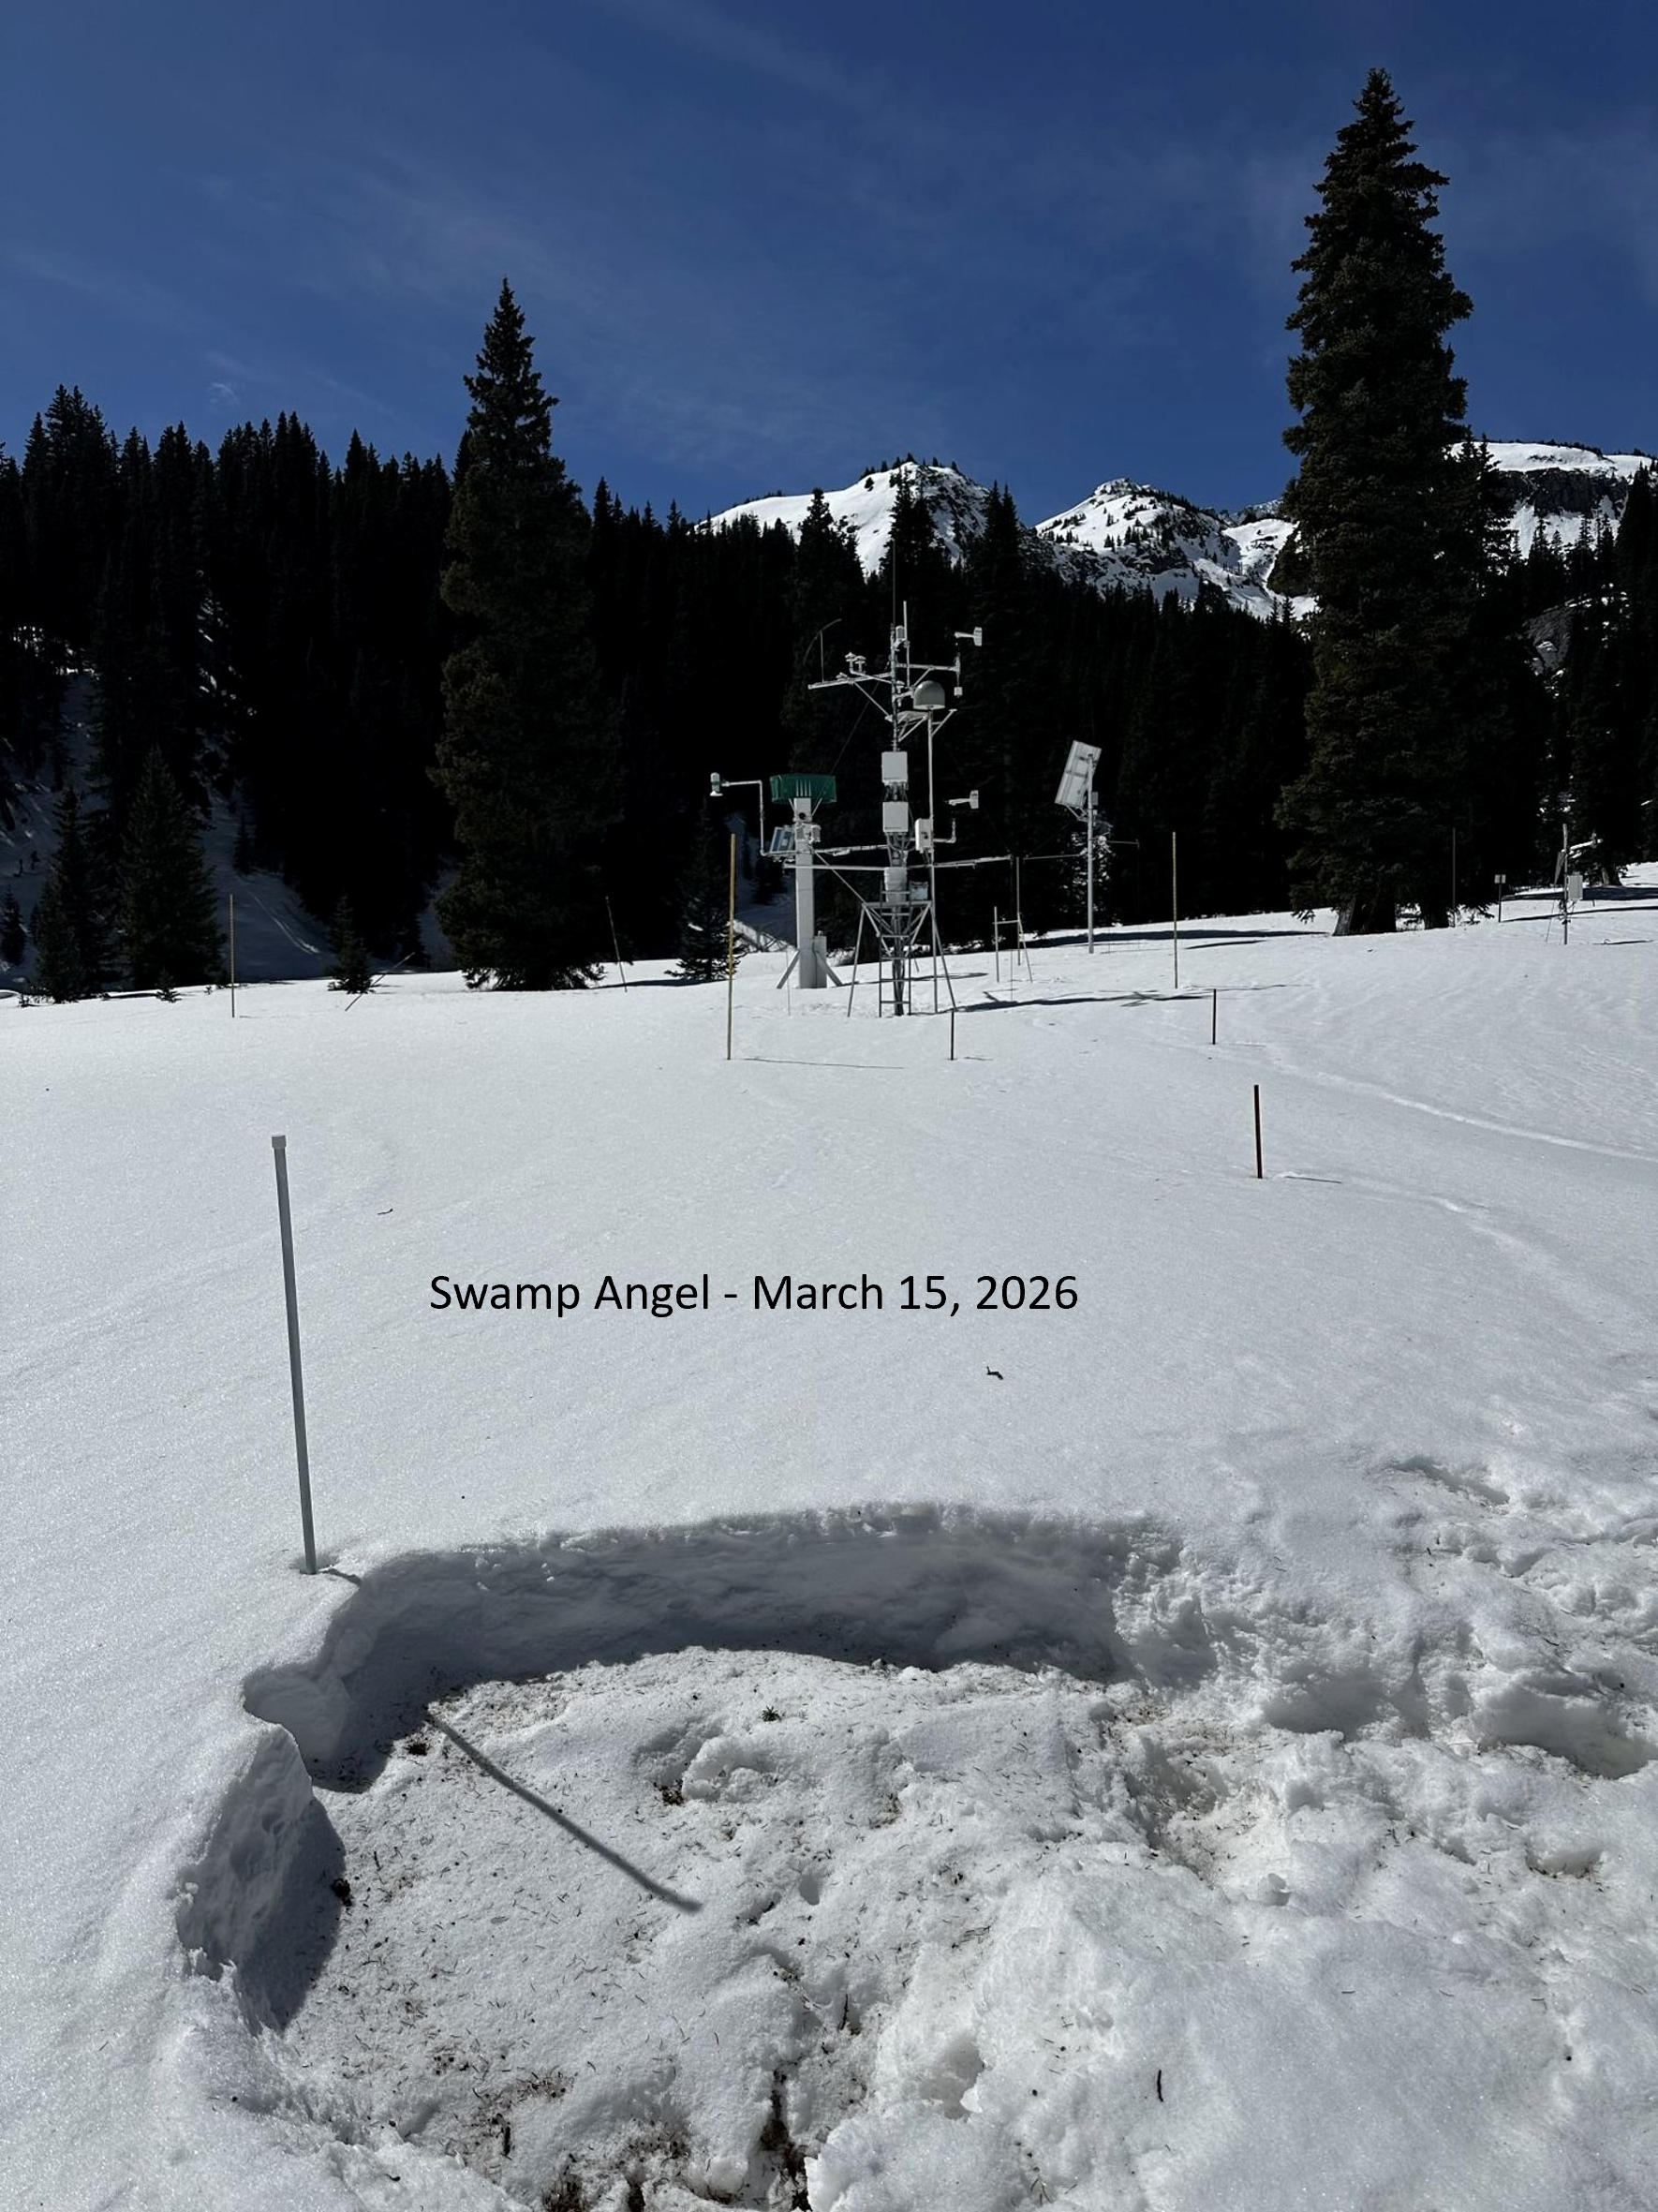
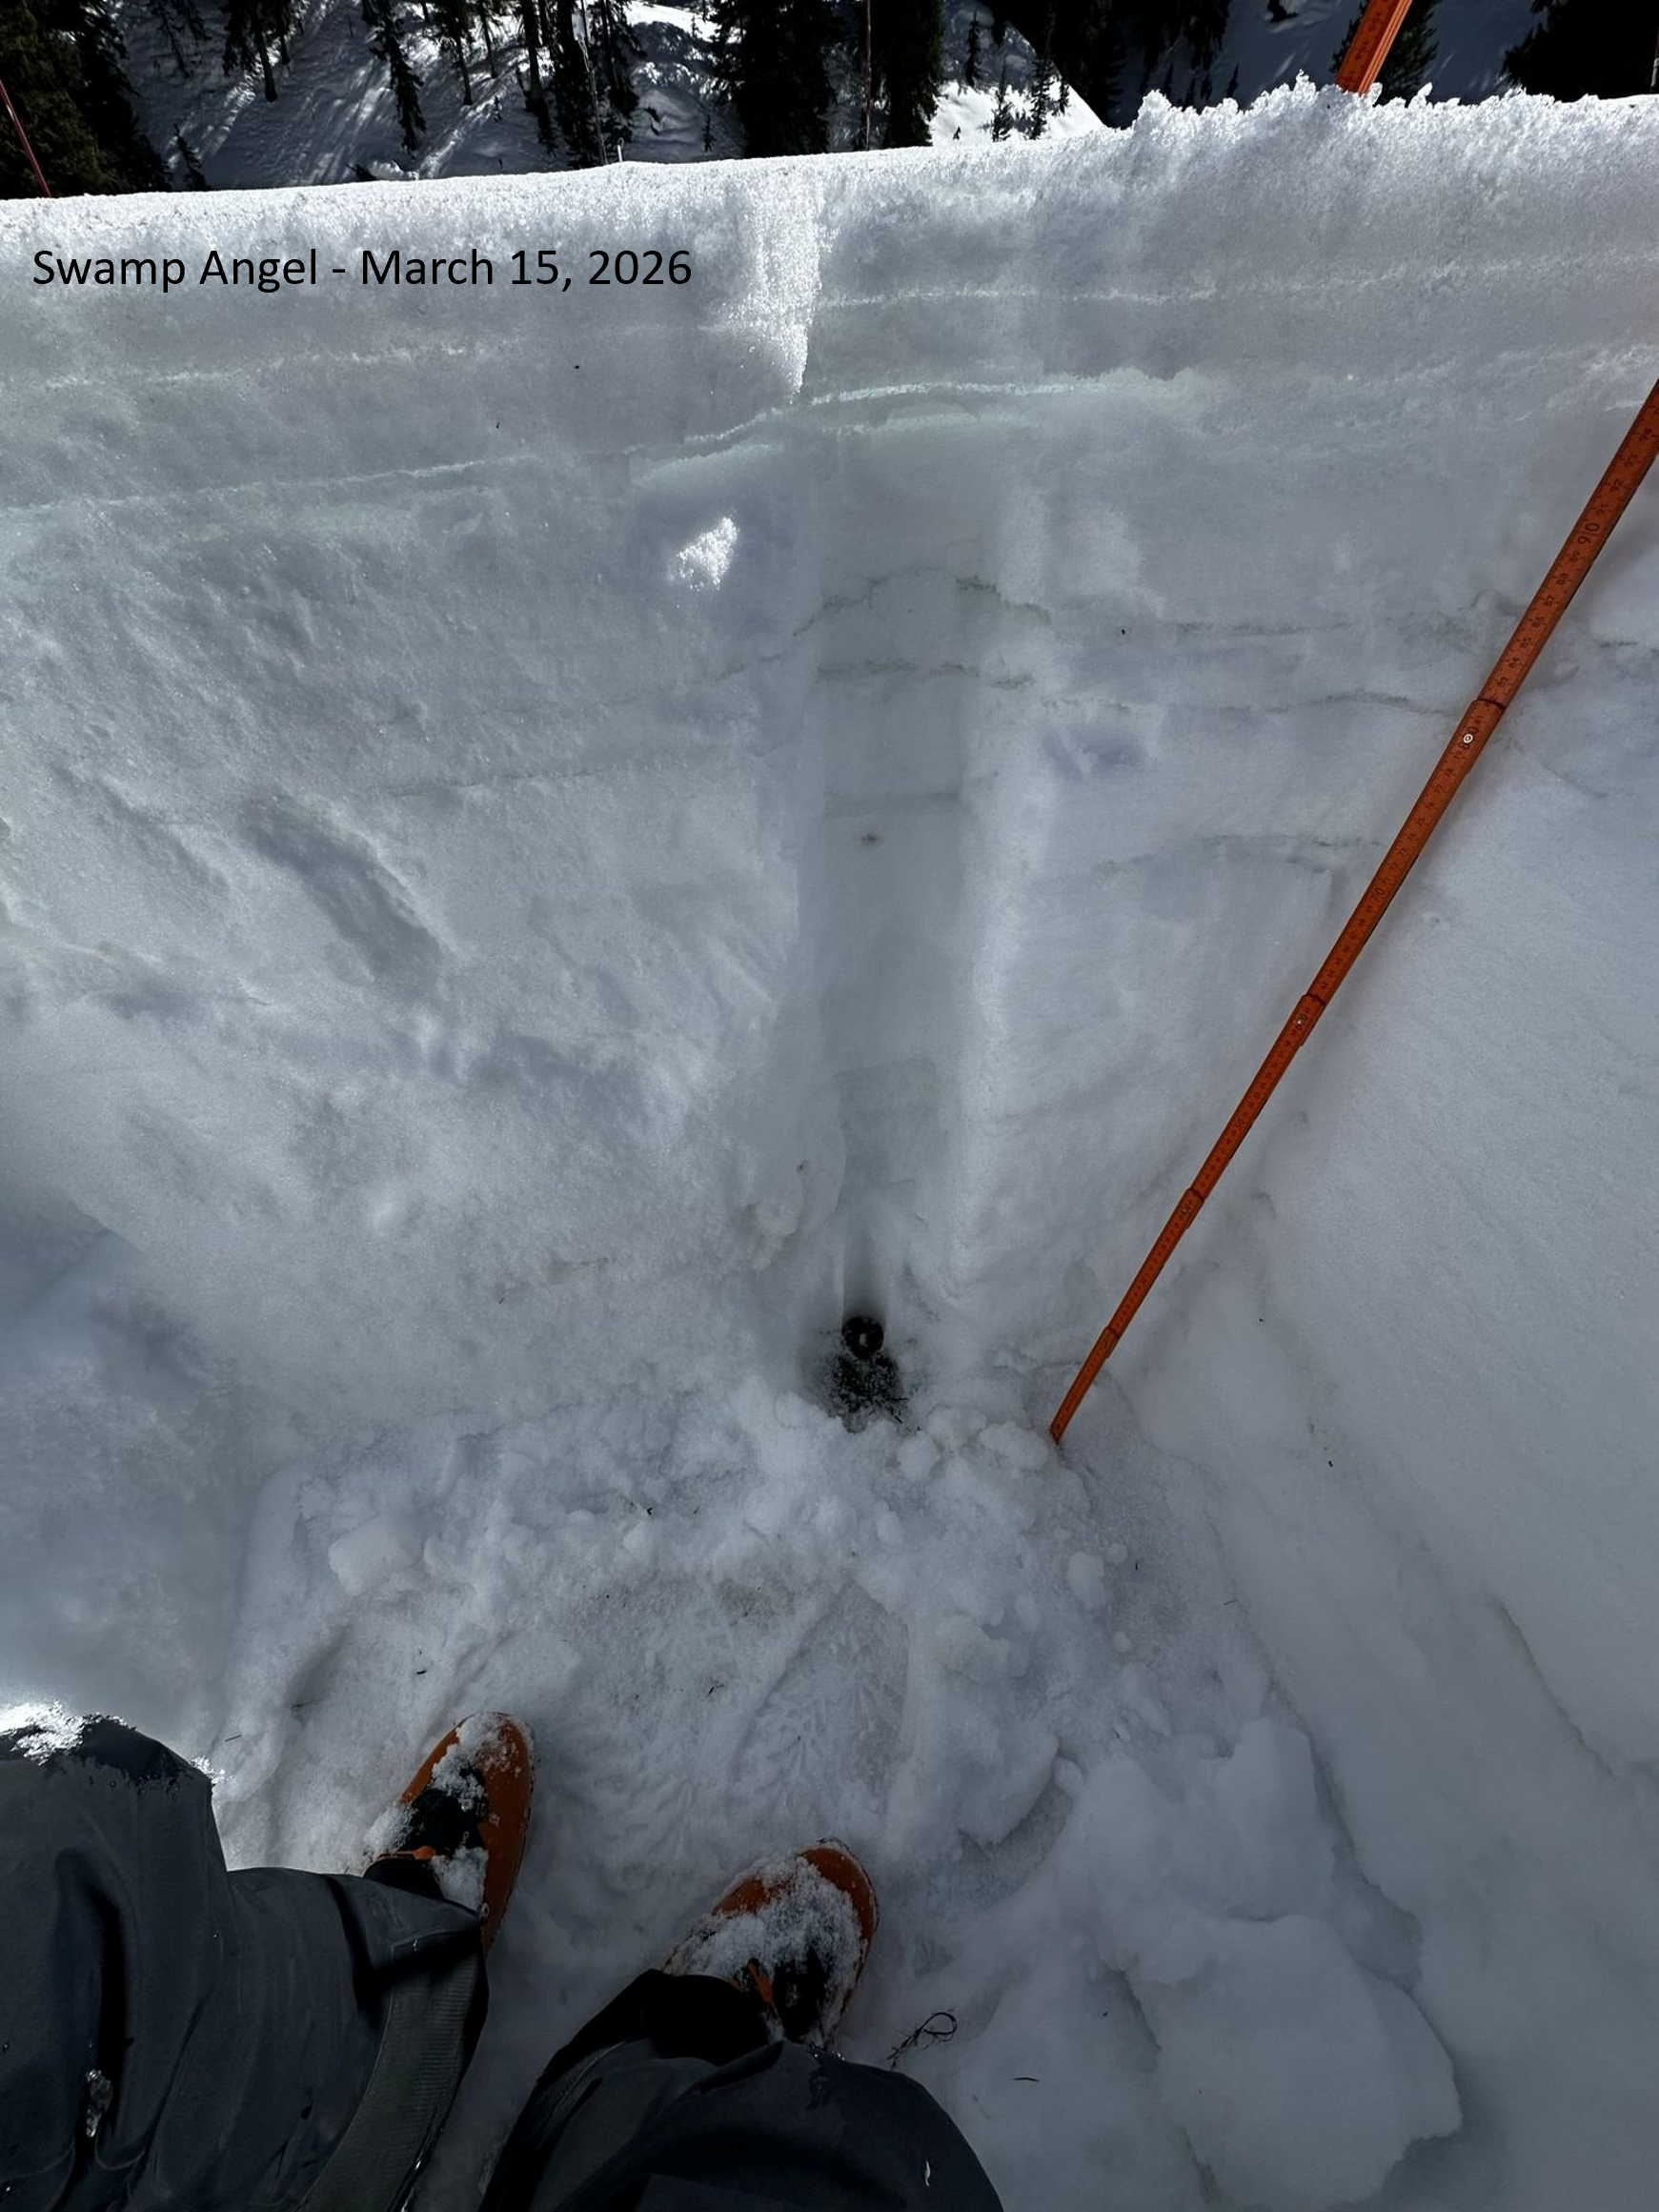
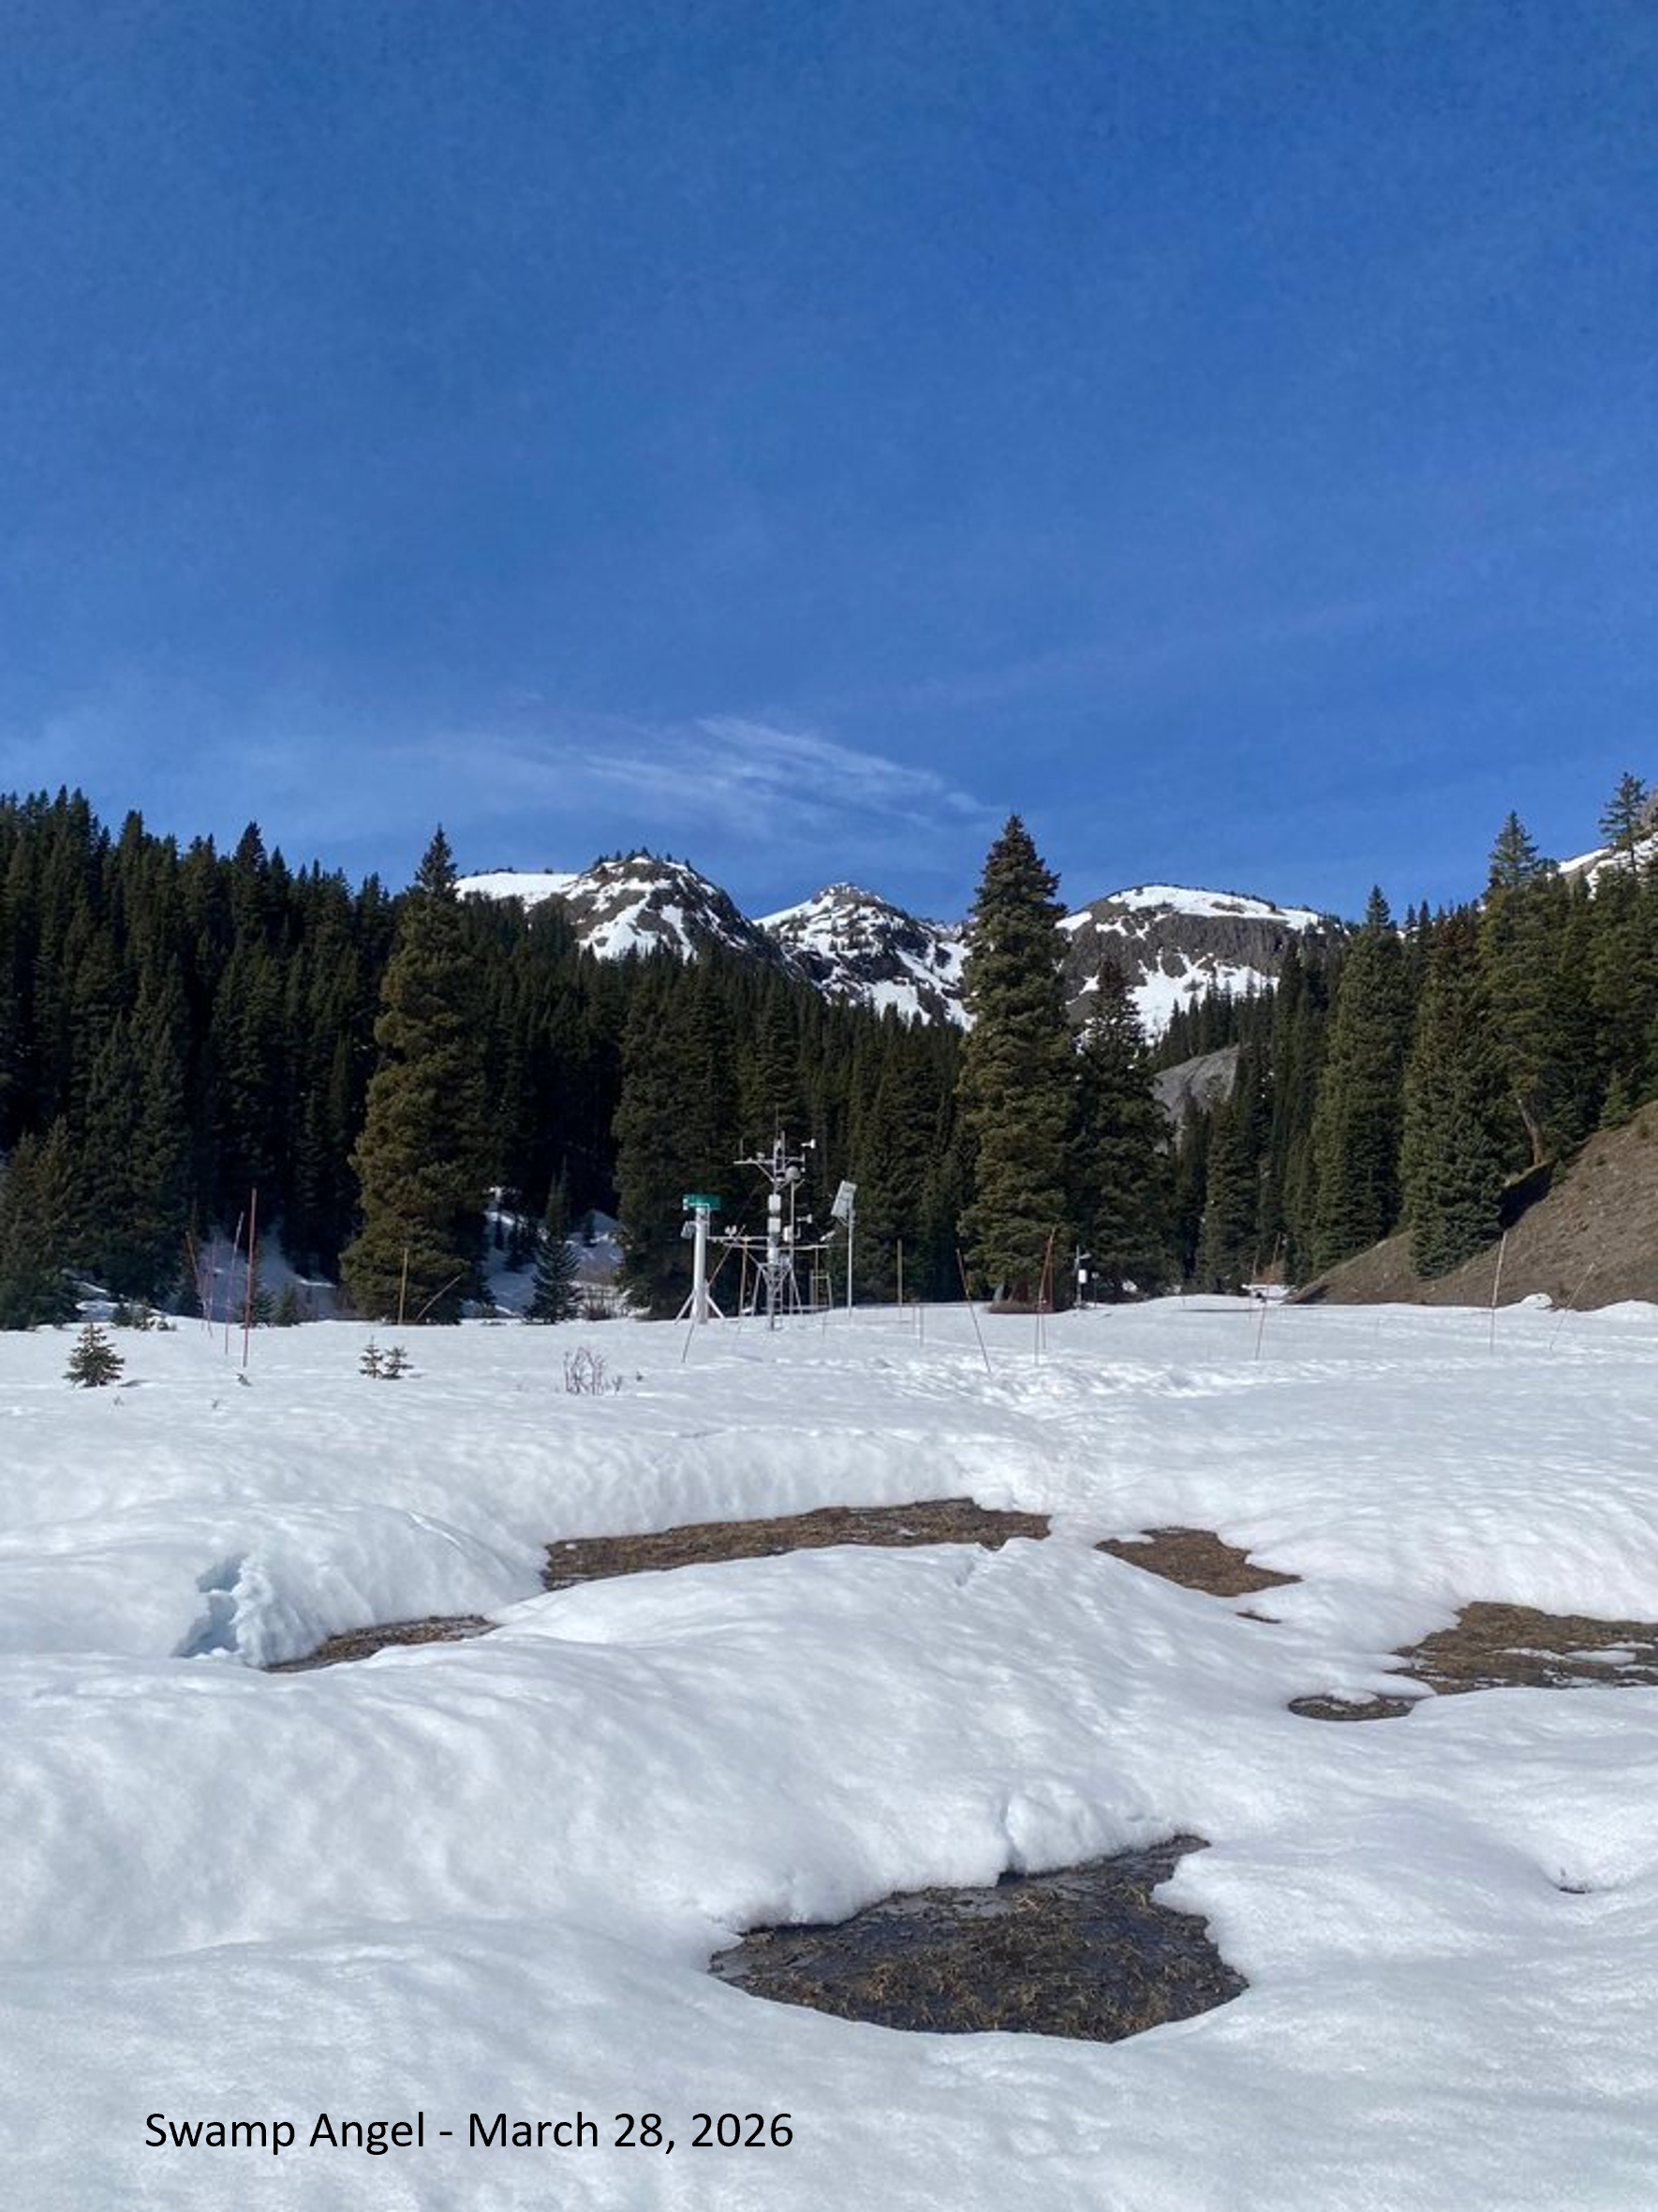
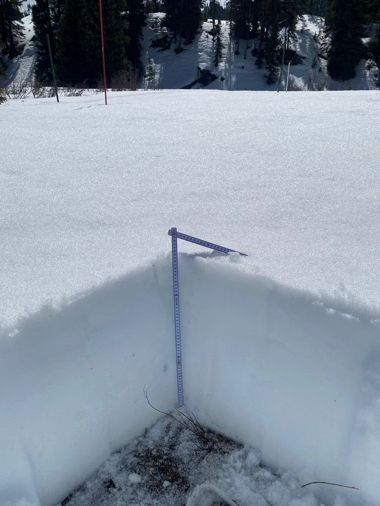
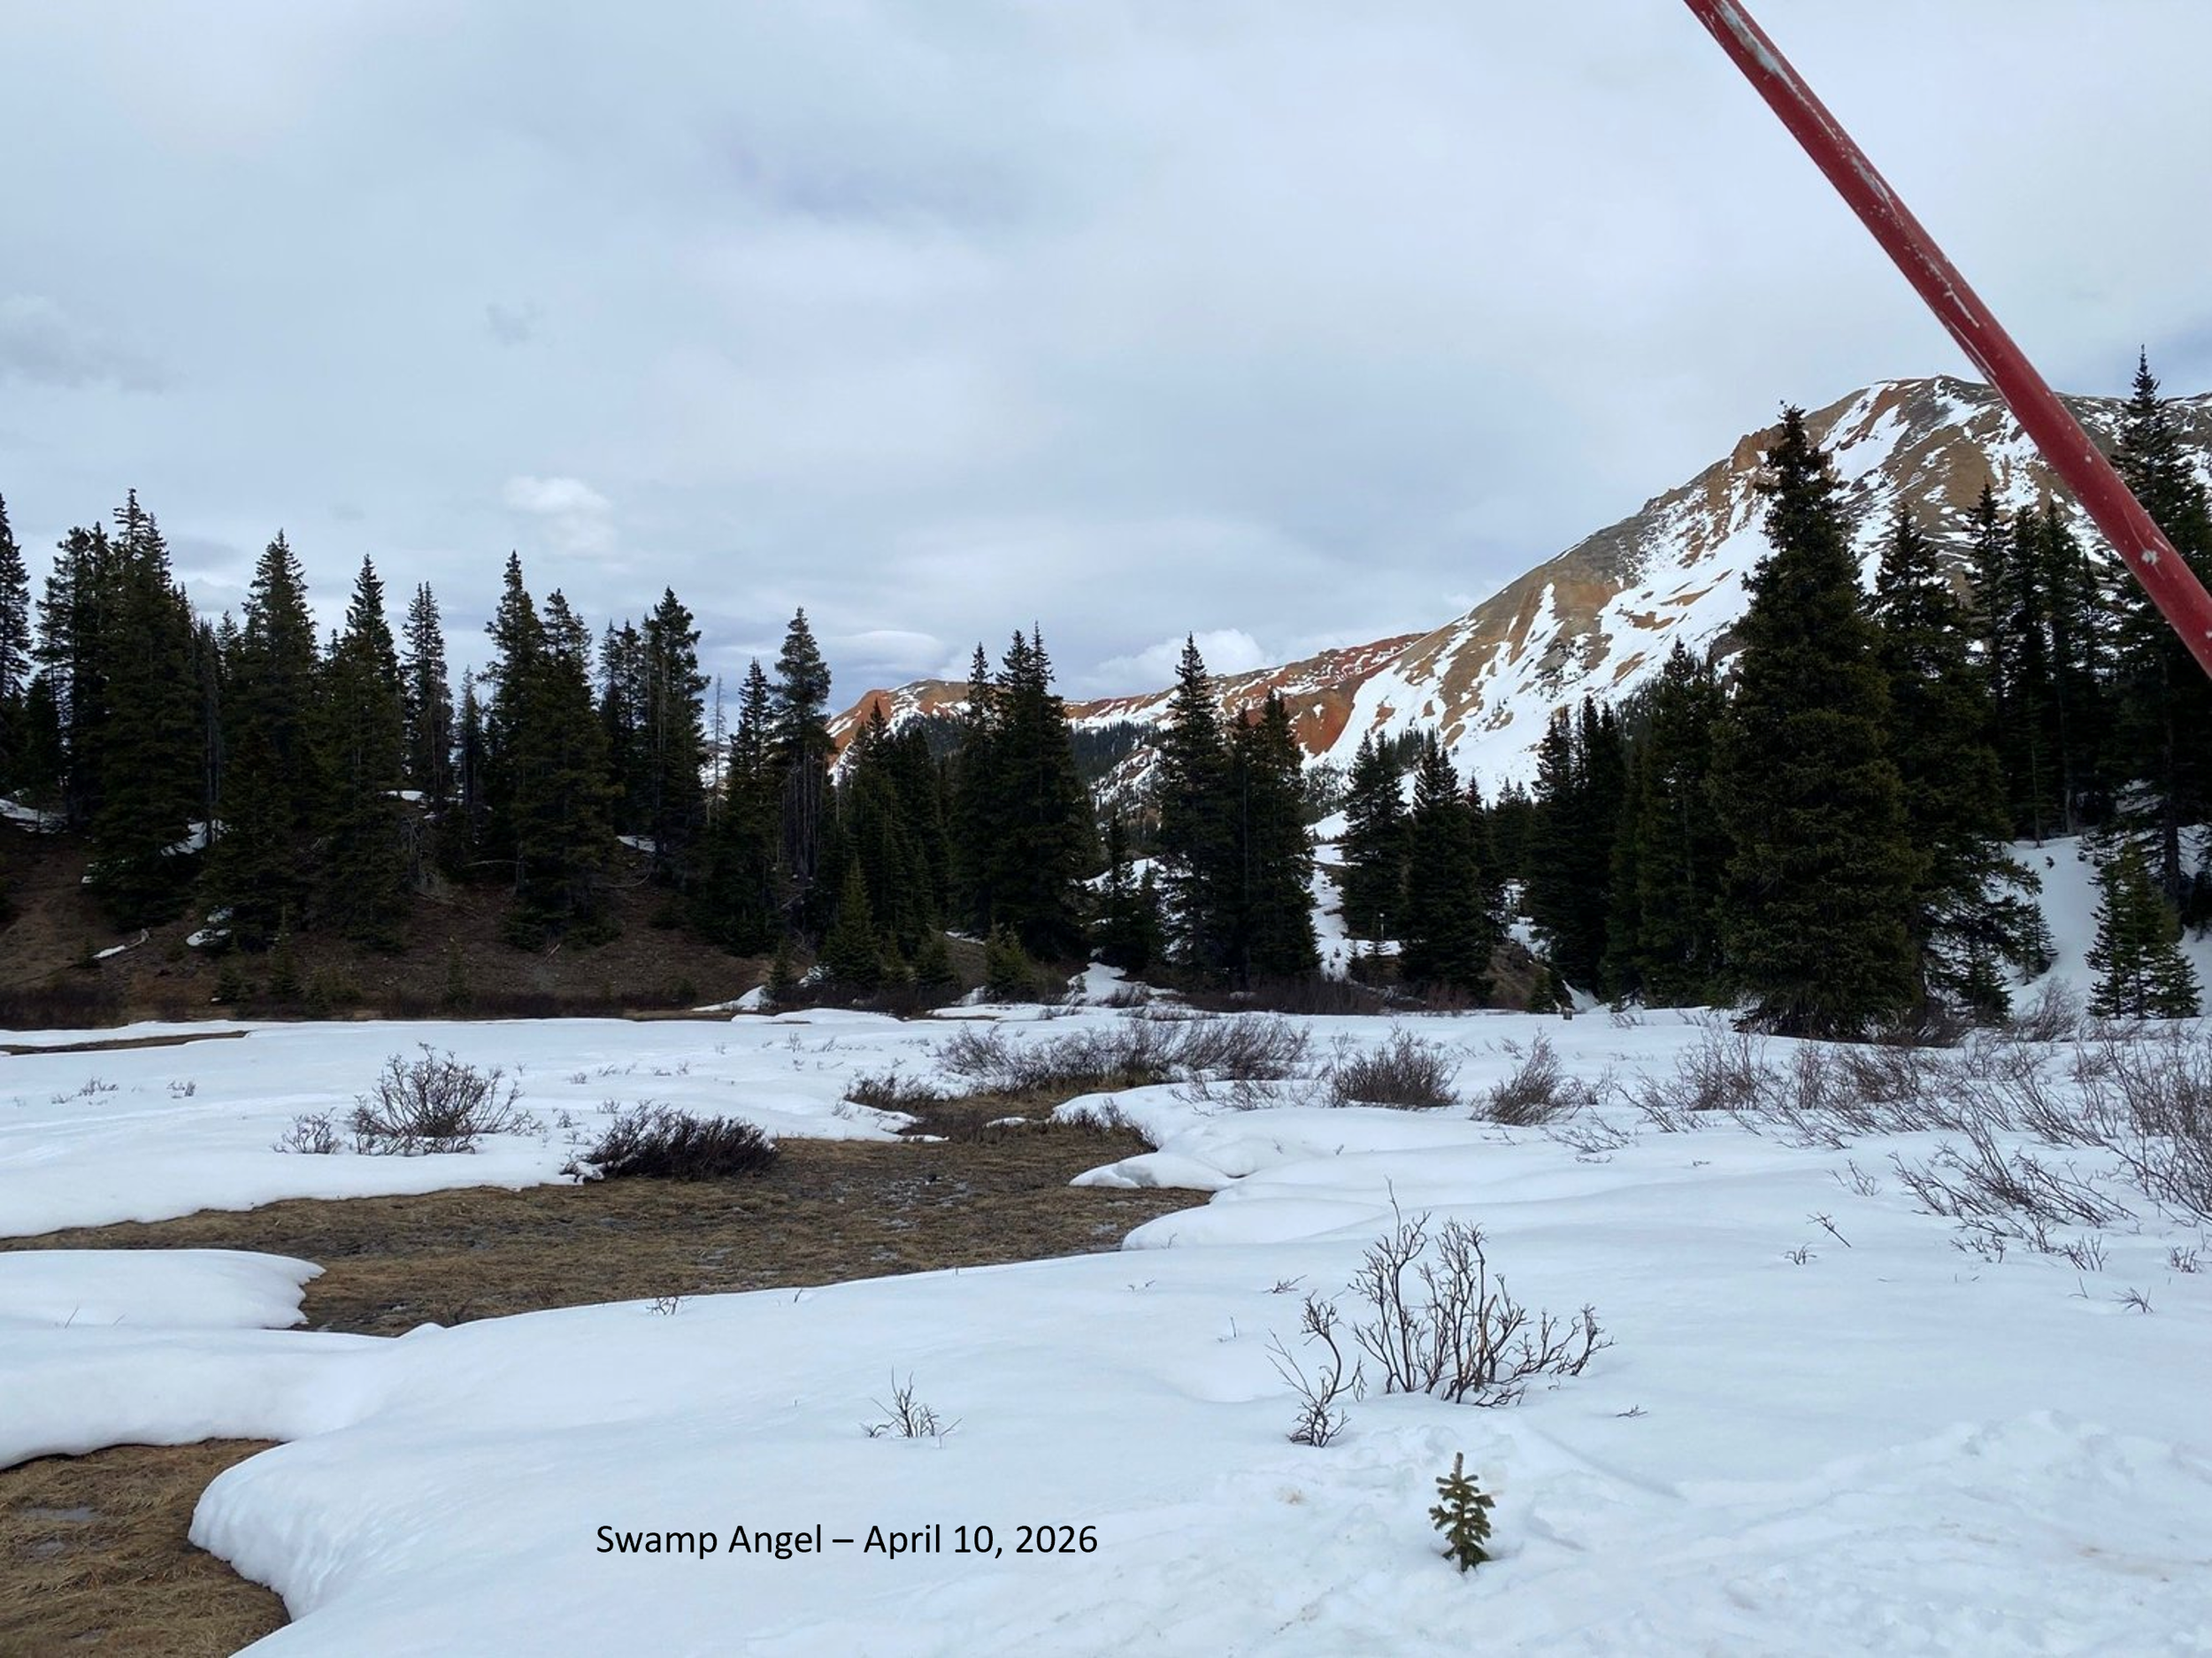
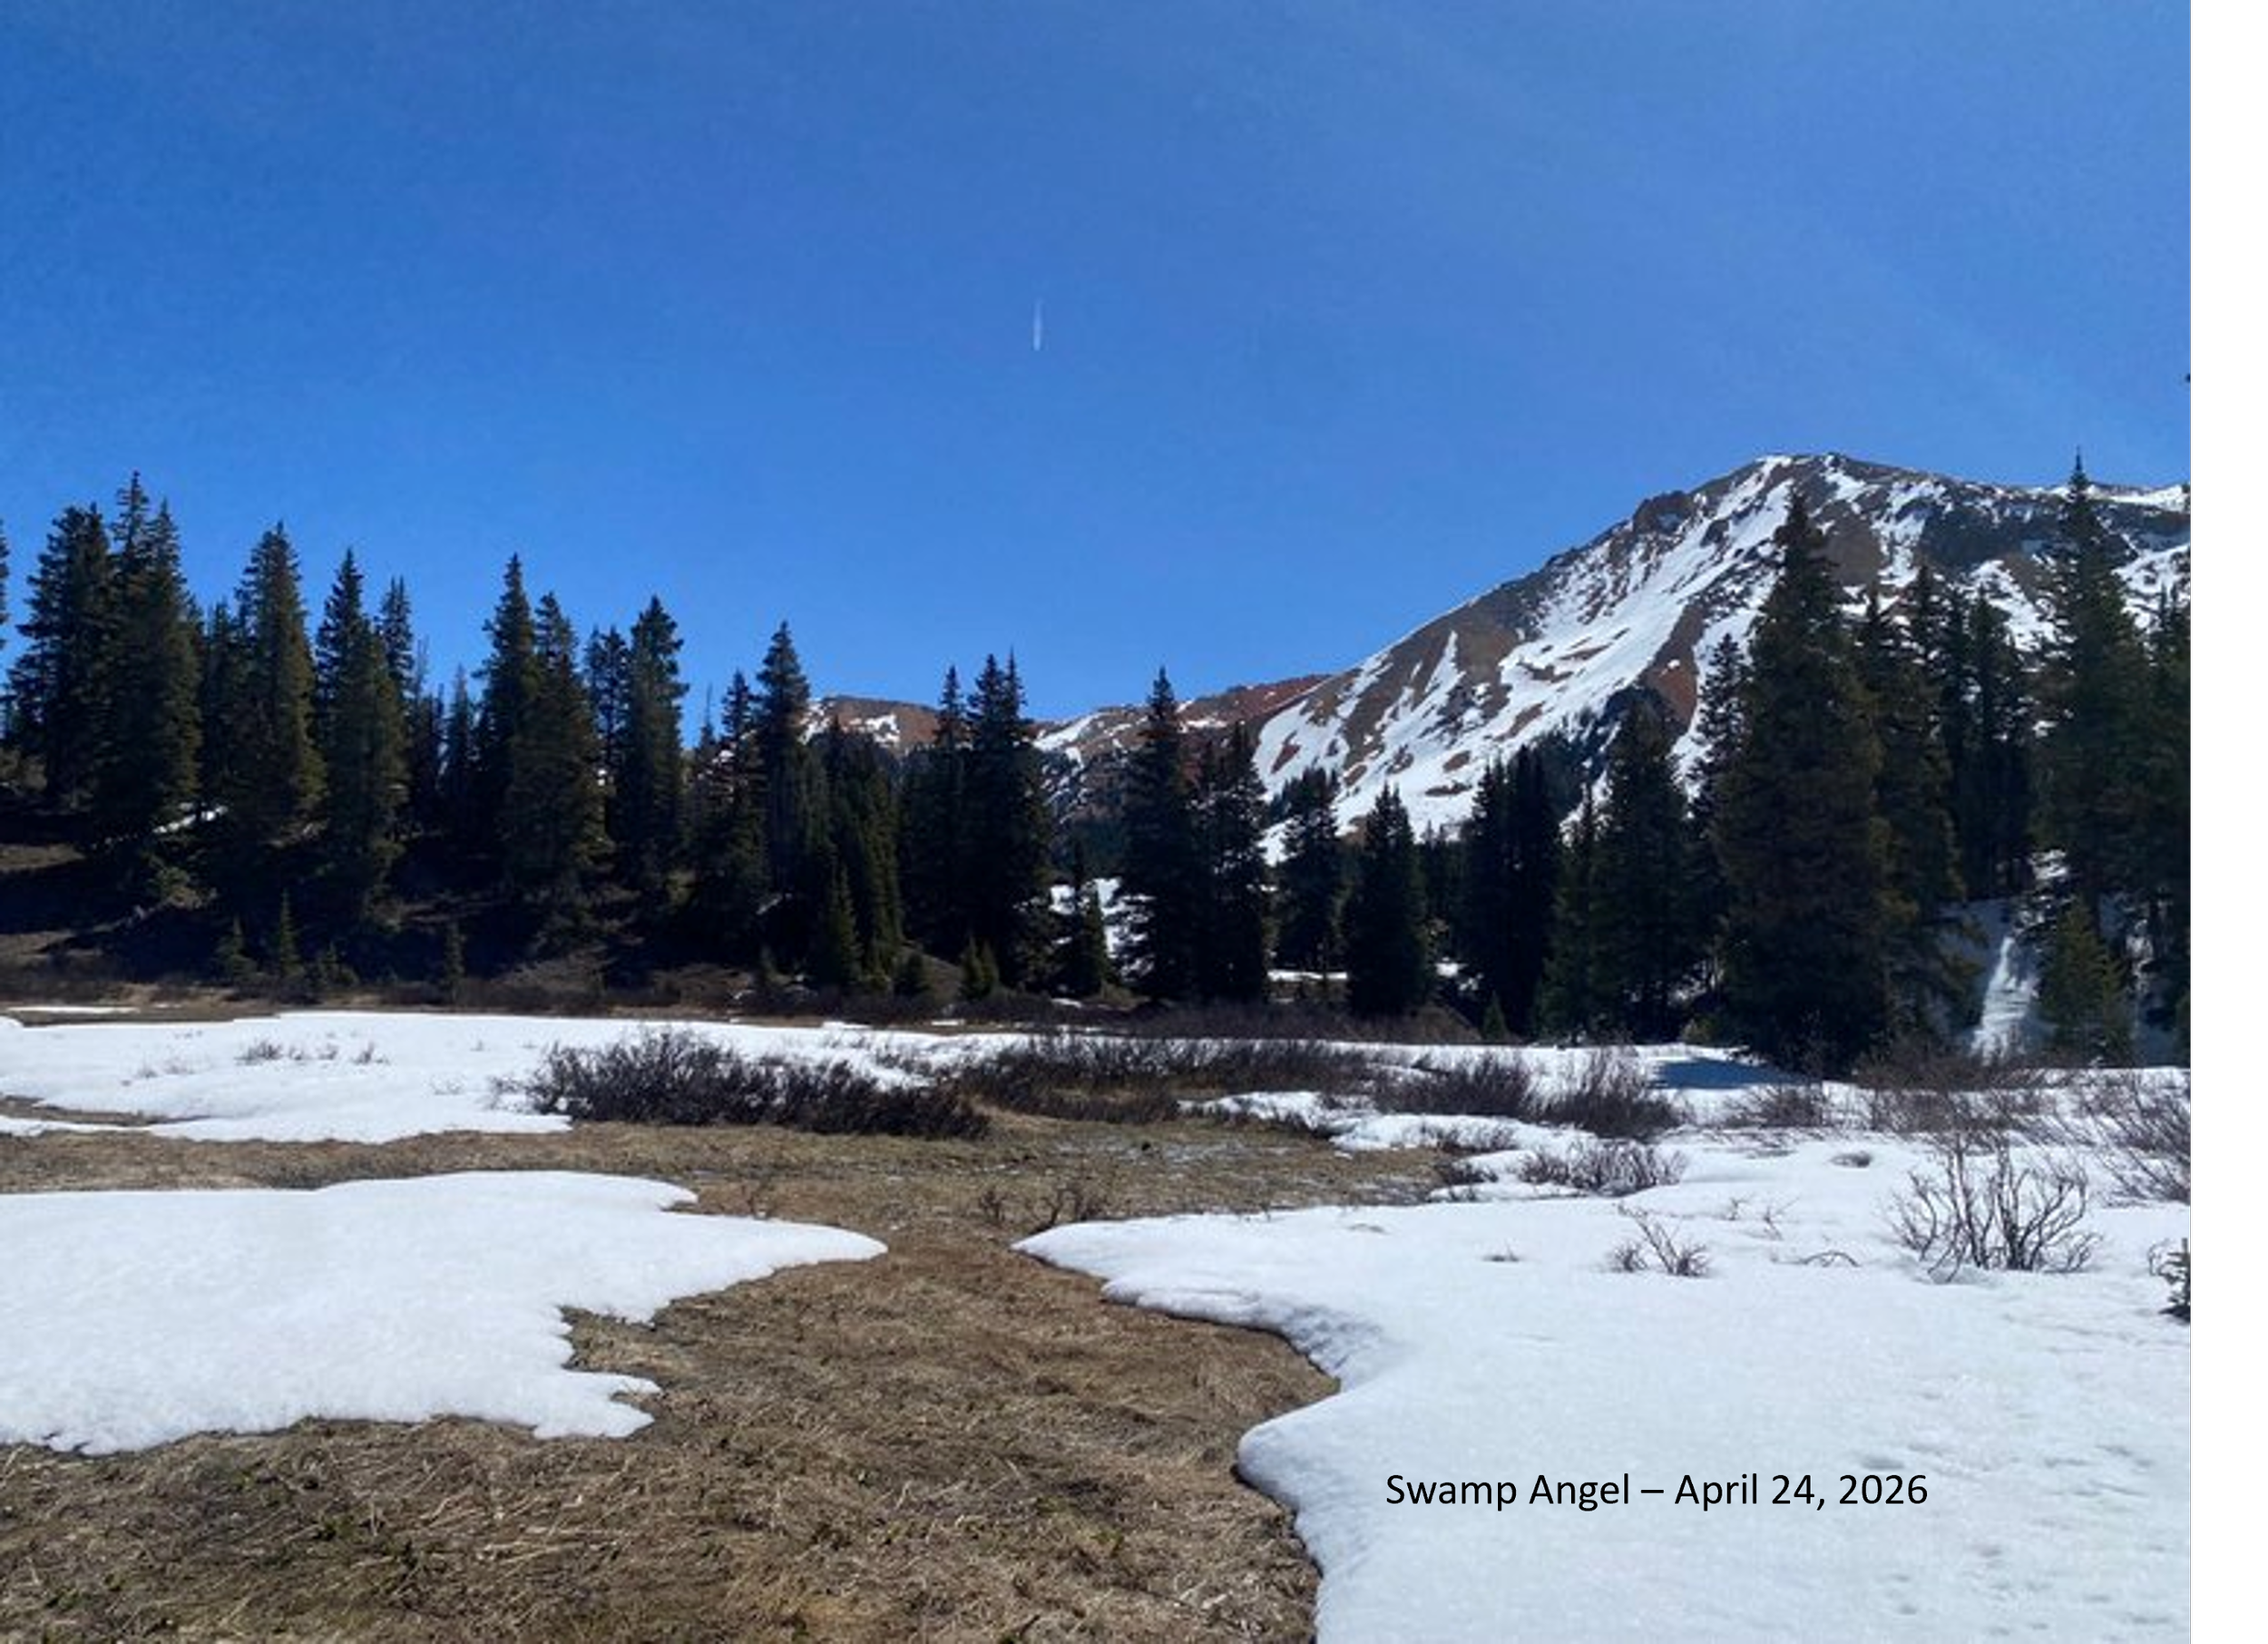
Below: Images of the WY2026 snowpack. For most areas peak SWE was around the first of March thru mid-March. So most pictures are showing a peak snowpack.
Below: Soil moisture conditions going into winter for the last four years. The beginning of WY2026 soil moisture was better in the southern part of the UCRB than the previous year in general due to the record heavy rain in October. Healthy soil moisture conditions generally improve the likelihood of more efficient snowmelt runoff.


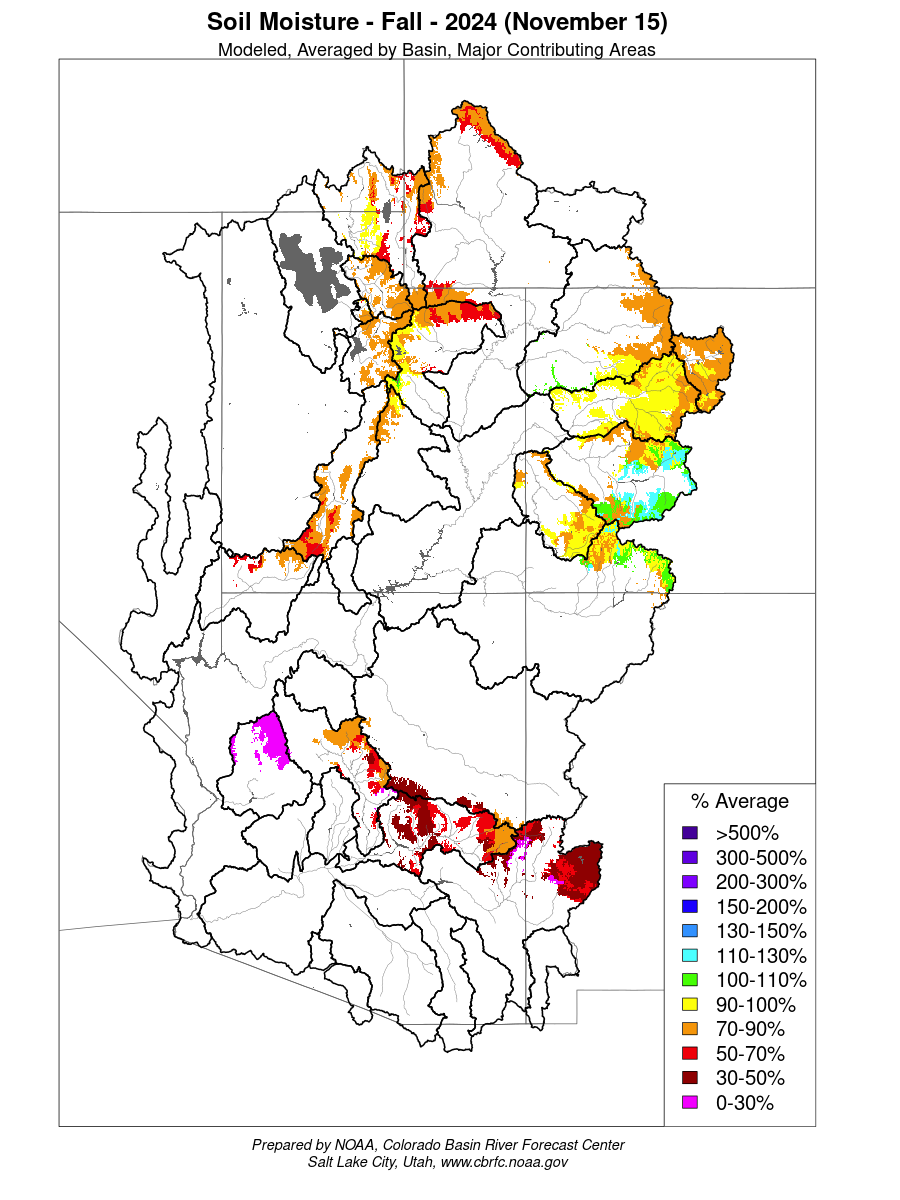
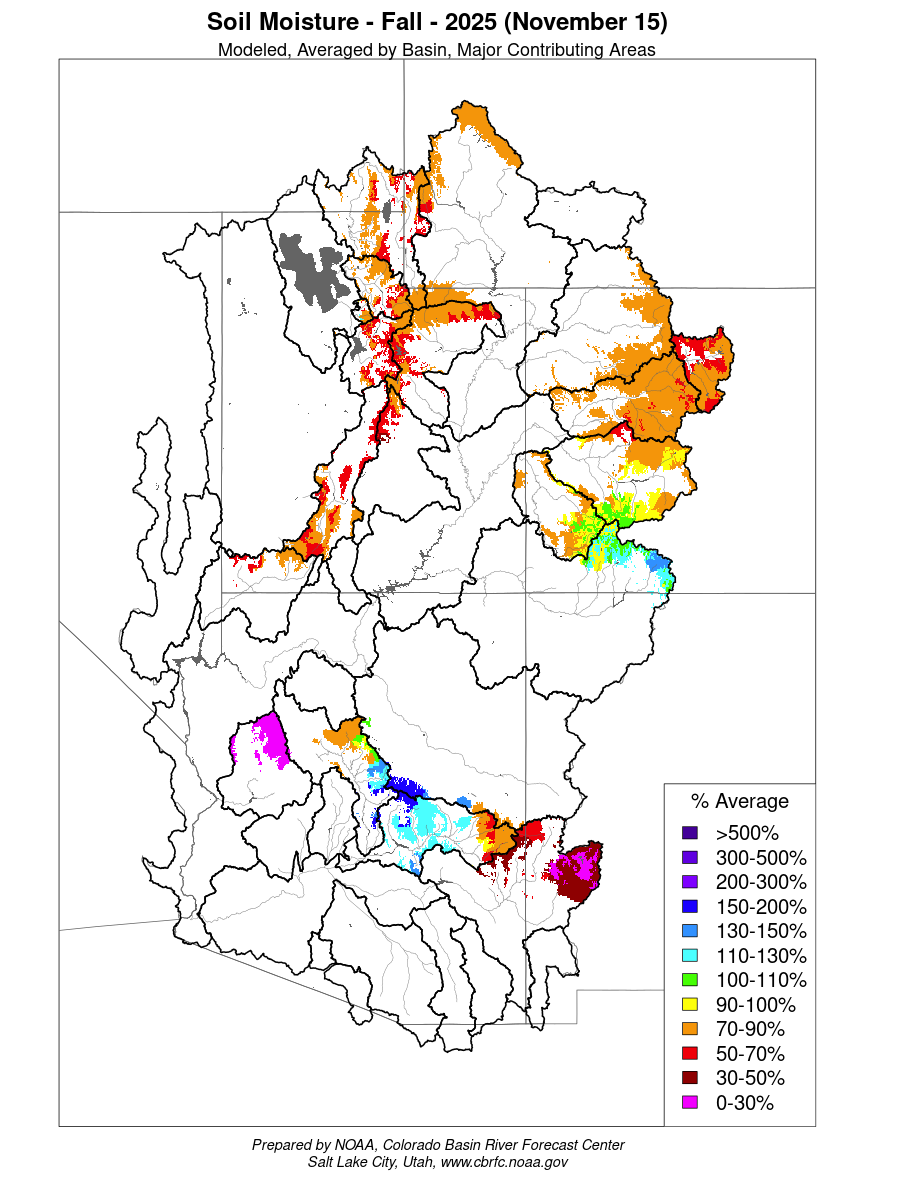
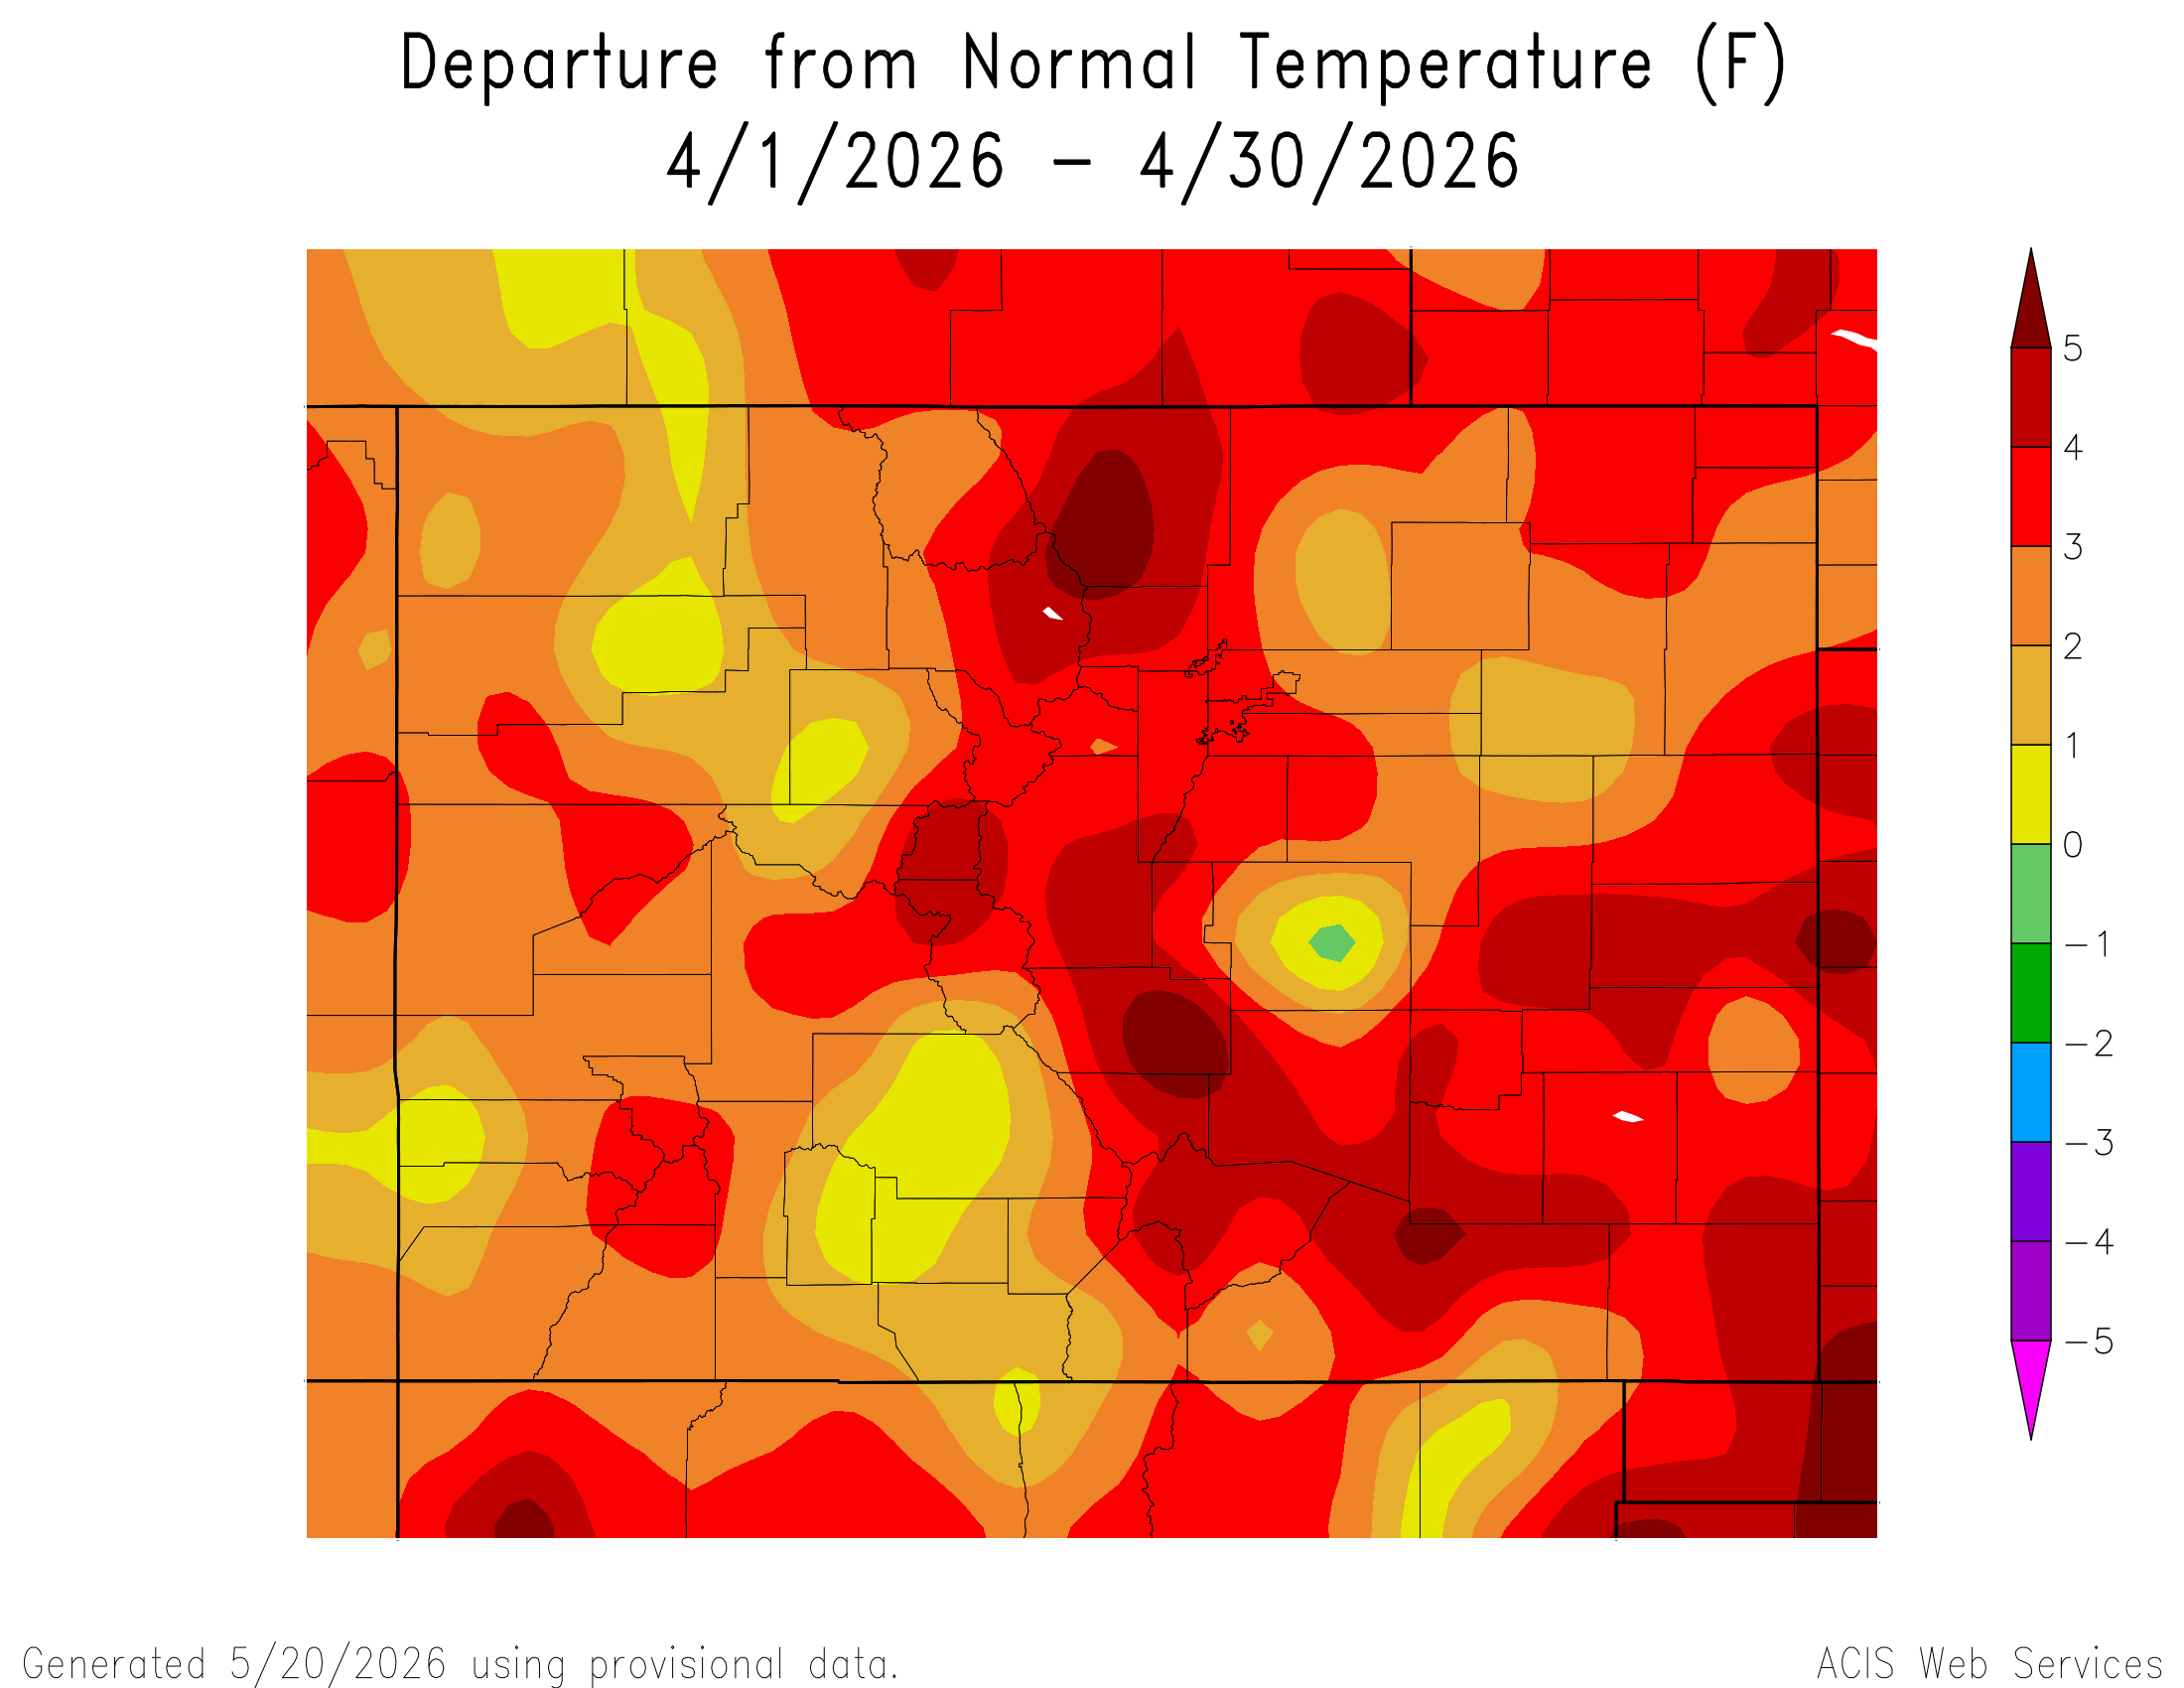
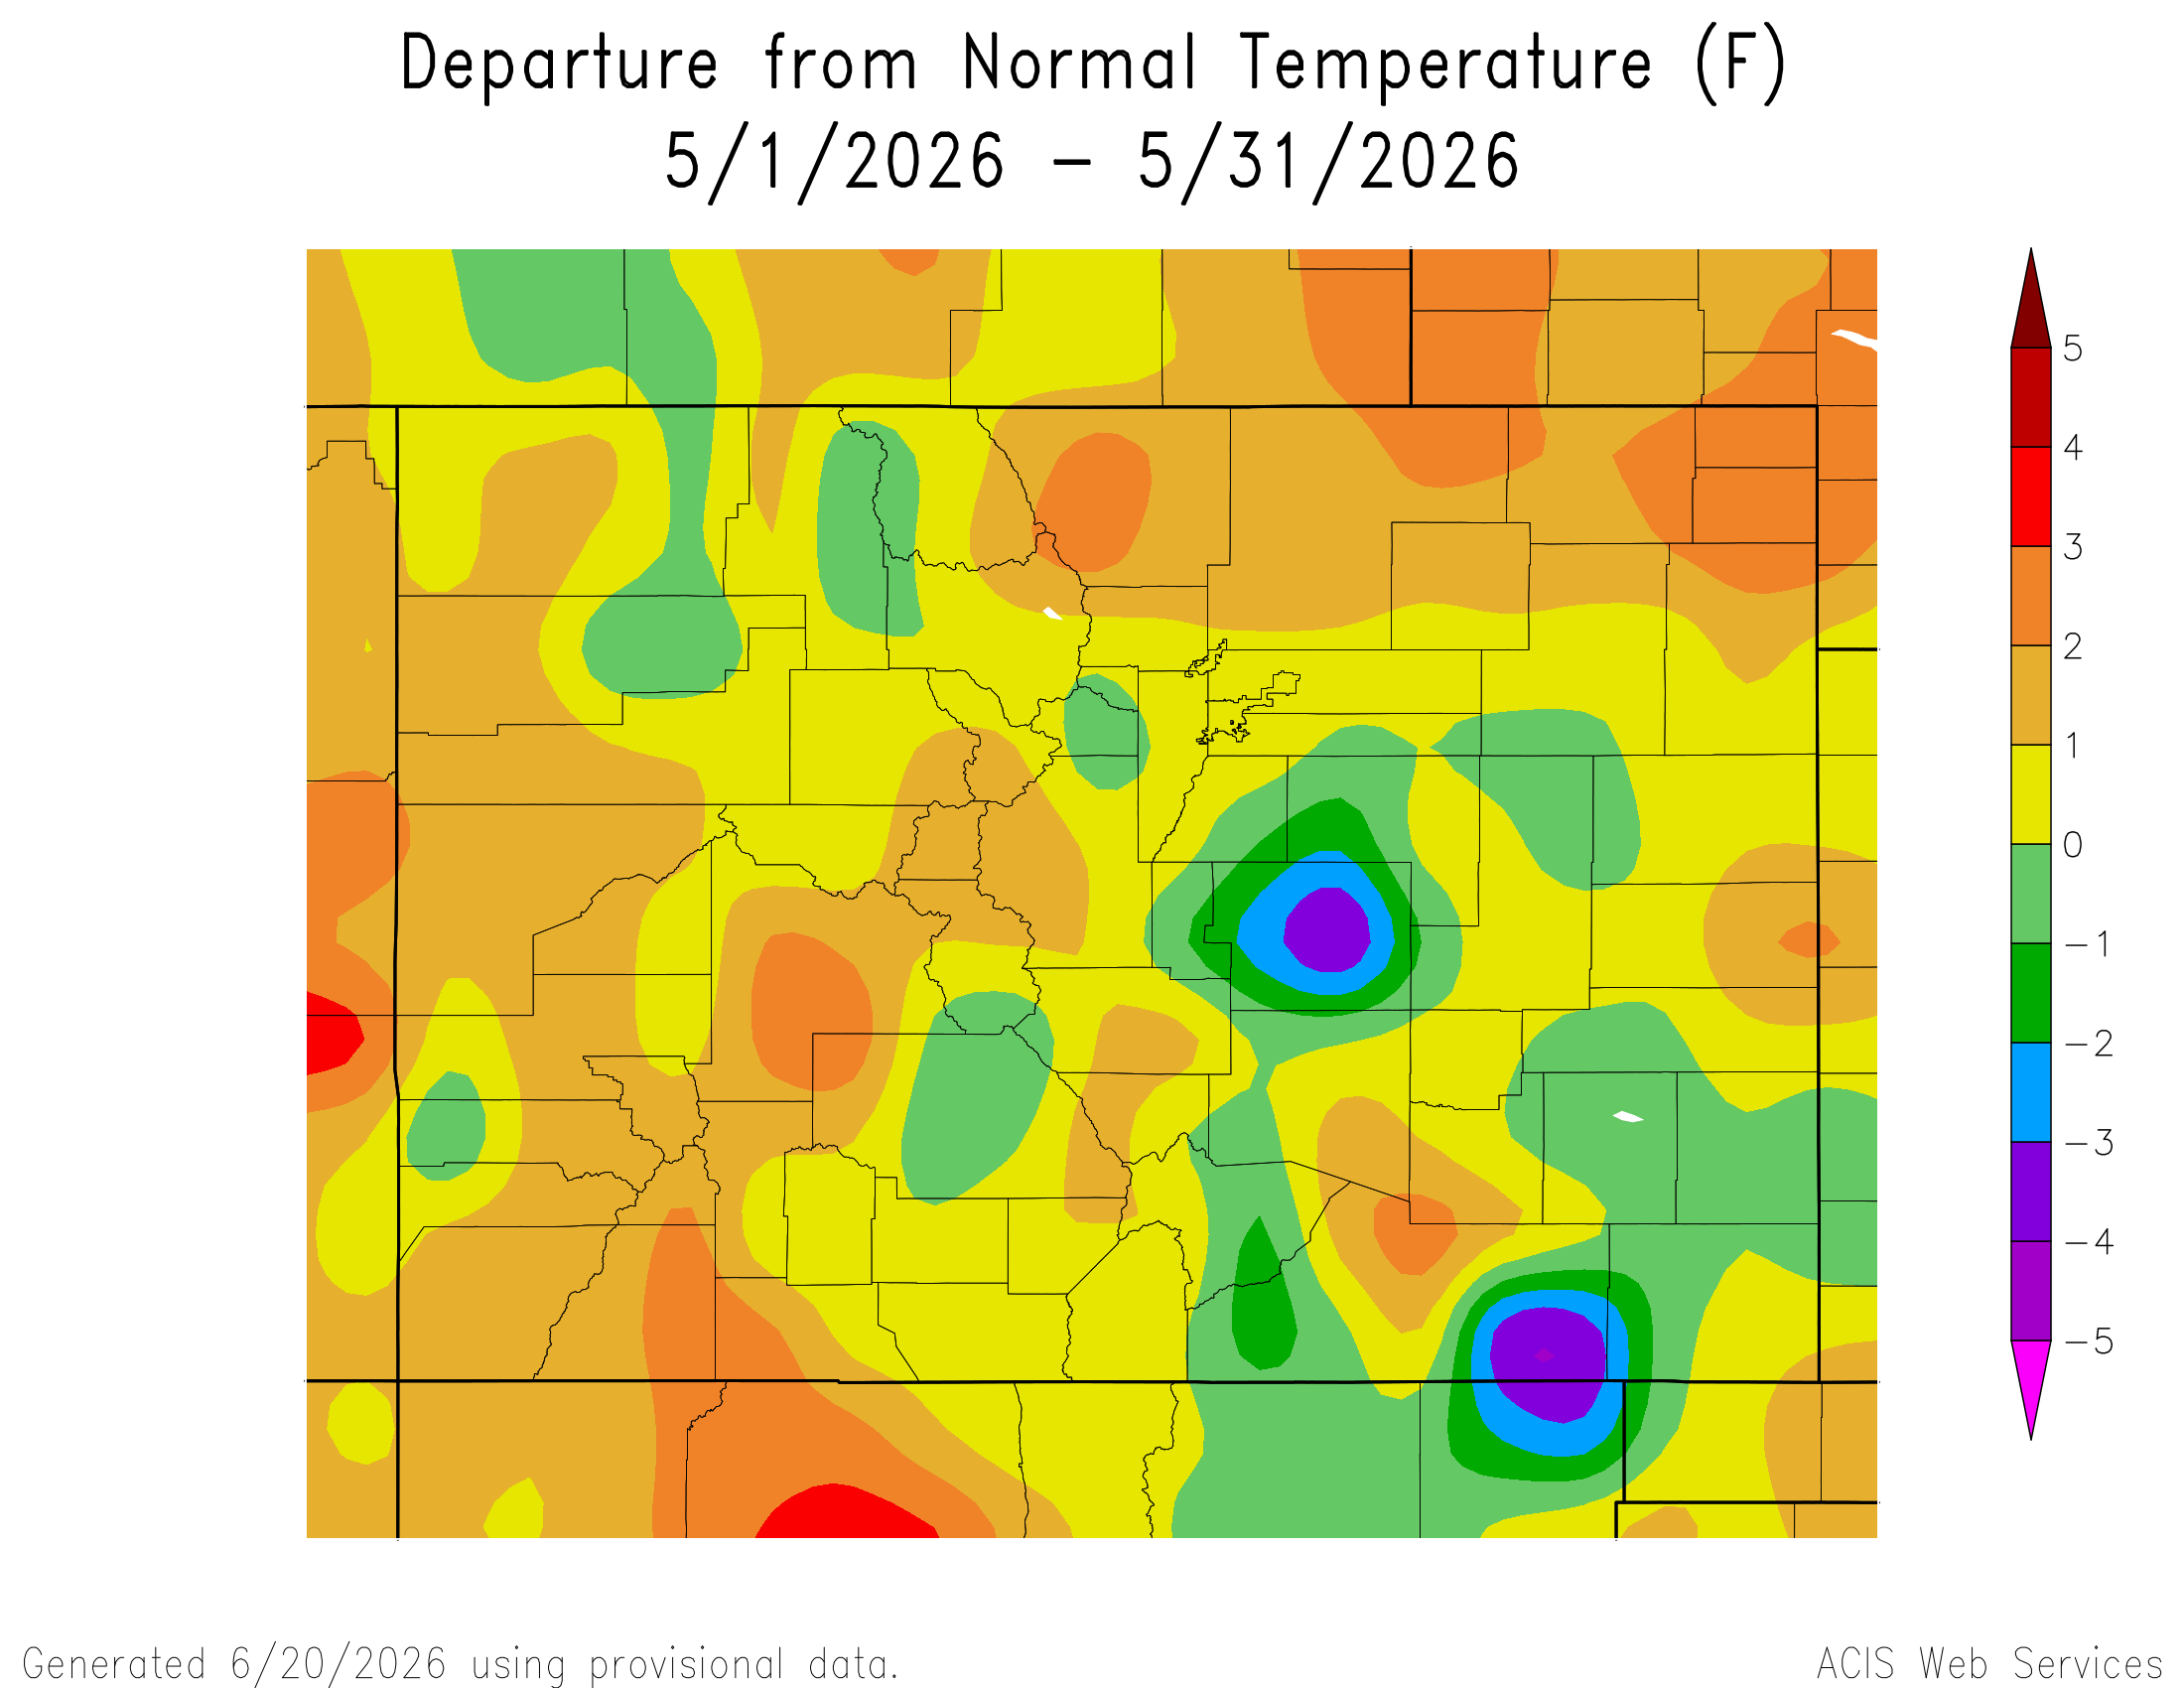
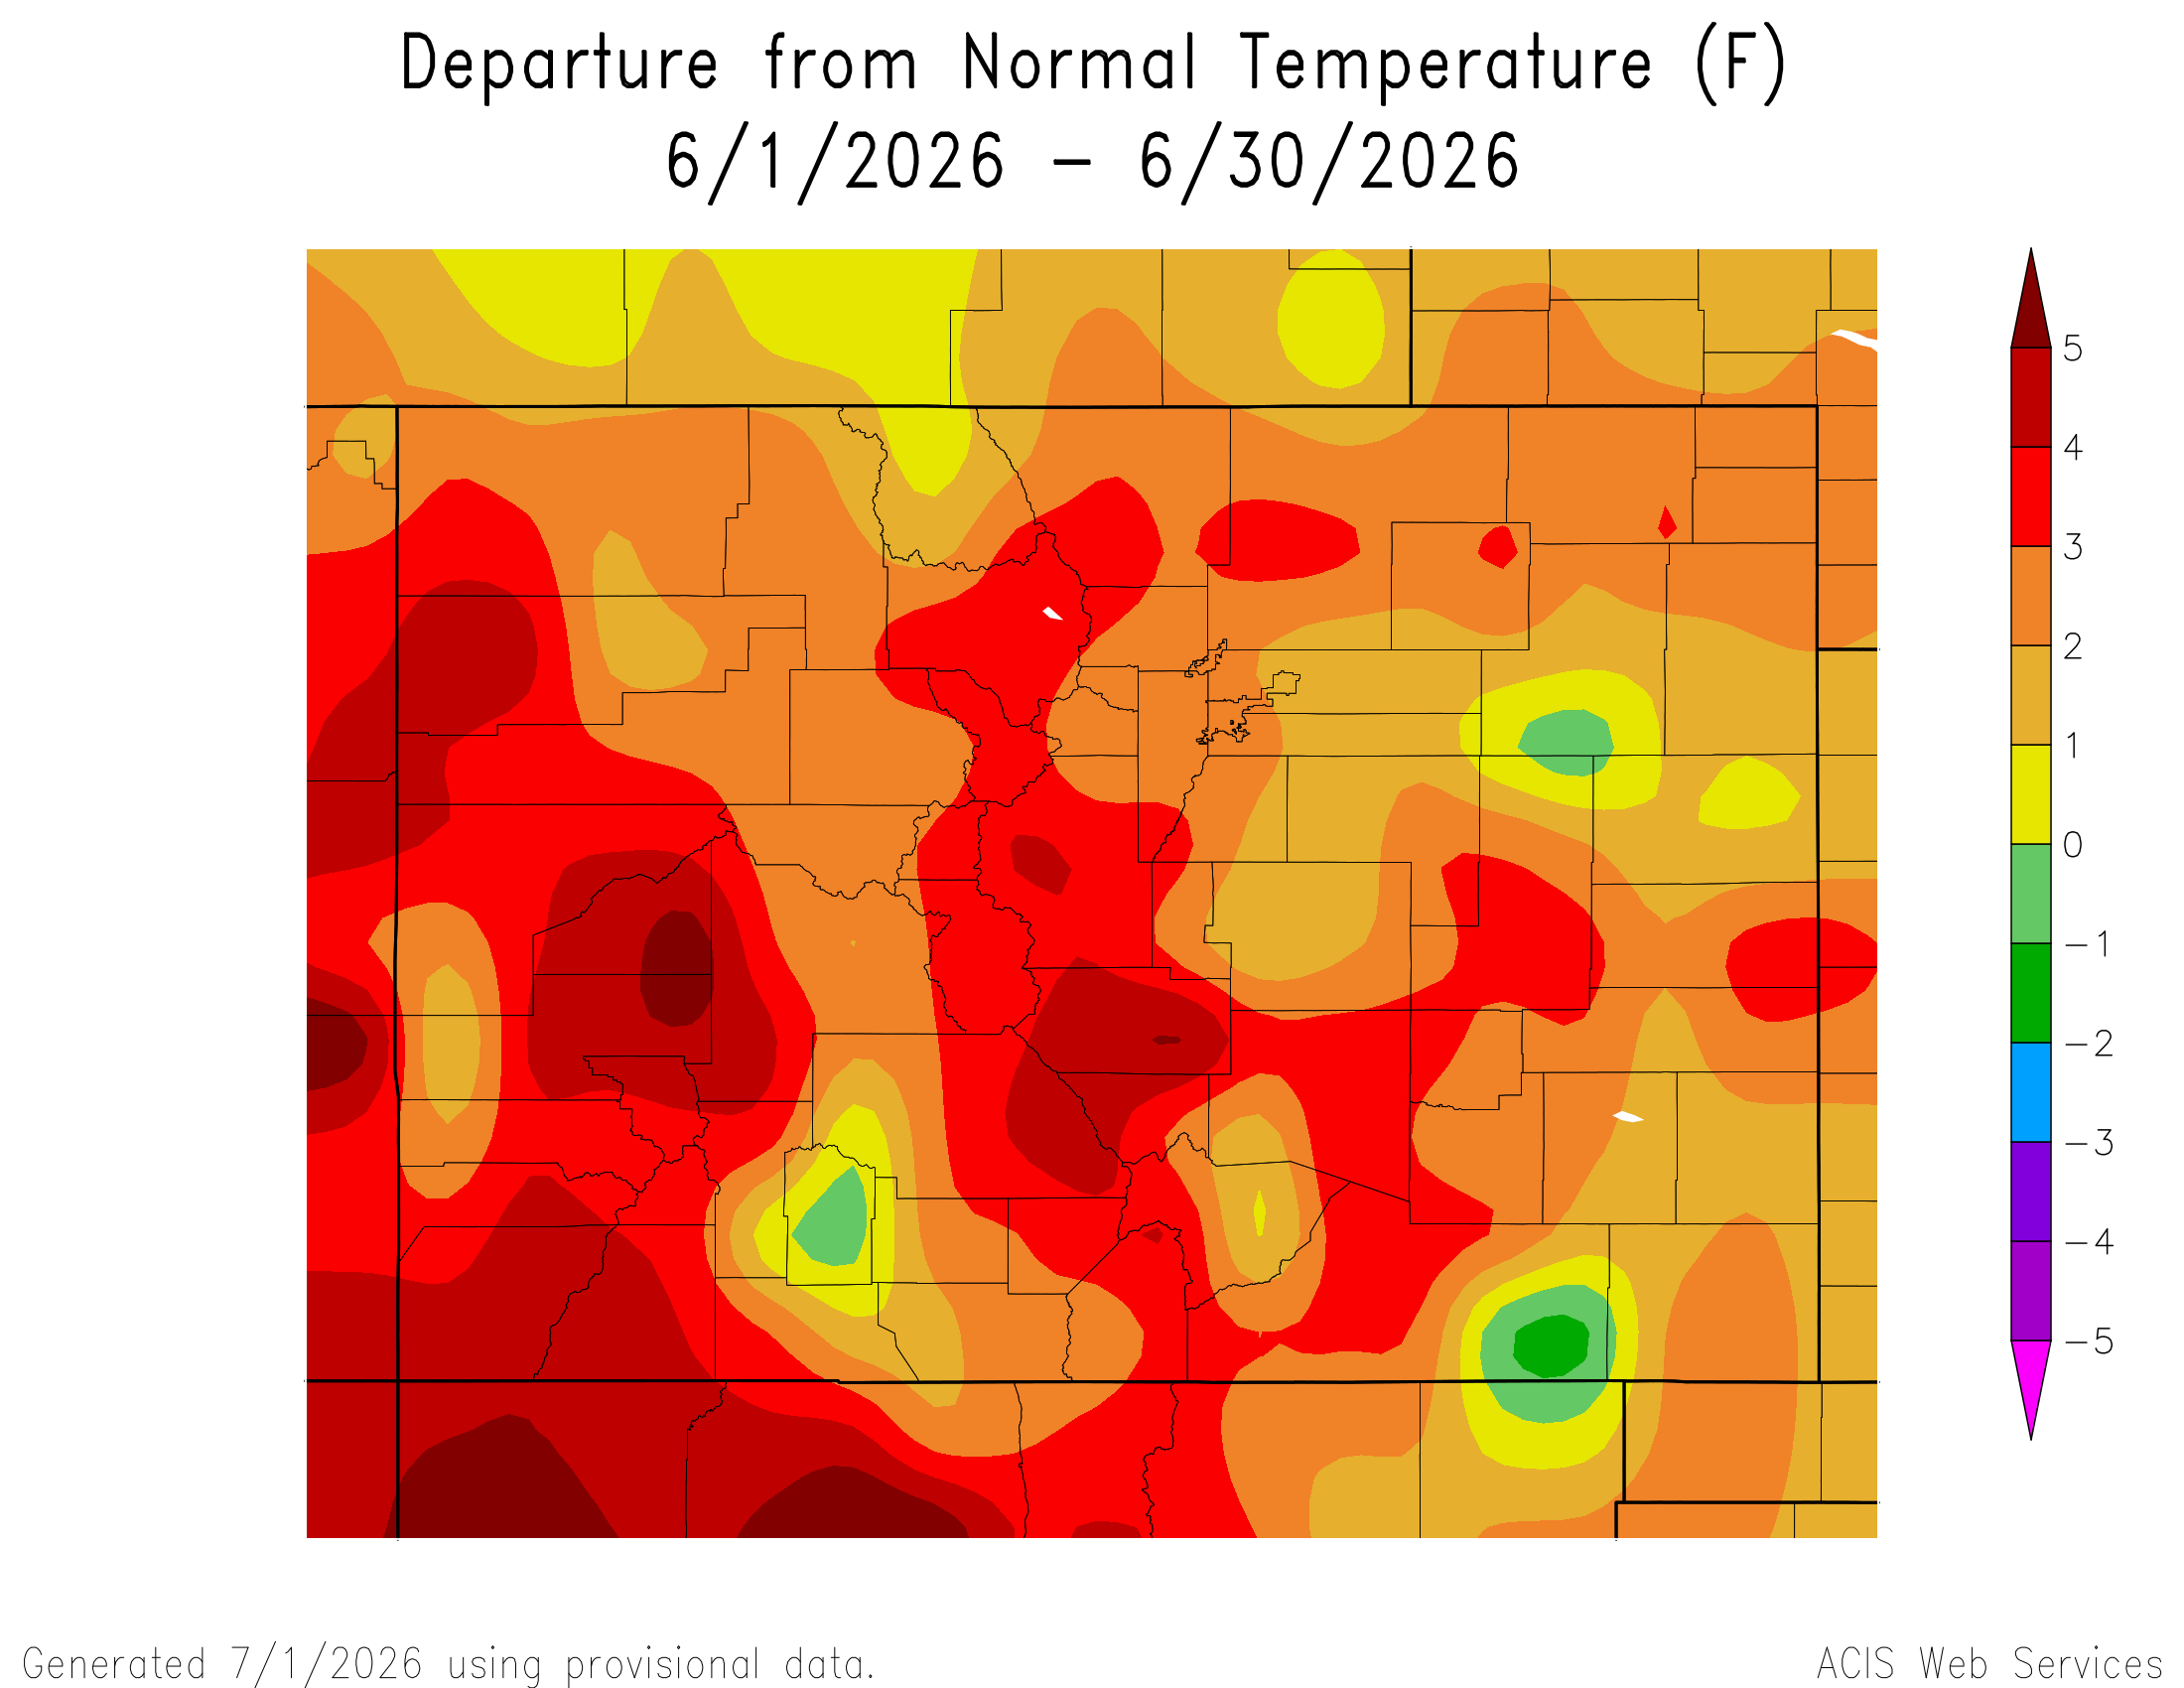
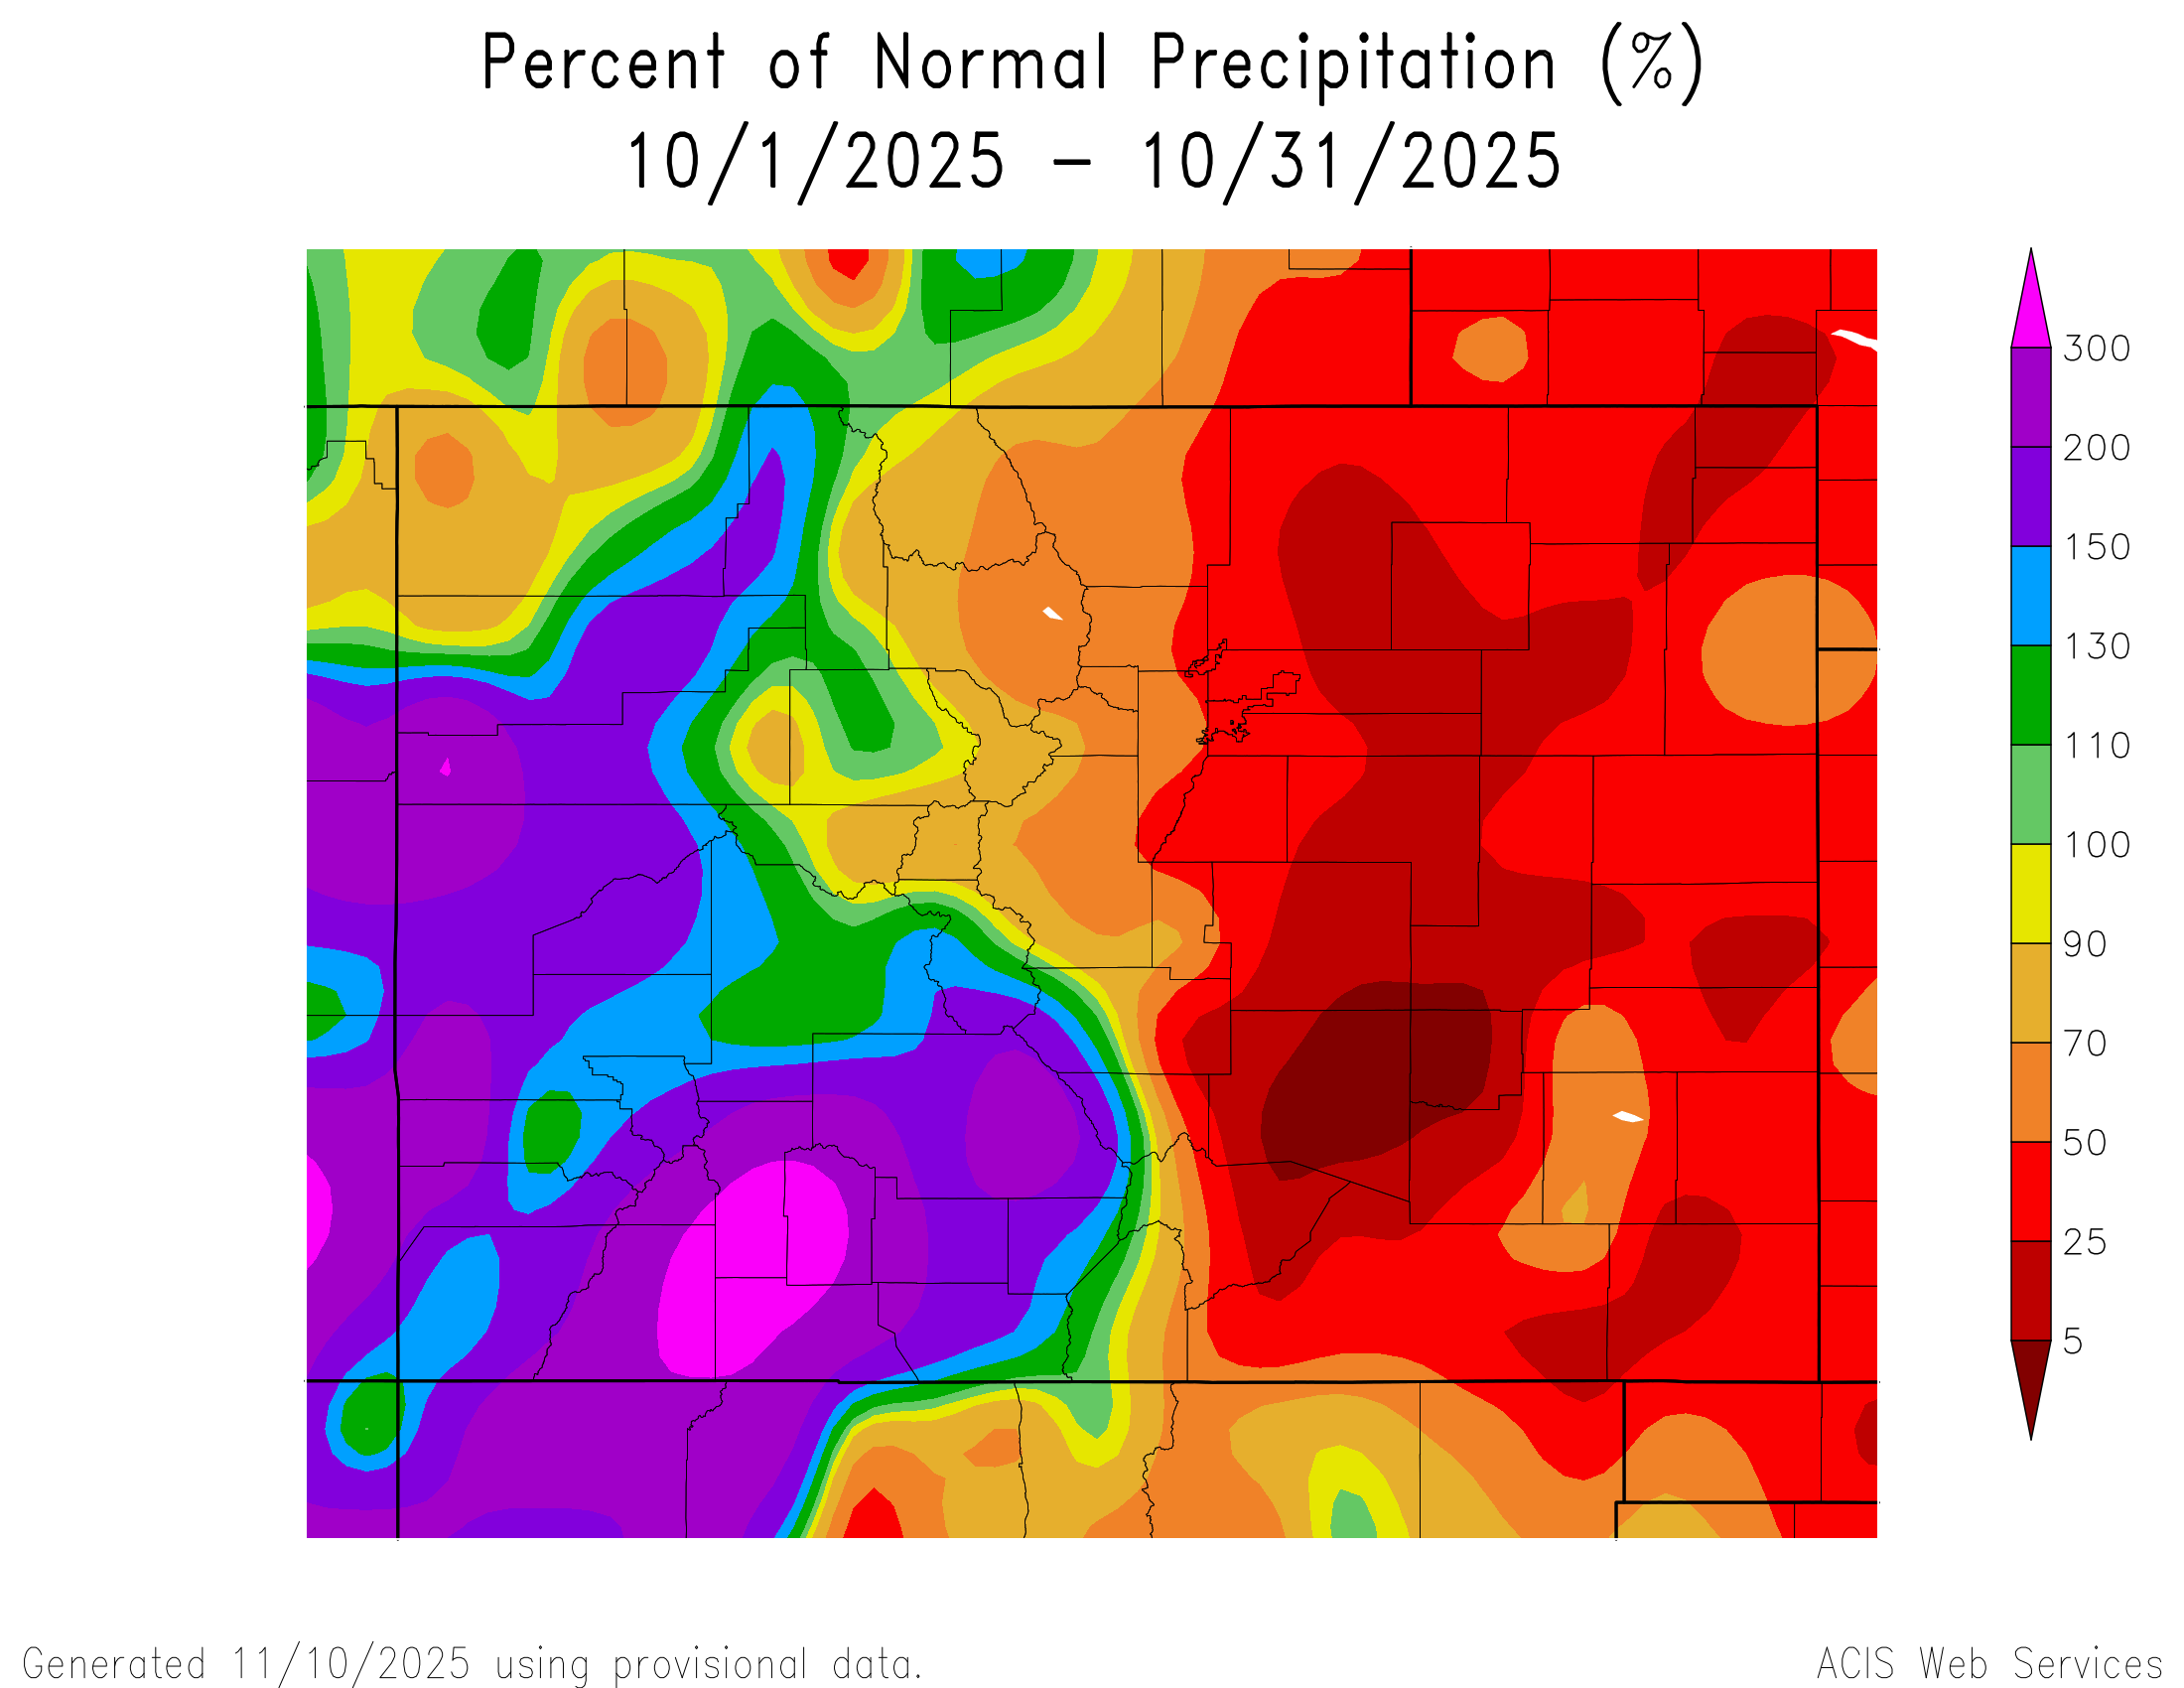
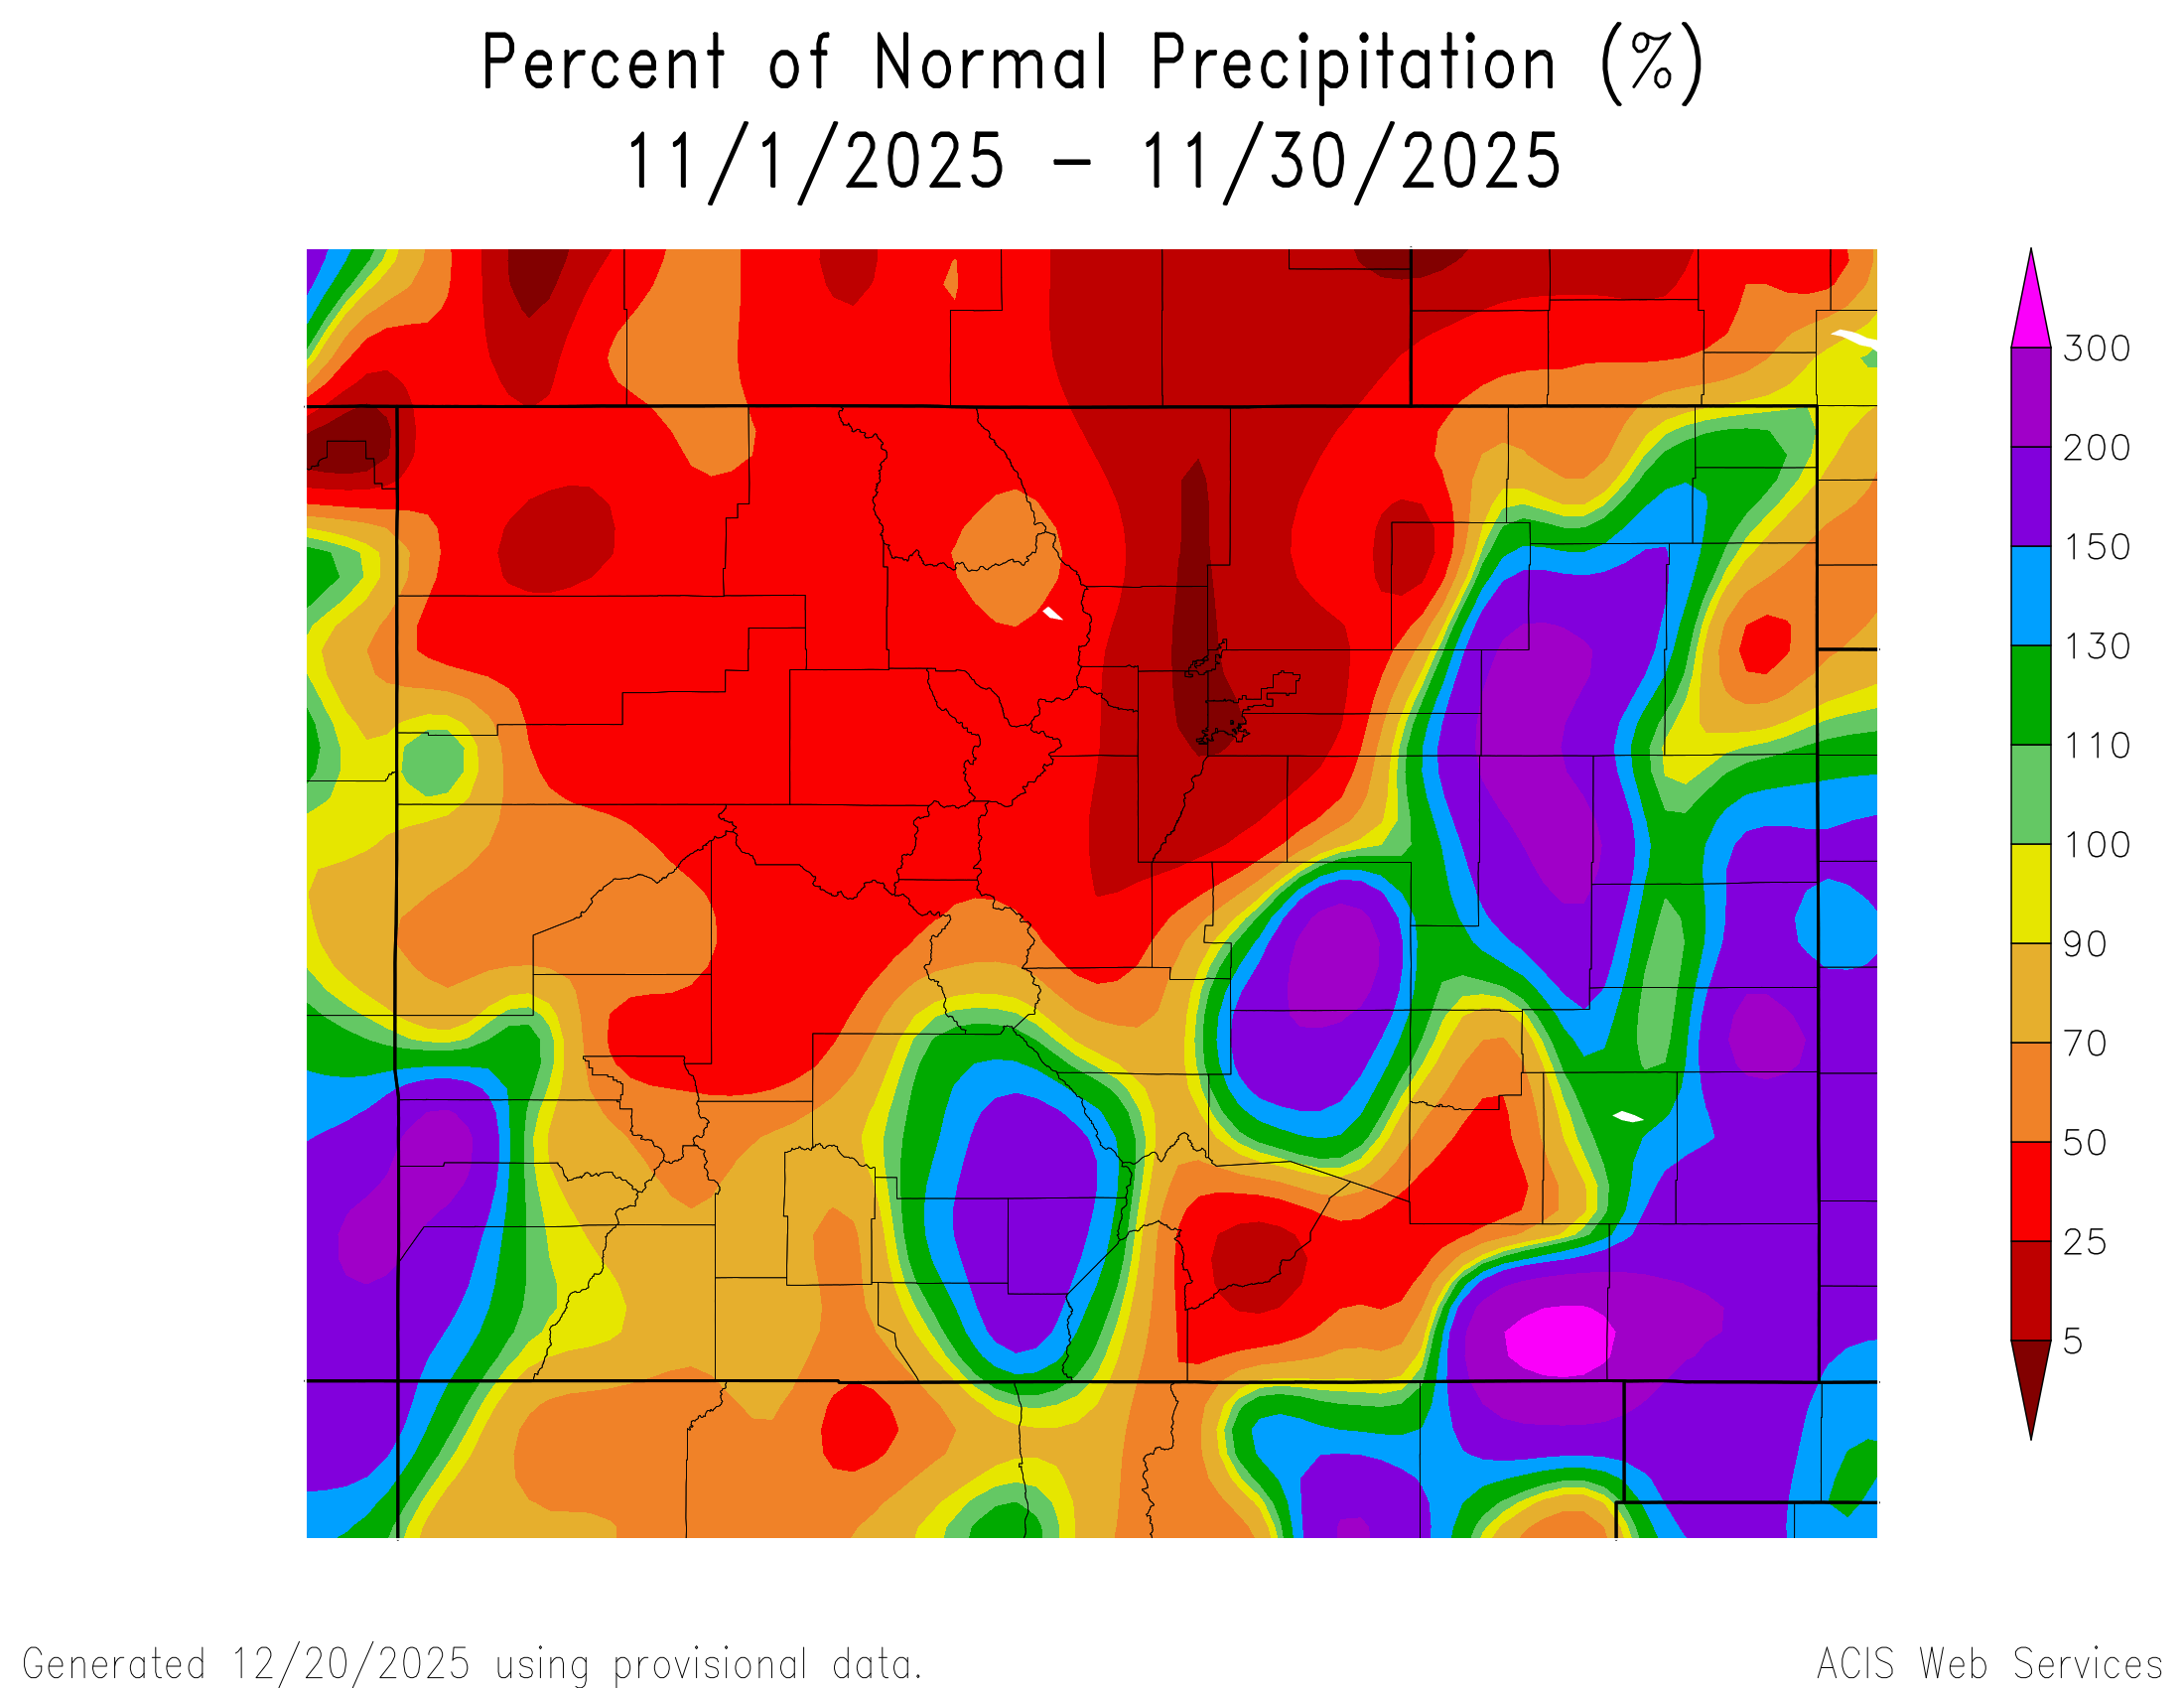
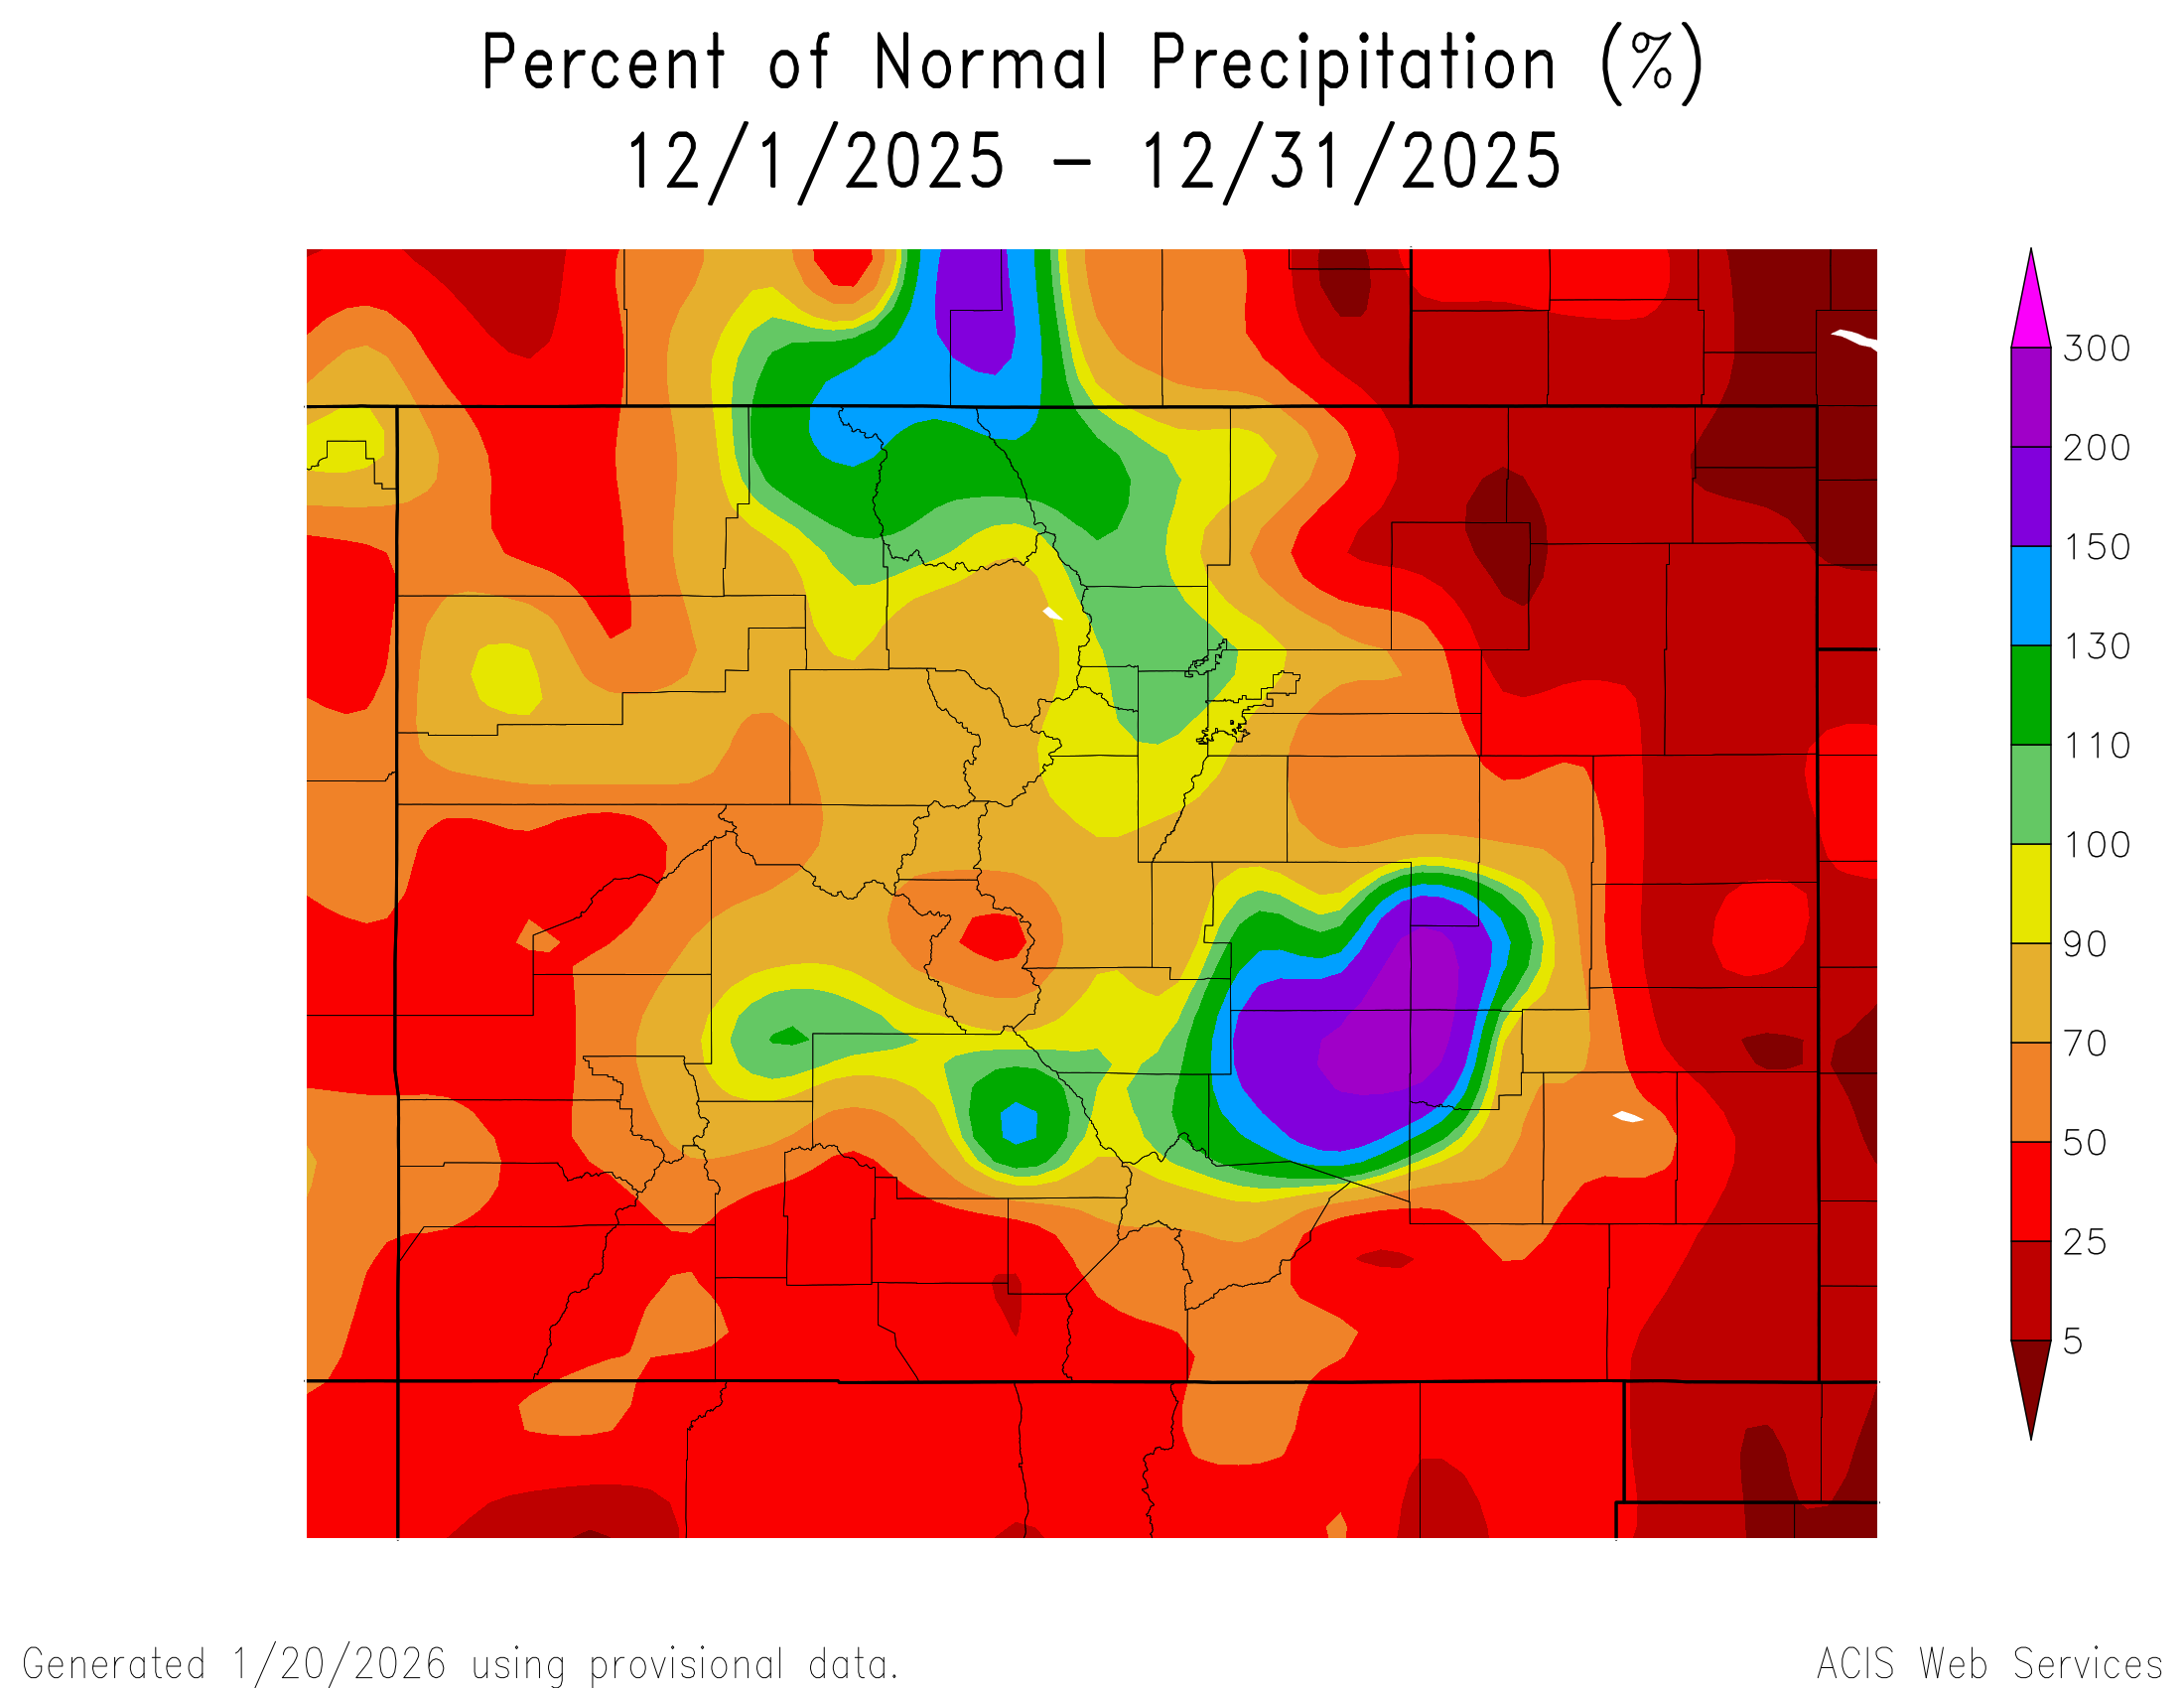
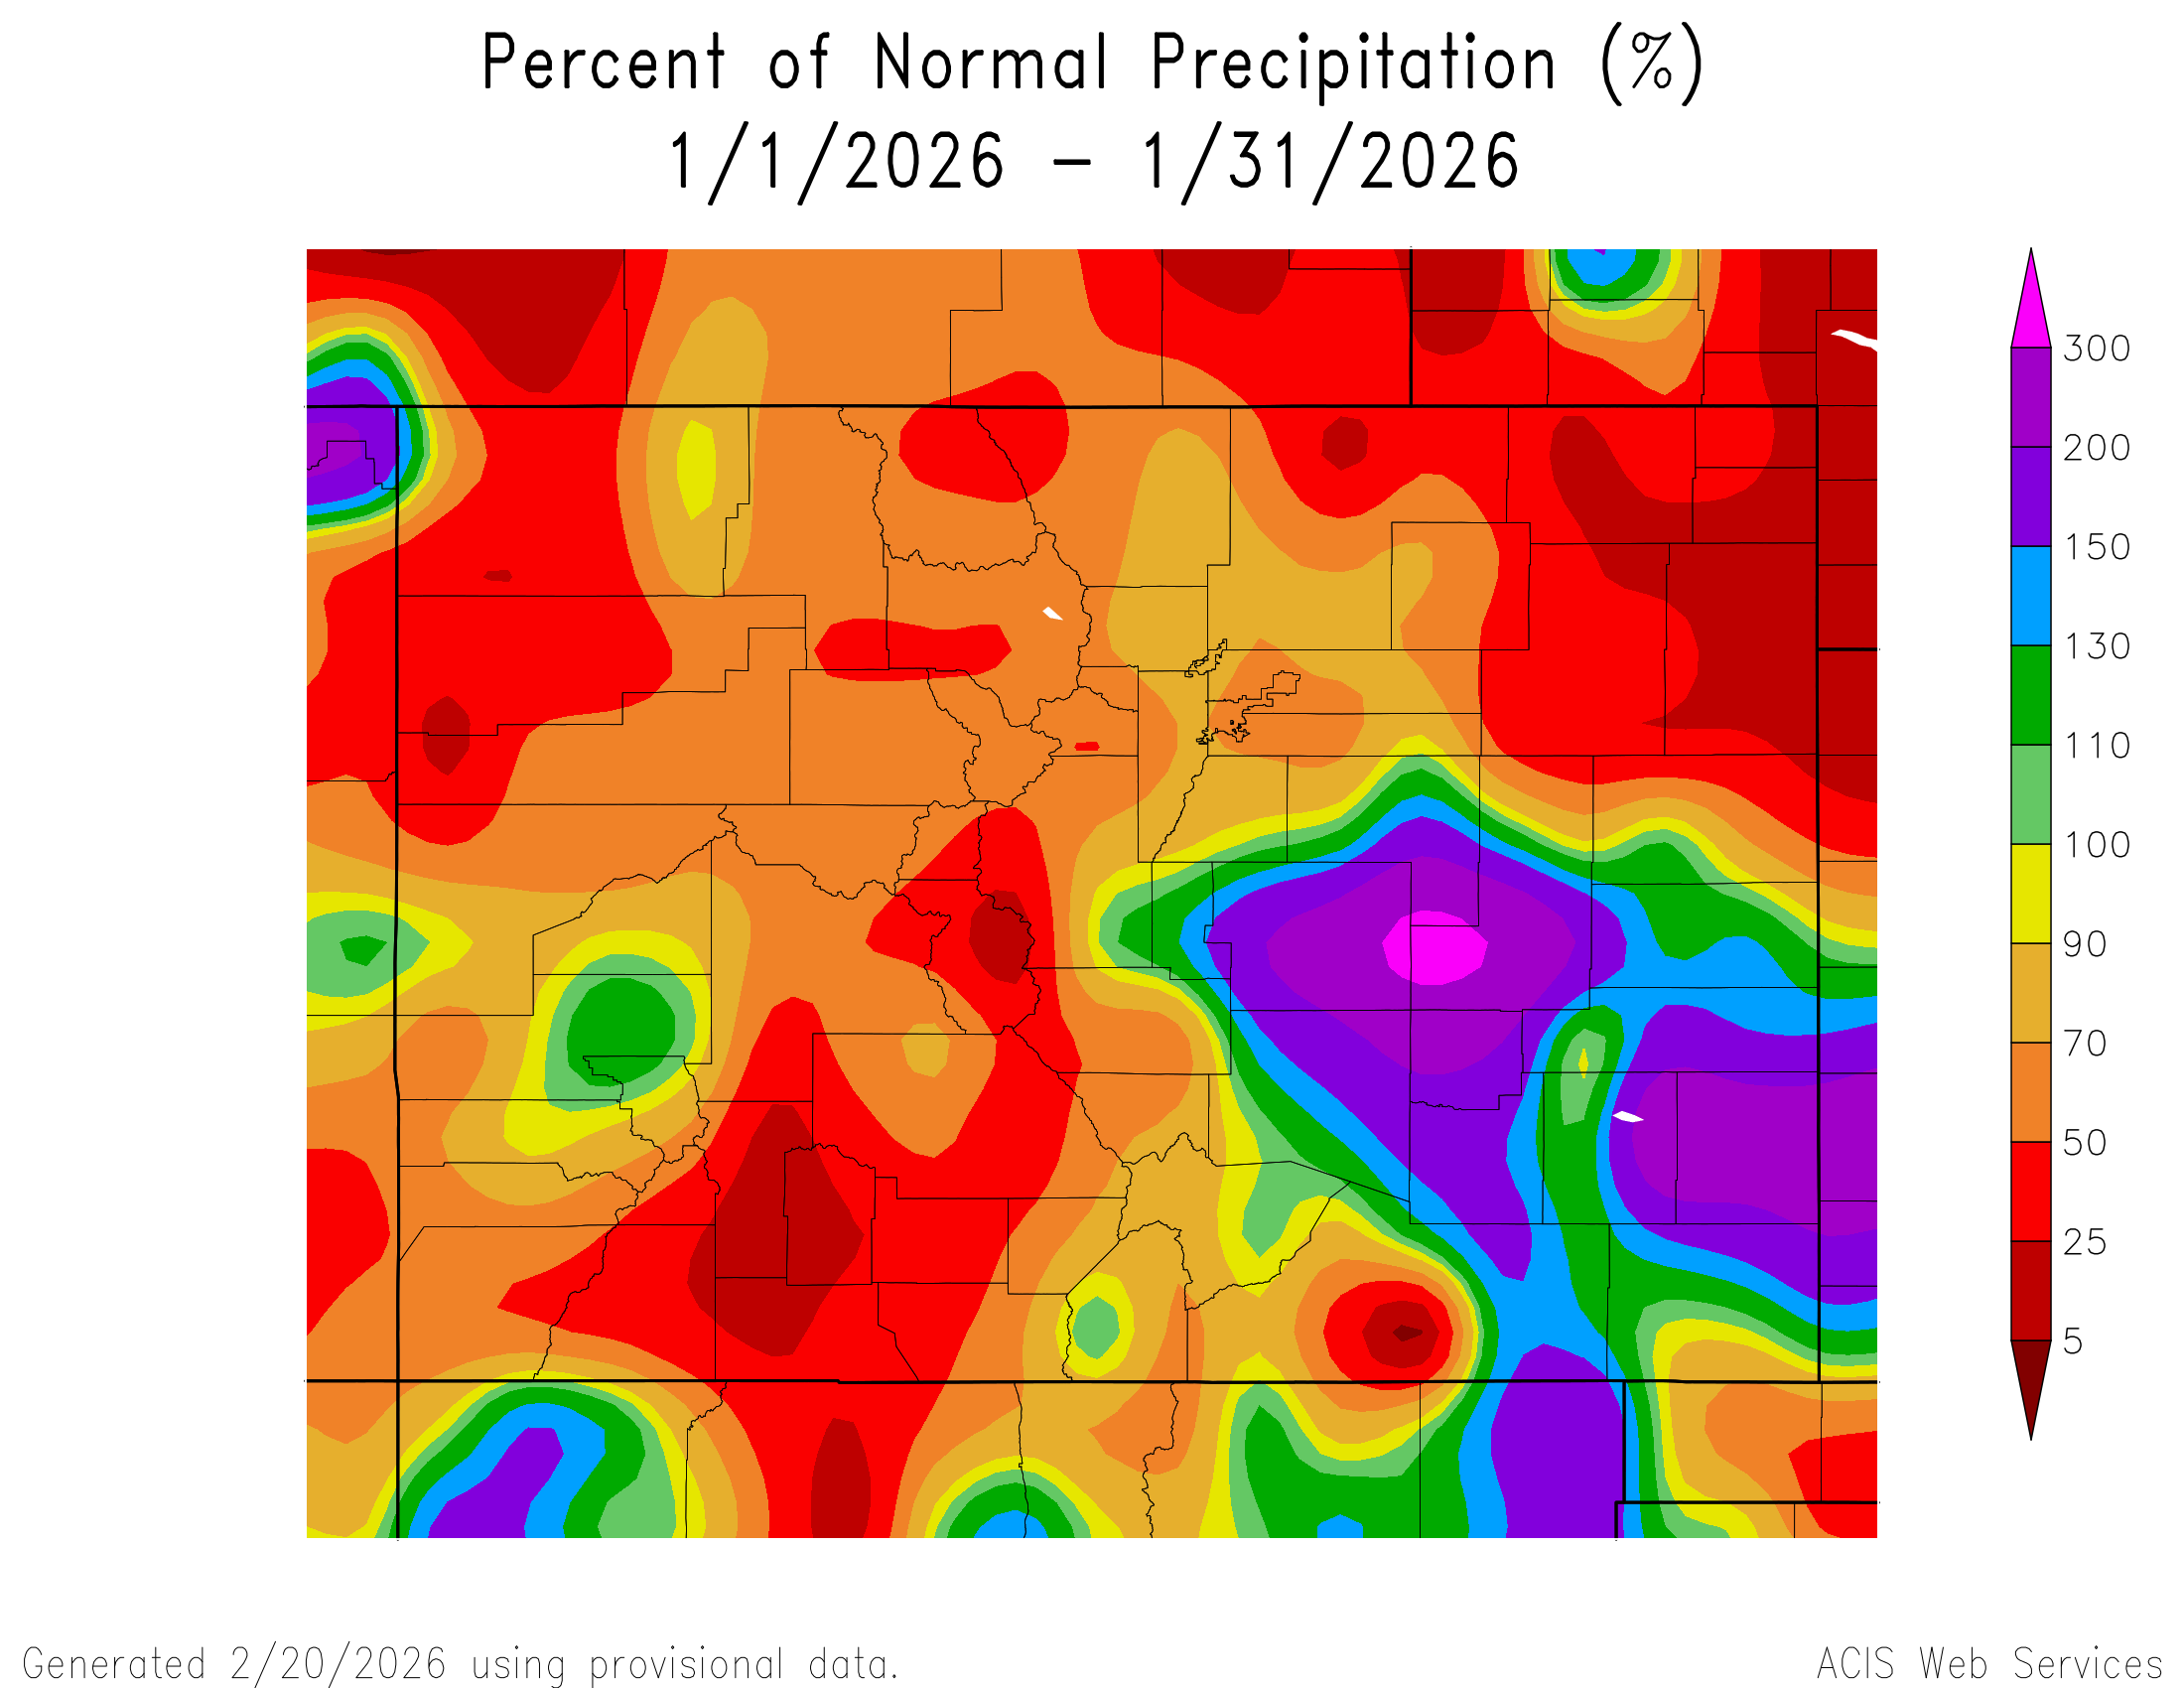
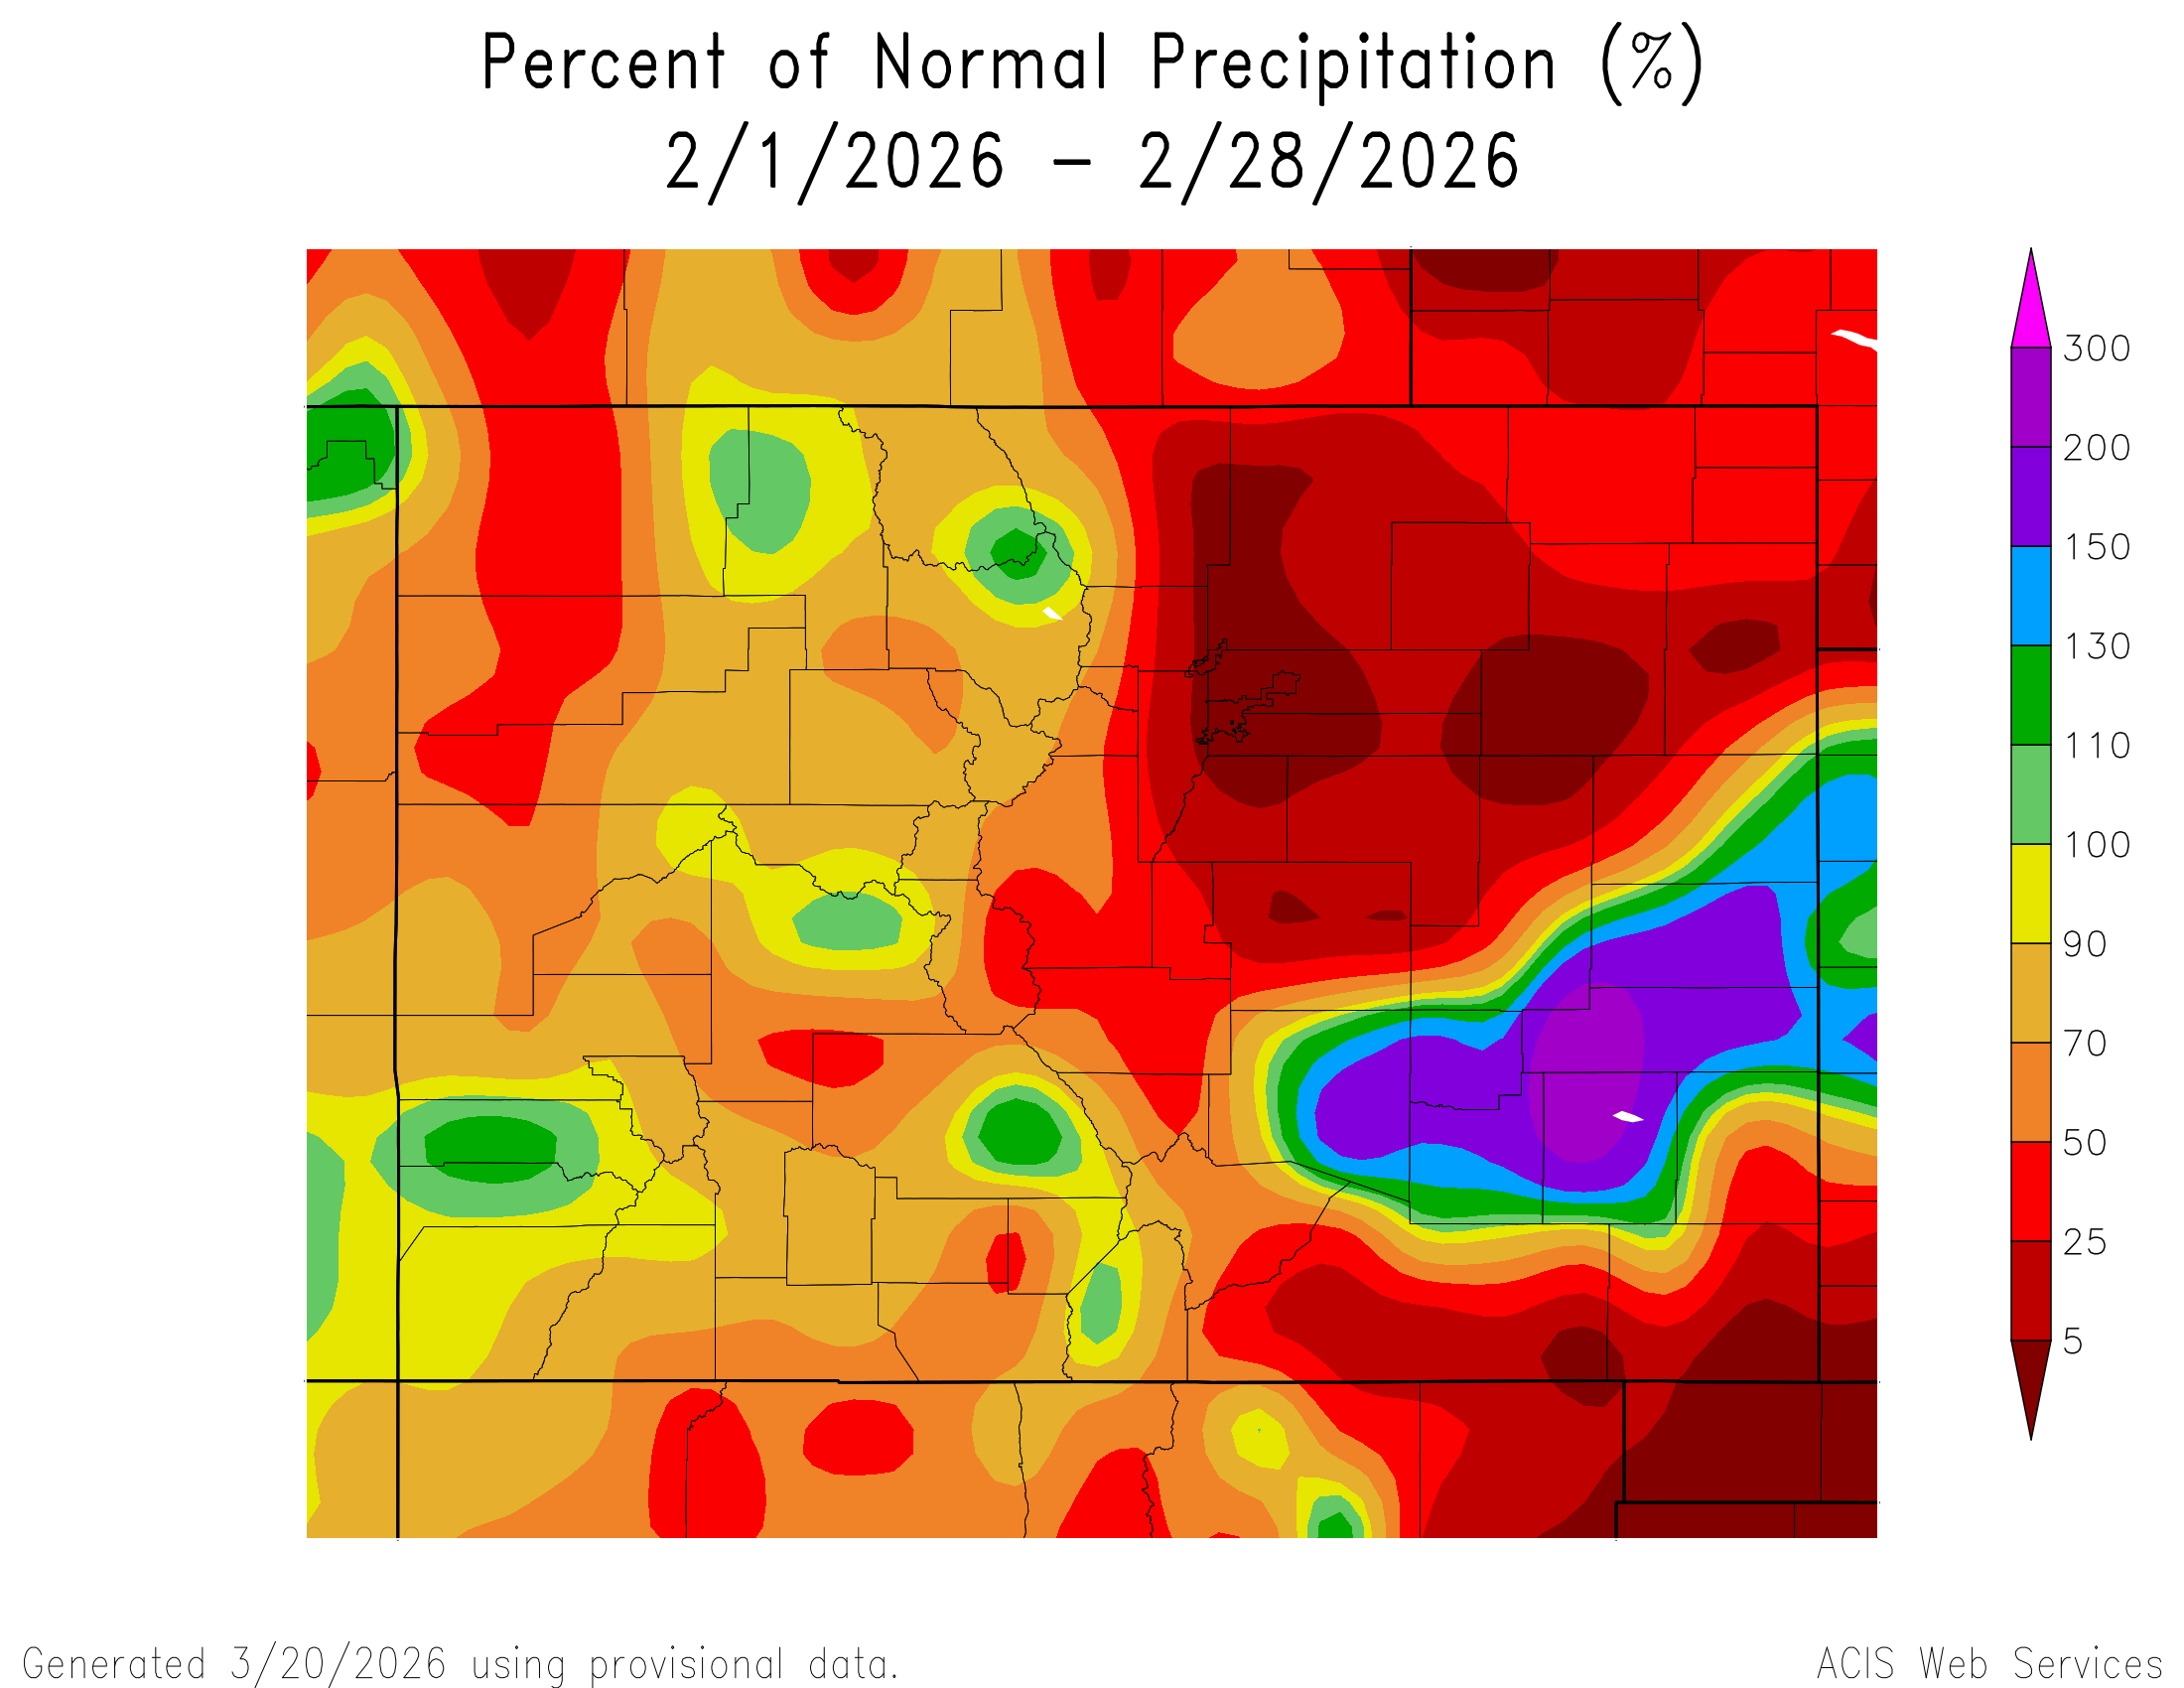
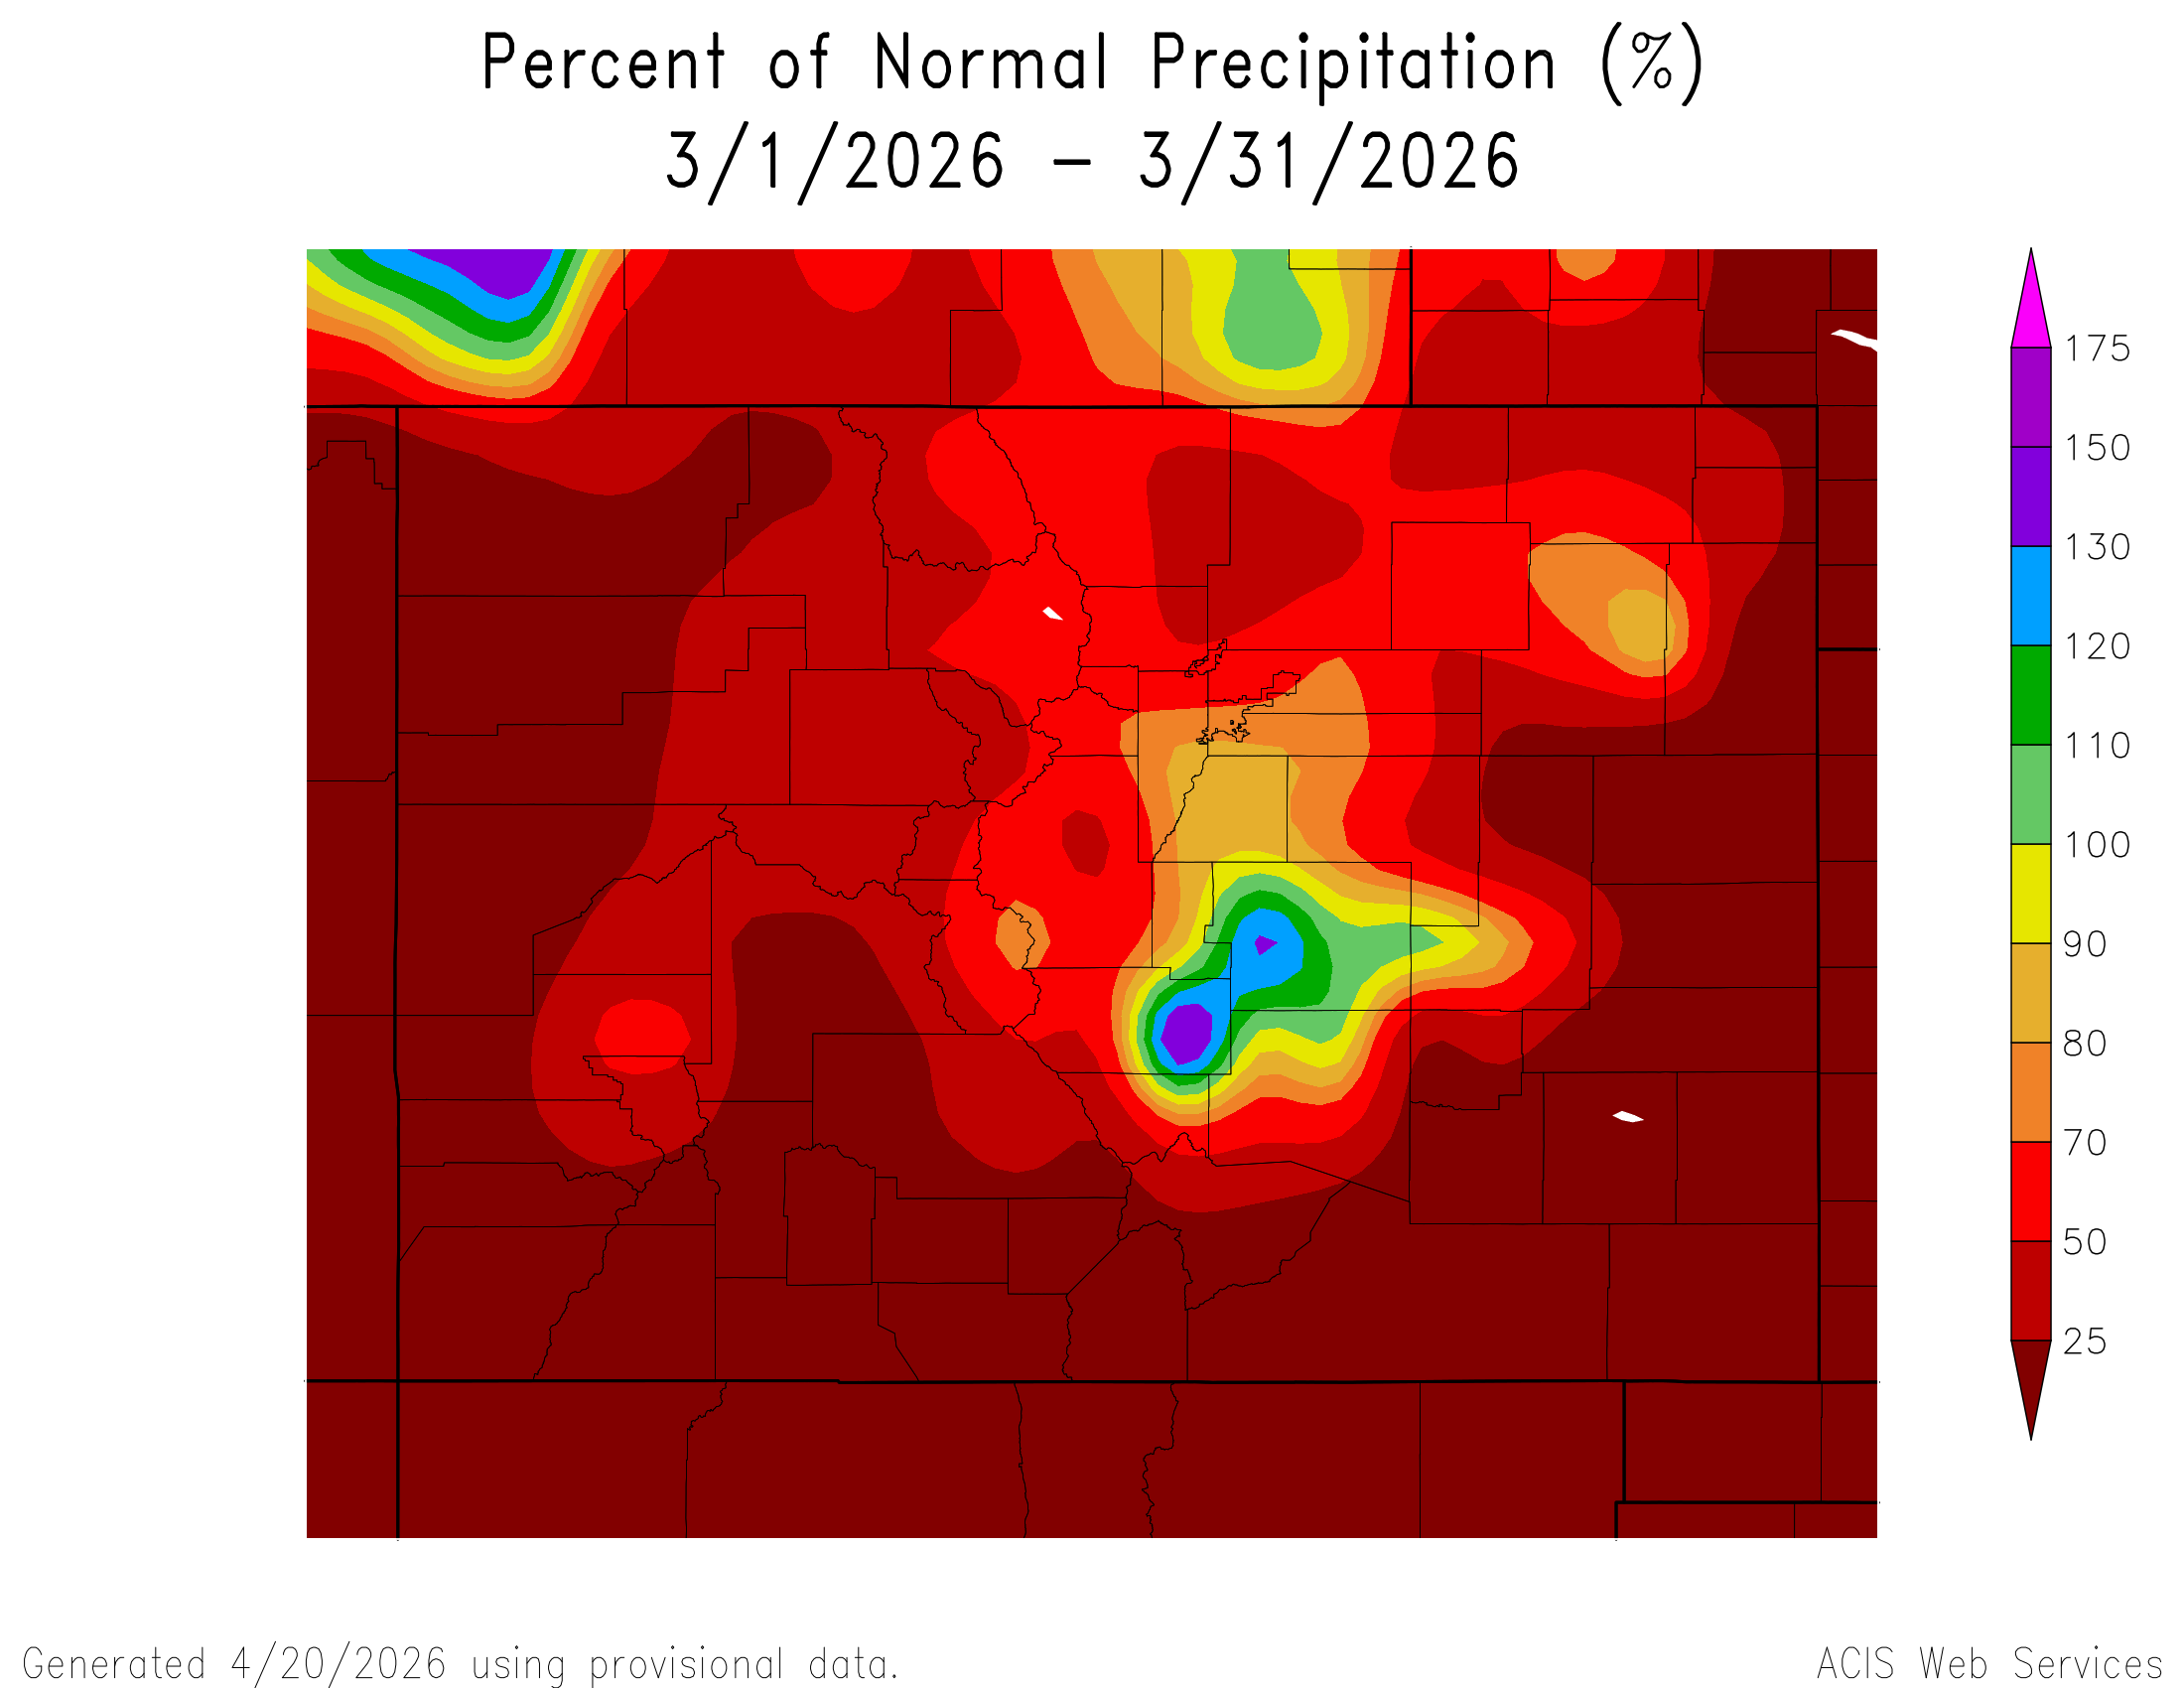
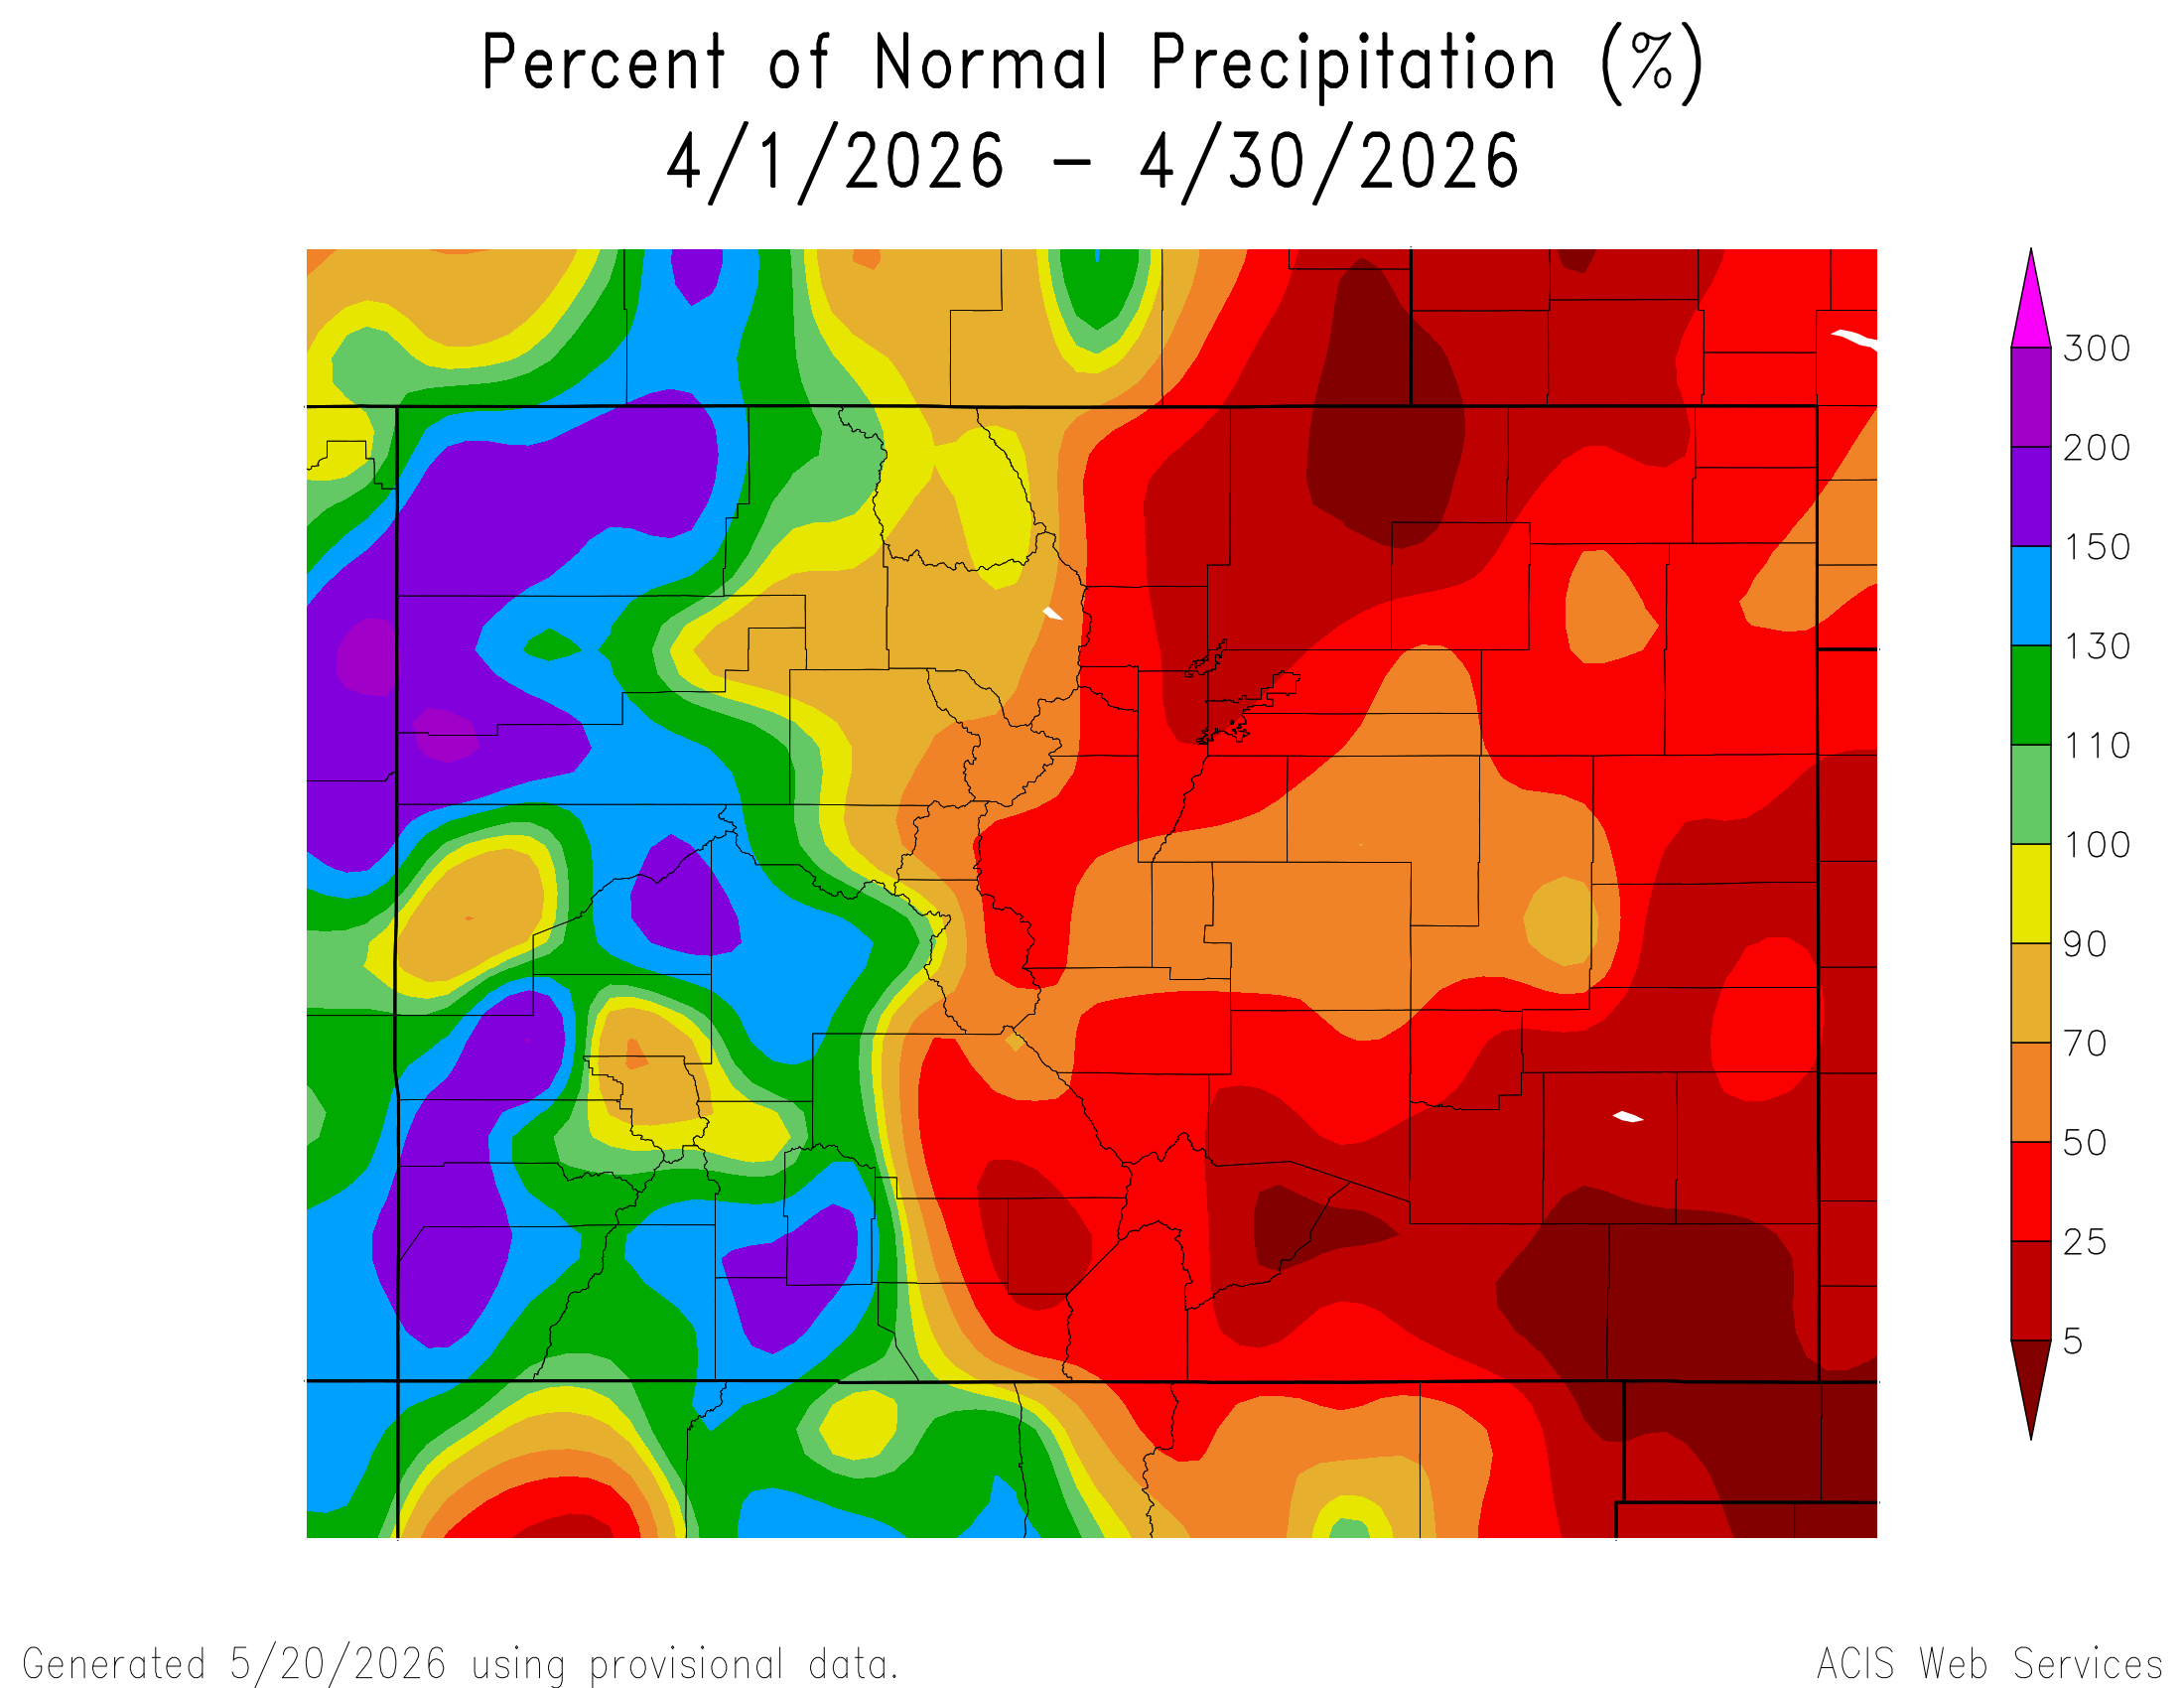
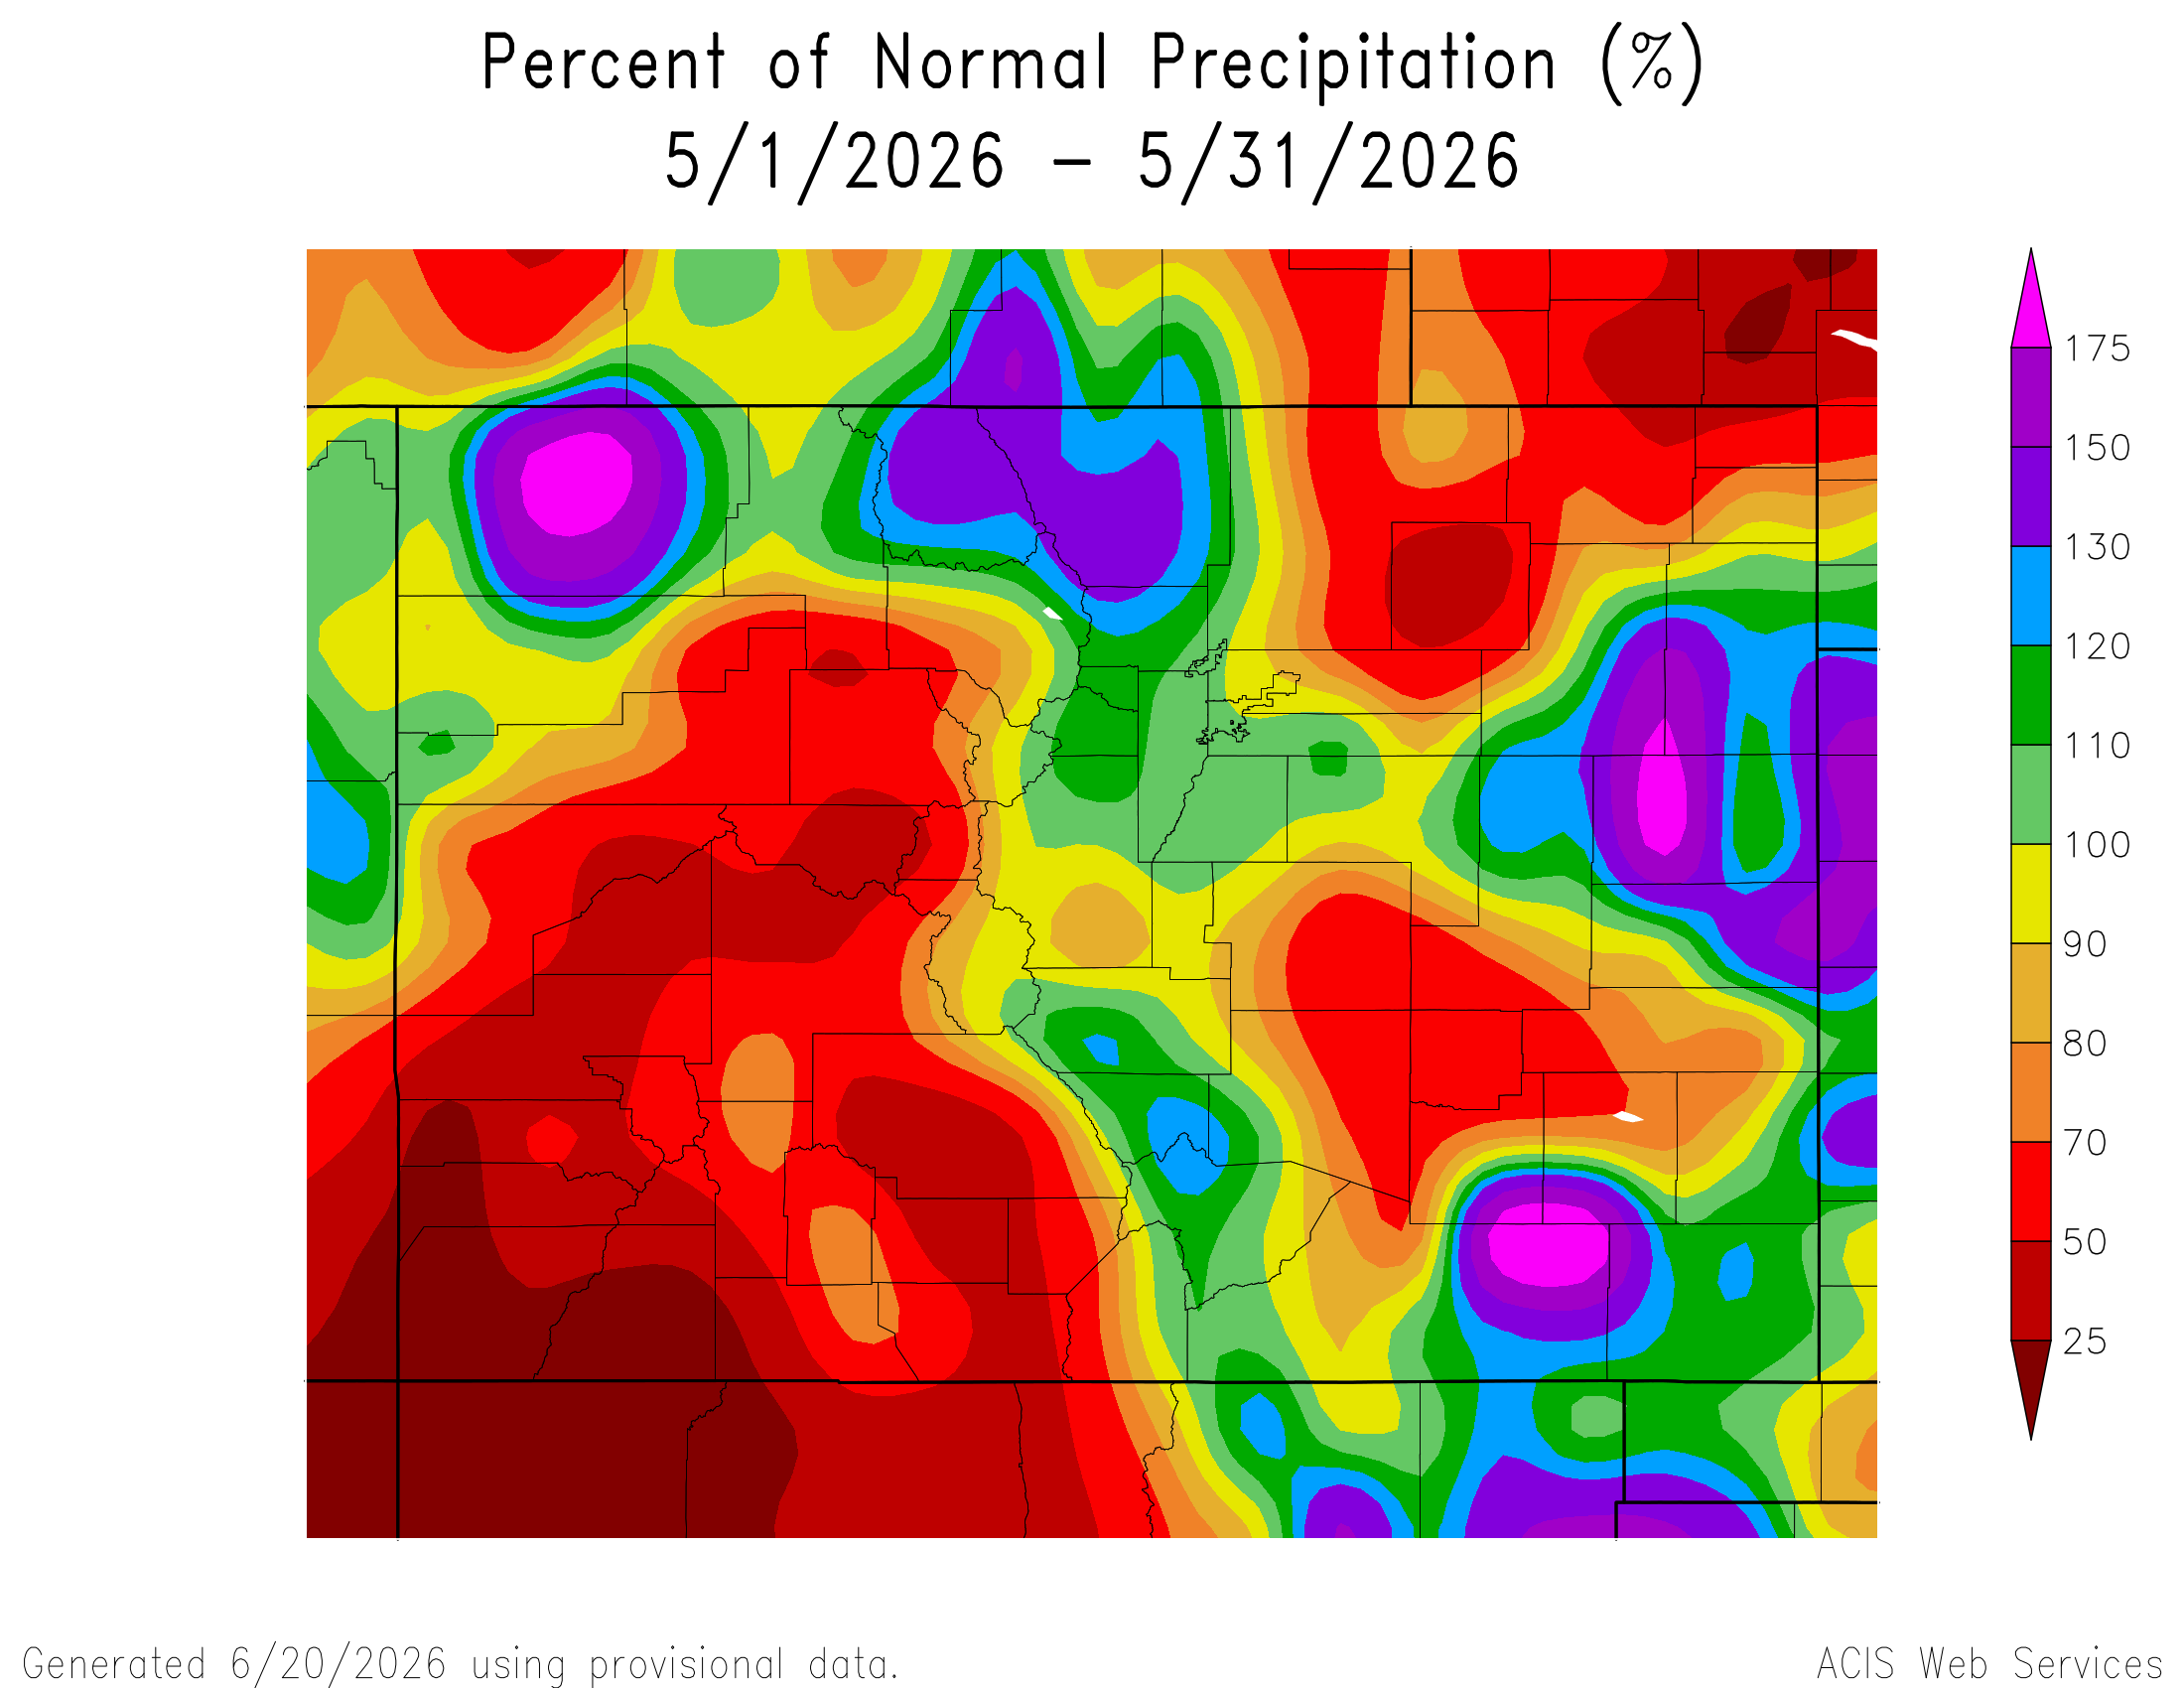
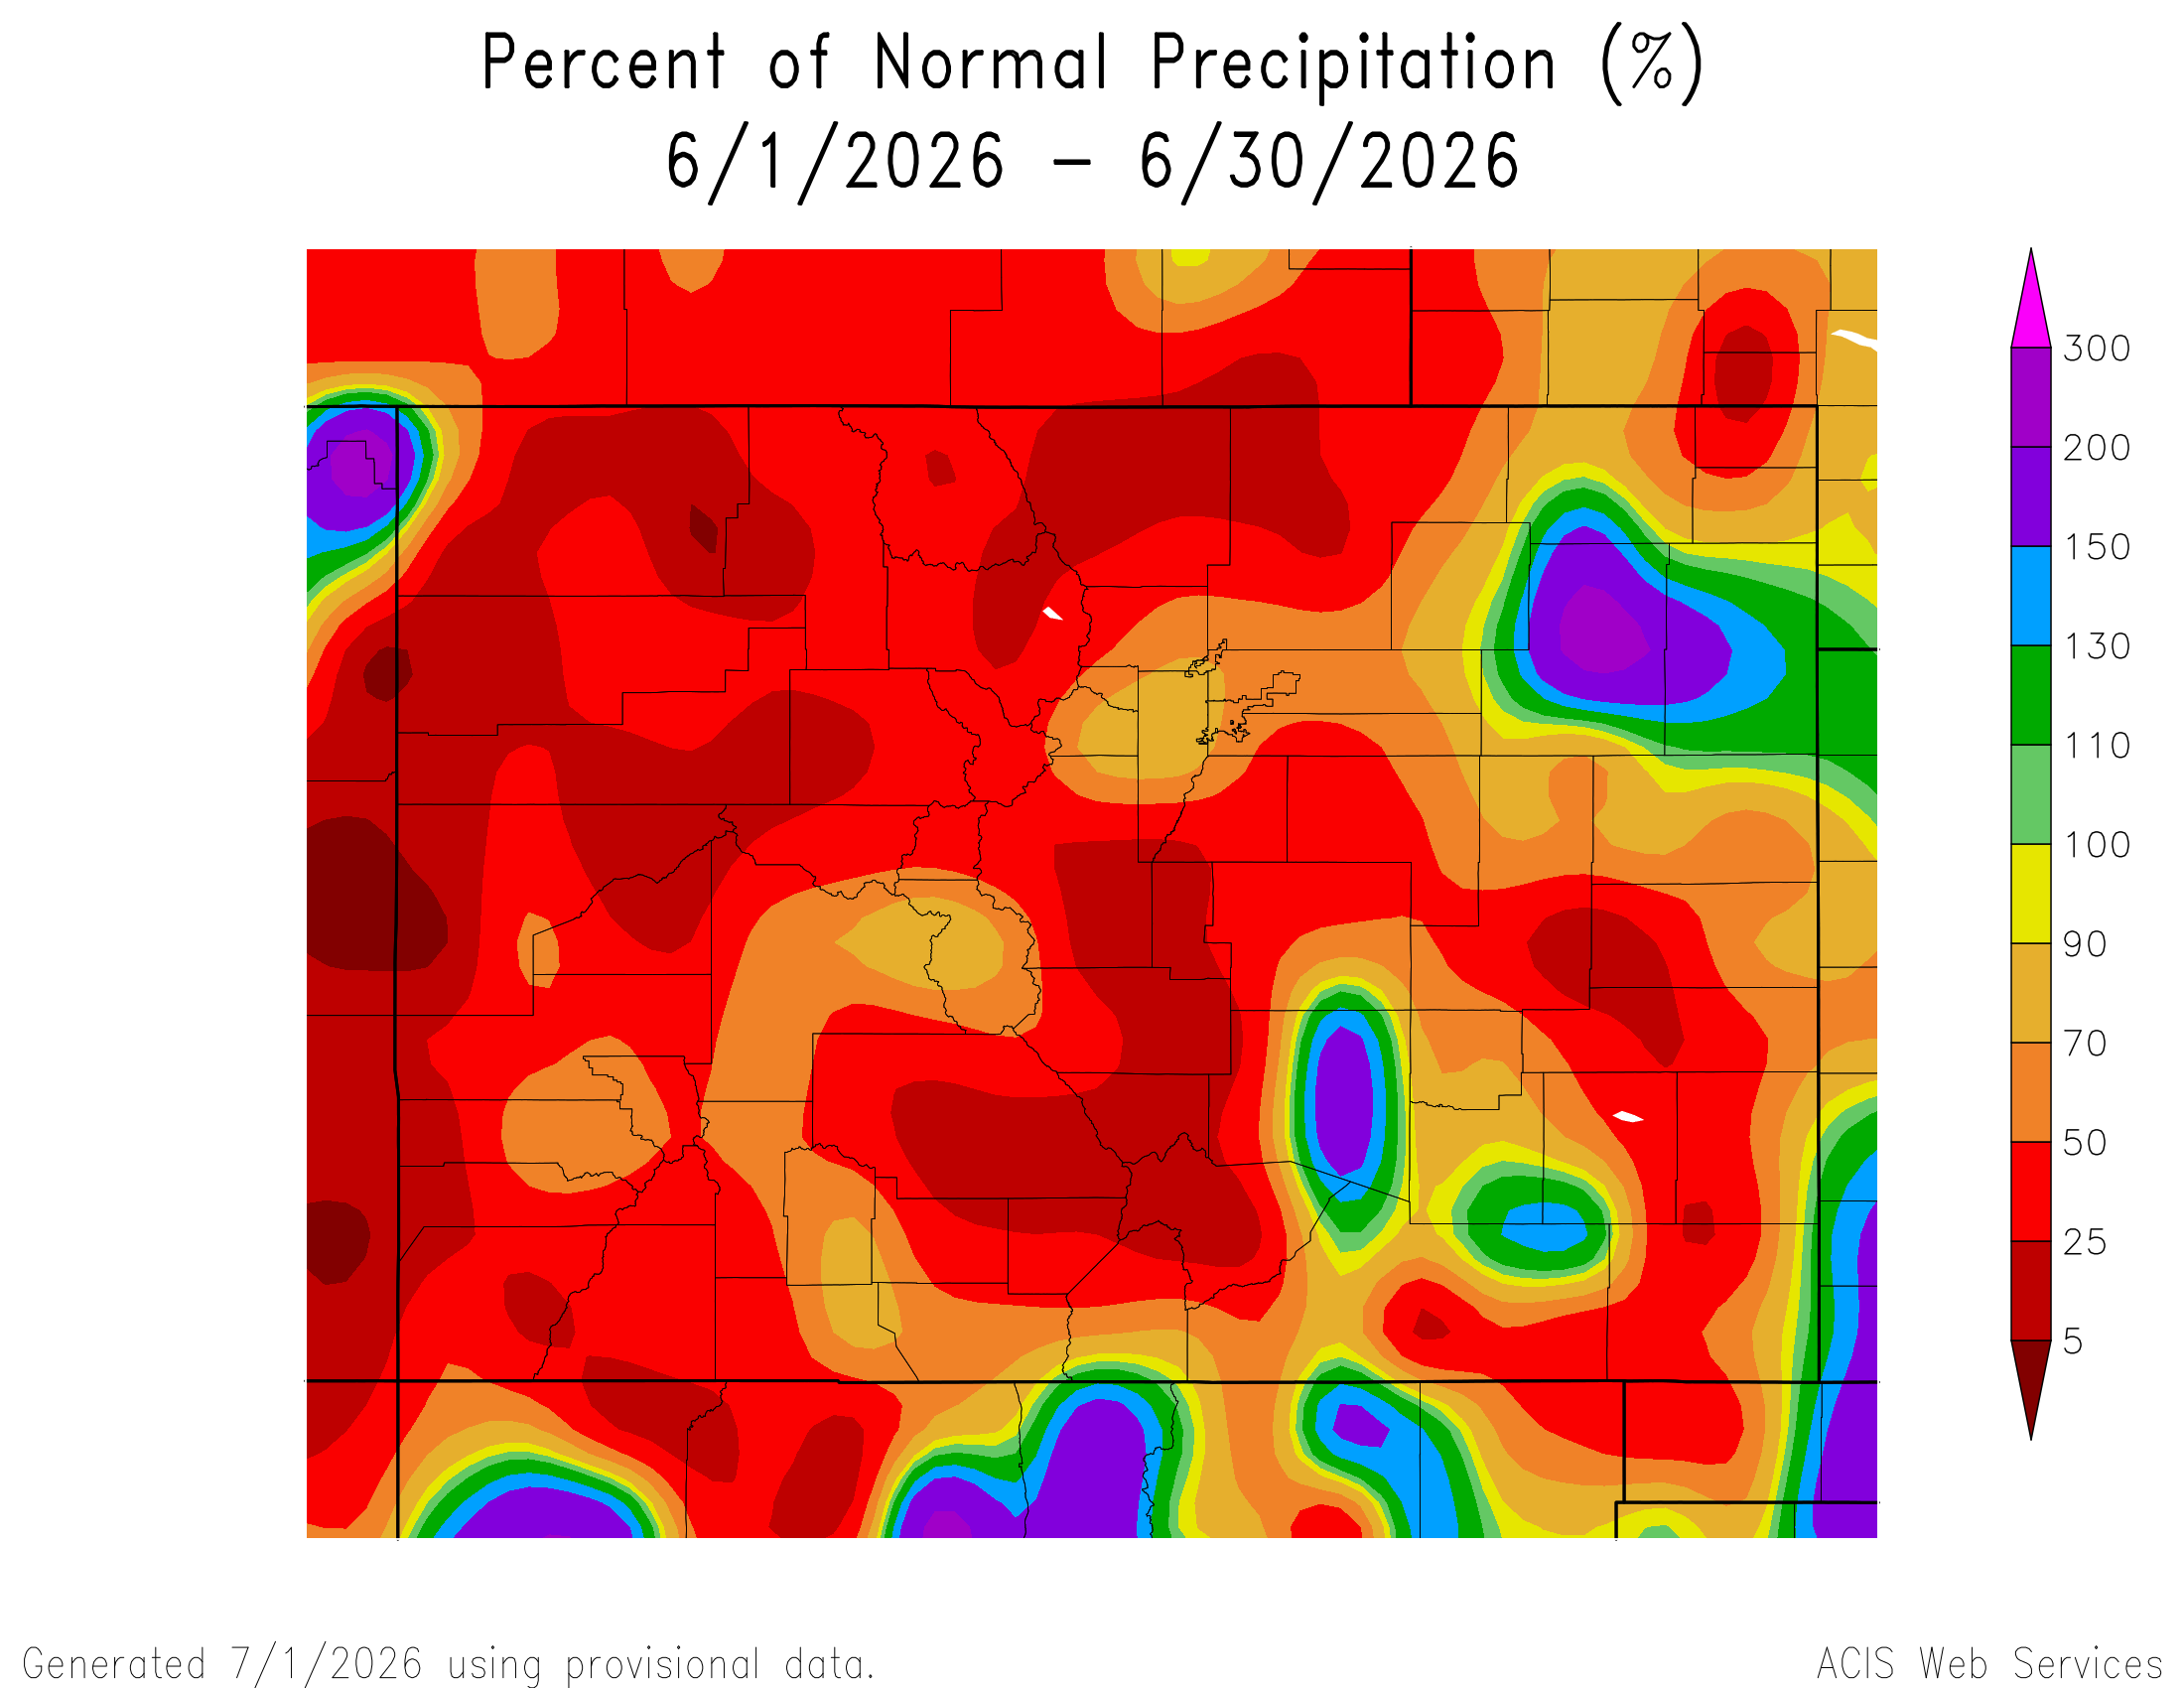
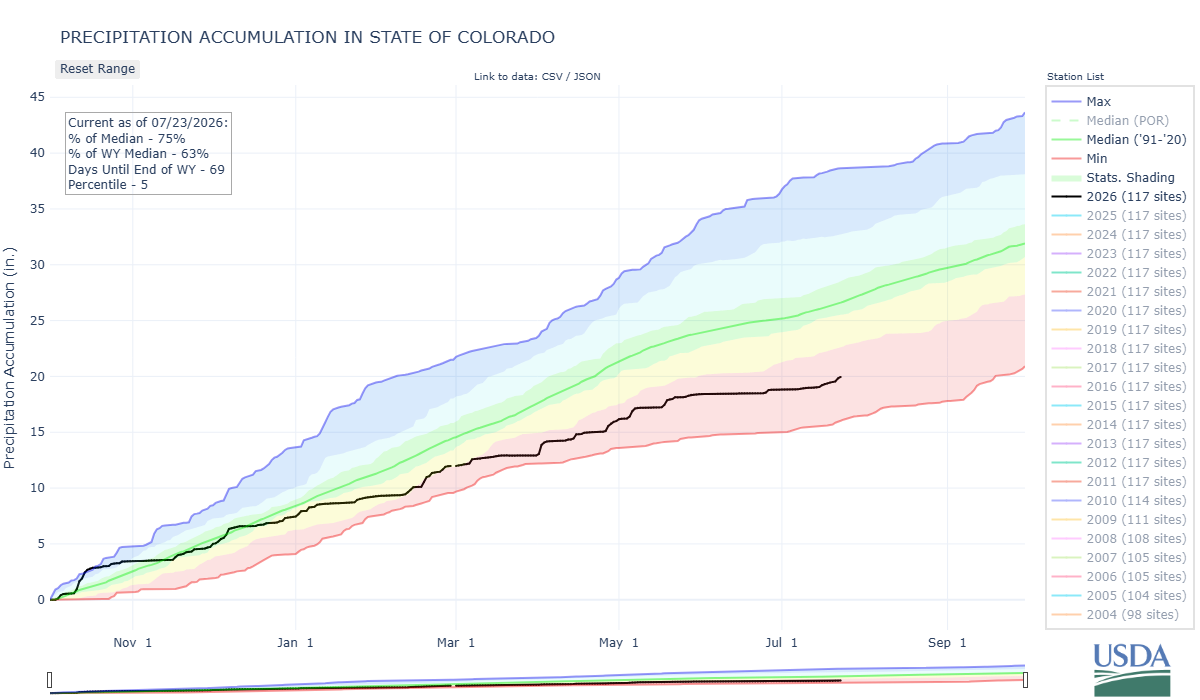
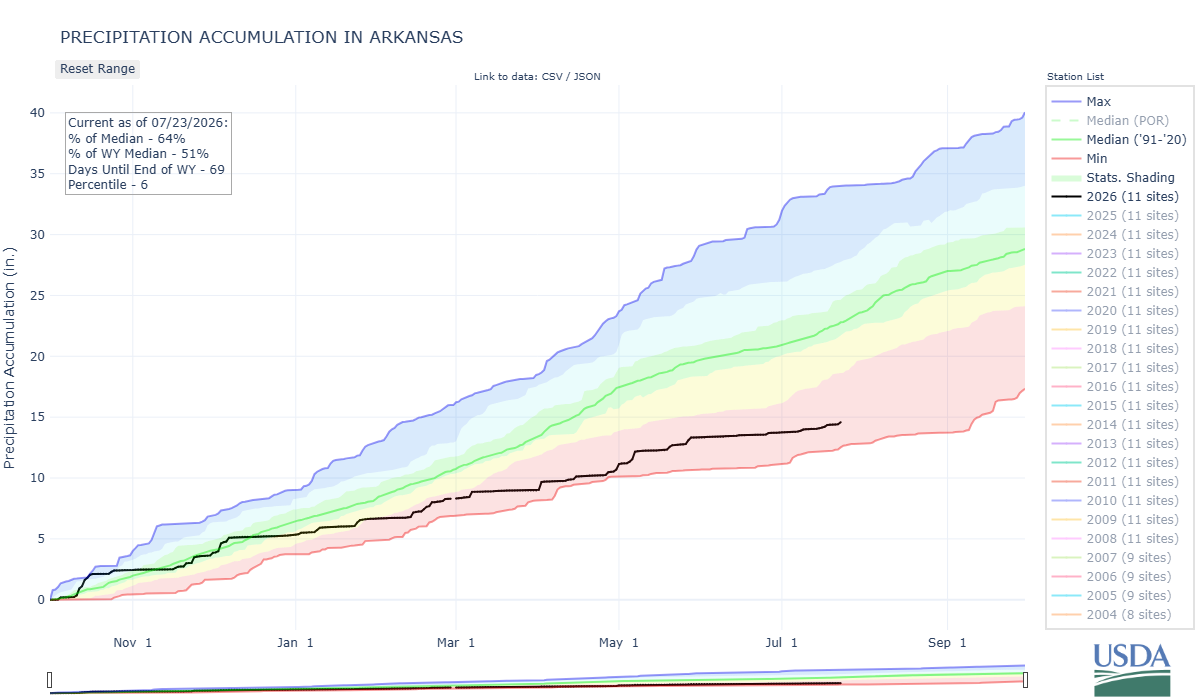
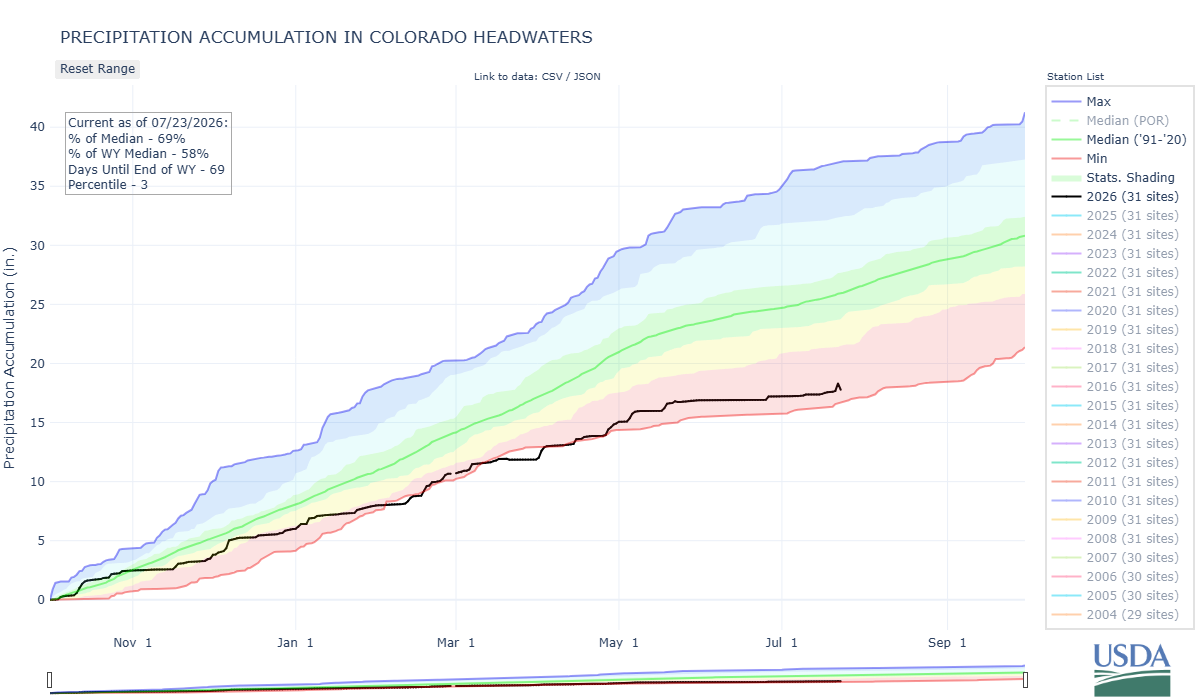
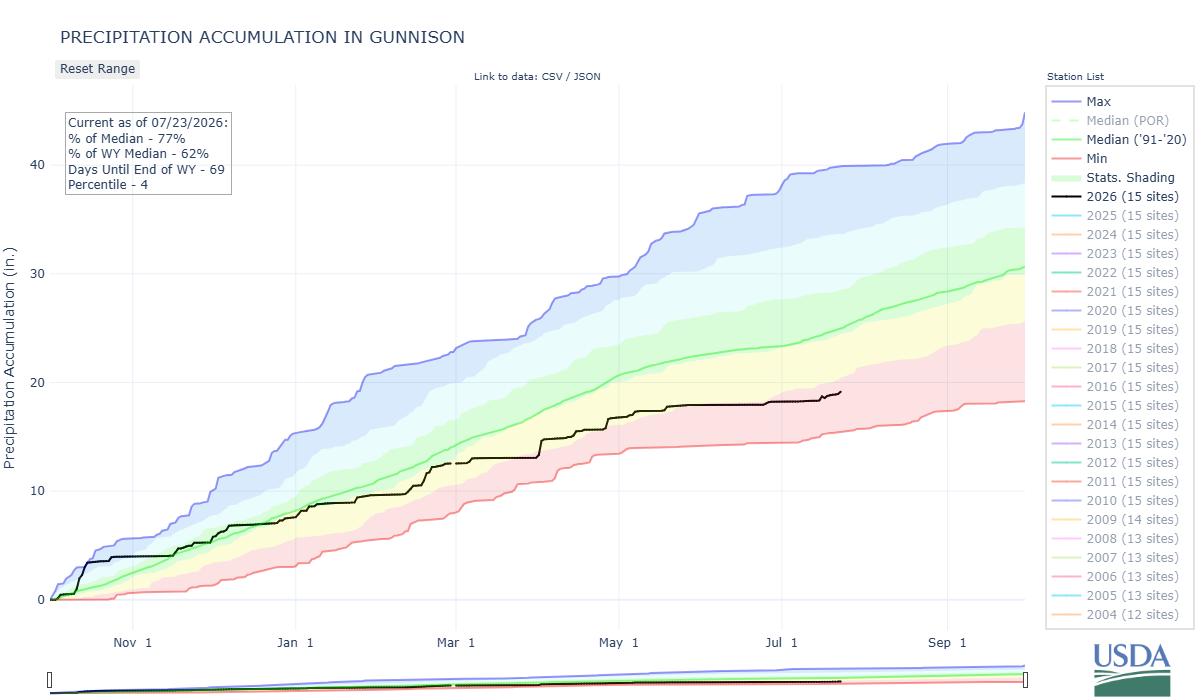
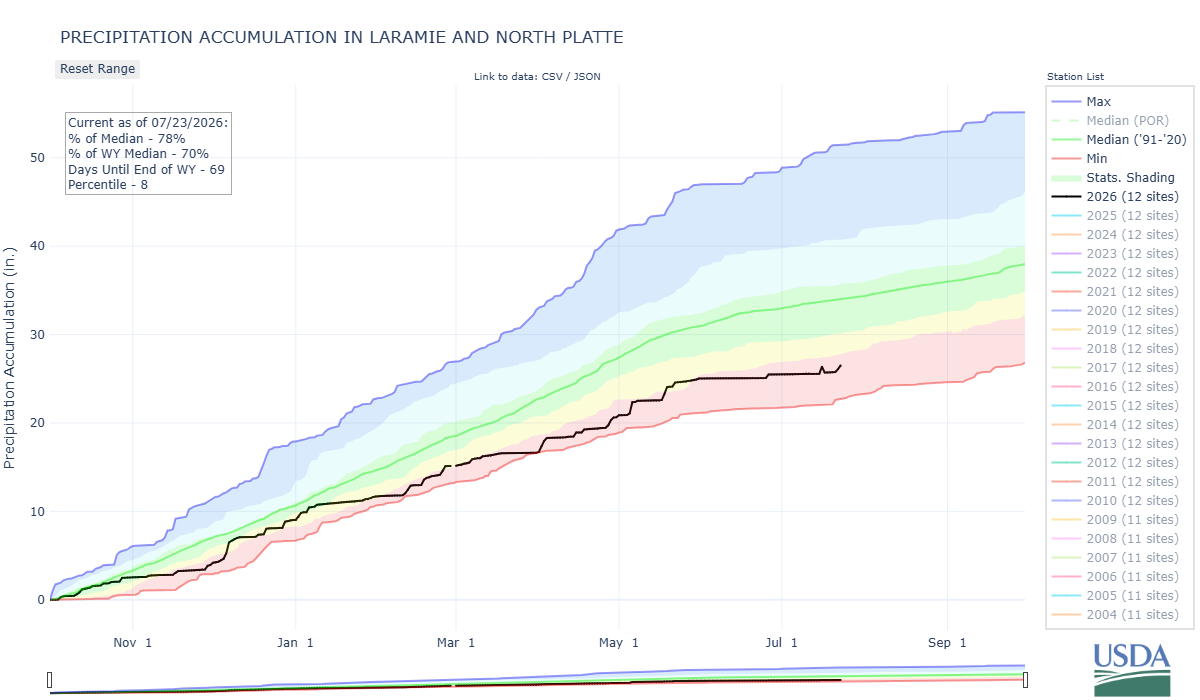
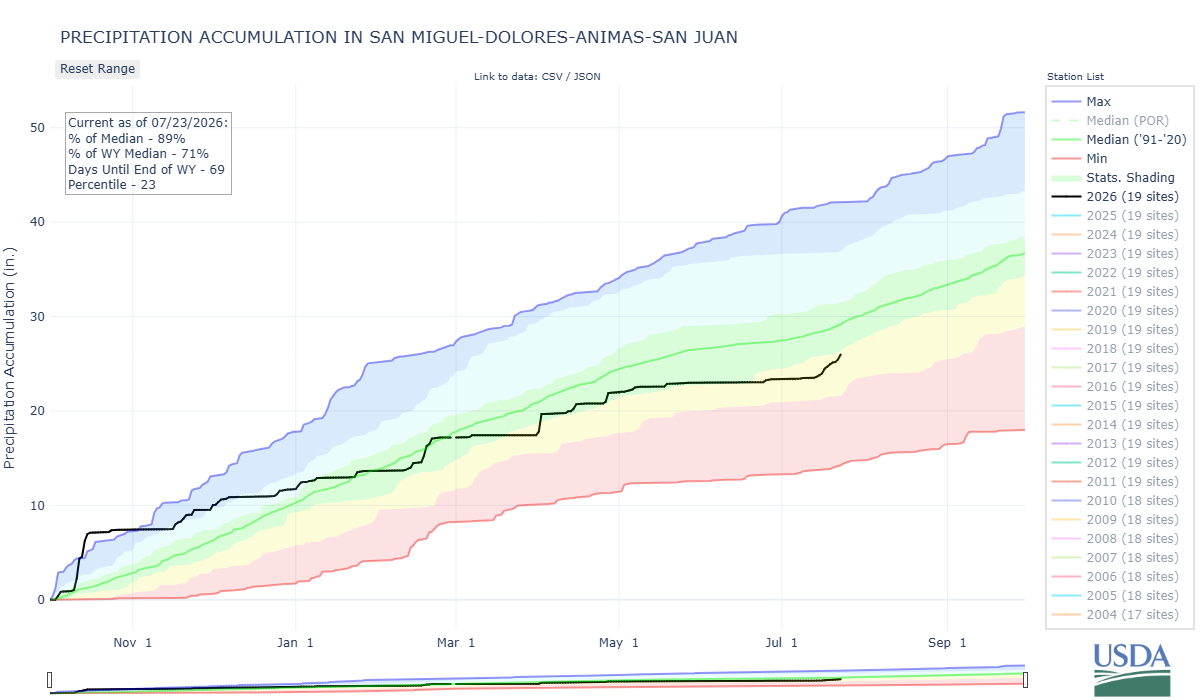
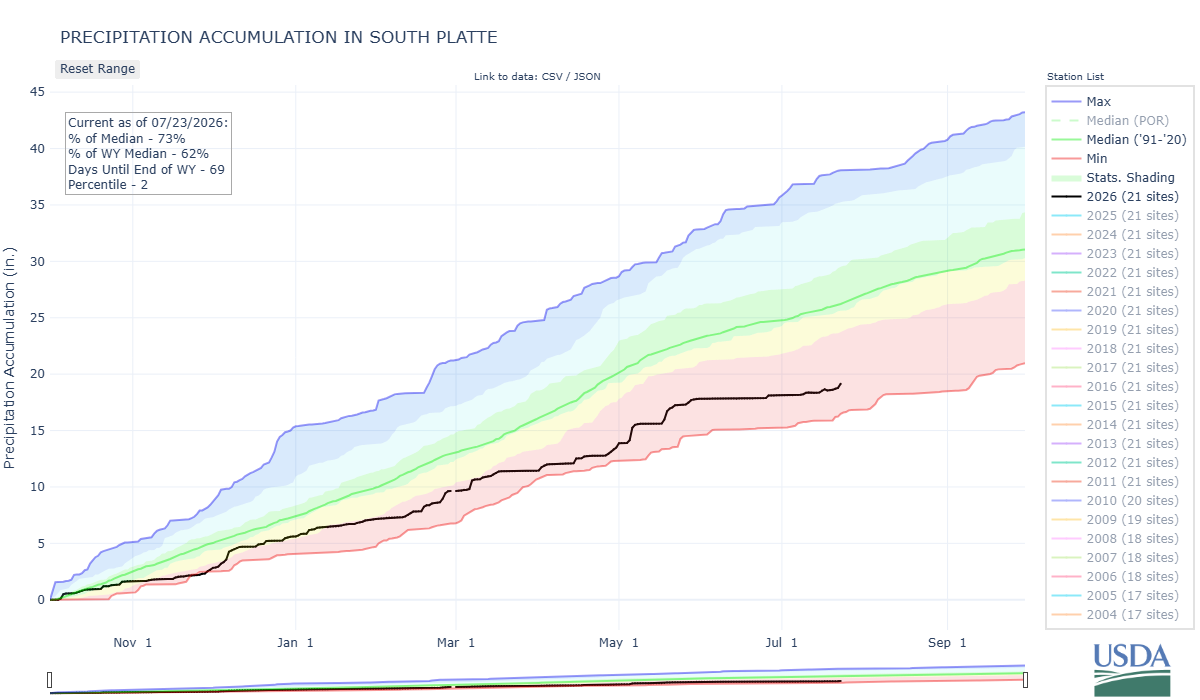
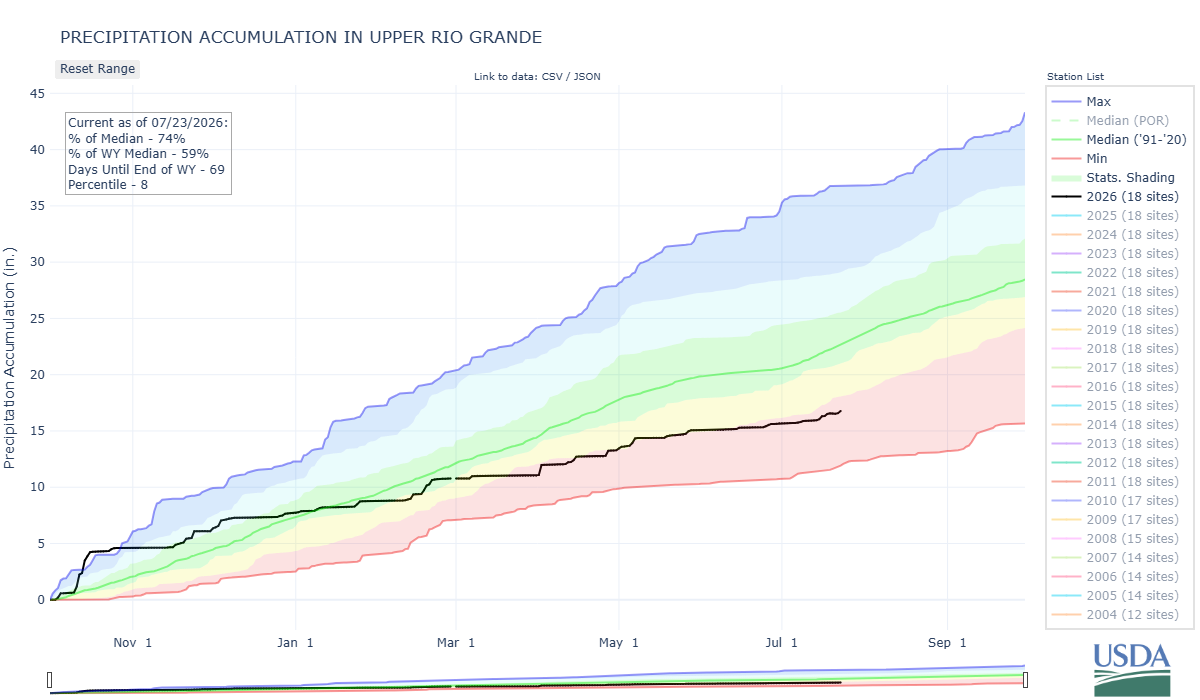
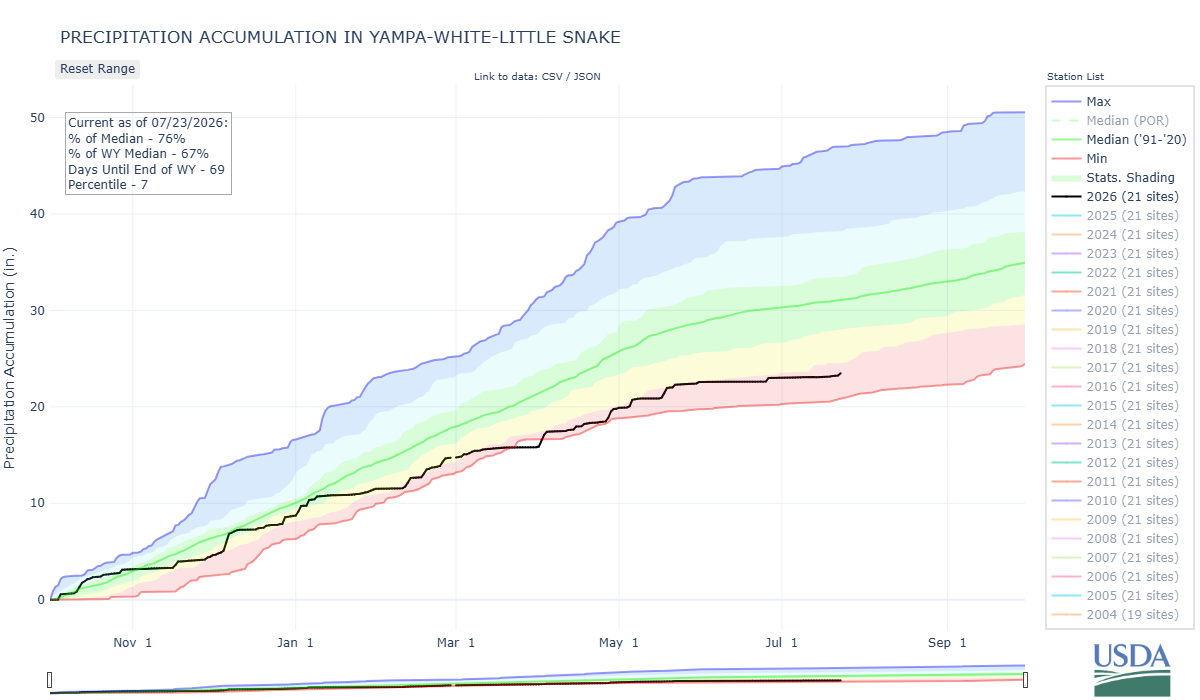
Above: In terms of precipitation, the southern basins had a strong start to the water year due to the record rain in October. The other major basins had mostly an uneventful beginning. But the entire state struggled going forward with record heat and lack of precipitation. It is not uncommon that one part of the state receives much more snow than another, but one of the things that made this year so unique is the entire state was hit equally.
SENATOR BECK STUDY BASIN DATA
This section describes conditions and data collected by the Center for Snow and Avalanche Studies at our Senator Beck Basin Study Area (SBB) at Red Mountain Pass under our Mountain System Monitoring program, which includes the Colorado Dust-on-Snow Program (CODOS). At SBB, snowpack, weather, soils, and radiation conditions are monitored and measured at the well-sheltered subalpine Swamp Angel Study Plot (SASP, 11,060’) and at the more exposed, alpine Senator Beck Study Plot (SBSP, 12,180’). Nearby, wind speed, wind direction, air temperature, and humidity data are collected at the Putney Study Plot (PTSP, 12,323’), located to minimize the influence of local terrain on those measurements. Finally, SBB streamflow discharge is continuously measured at the SBB pour point at the Senator Beck Stream Gauge (SBSG, 11,030’), in a broad-crested, notched weir.
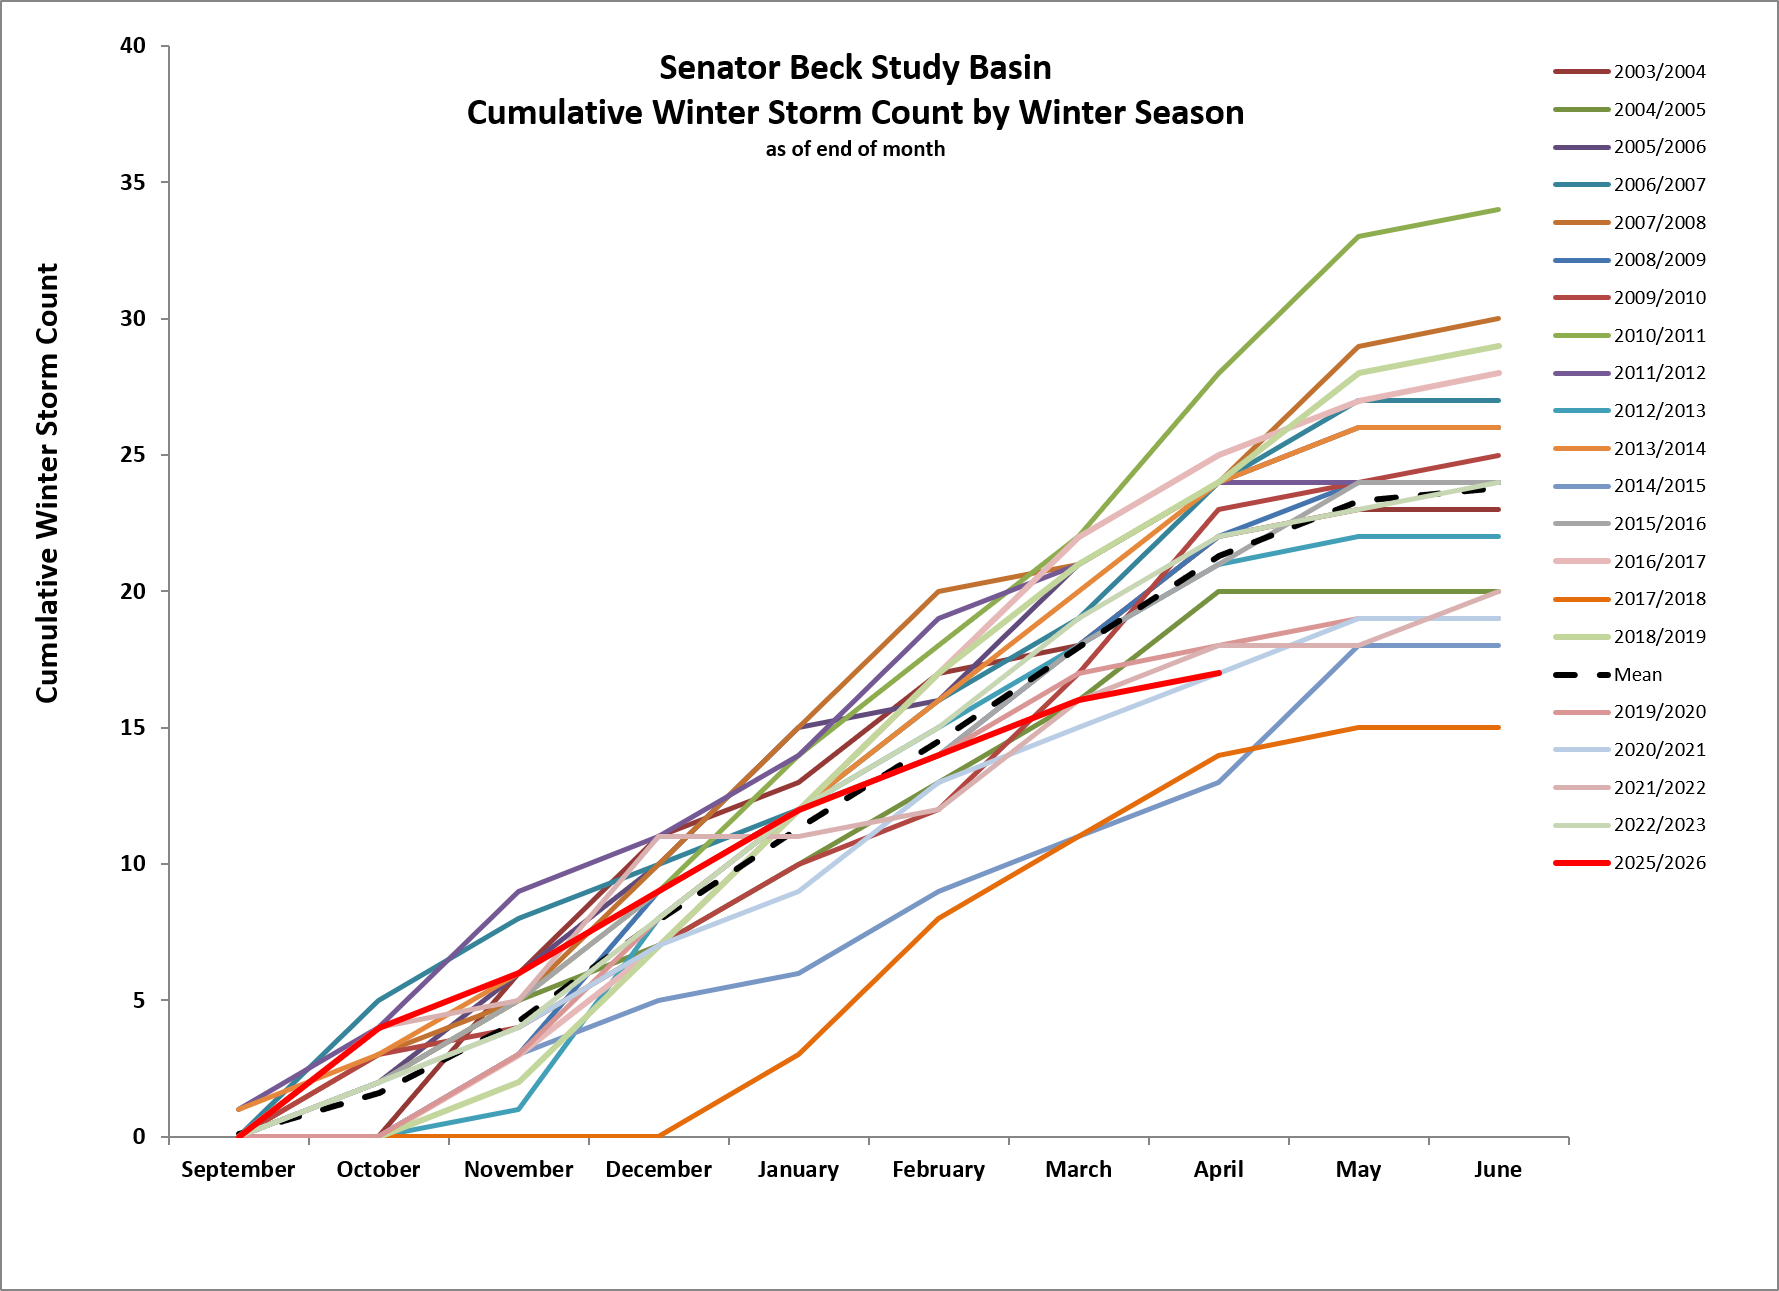
Above: All total we received 17 storms, just under average for our season. A storm is defined as receiving 12 mm (0.5”) or more of precipitation with no break in precipitation greater than 12 hours. Winter storm reports can be viewed at the snowstudies.org website.
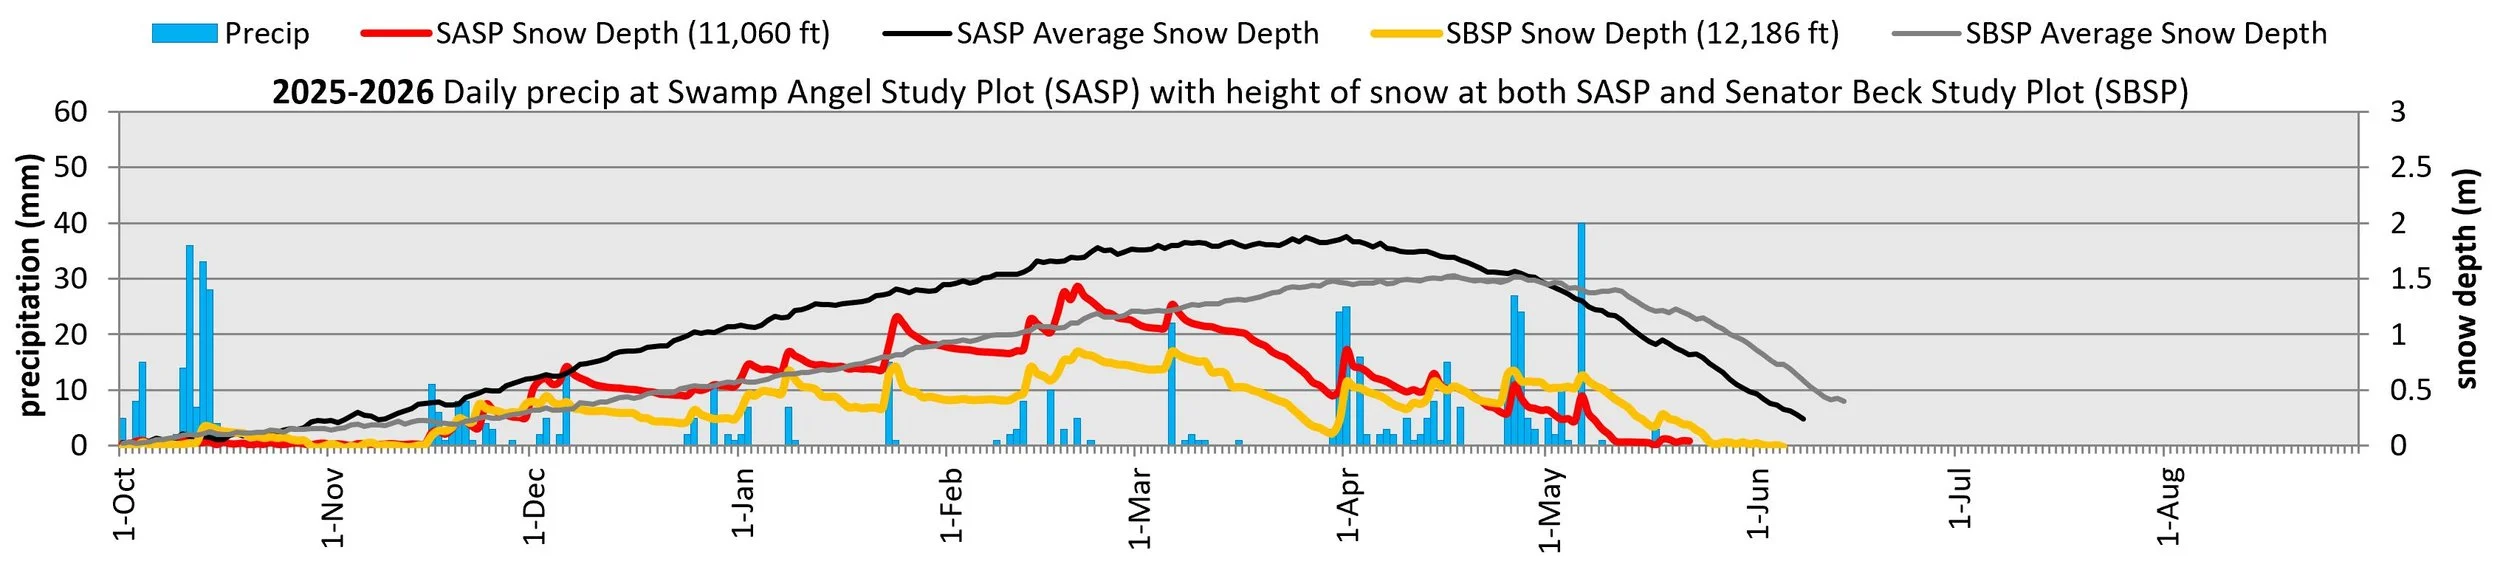
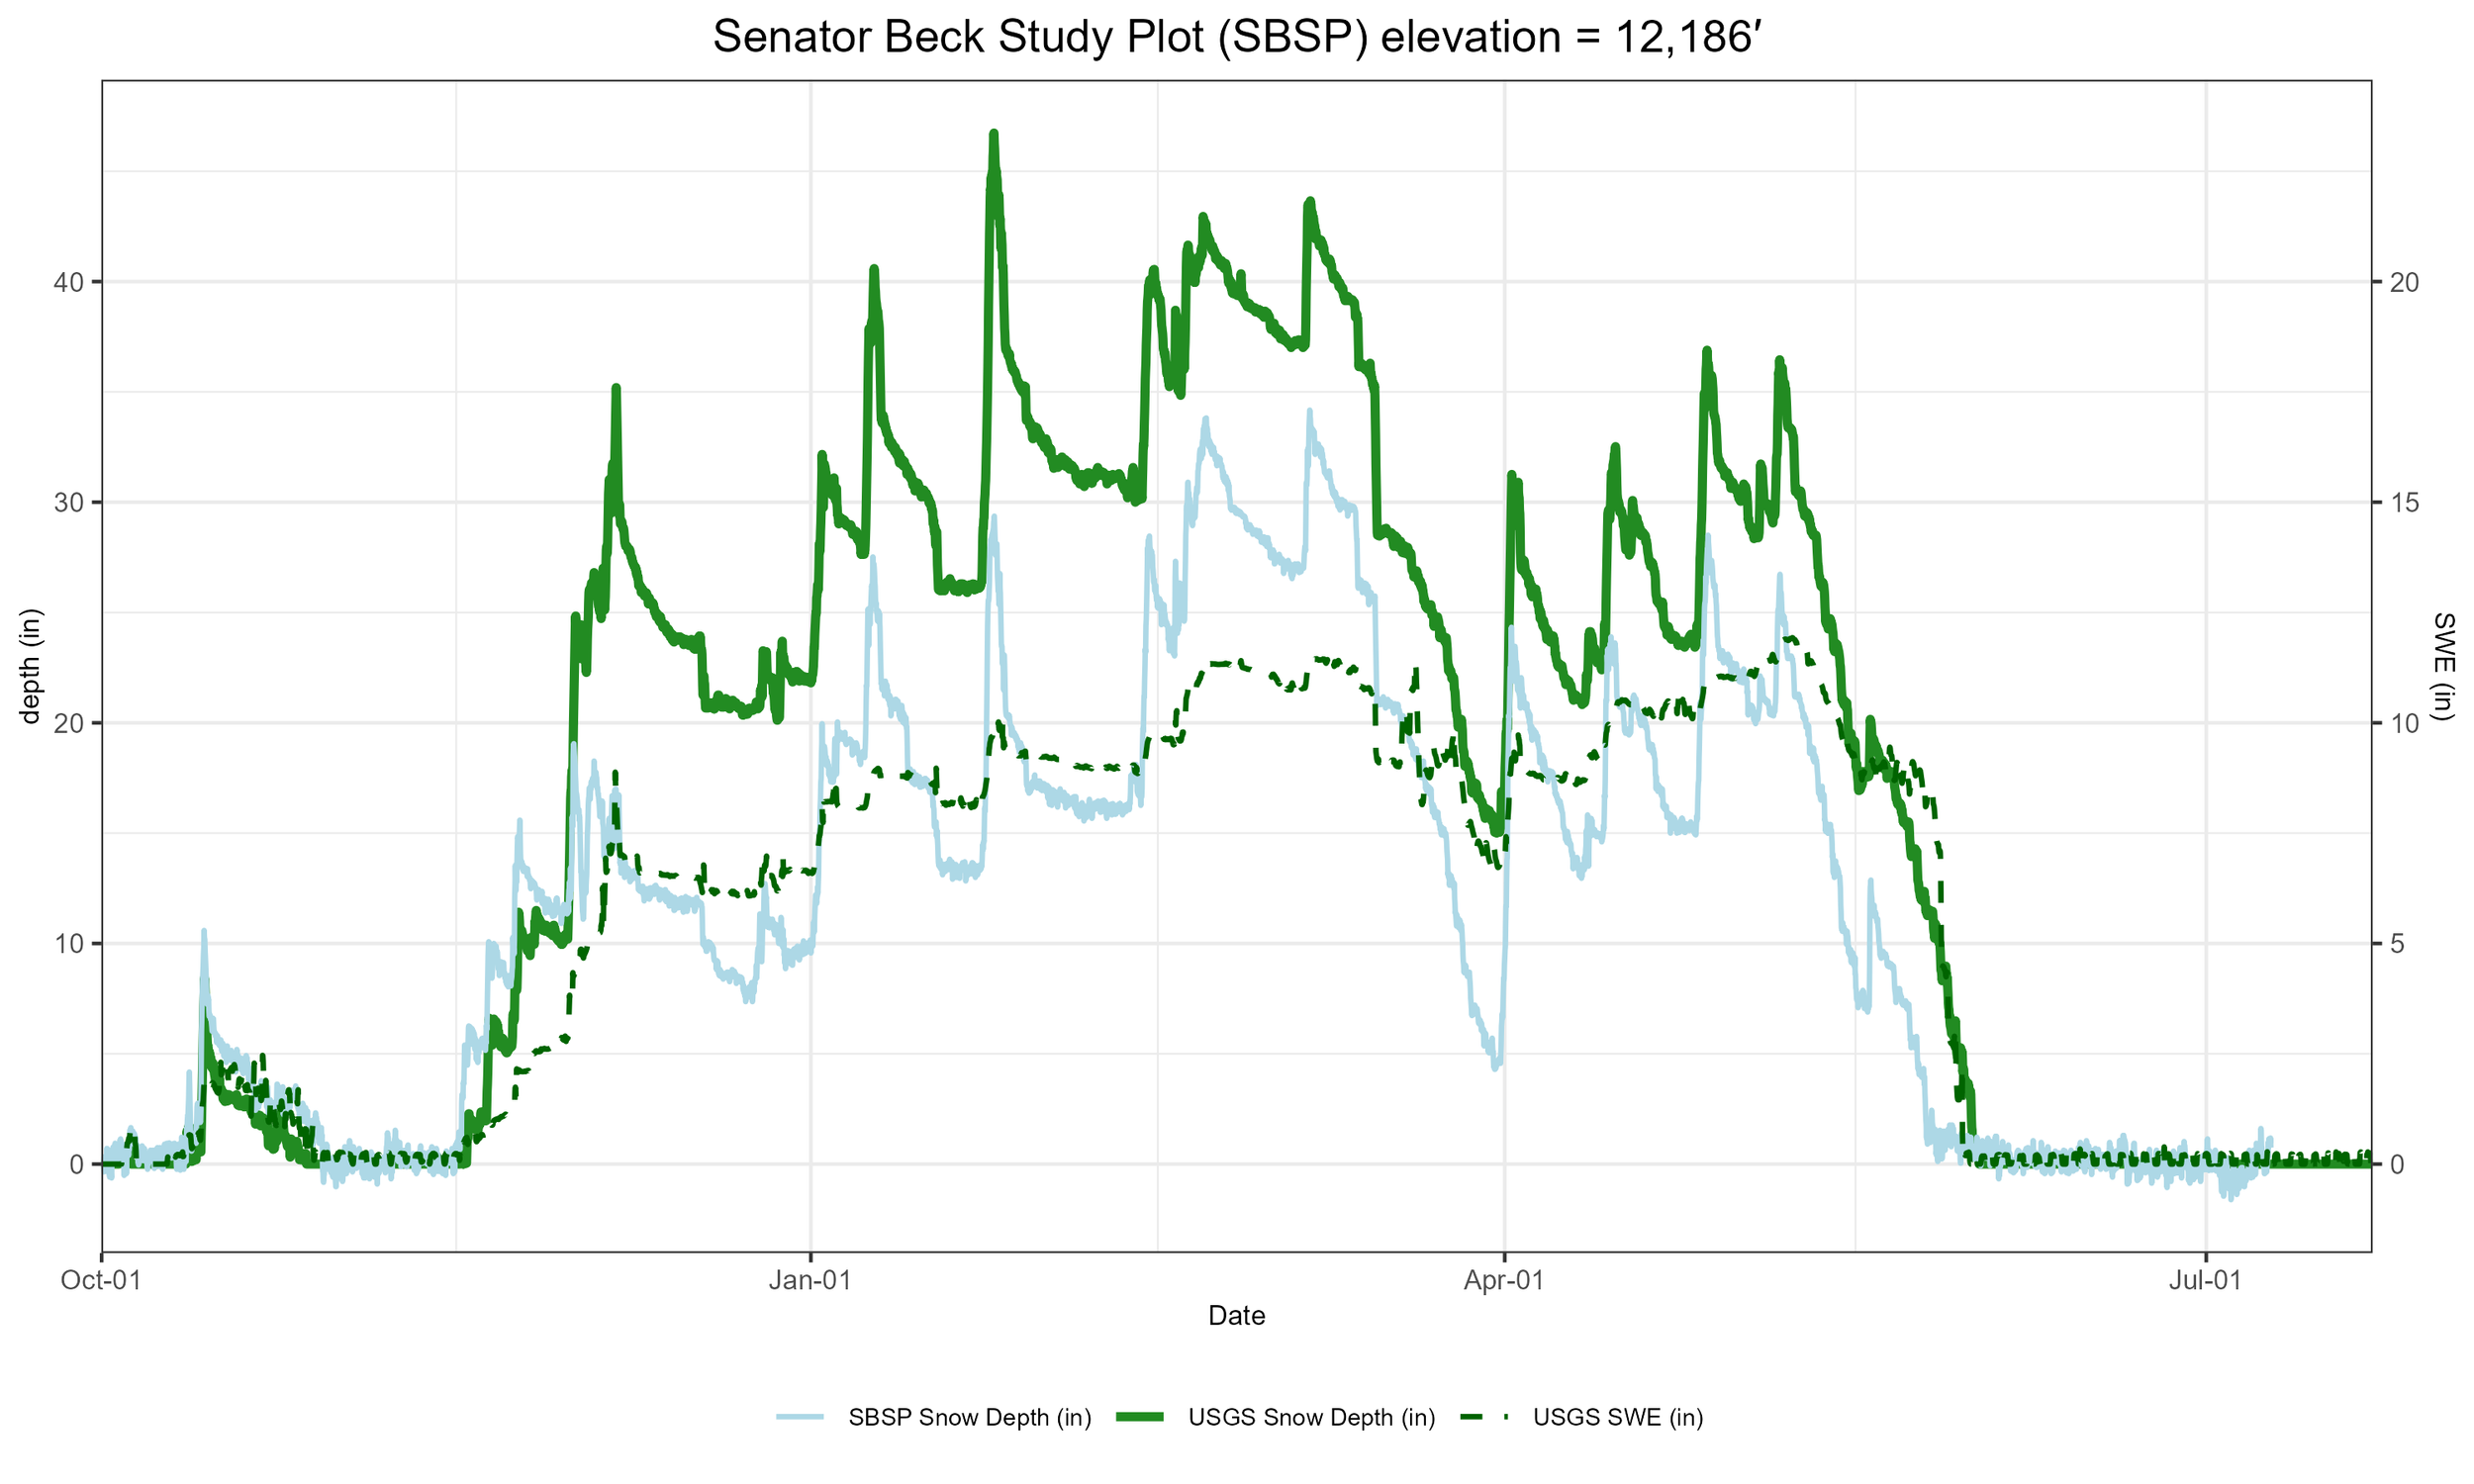
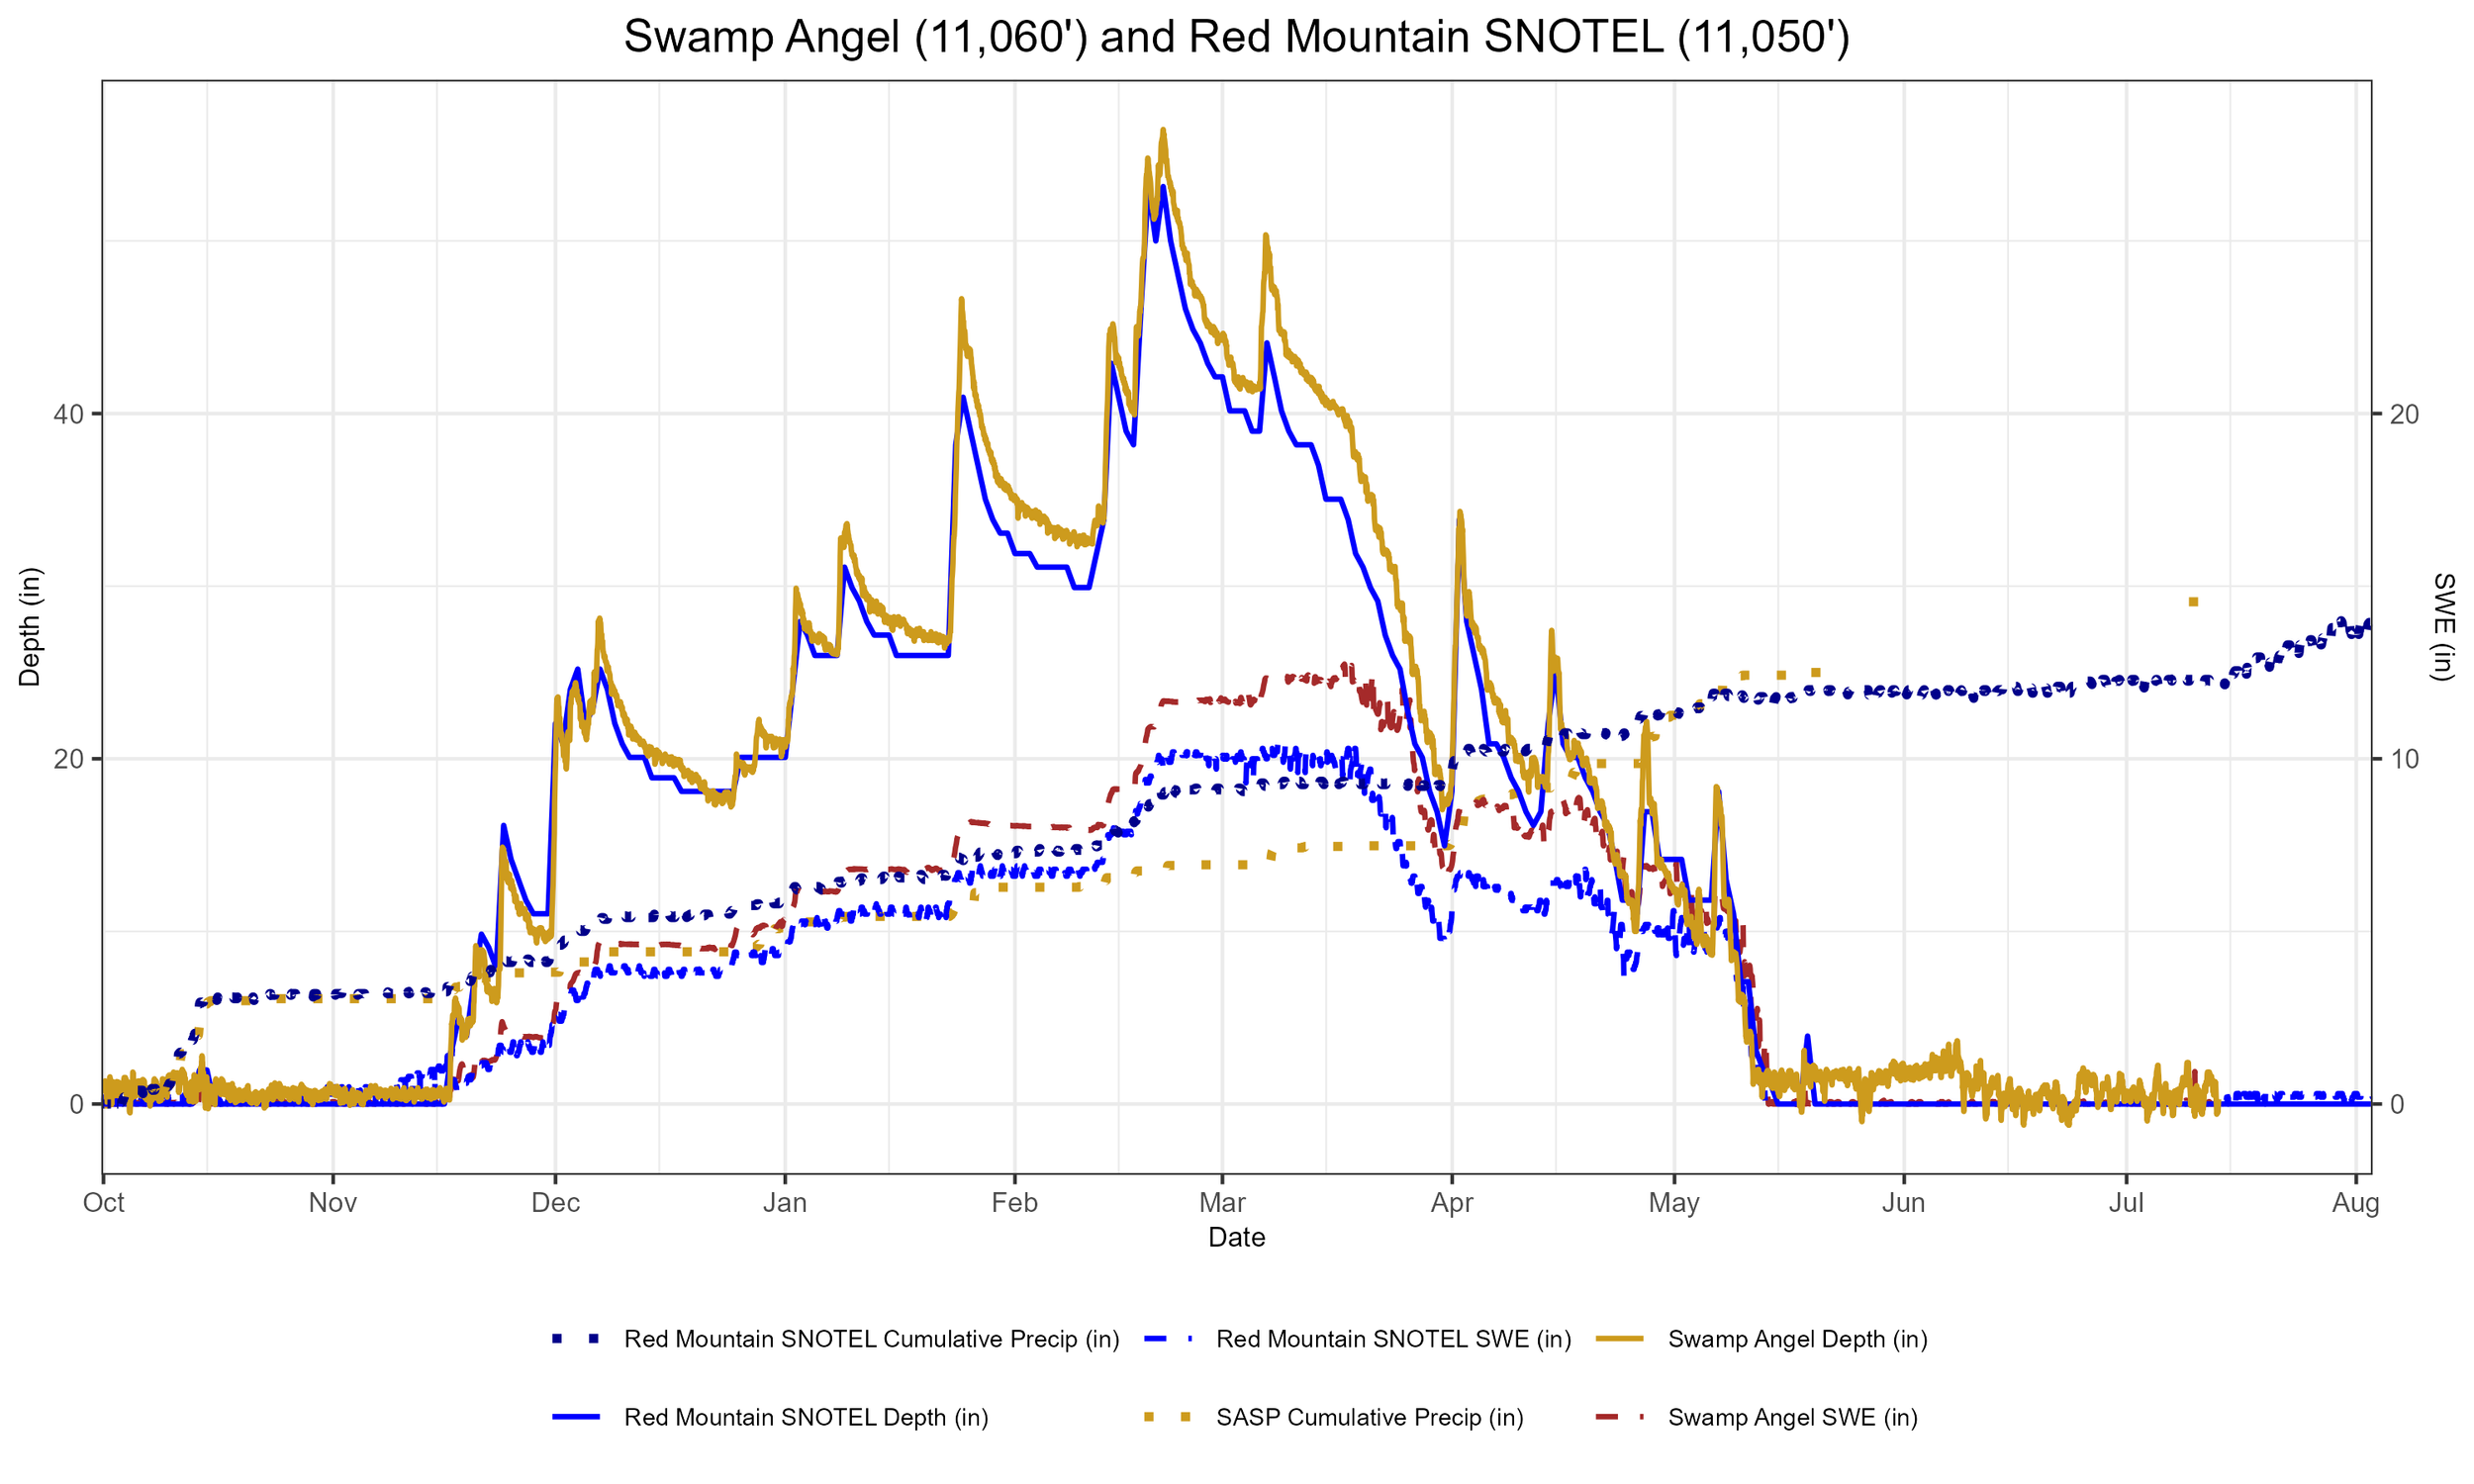
Above: The above graph shows precipitation at SASP with snow depth at SASP and SBSP. Early precipitation helped soil moisture in the southern basins, but the months that followed were a struggle. April was the month that was closest to normal for the western third of the state.
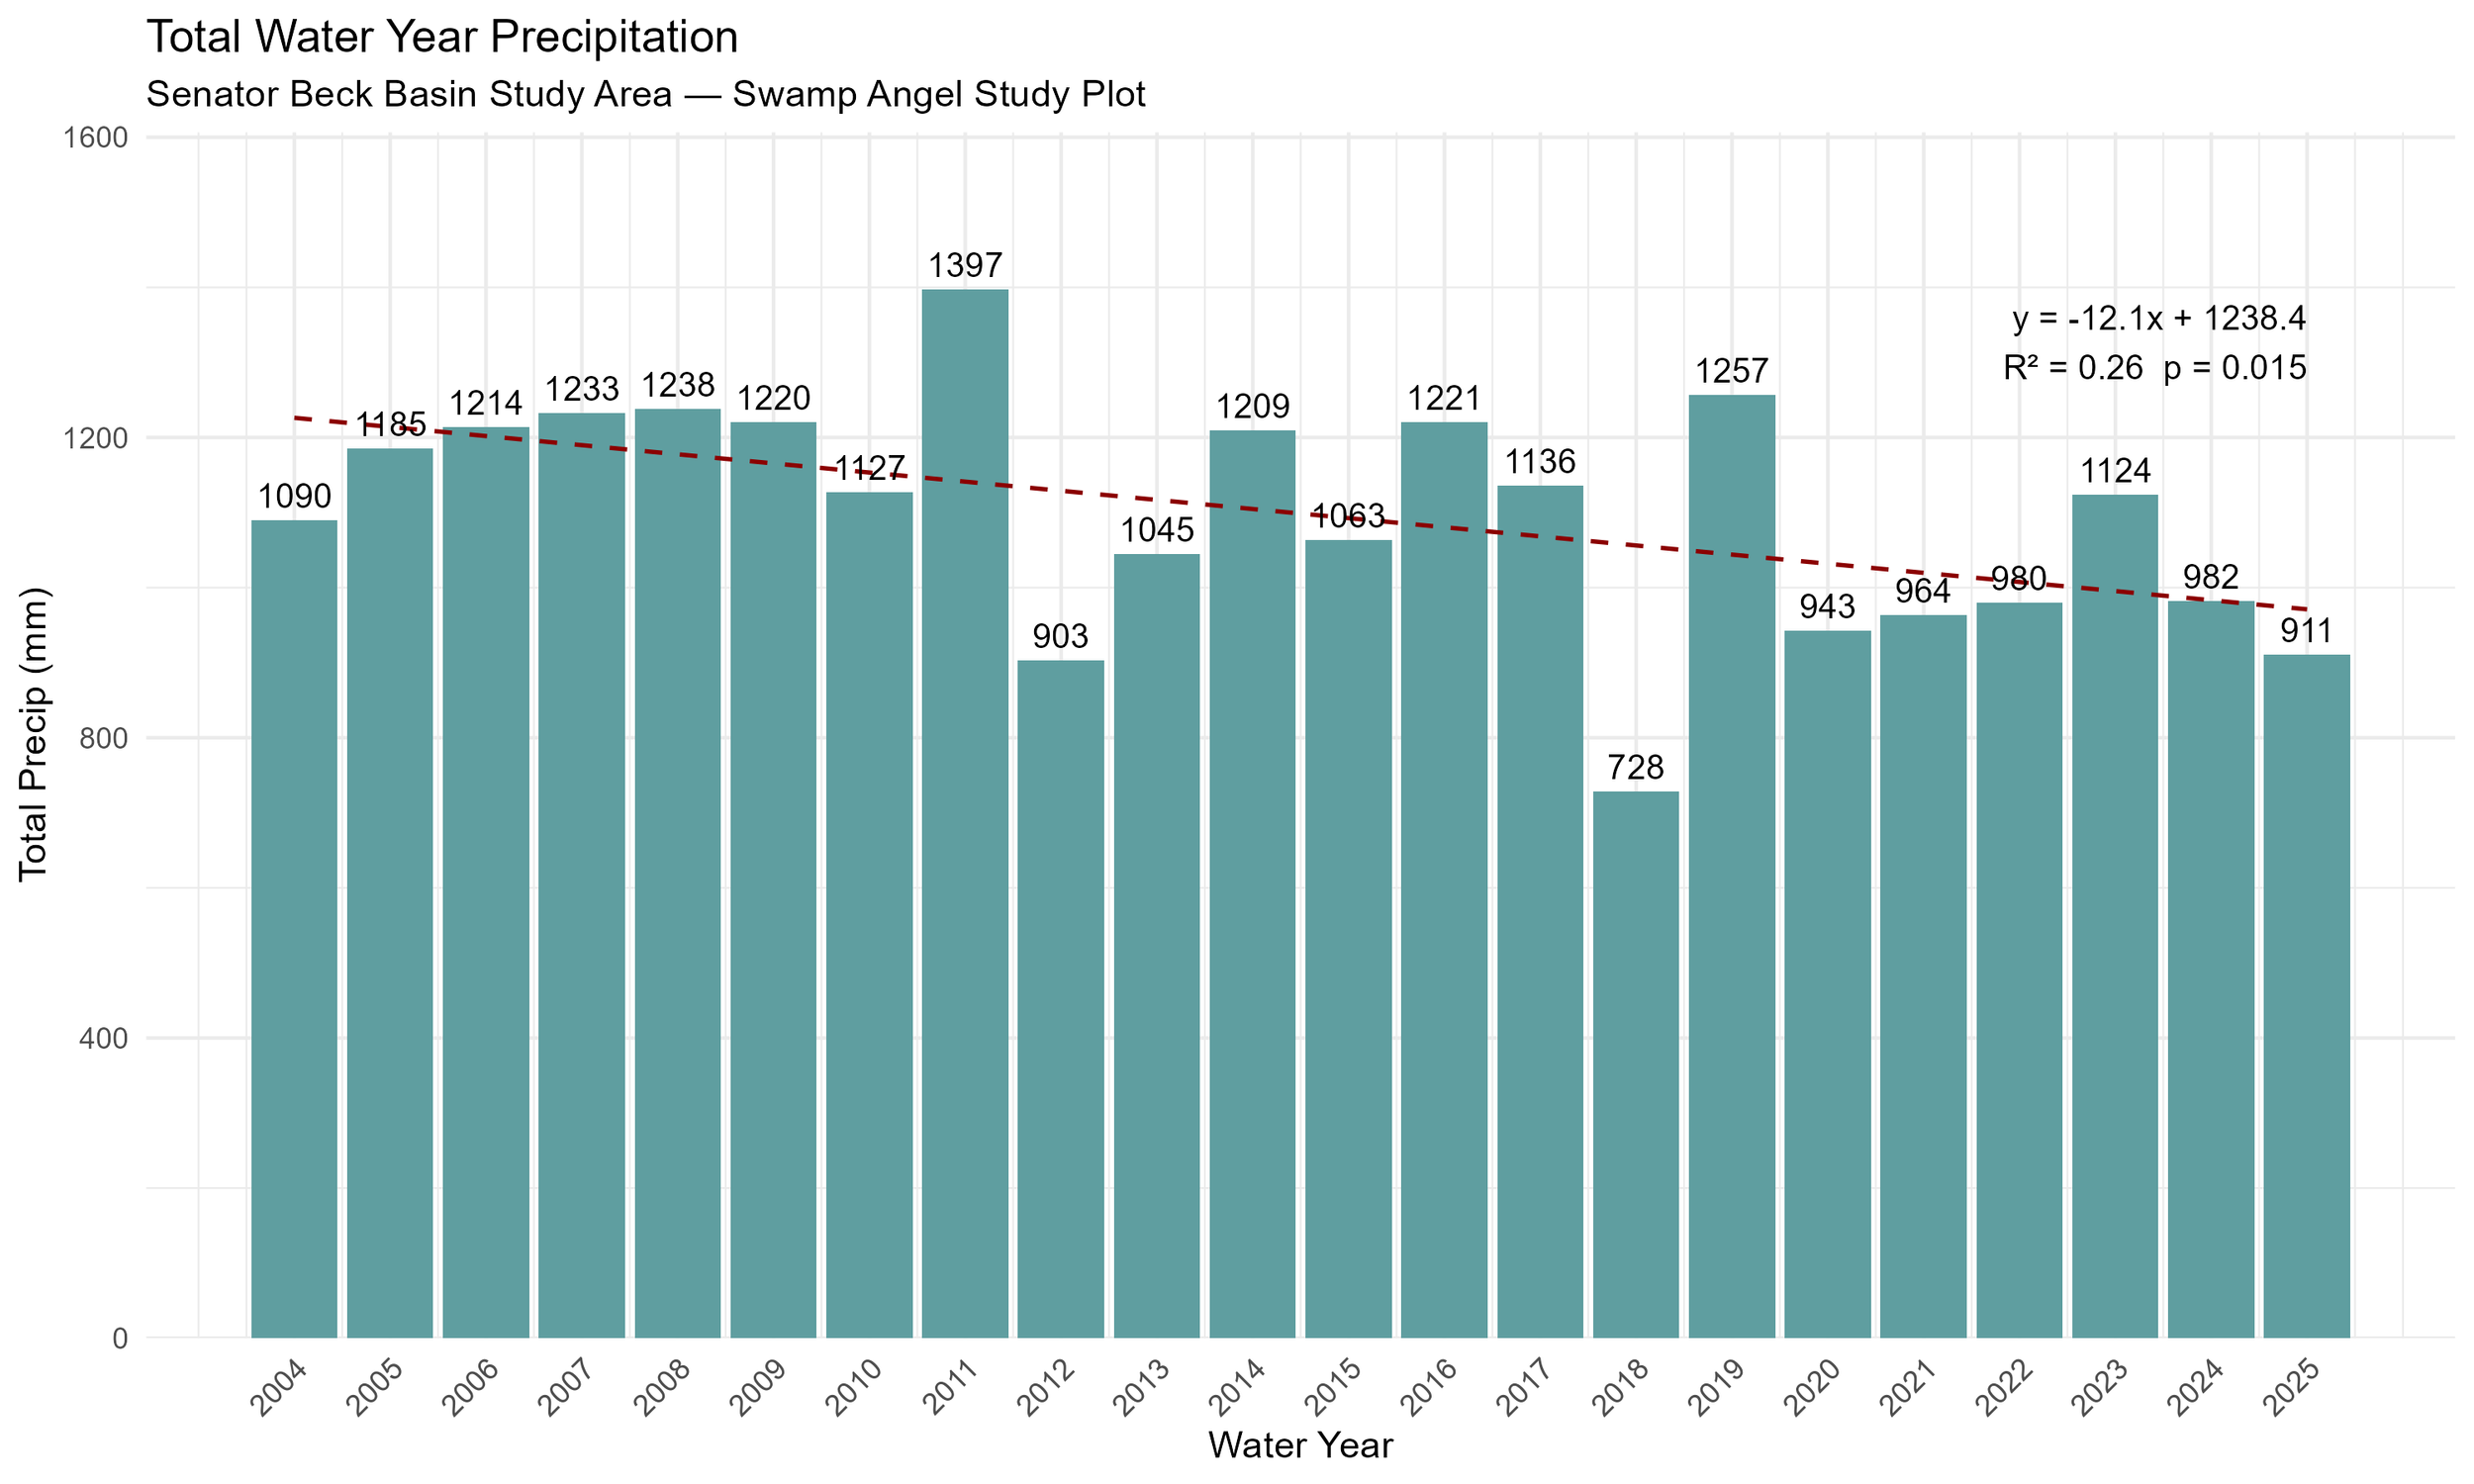
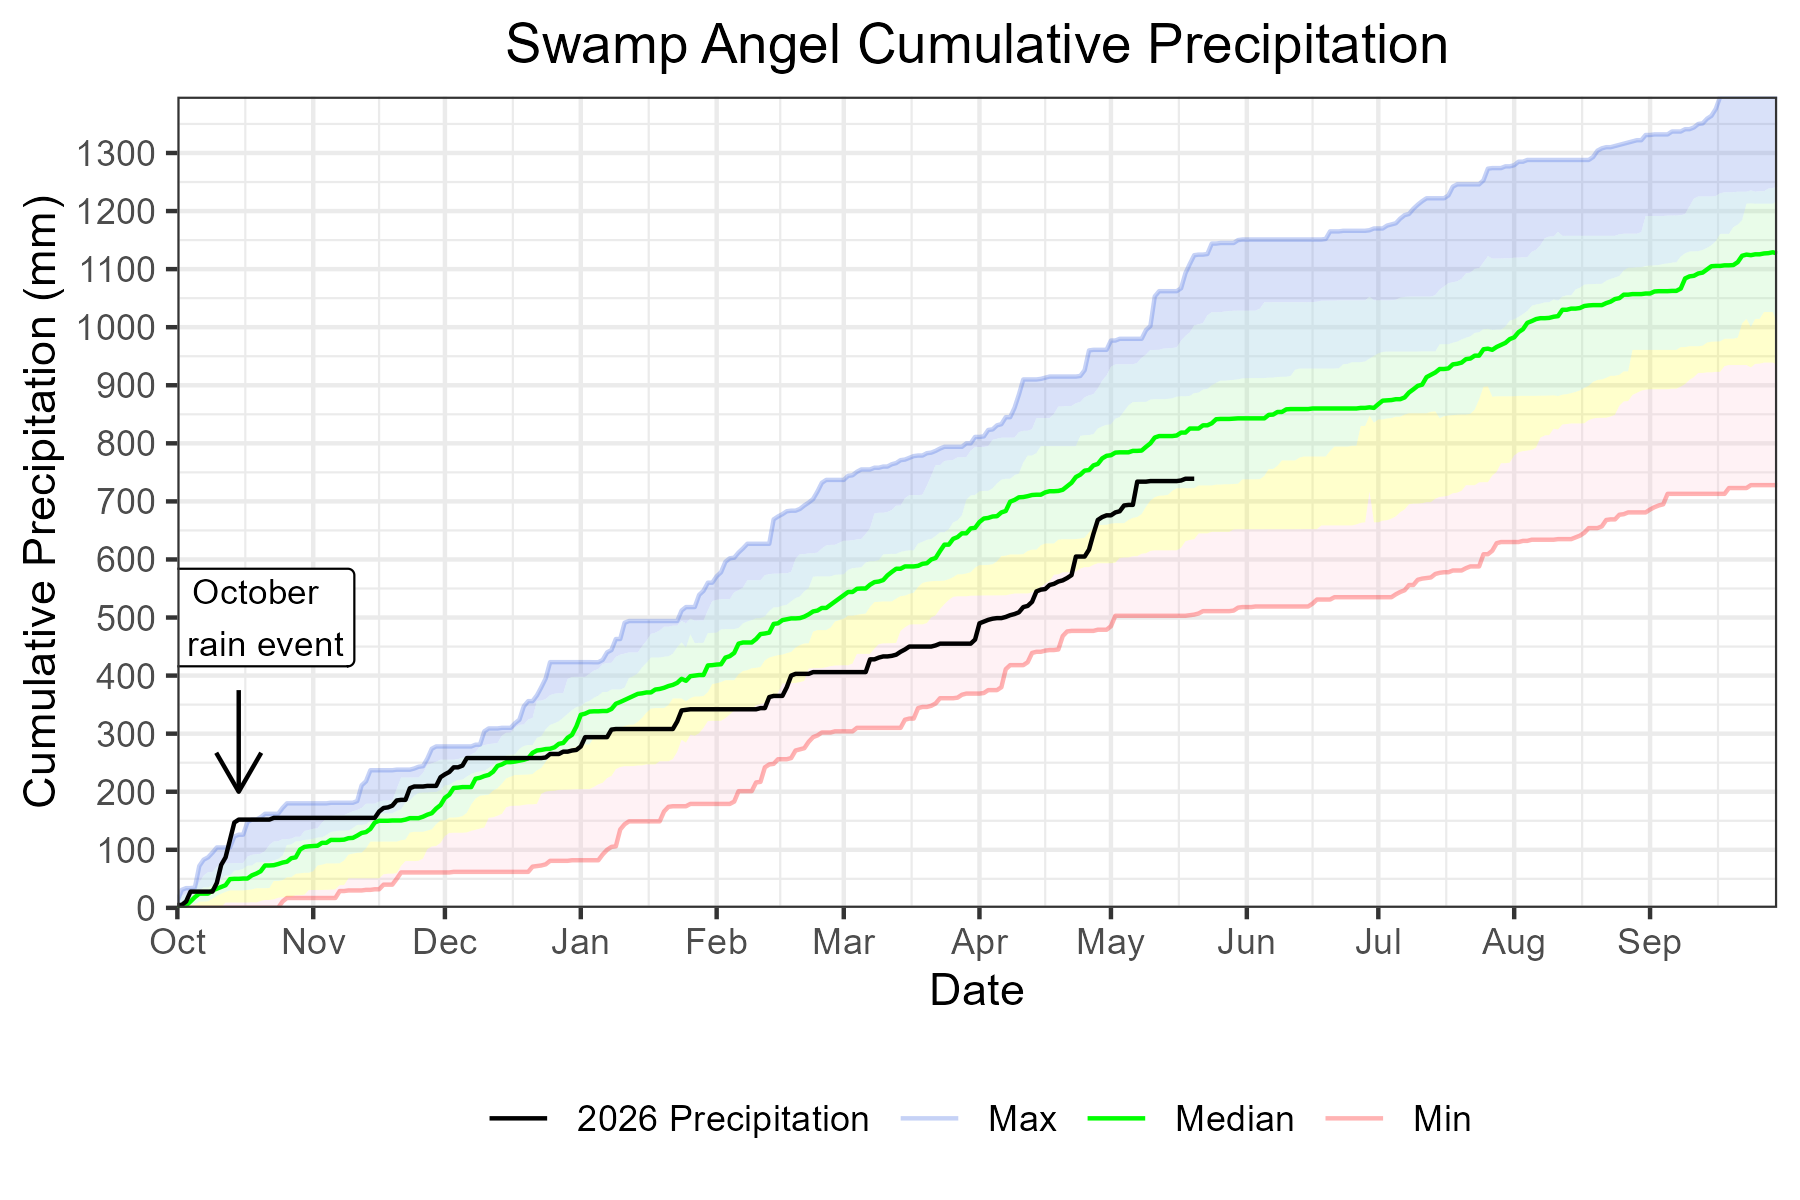
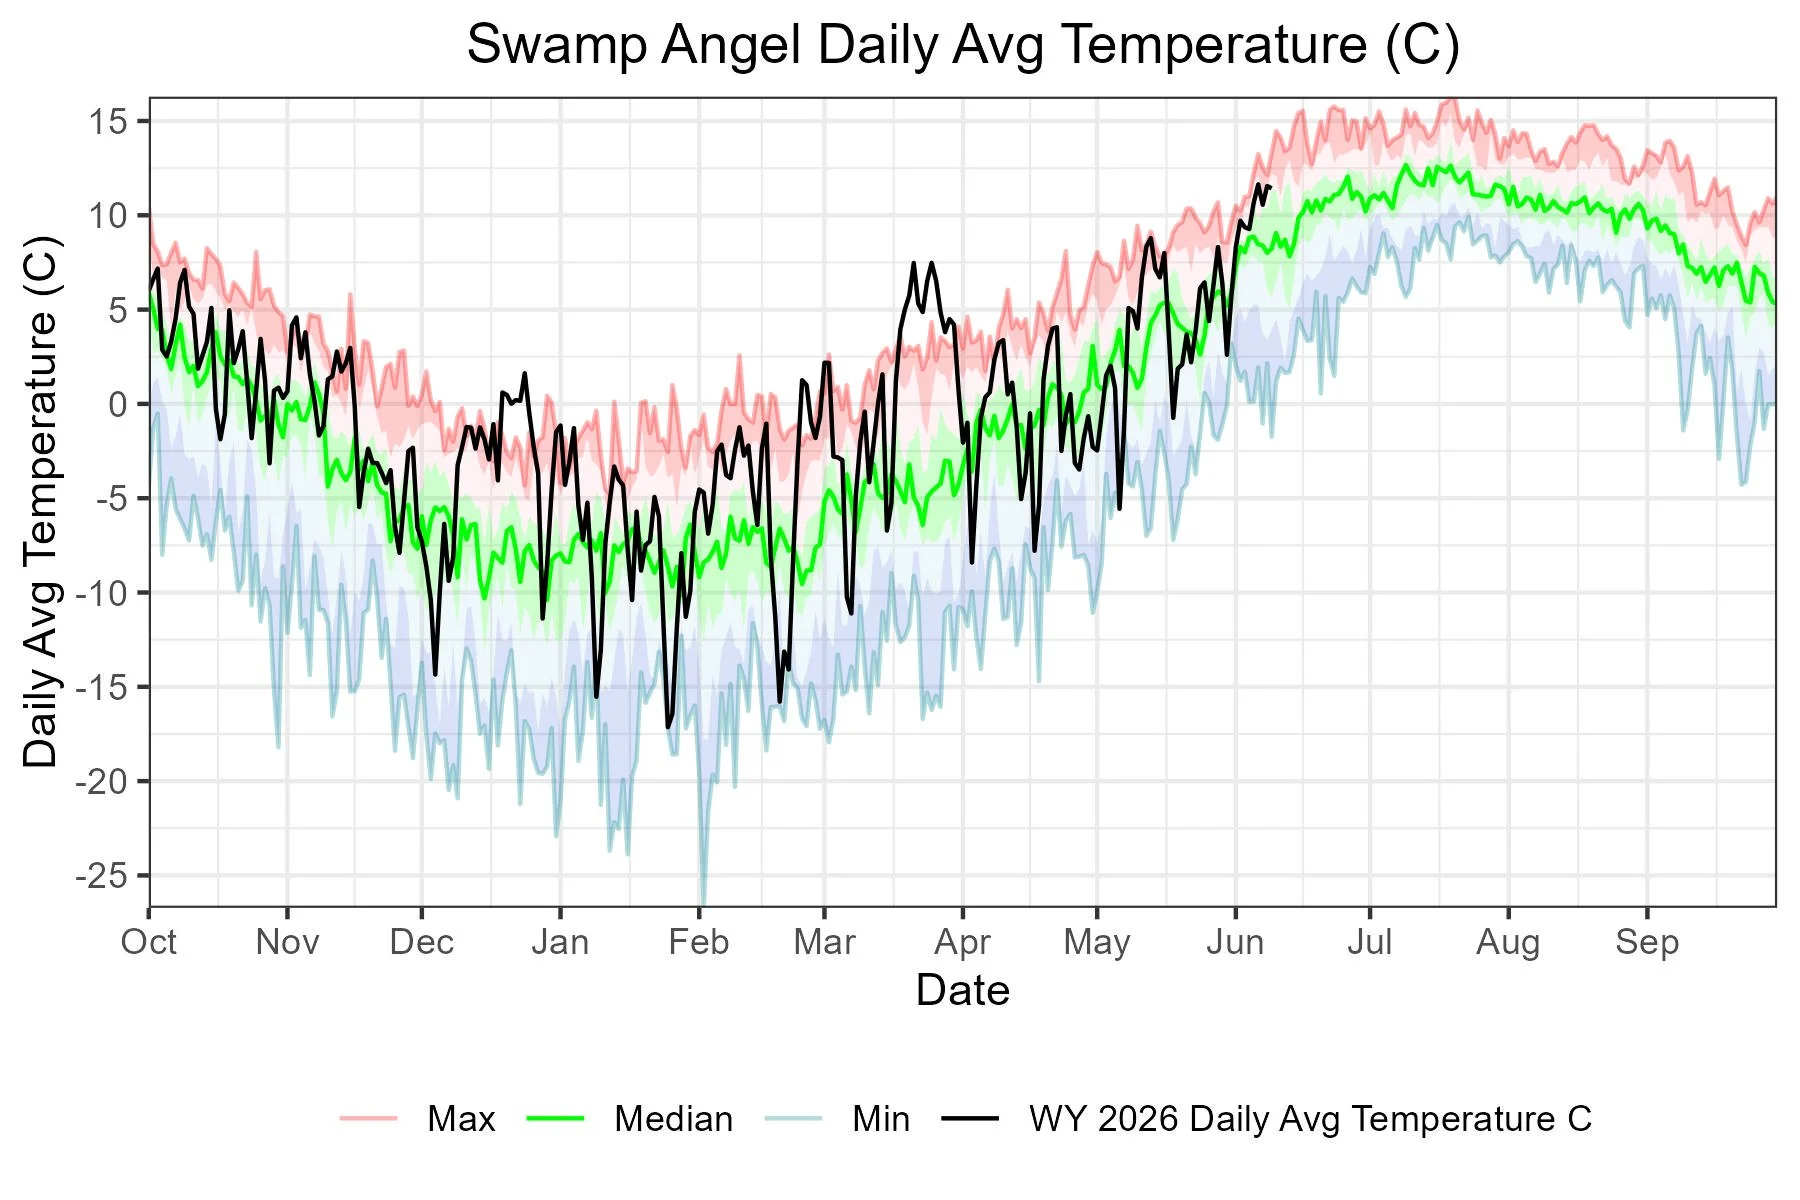
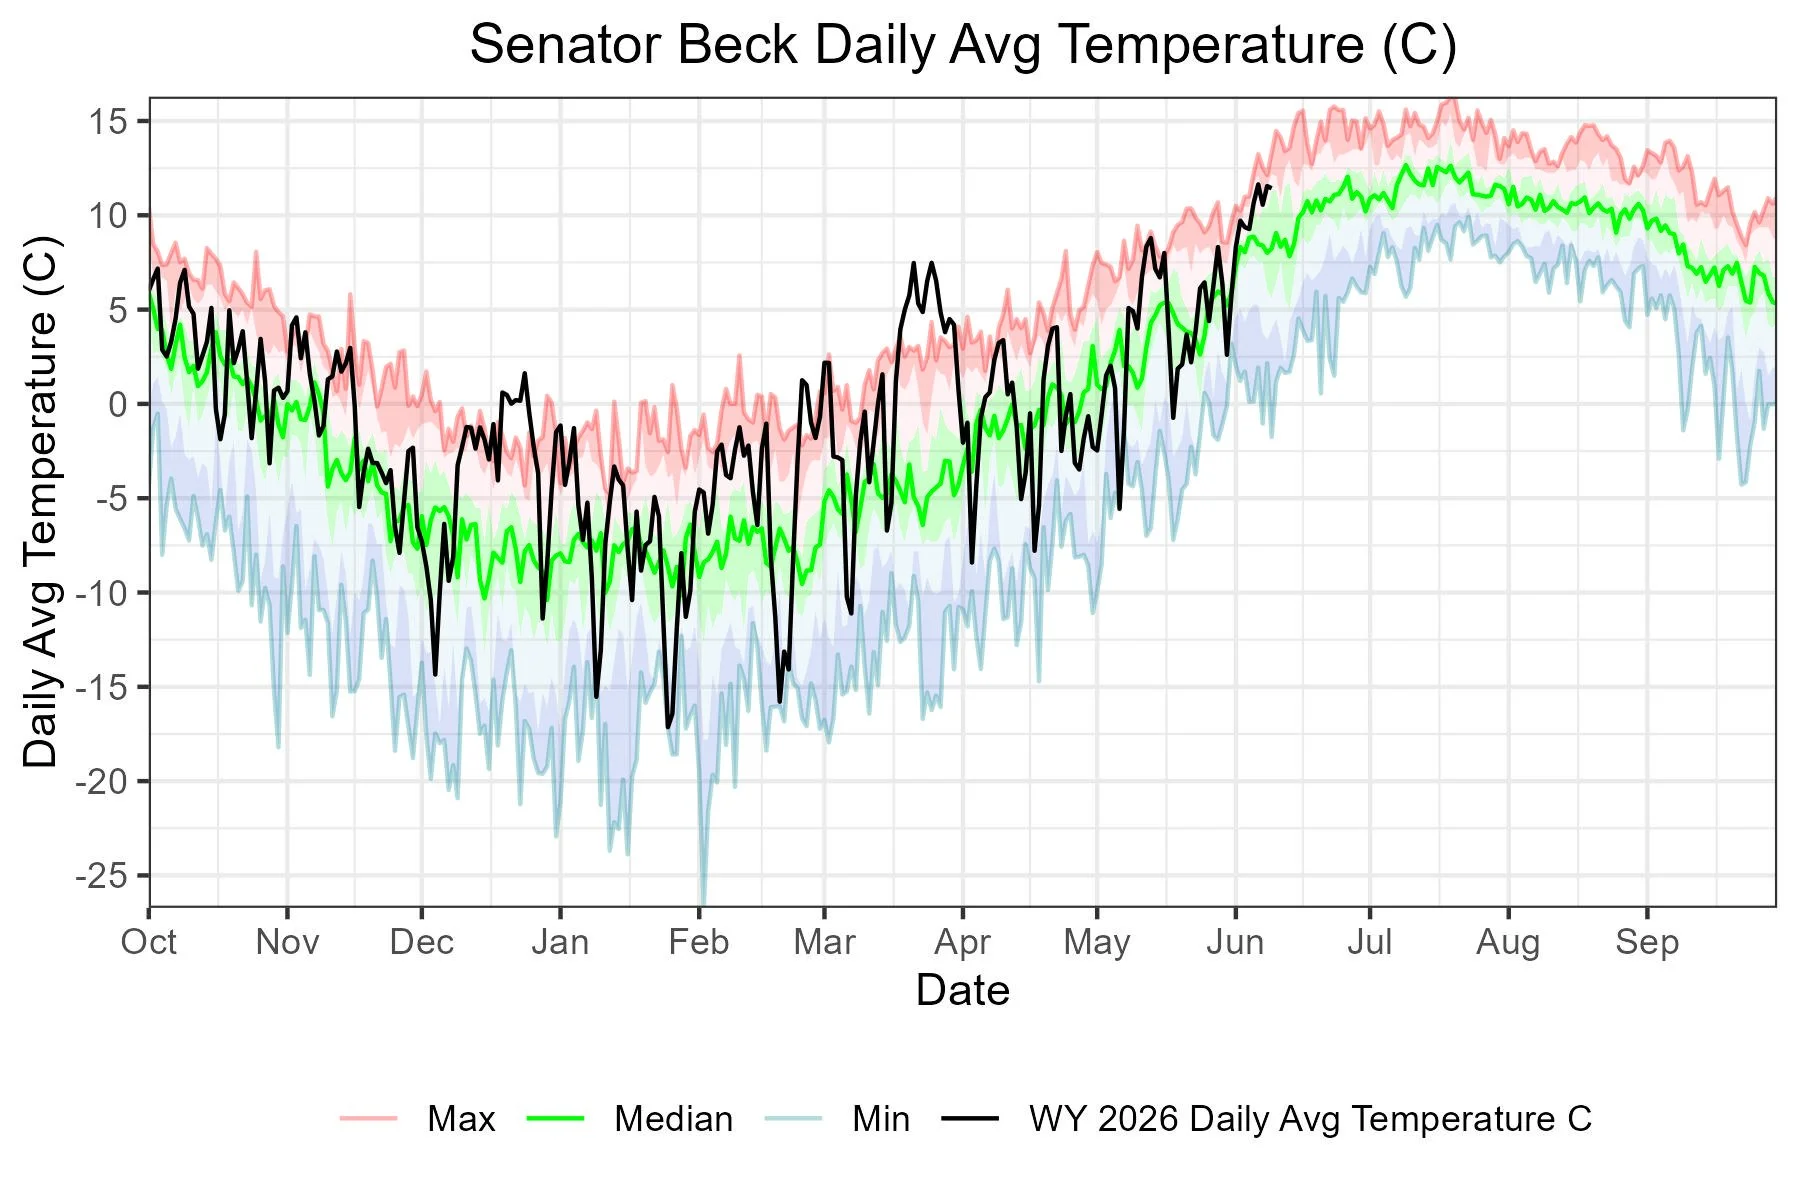
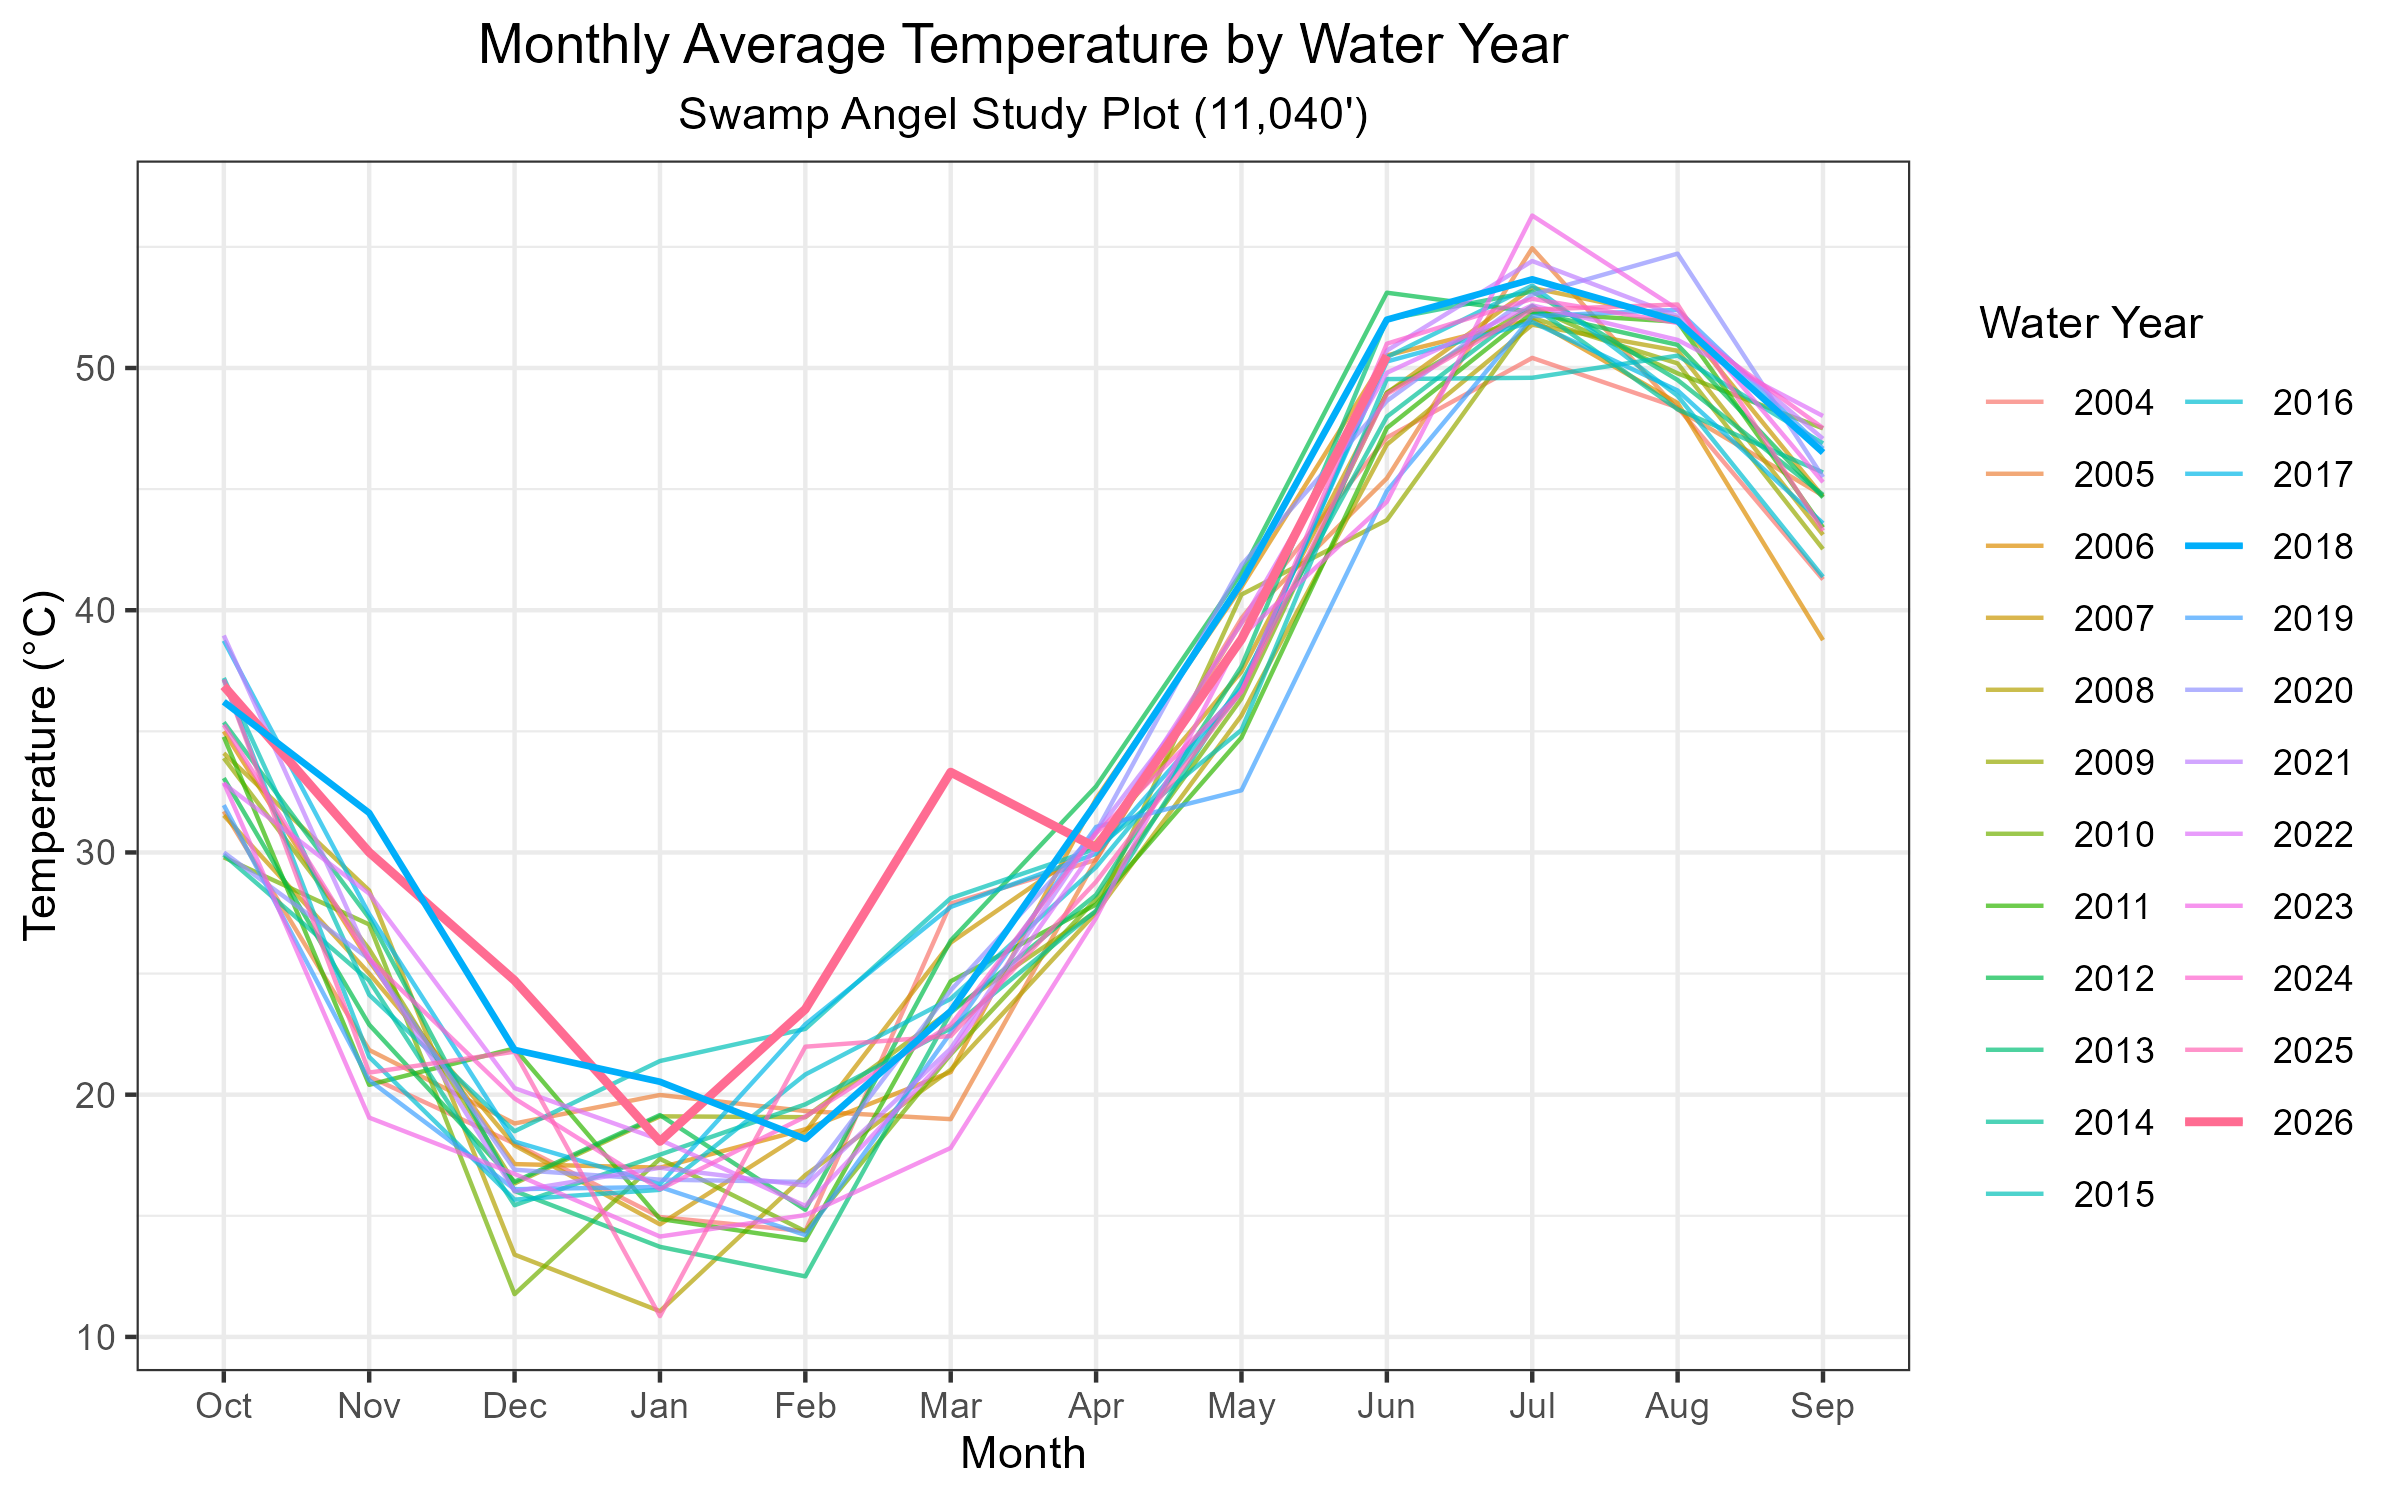
Above: Precipitation trend at Swamp Angel since WY2004, we are seeing roughly 7.5” less precipitation than we did 20 years ago. Water Year 2026 cumulative precipitation is also shown. In the temperature plots, notice the extreme heat wave in March.
SNOWPACK CONDITIONS
This Winter began late. All of fall felt like an extension of summer. The median date of the first winter storm at Swamp Angle is October 27th, and though we had snow before then, it melted out. This year, the first storm that stuck was November 15th (which ranks 4th latest on our 23-year record). We had four storms in November which brought snow depth at the station to 20”, about 66% of average.
Water year precipitation looked much better on the graphs than the snowpack due to an early October rain and flooding event in southwestern Colorado (rainfall totals were from 2 to 4+ inches). Snowpack (SWE percent of median) for the major Colorado basins on December 1st was: Dolores – 72%, Animas – 59%, Rio Grande – 63%, Arkansas – 56%, Gunnison – 55%, Upper Colorado – 37%, Yampa – 34%, South Platte – 35%. Water year precipitation for the basins was as follows: Dolores - 129%, Animas – 160%, Rio Grande – 143%, Arkansas – 95%, Gunnison – 107%, Upper Colorado – 72 %, Yampa – 71%, South Platte – 56%.
It was an extremely warm December as well at 4-6 °F above normal, setting new daily highs at our weather station. At our homebase in the town of Silverton at 9,300’ in elevation, it rained on Christmas Day and New Years Day. At the start of January, the basins snow water equivalent percent of median was: Dolores – 57%, Animas – 48%, Rio Grande – 53%, Arkansas – 49%, Gunnison – 56%, Upper Colorado – 53%, Yampa – 70%, South Platte – 60%. In mid-January, the prolonged snow drought started showing its effects with the state of Colorado setting record lows since 1987 for snow water equivalent.
In February, a nice storm cycle brought 3.7” of new SWE and yet we were nowhere near normal for the year, as the start of spring rapidly approached. January and February were a slight reprieve from the much warmer-than-average temperatures of the preceding months, yet March arrived with an unprecedented, relentless heat wave. In addition to the heat, we had very few storms, just two storms were recorded at Swamp Angel on March 6th and March 31st, resulting in a lack of albedo refreshes that allow the snowpack to withstand the spring solar radiation.
During the month of March, all the major basins lost over half their snowpack, meaning at the time we are normally nearing peak SWE, we were instead approaching snow-all-gone. Typically, this rate of melt happens in May. We see the air temperature impact melt rates when nighttime temperatures are above freezing; this year, we saw nighttime temperatures at Swamp Angel above freezing starting on March 20th.
This is how the basins responded to the dry and hot March conditions. Below is basin March 1st % median SWE → April 1st % median SWE:
Dolores 62% → 15%
Animas 52% → 21%
Rio Grande 53% → 17%
Arkansas 45% → 17%
Gunnison 65% → 23%
Upper Colorado 63% → 28%
Yampa 68% → 30%
South Platte 63% → 35%
After the end of March nosedive, April steadied out. We saw more frequent, though minimal, precipitation, which halted the melt-out and preserved some of the remaining snowpack. Two winter storms brought 8” and 12” of depth to Swamp Angel, and it snowed 20 days total in April. We were hopeful for this weather pattern to continue through May, but conditions dried out soon after the start of the month. Two of our CODOS observation sites (Berthoud and Loveland Pass) experienced May snowpack accumulation, but most were melted out at the end of April.
We could not have experienced this record low snowpack season without the record high heat. Though air temperature is not the main driver for snowpack ablation, it influences the general ‘thirst’ of the atmosphere, leading to increases rates of sublimation (snow going directly to water vapor), increased evapotranspiration from exposed soils and vegetation. Mid-winter warm temperatures can cause snow to fall as rain instead, chipping away at the cumulative snow accumulation resulting in earlier melt-out in the spring. Lack of new snow allows the surface snow to increase snow grain rounding which increases the absorption of solar radiation, mostly in the near infrared part of the electromagnetic spectrum, into the snowpack. See albedo plots further down.
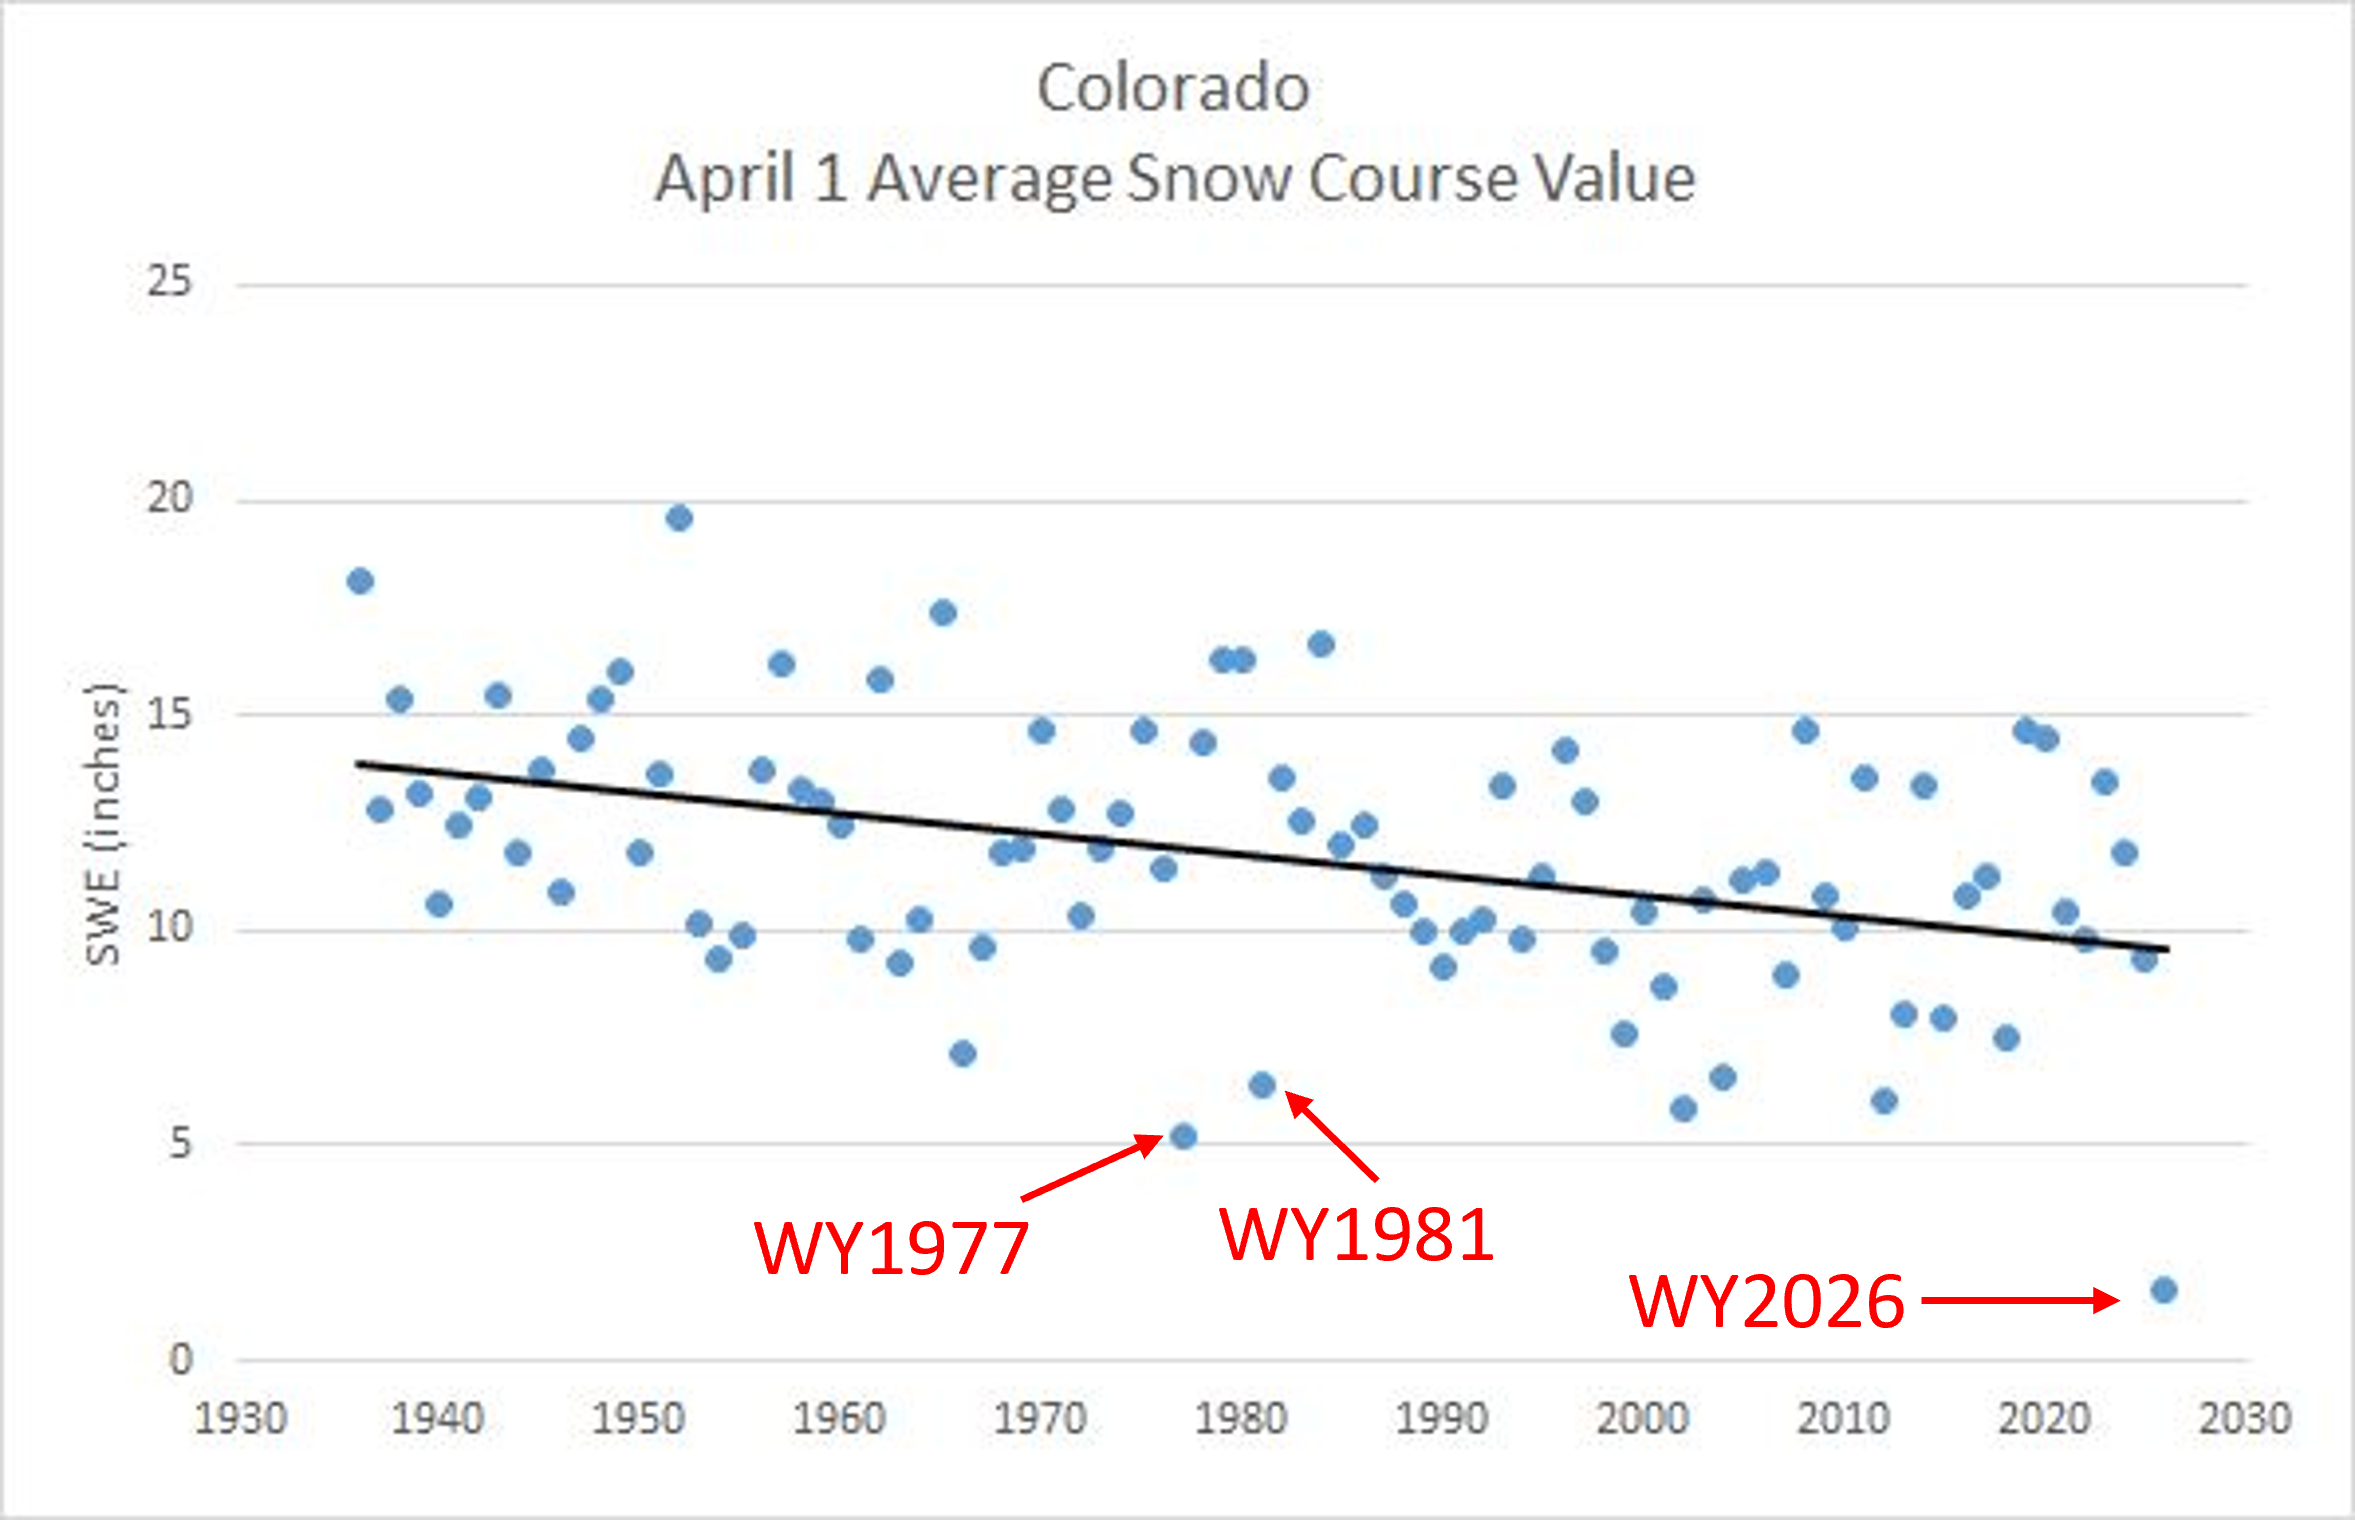
Above: Average snow course value for period of record going back to the 1930’s. Snow course data is collected manually the 1st of the month with April 1st being the collection date that best represents peak SWE and thus a good estimate of available water for runoff.
Below: Colorado map of major basins’ SWE as a percentage of median from SNOTEL stations.
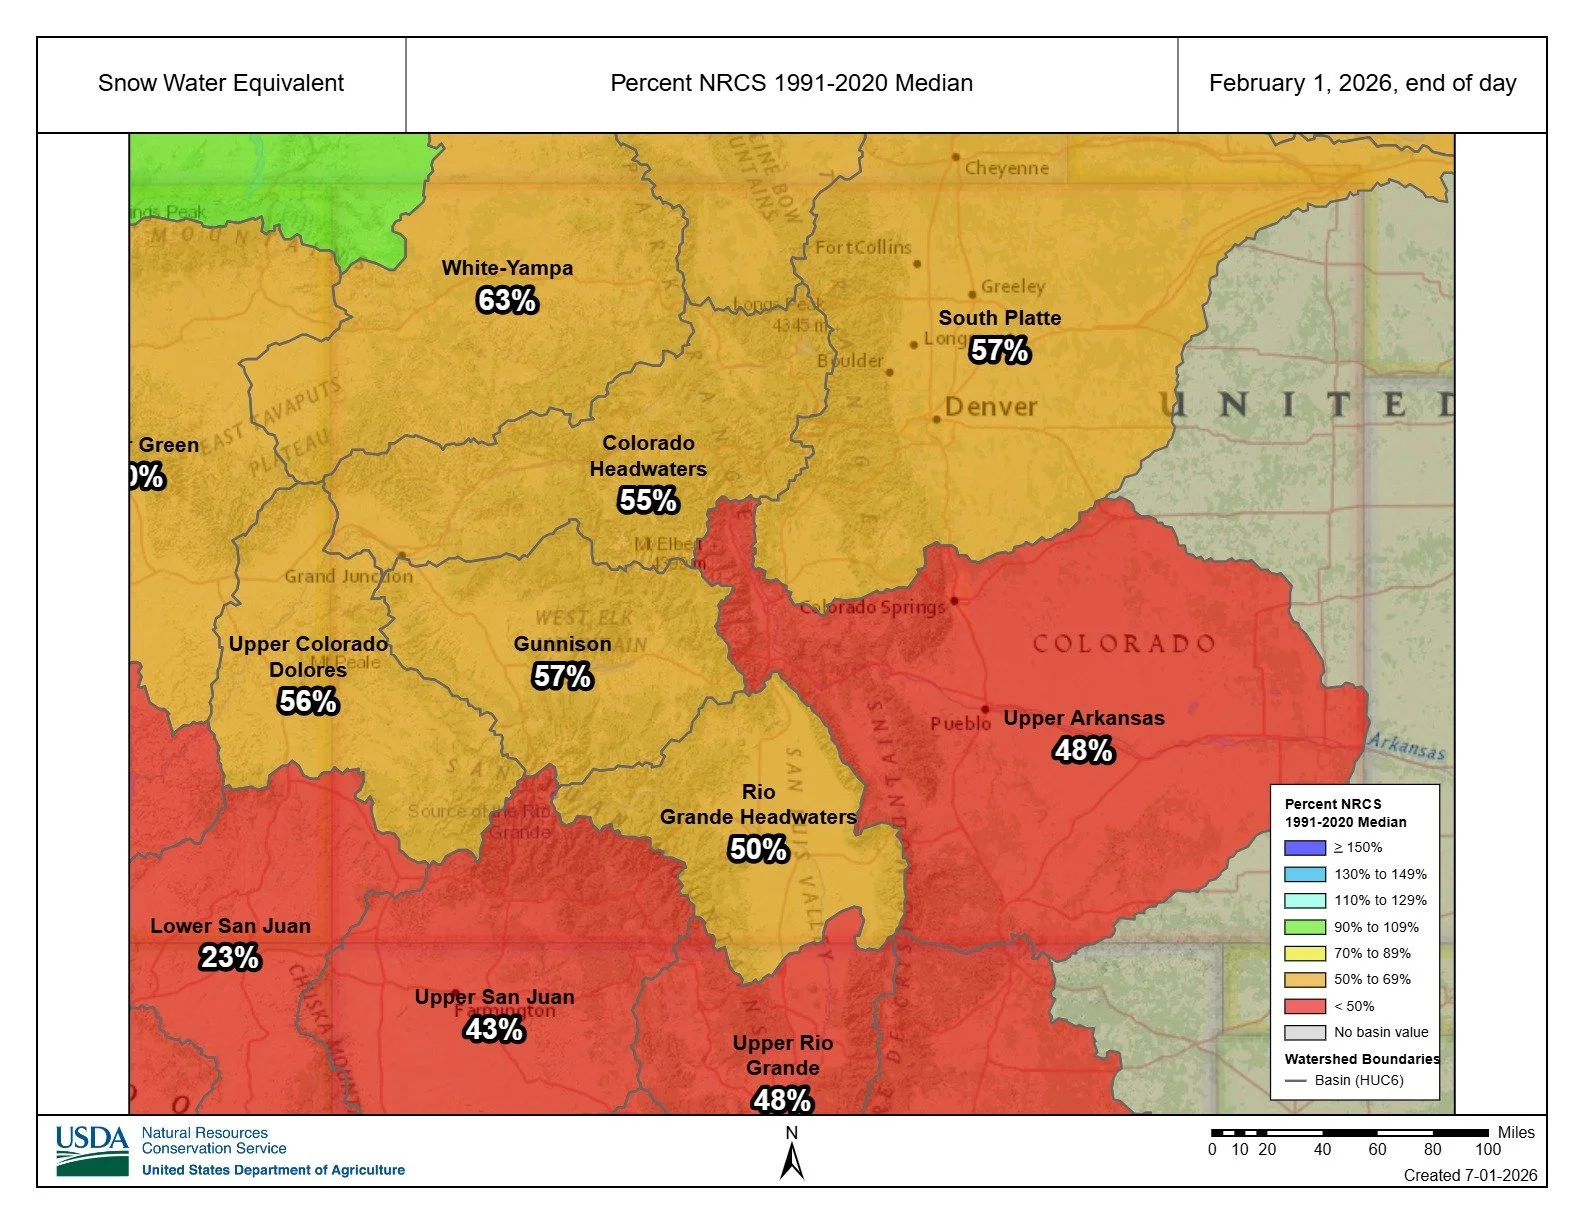
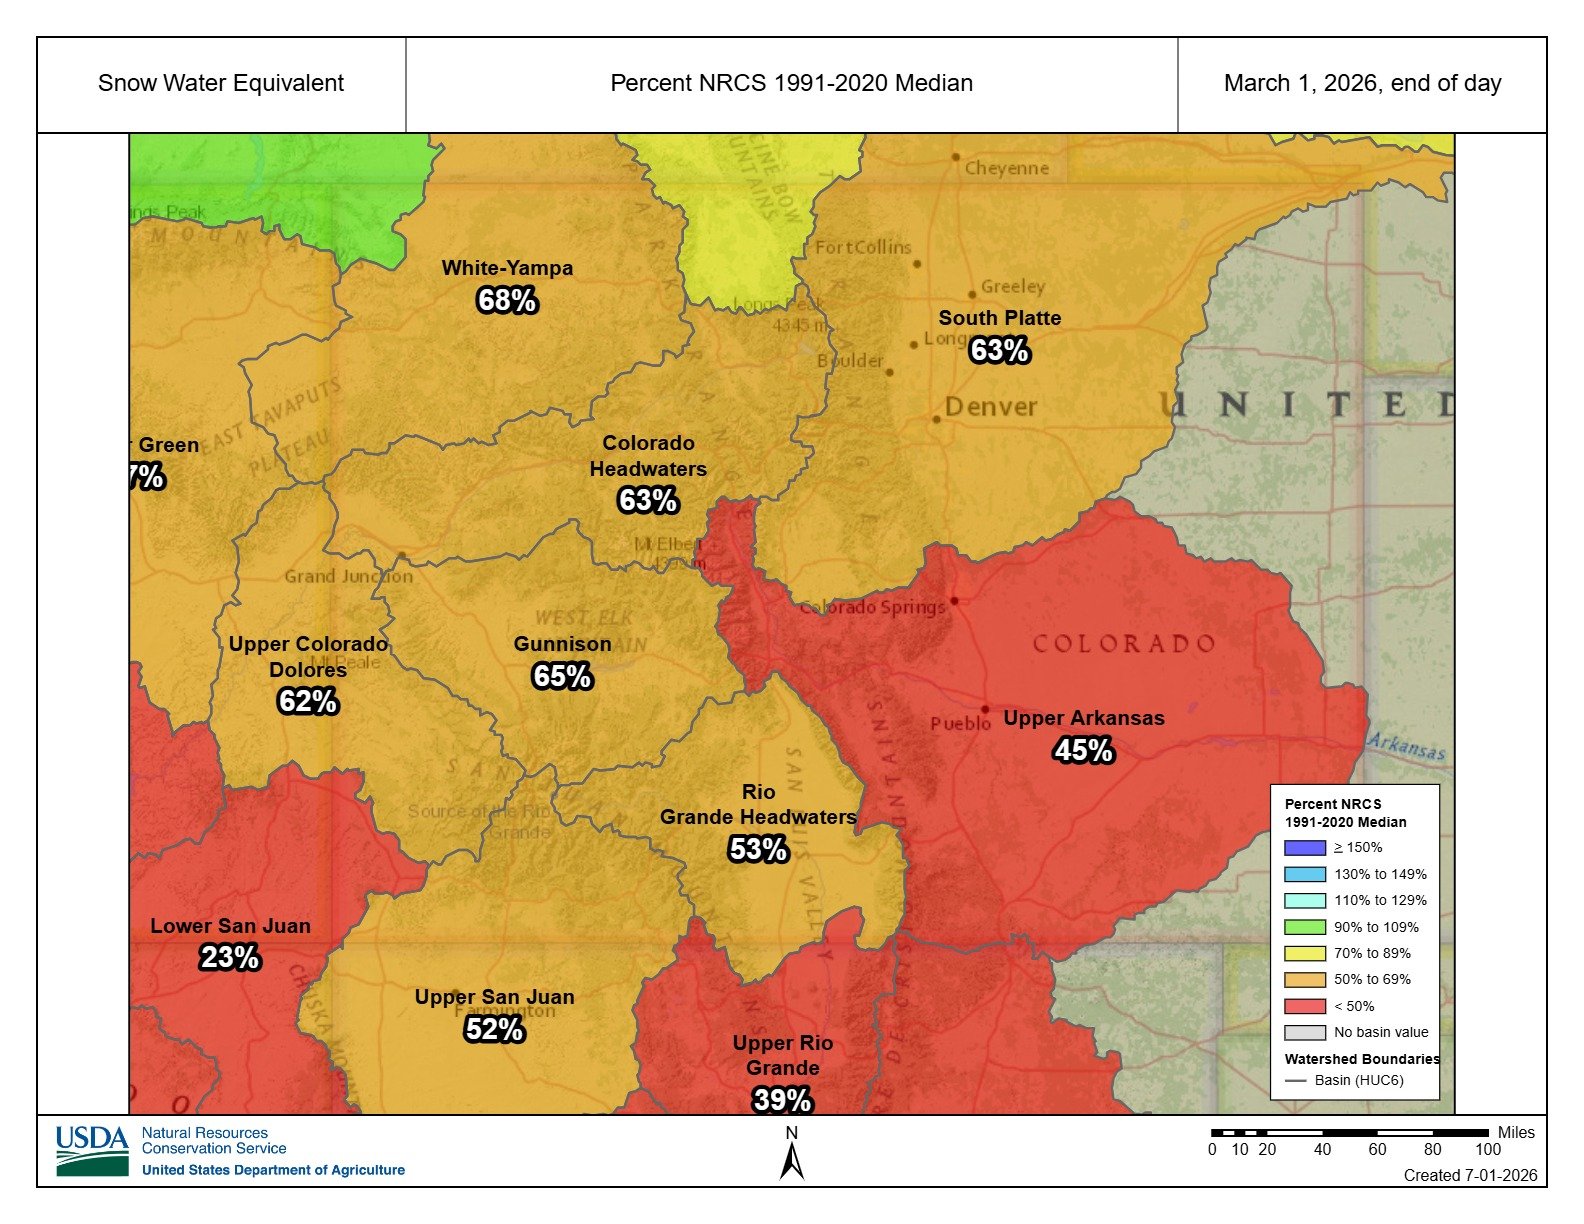
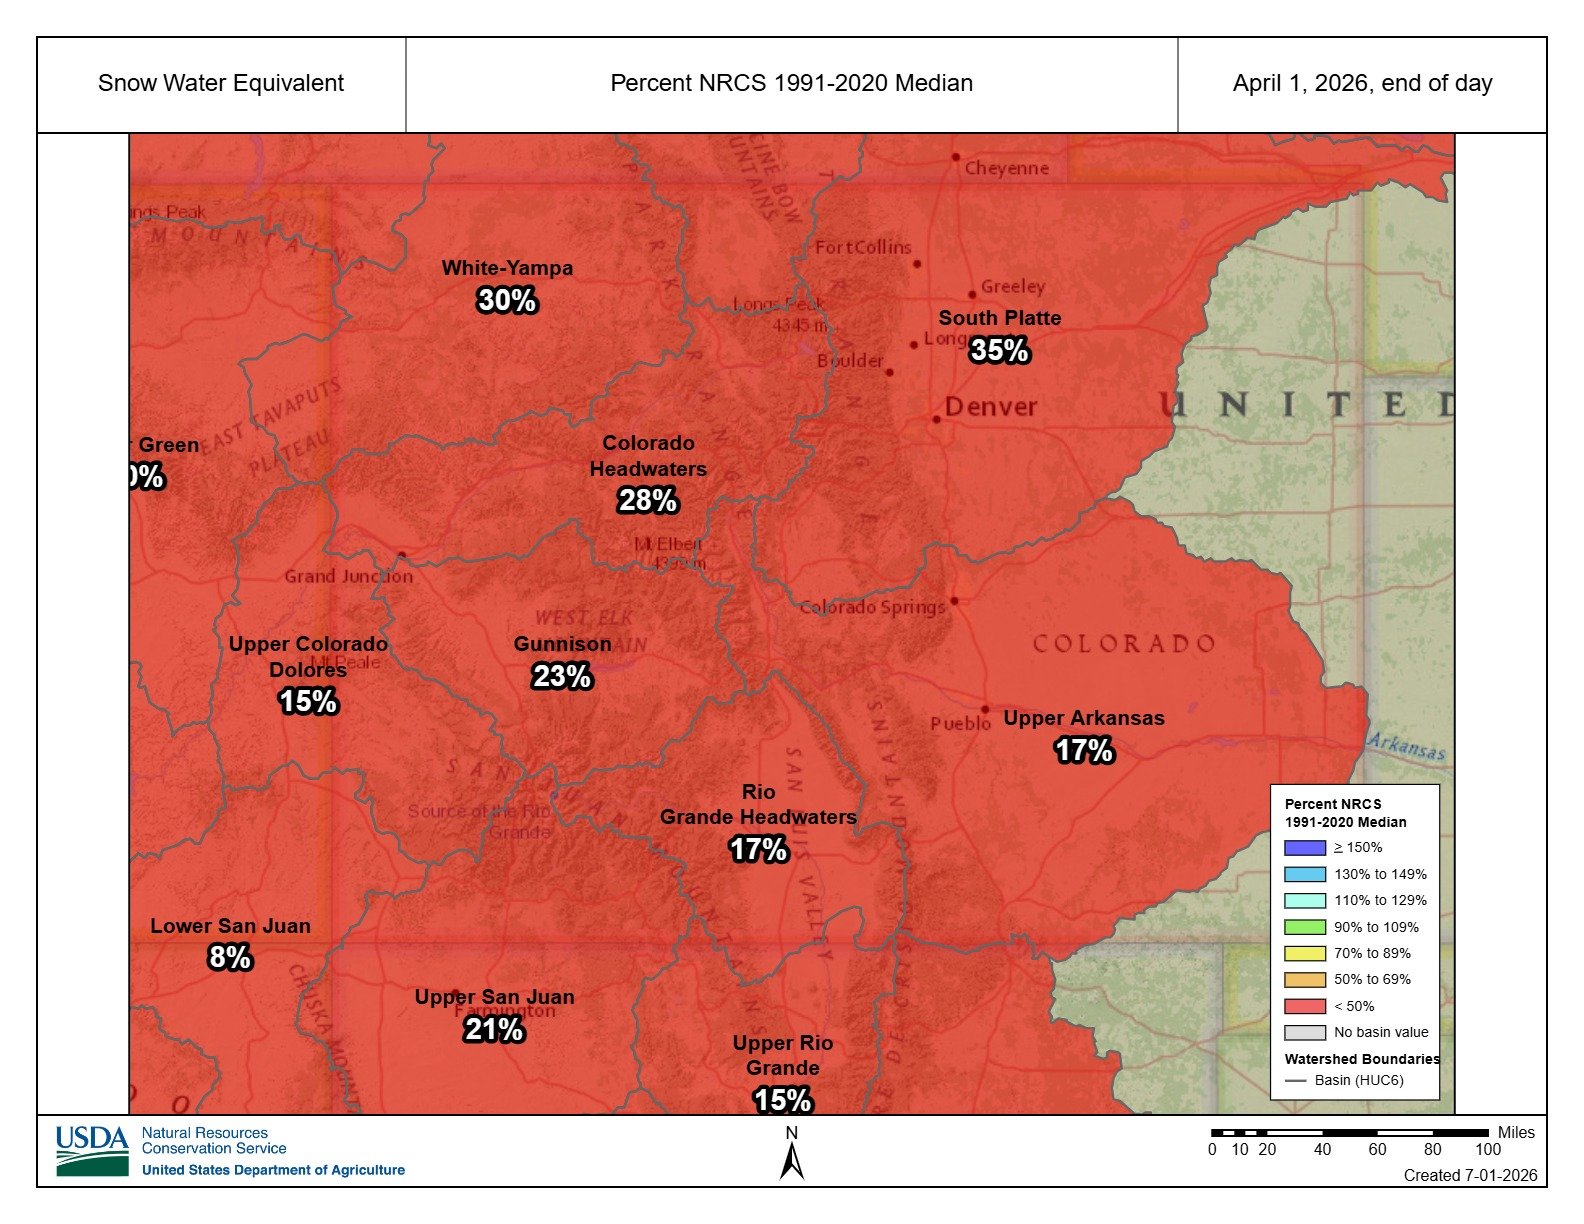
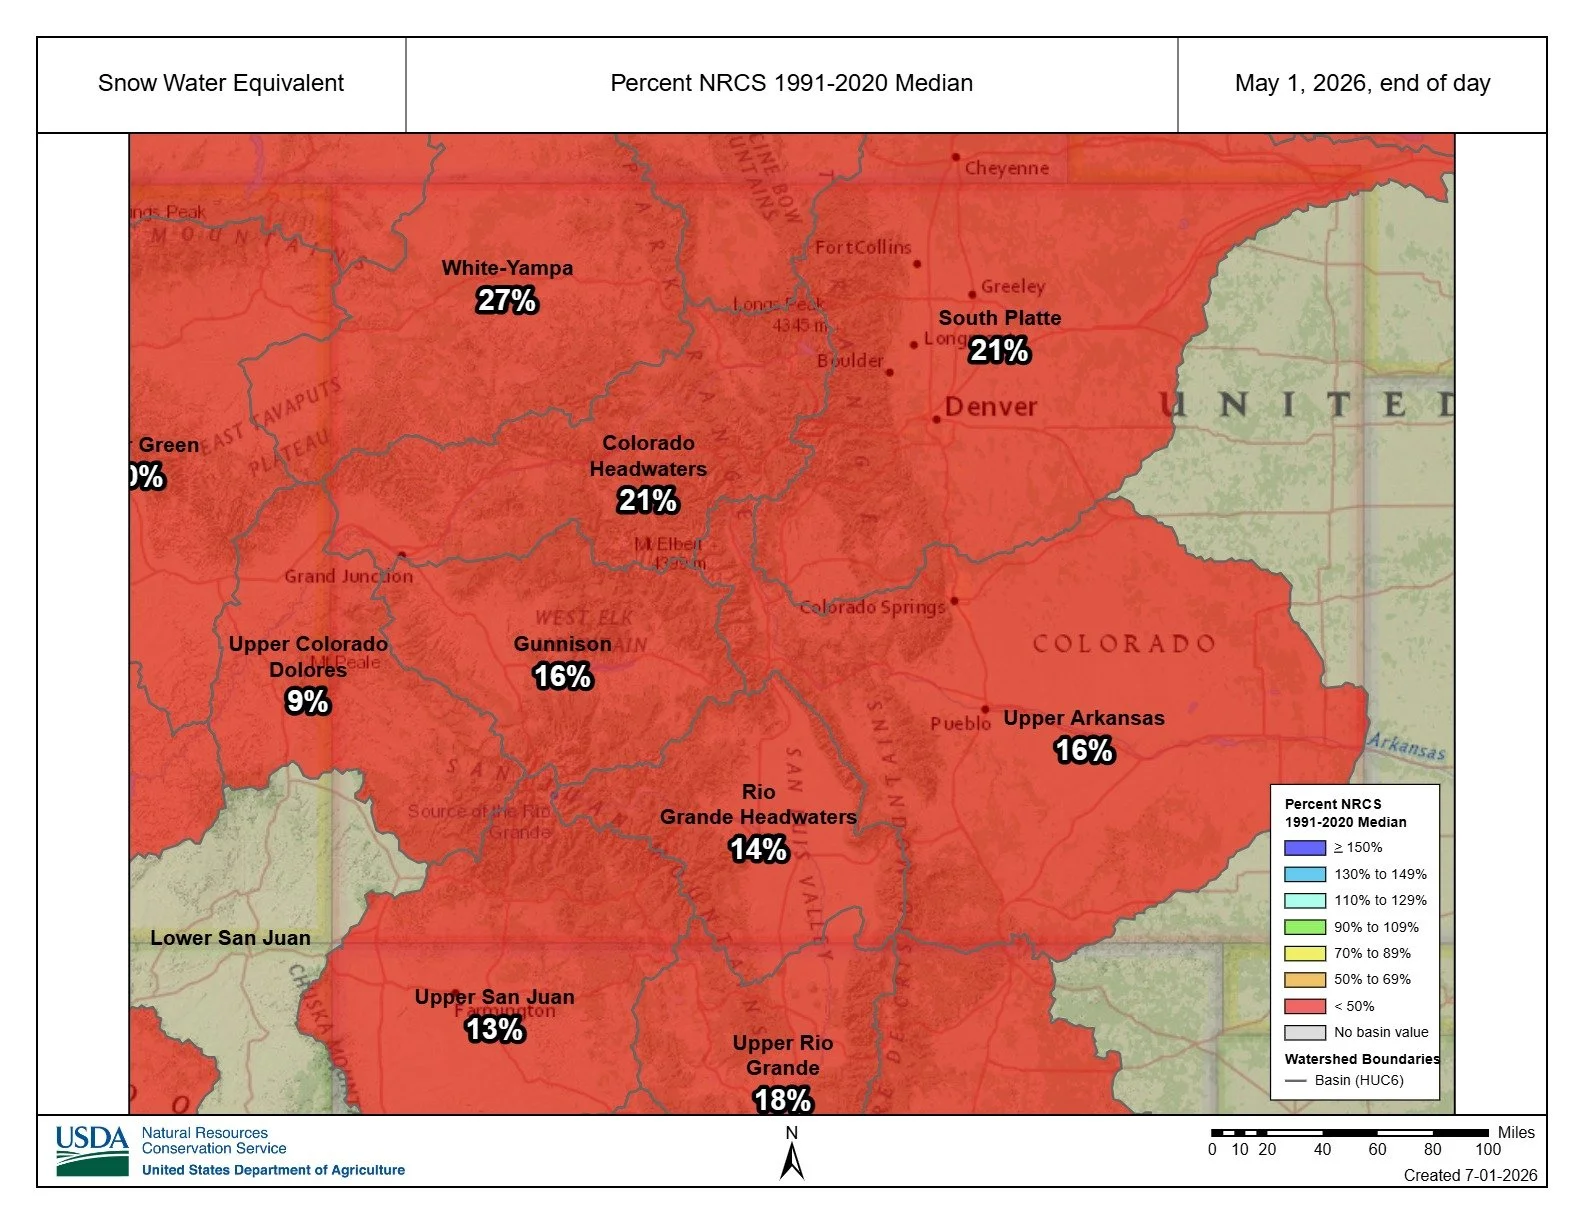
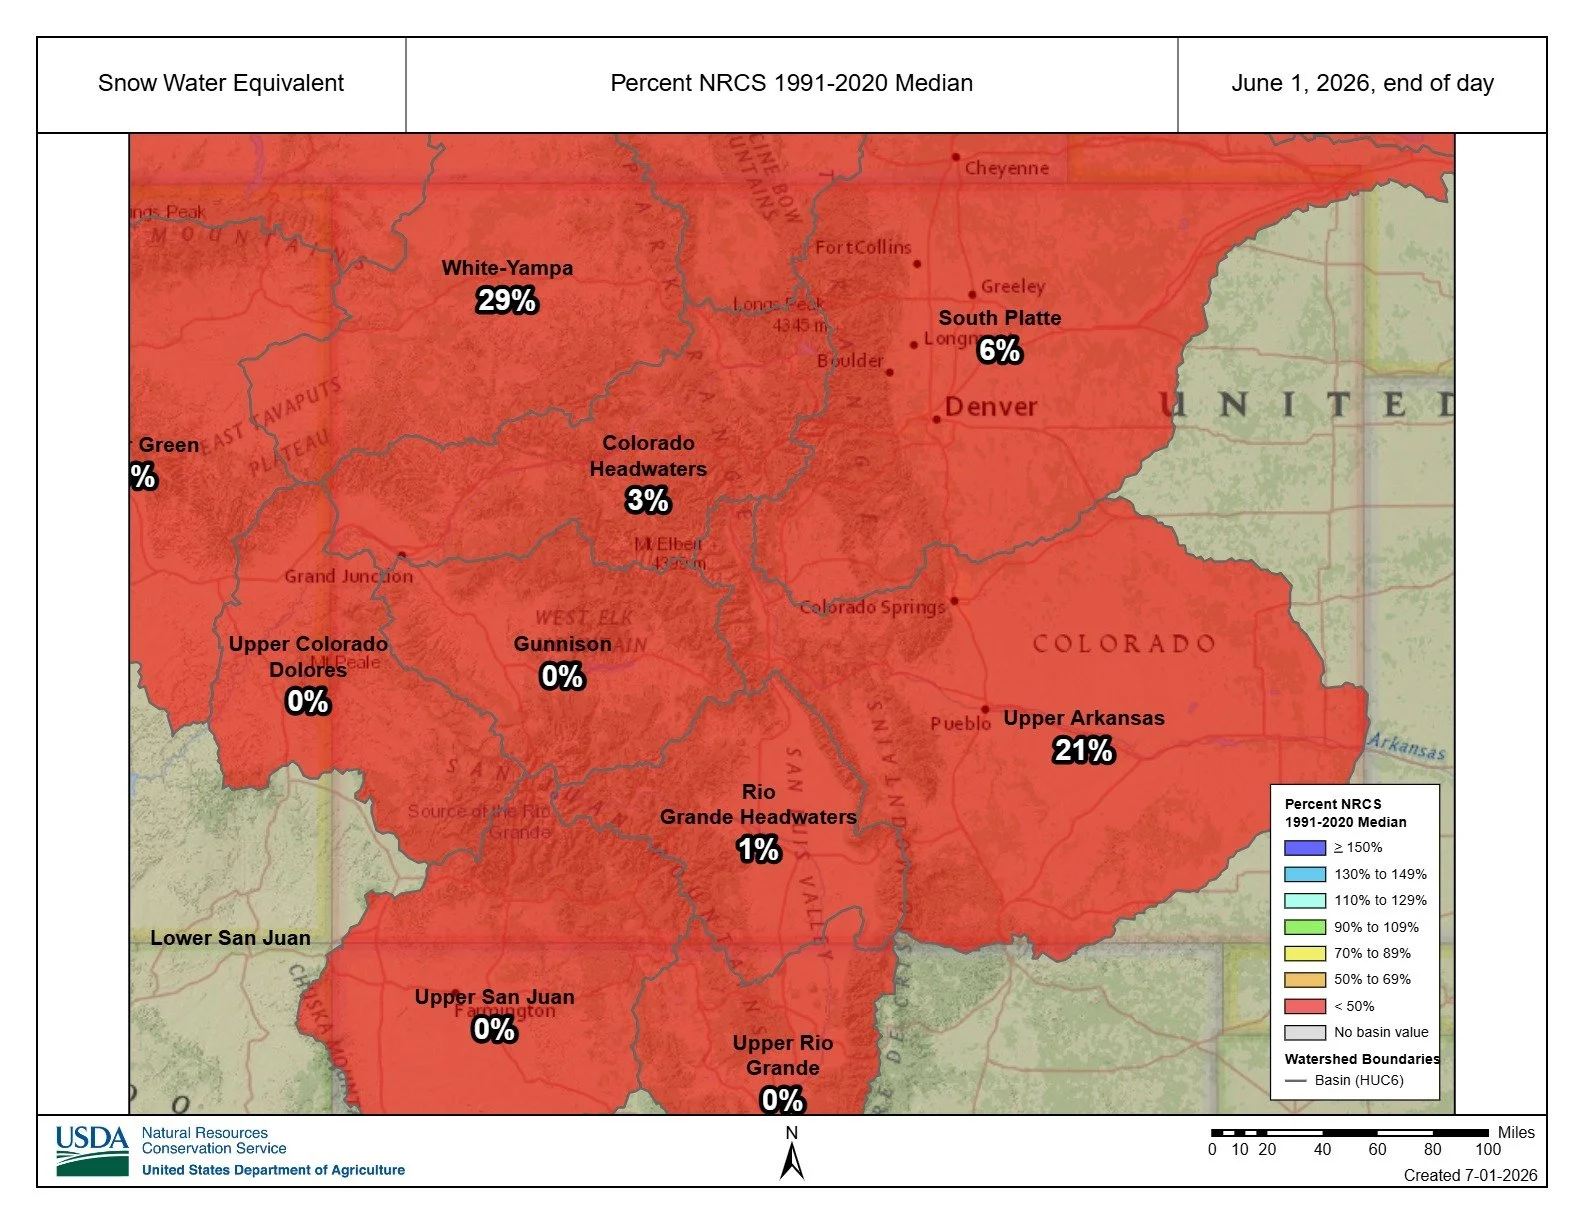
Below: SNOTEL graphs of individual stations and all major basins.
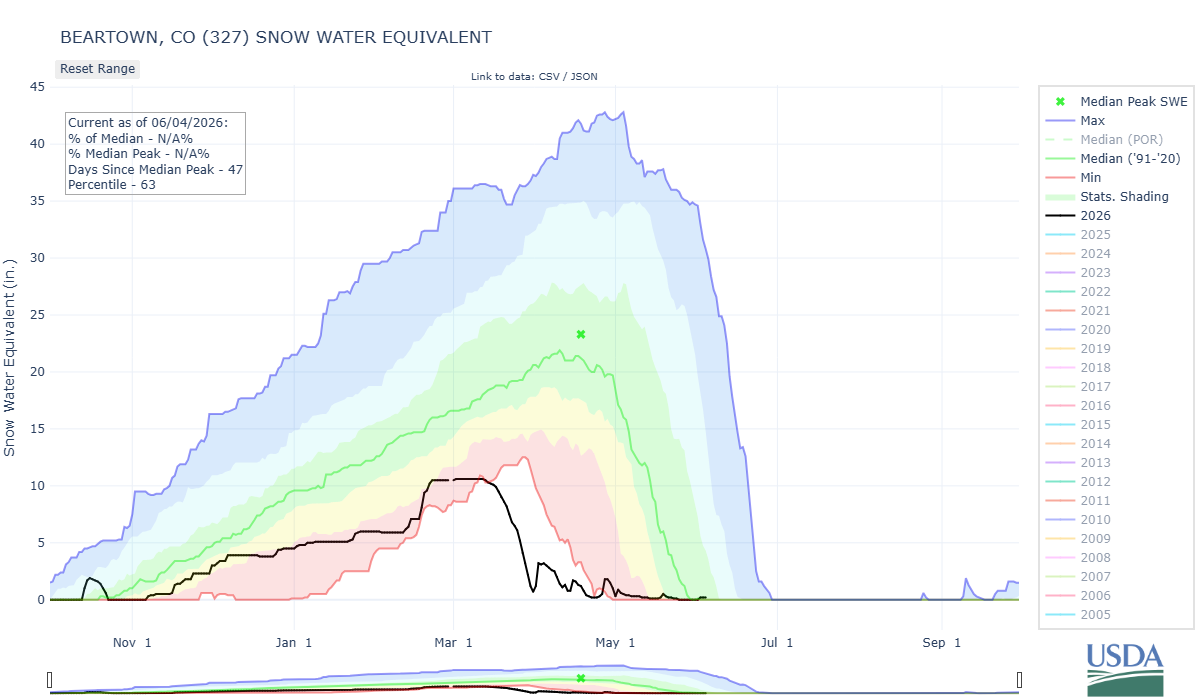
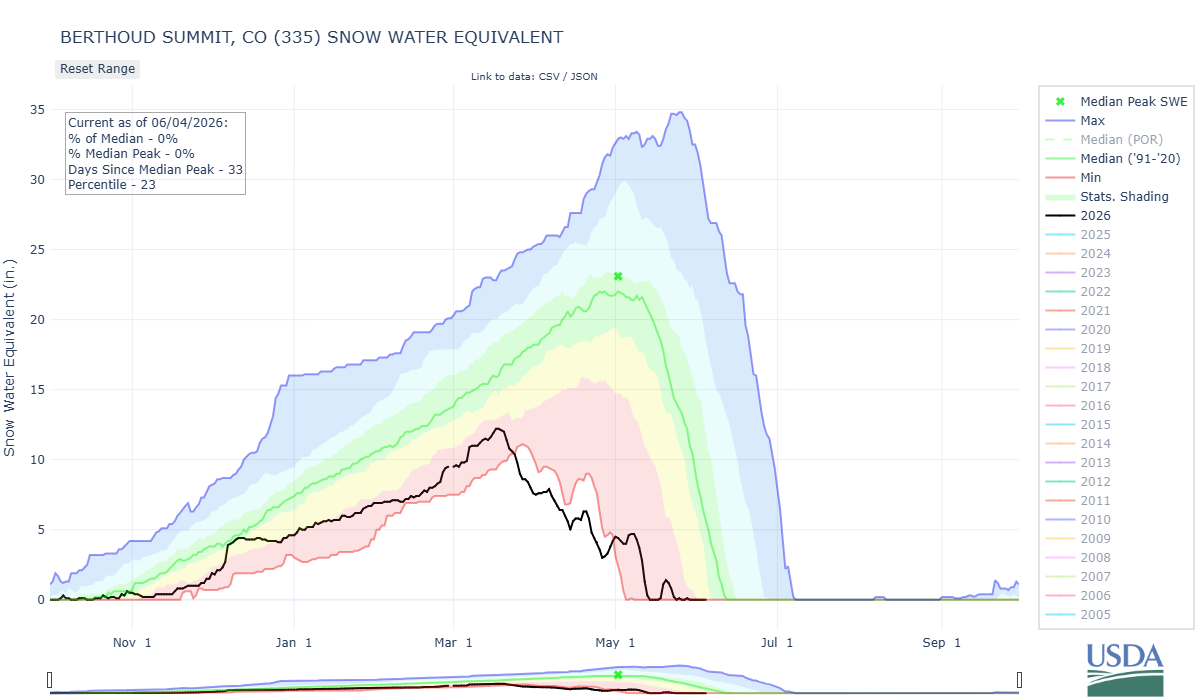
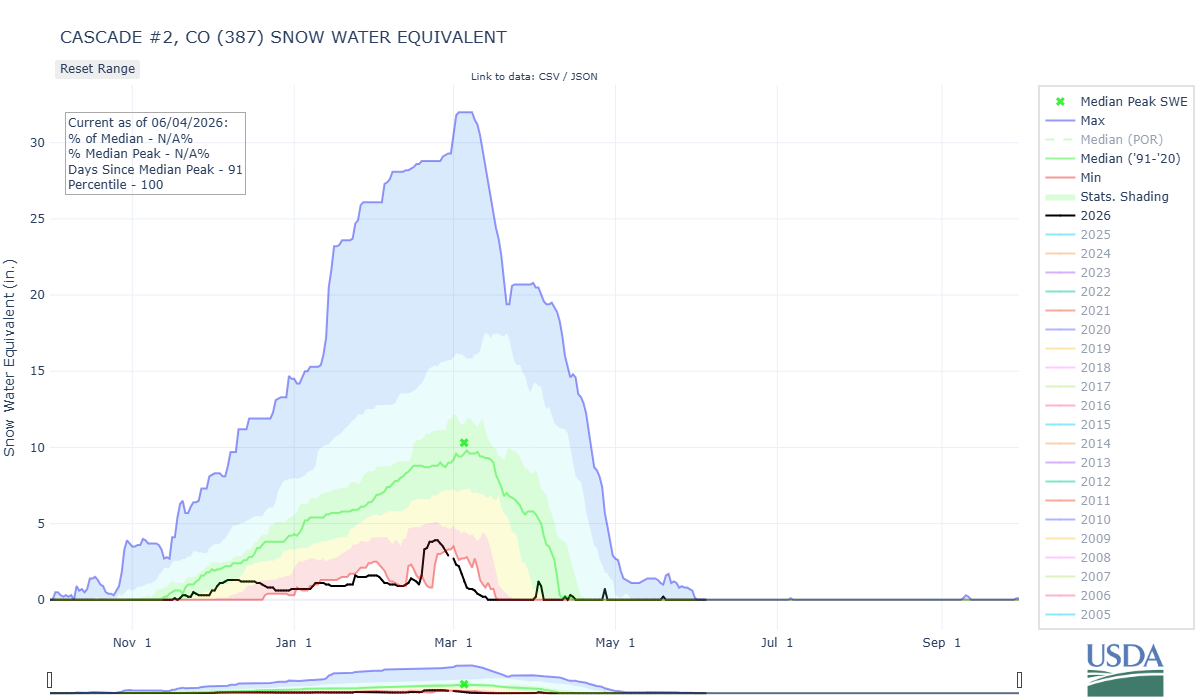
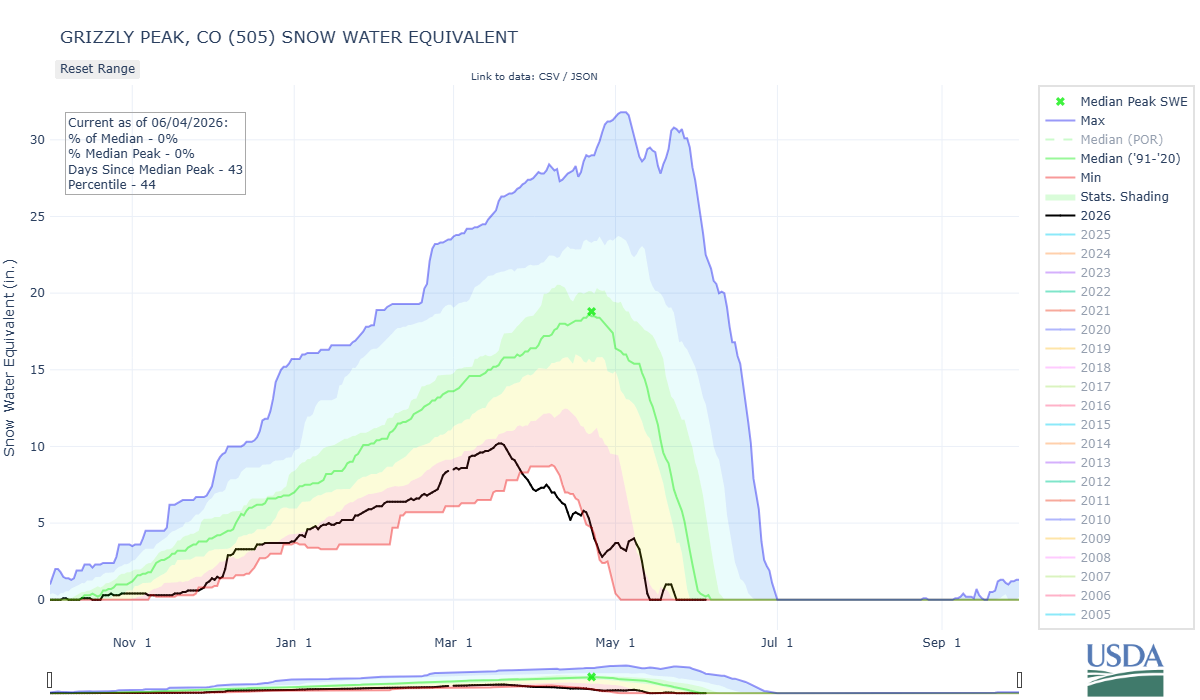
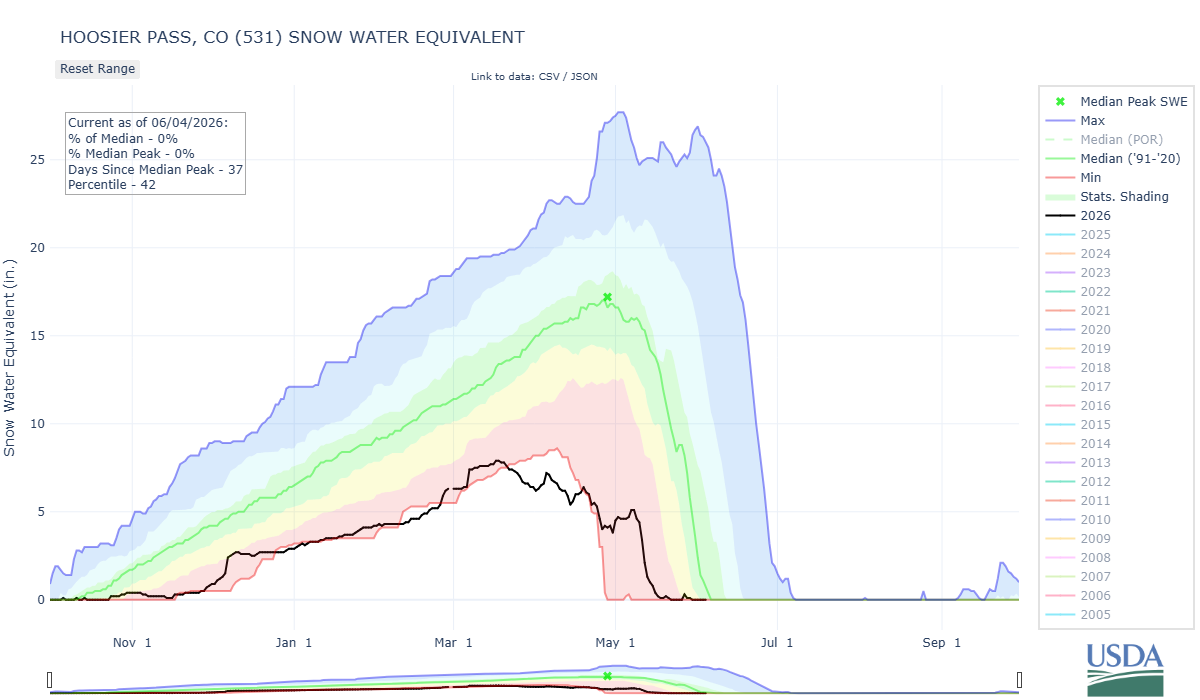
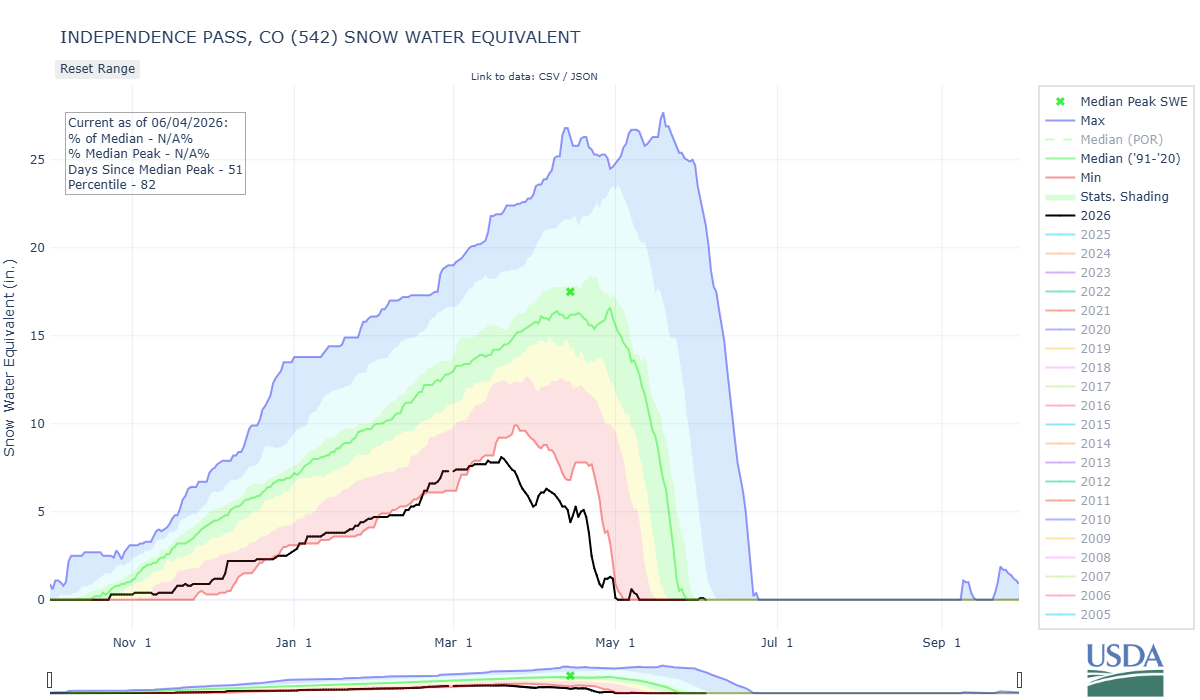
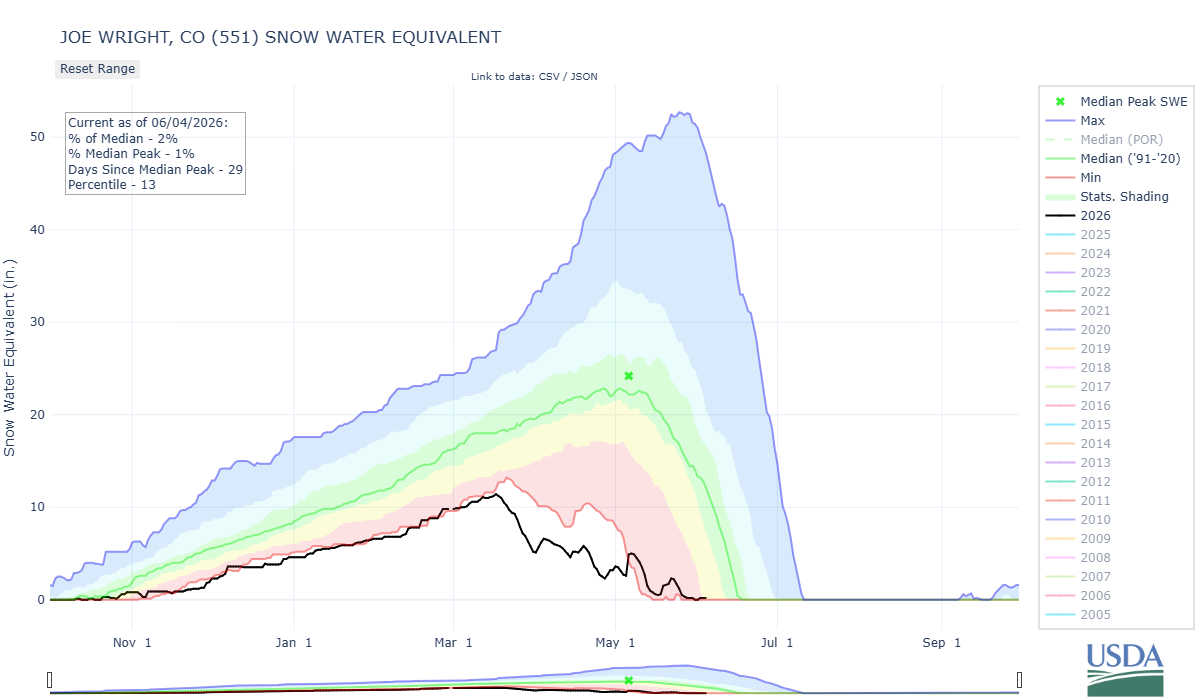
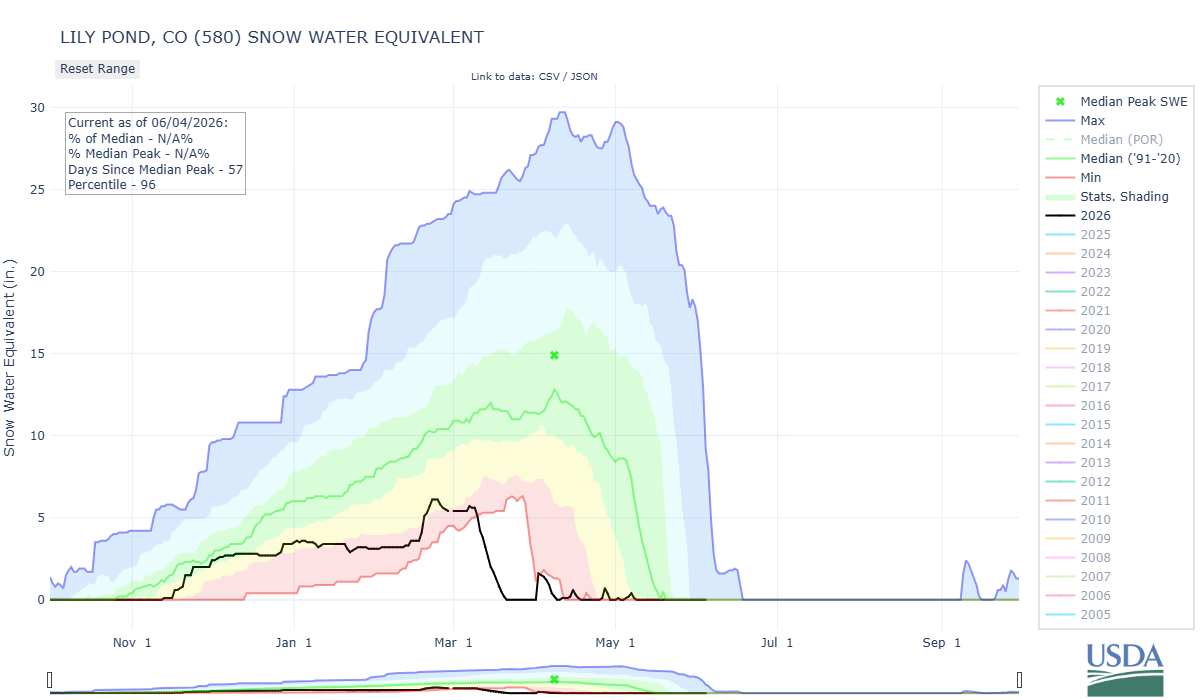
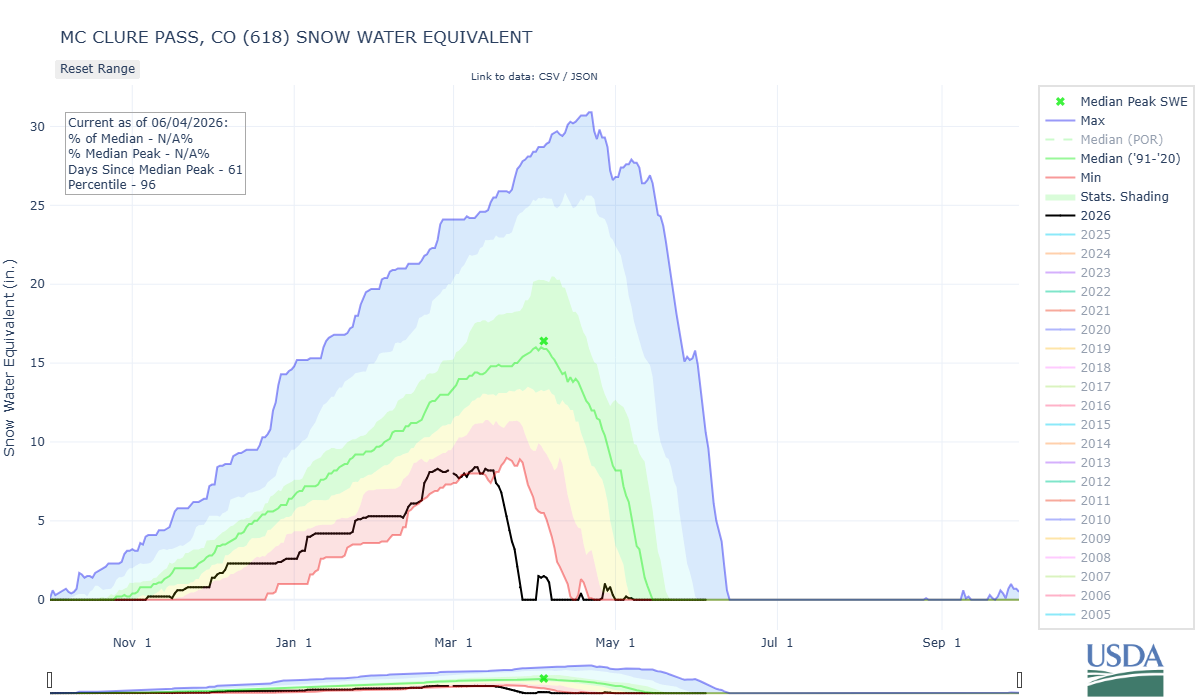
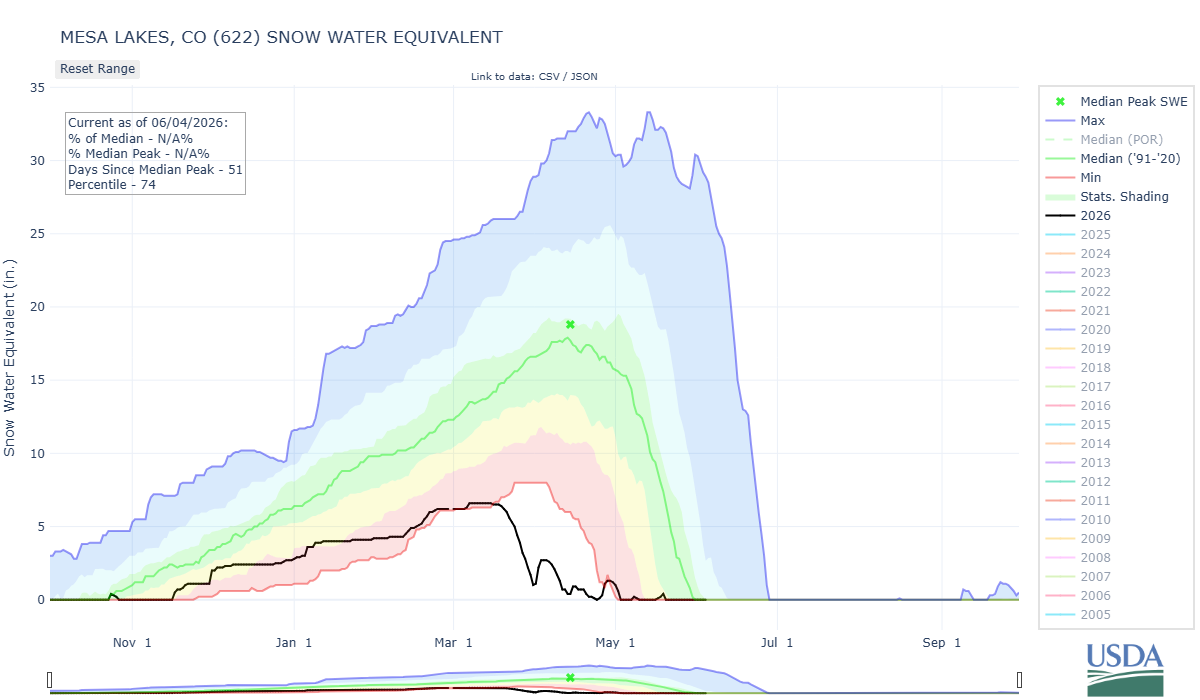
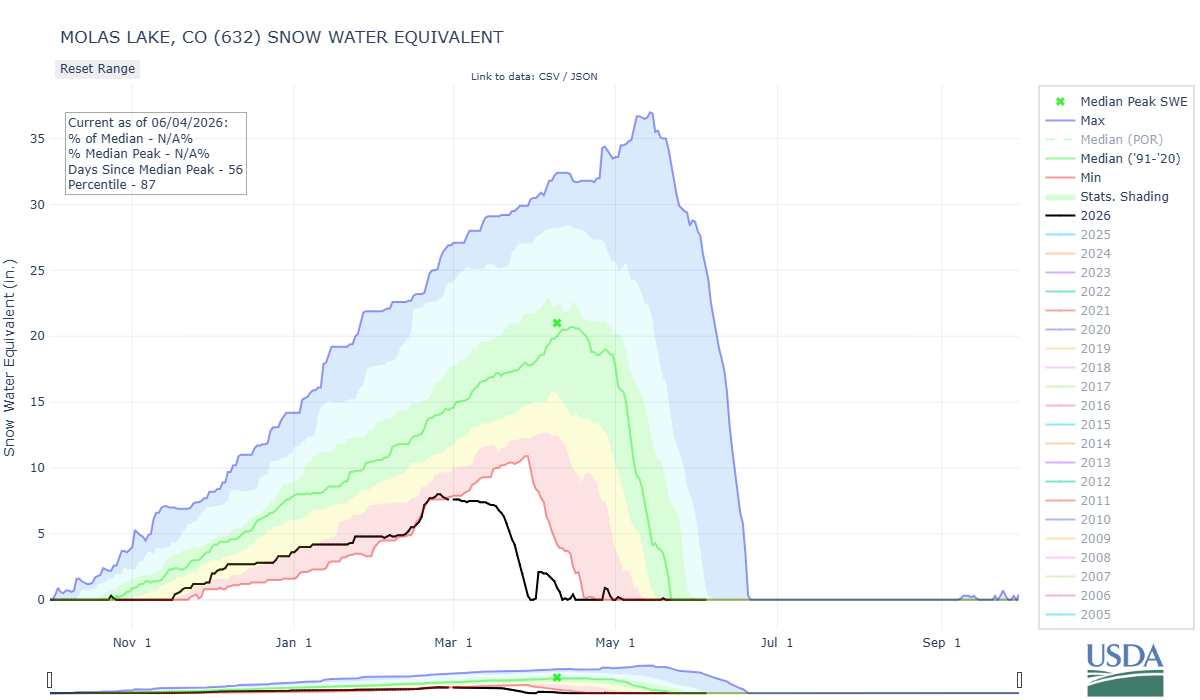
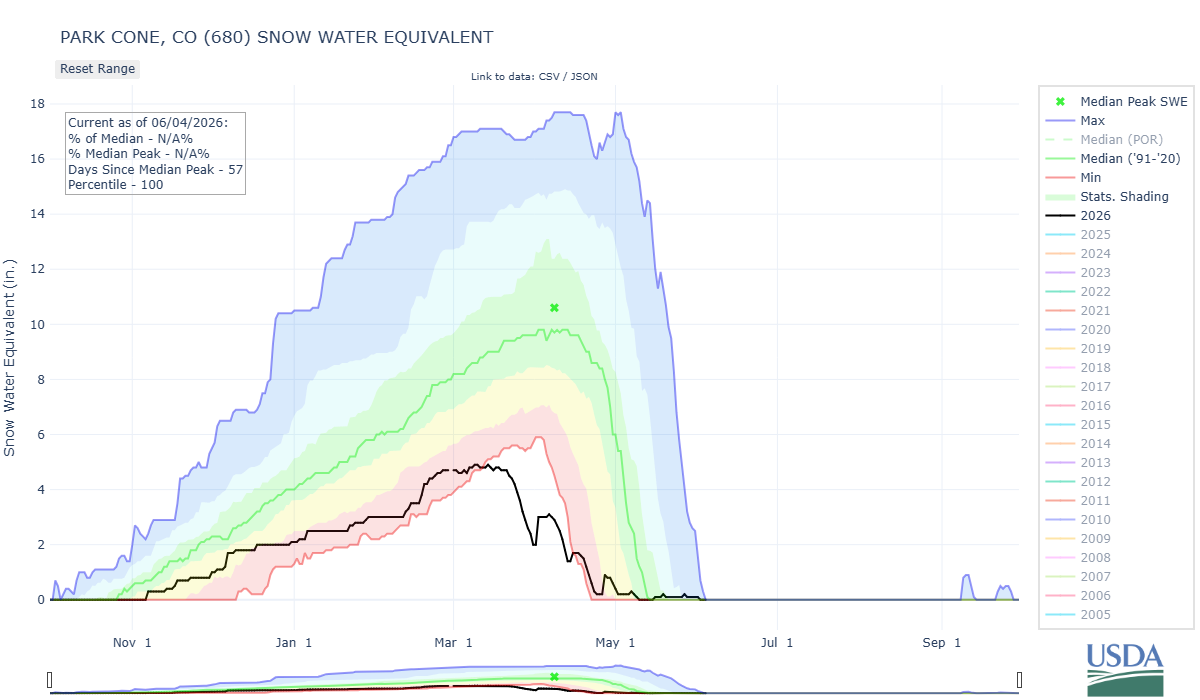
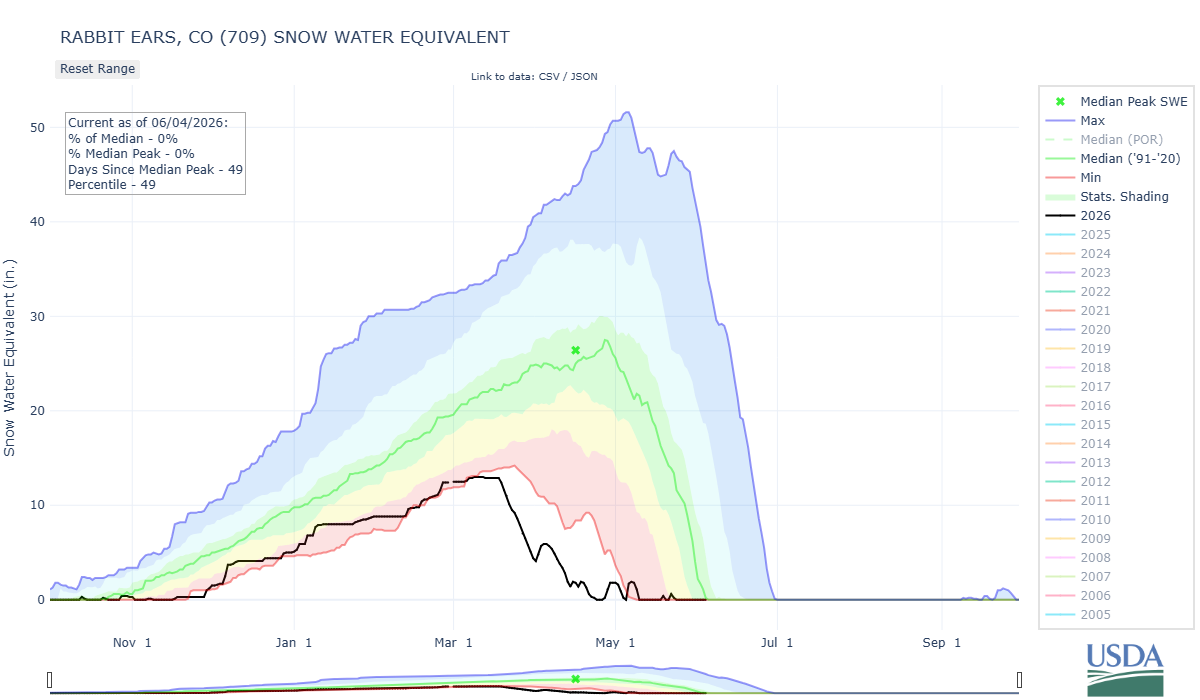
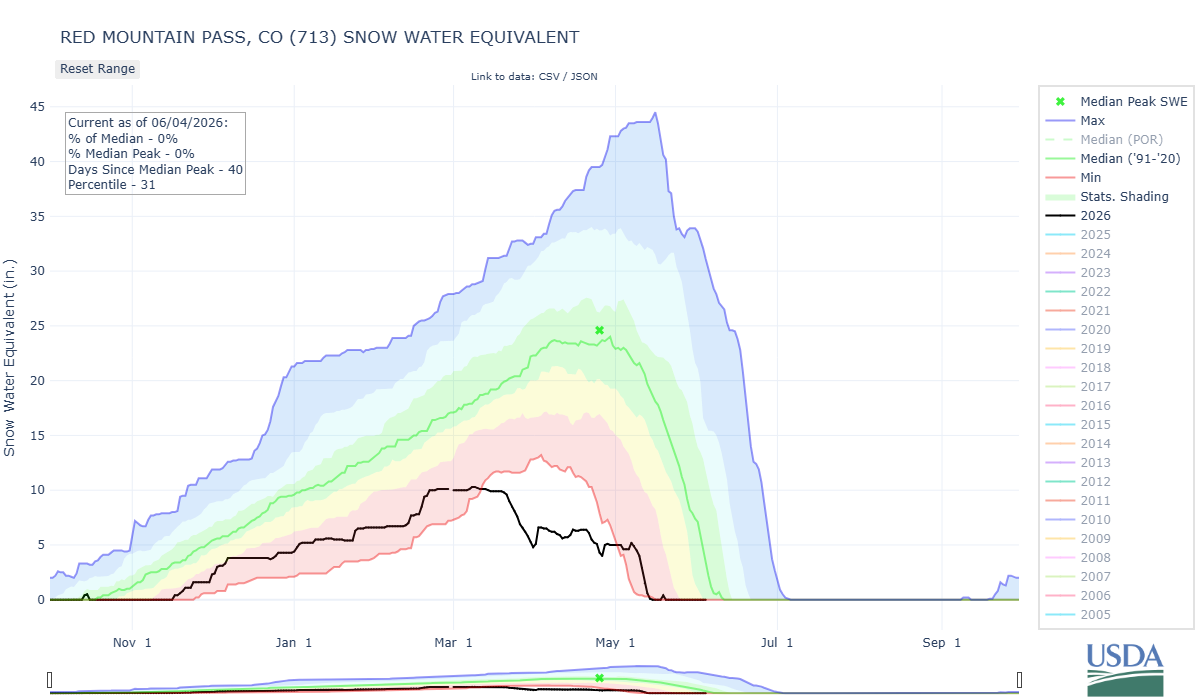
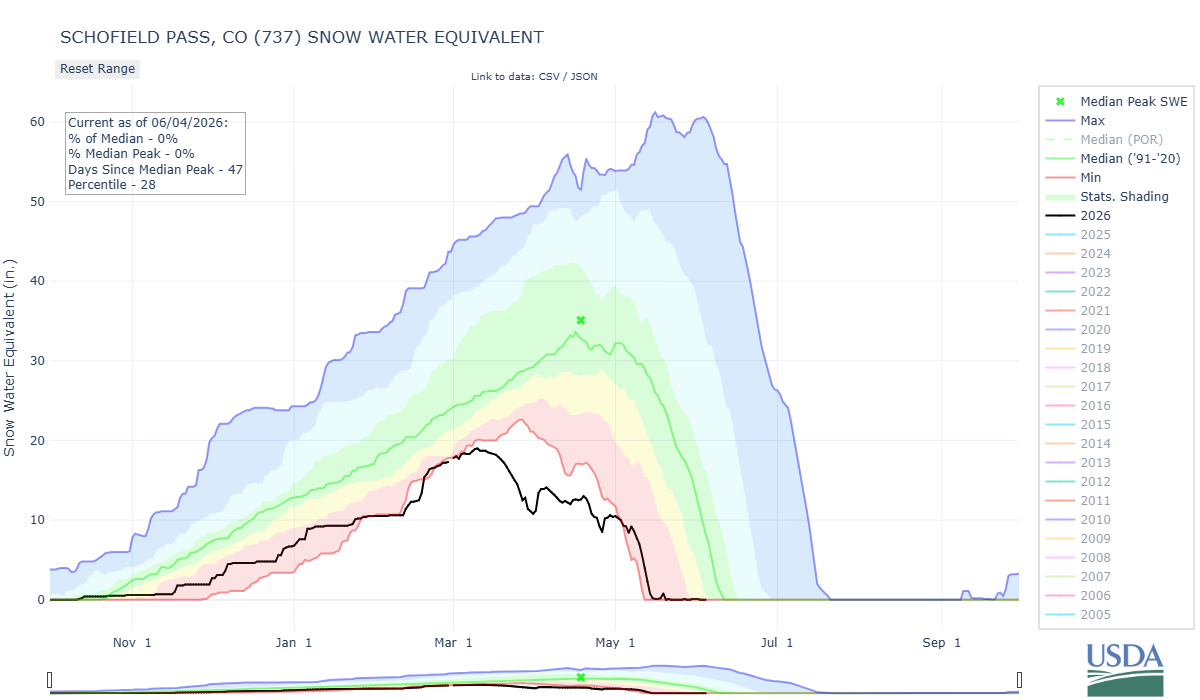
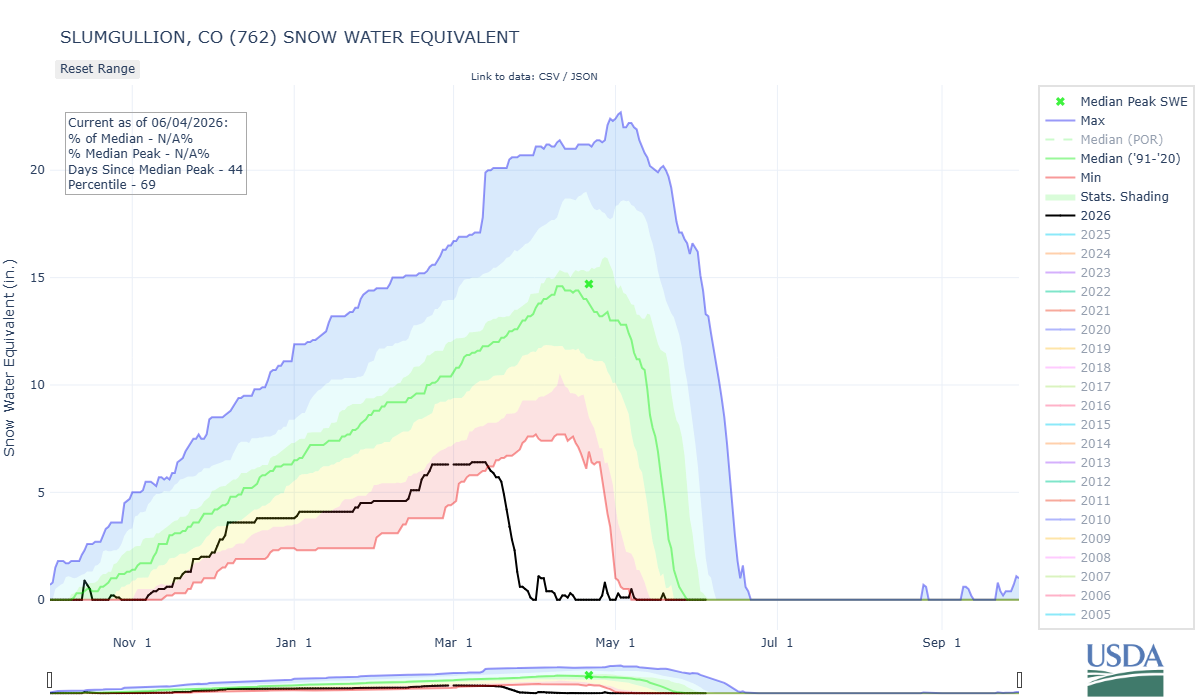
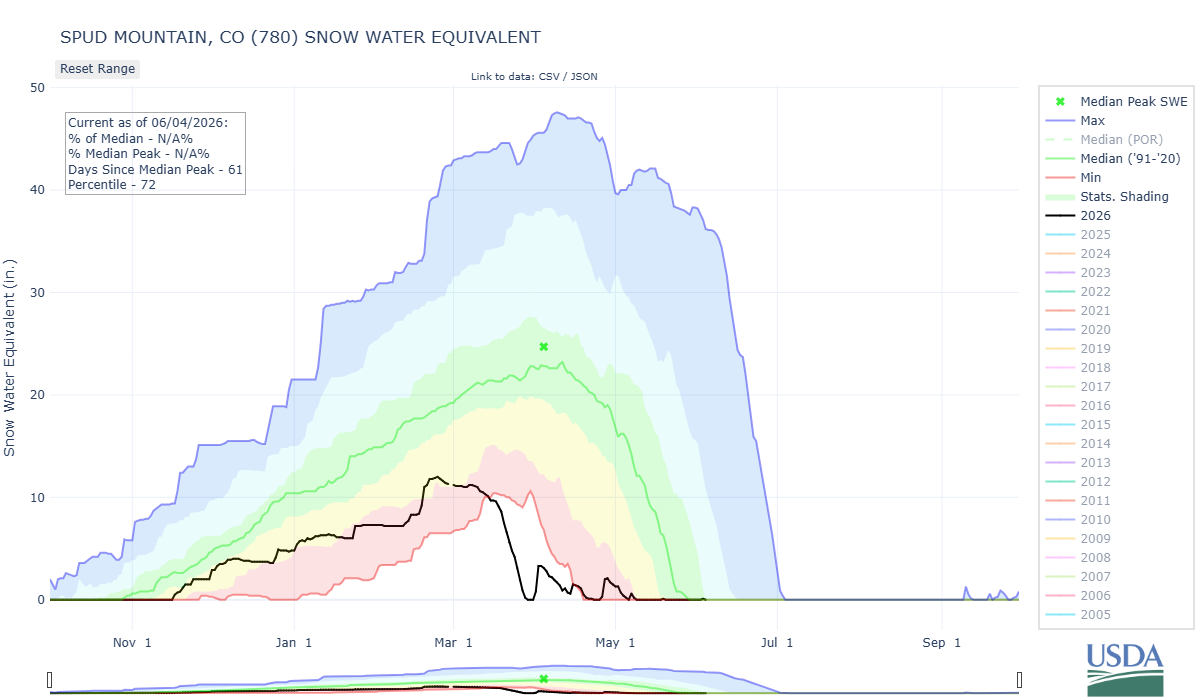
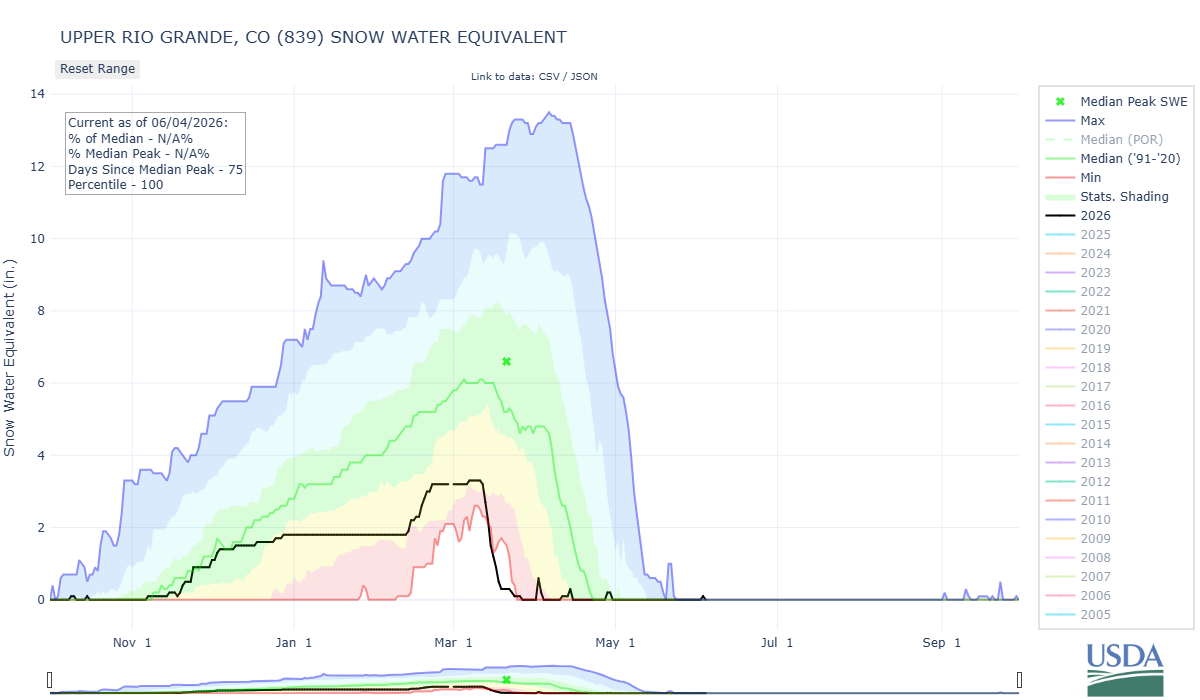
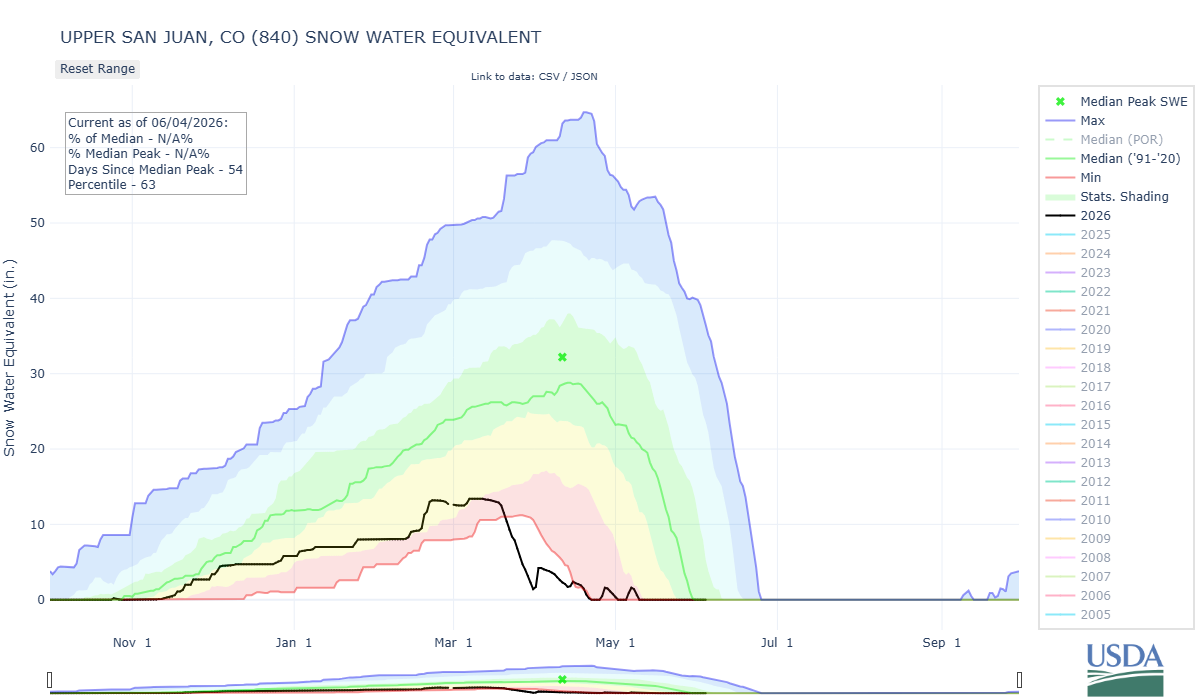
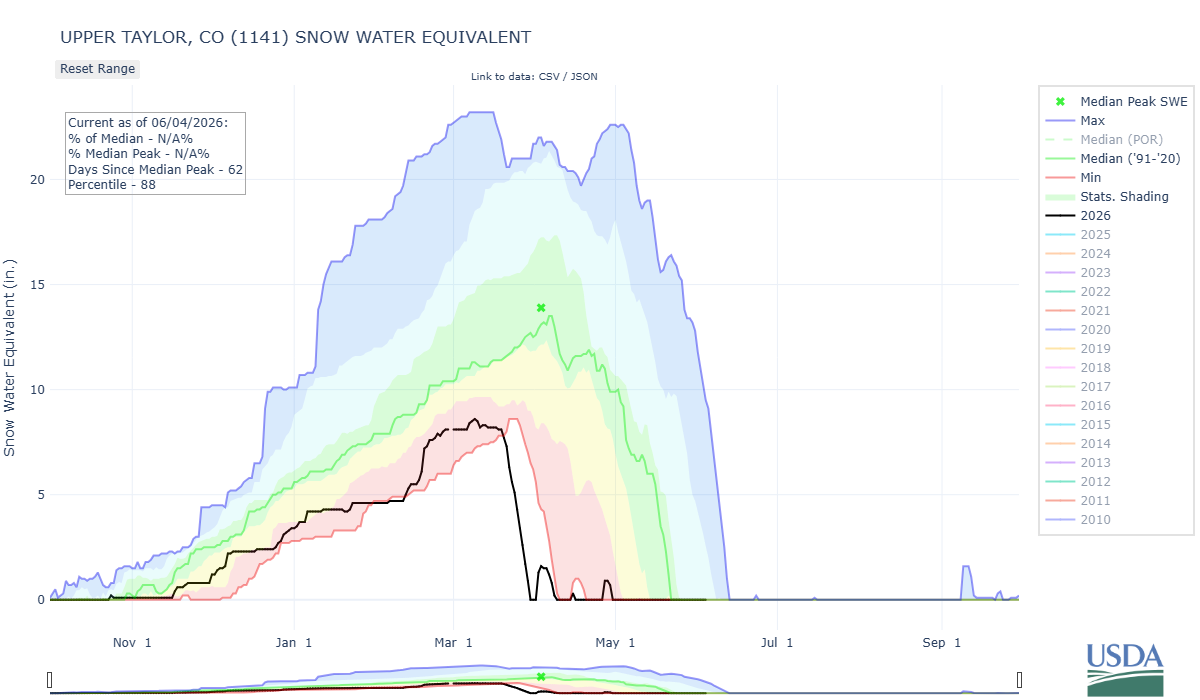
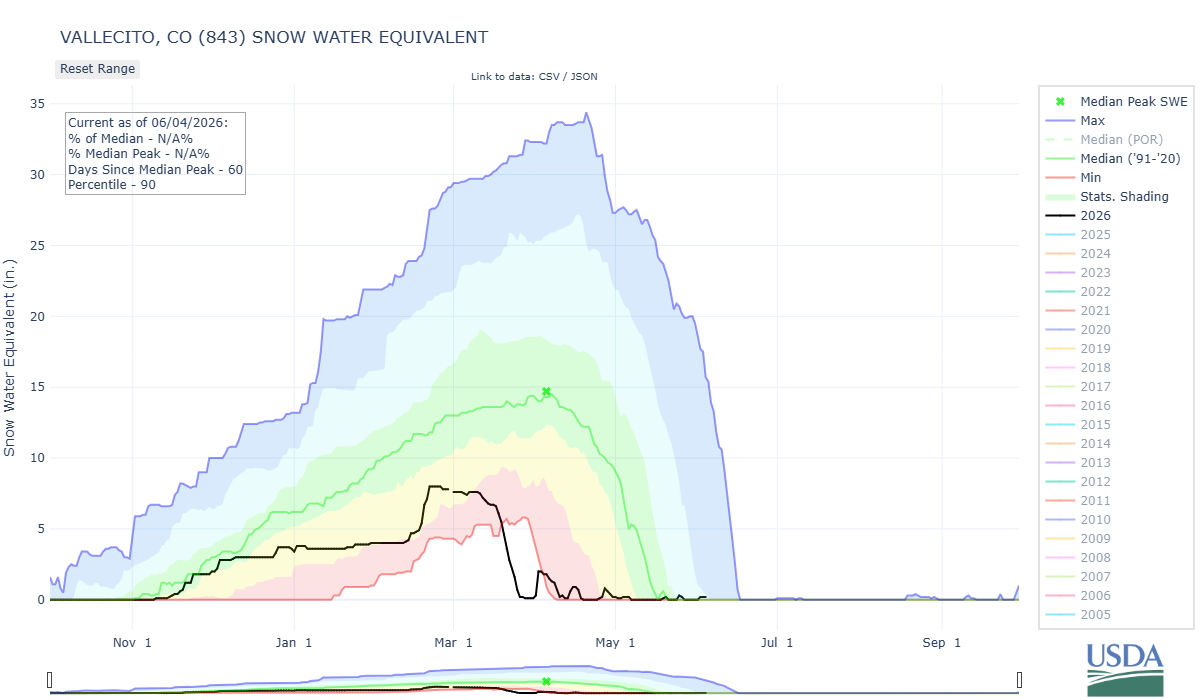
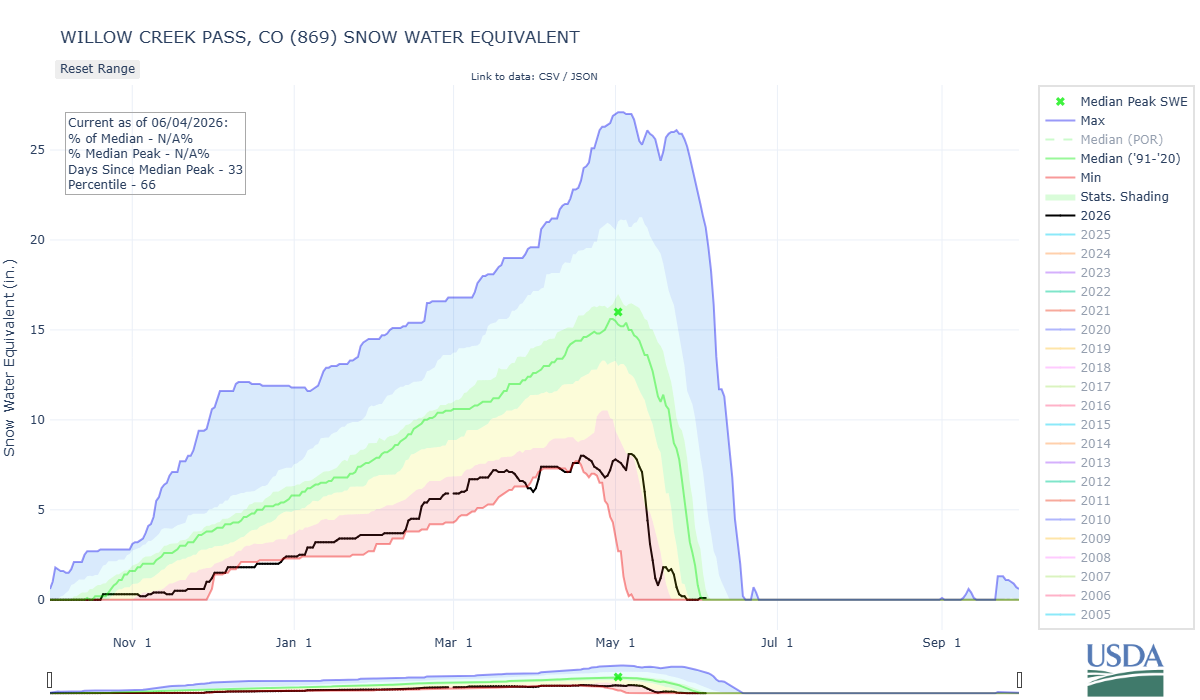
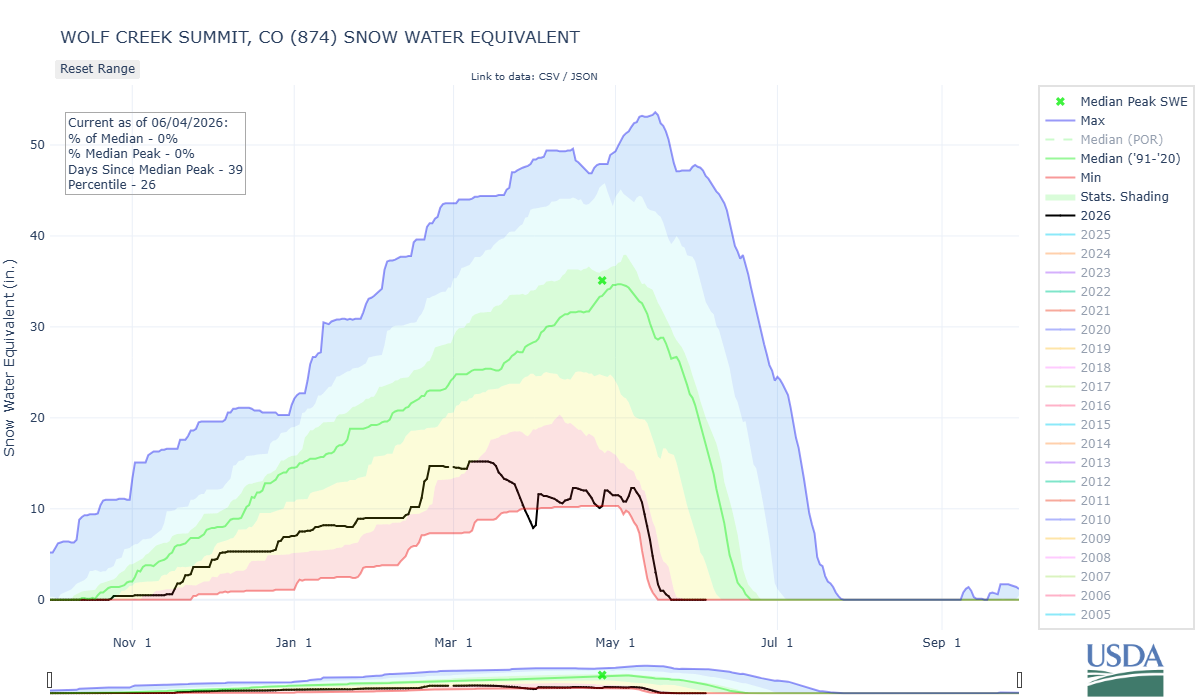
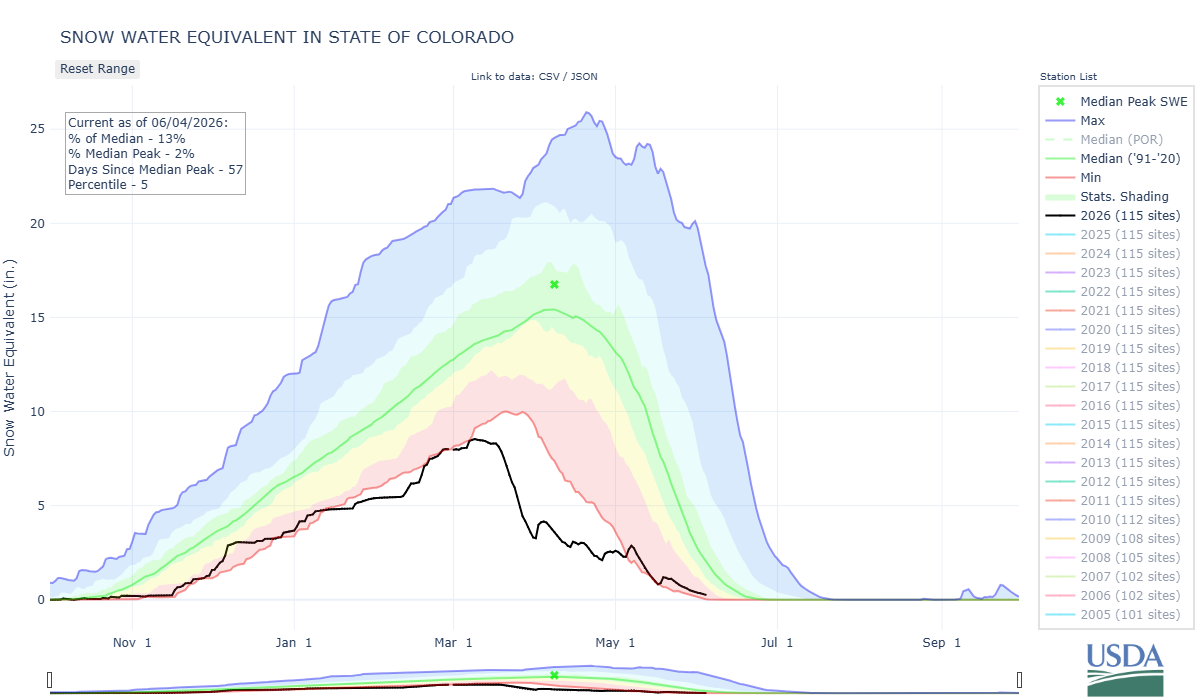
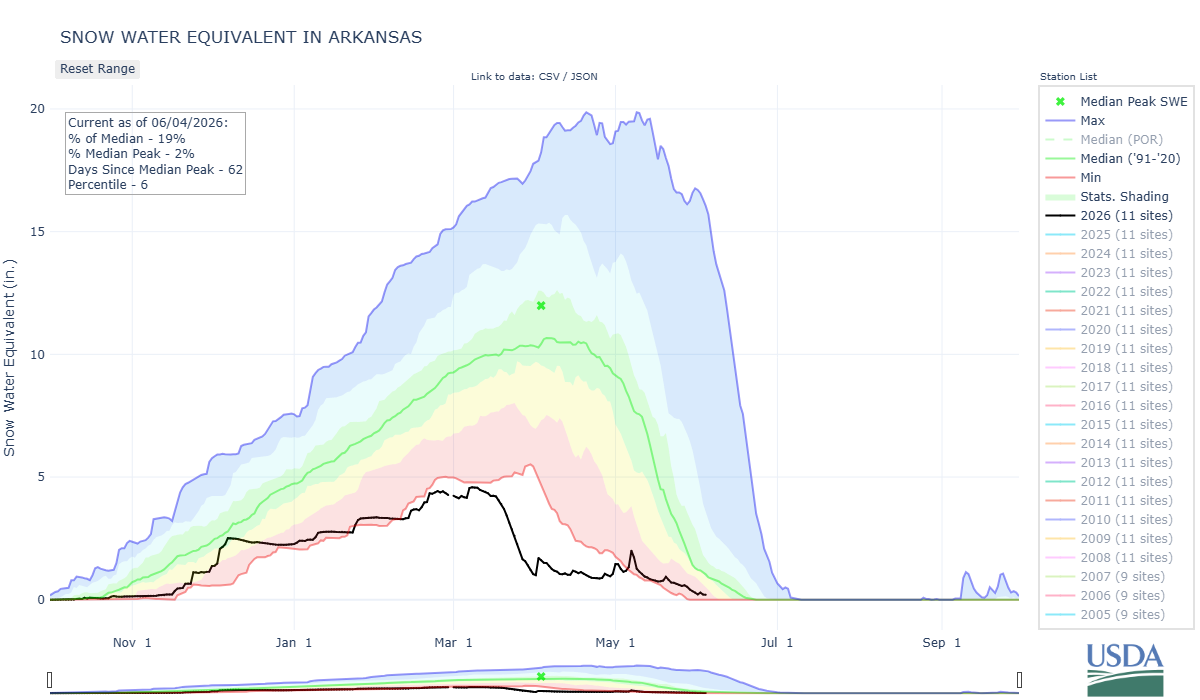
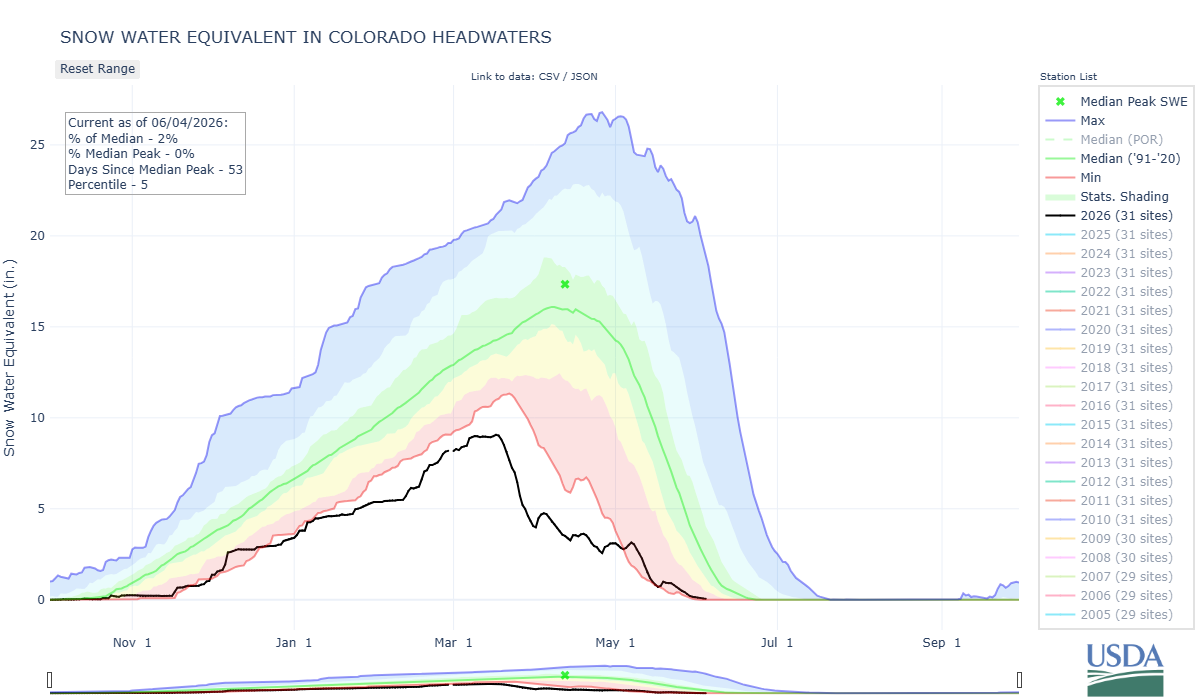
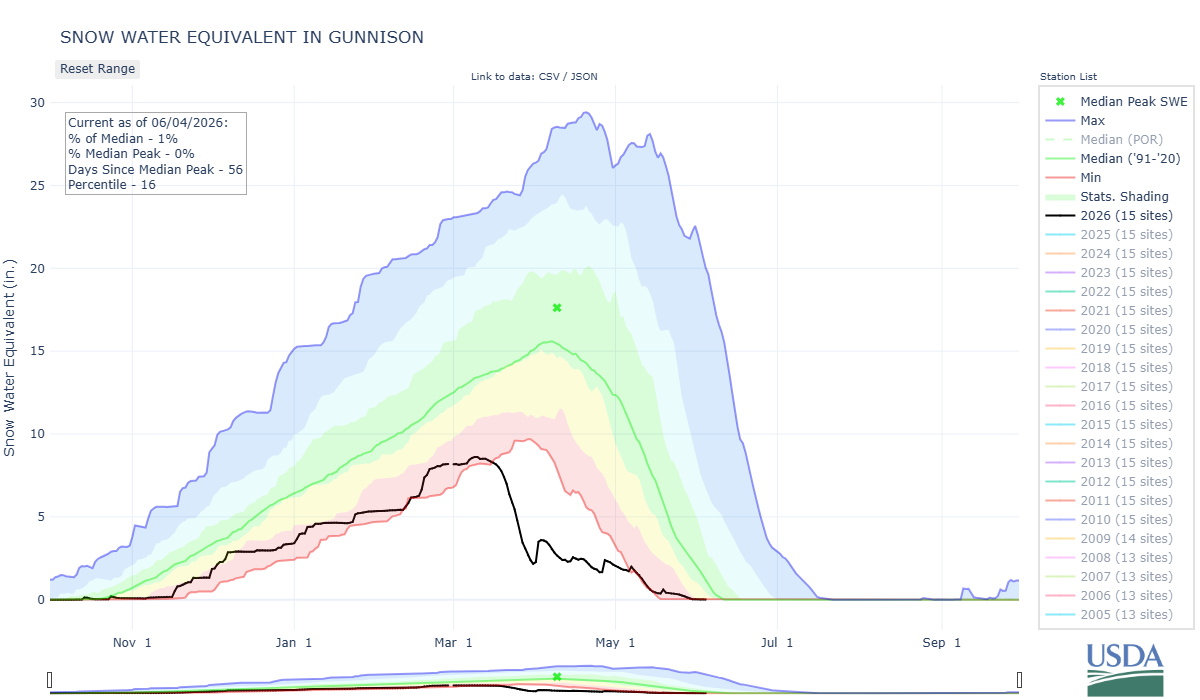
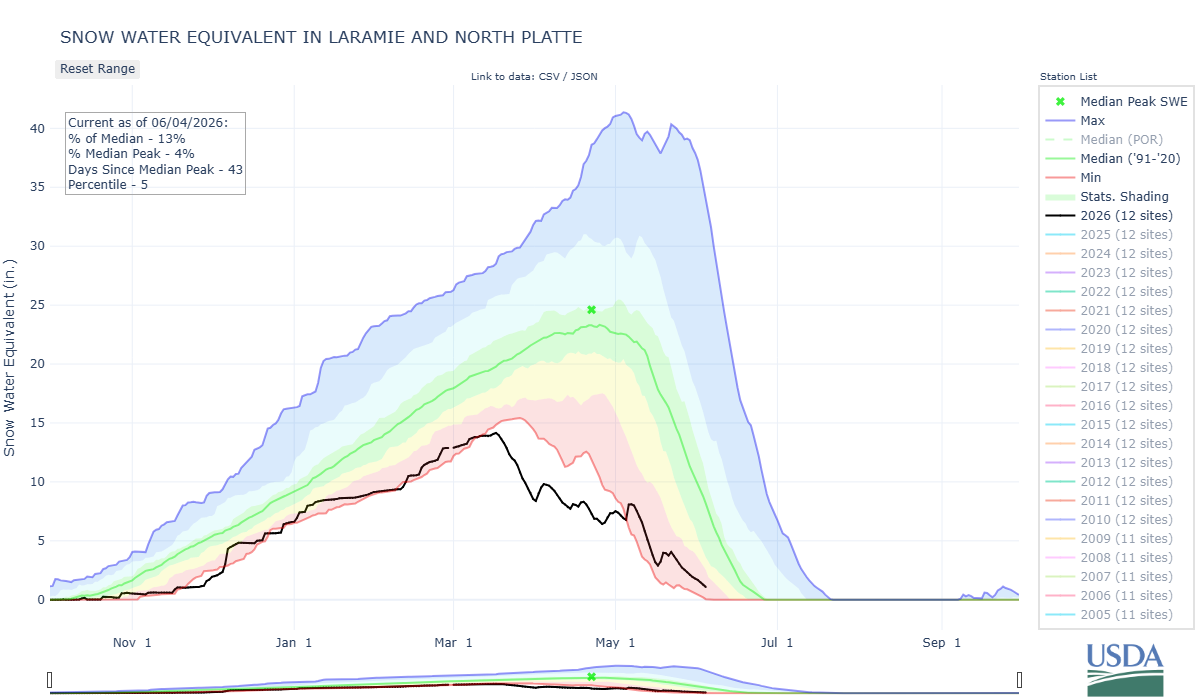
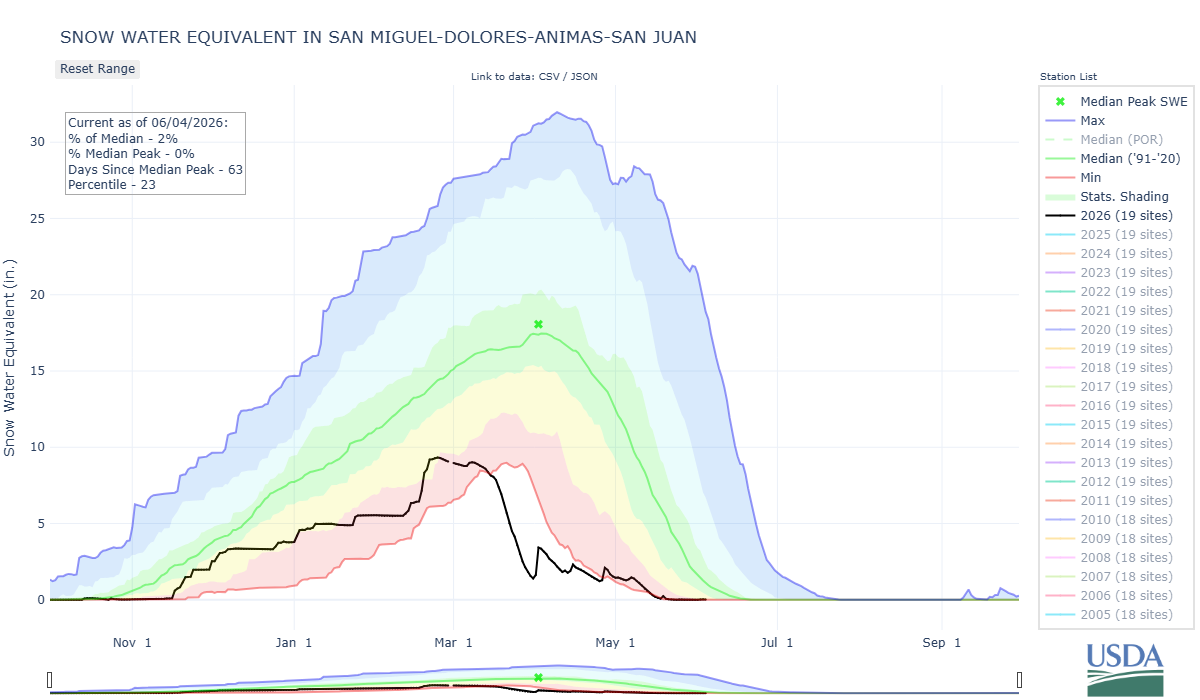
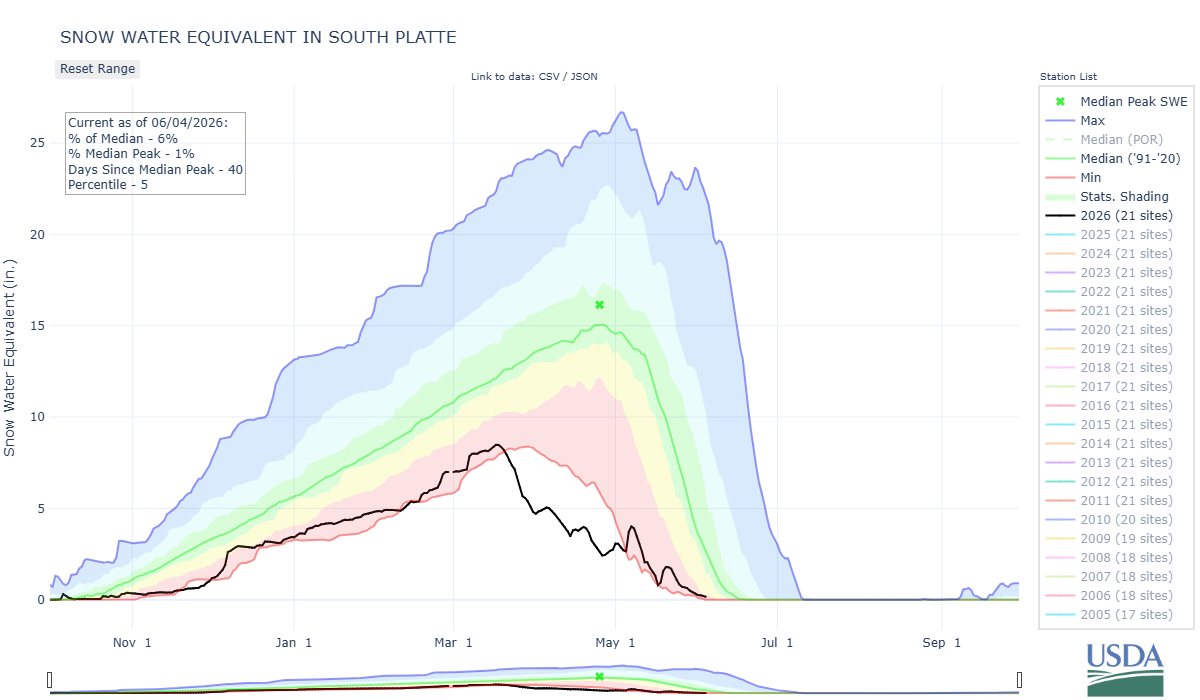
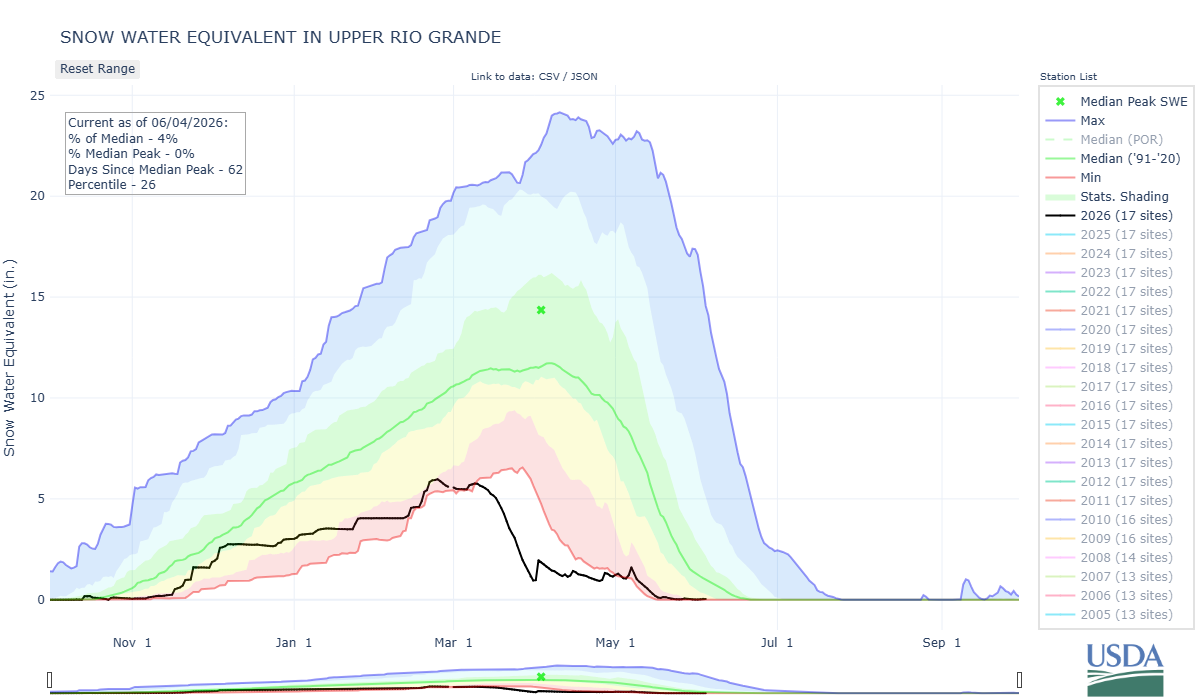
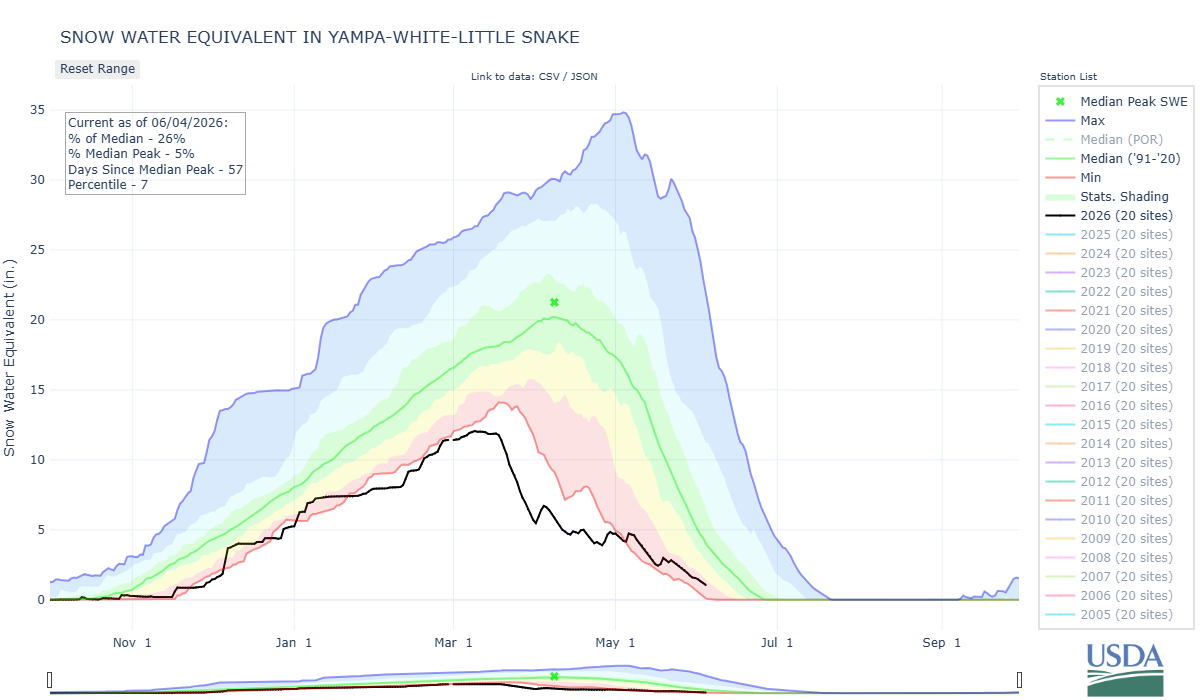
Below: Annual statistics for individual SNOTEL stations tracked by the CODOS Program.
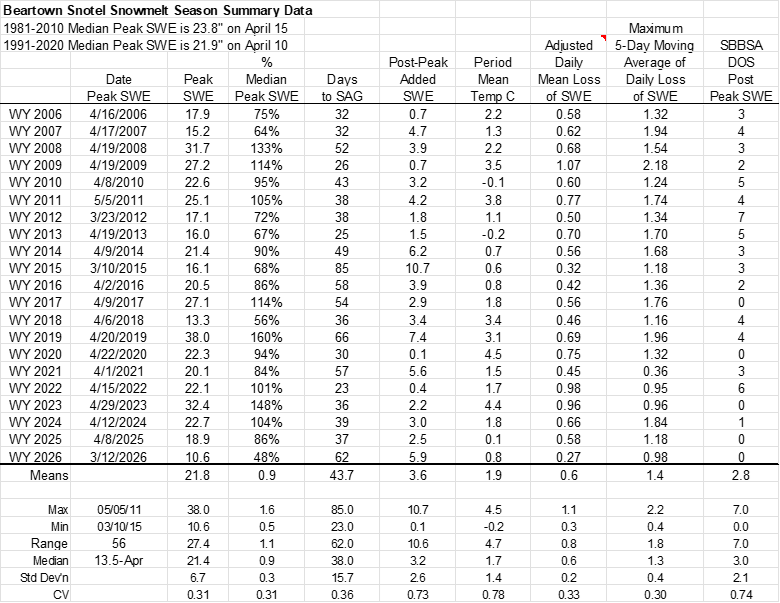
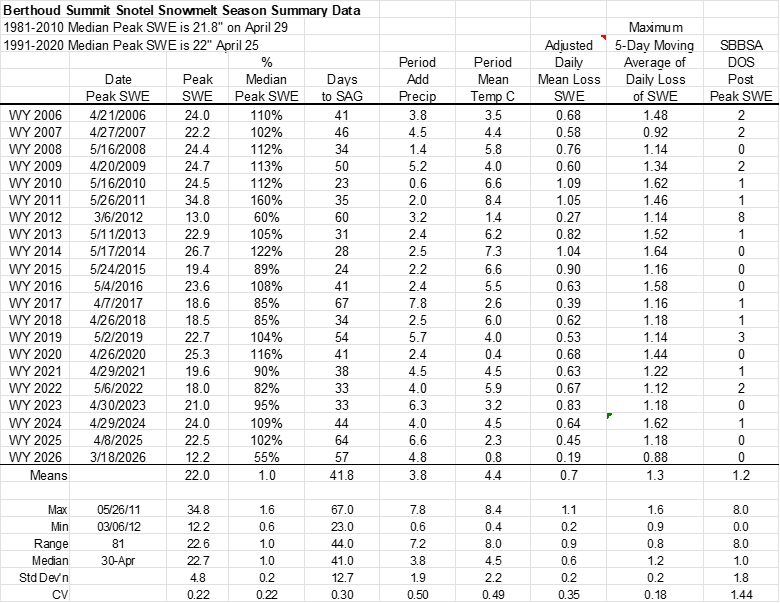
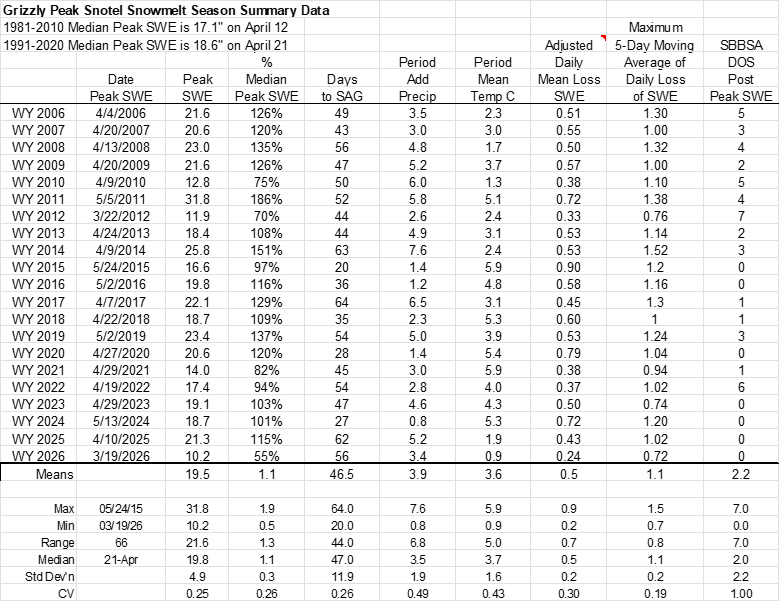
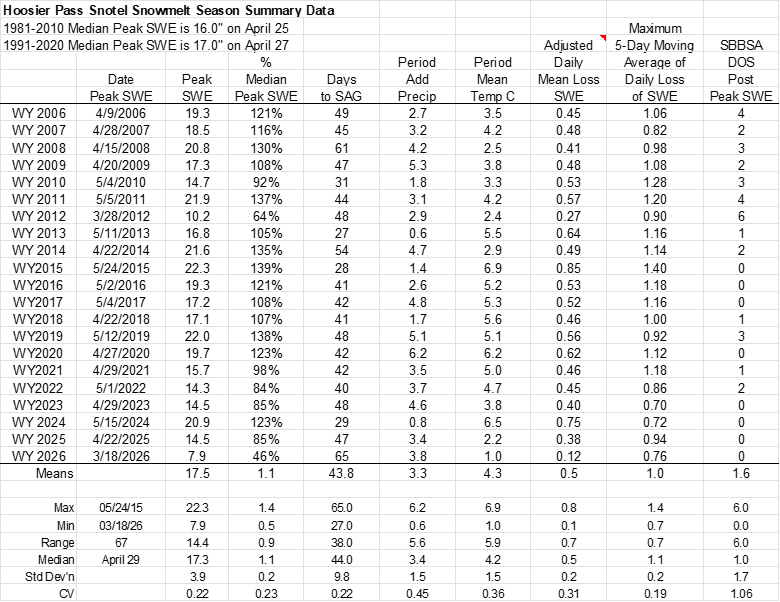
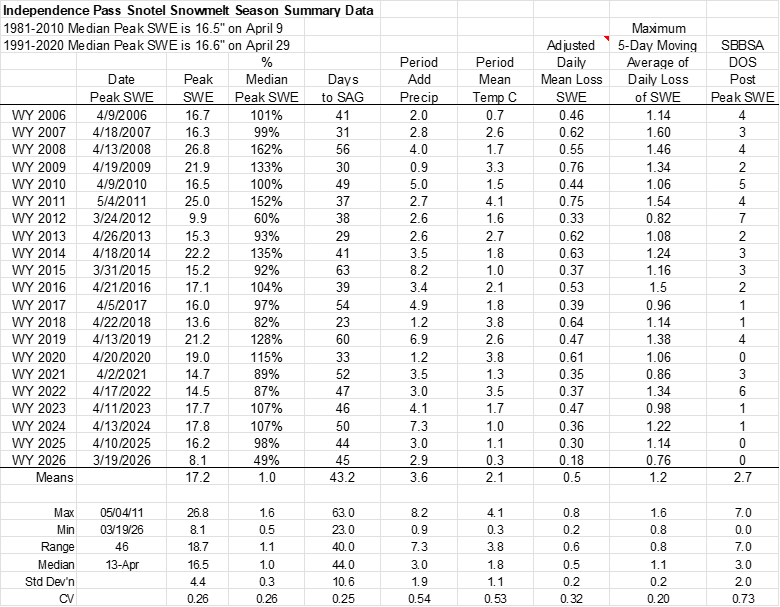
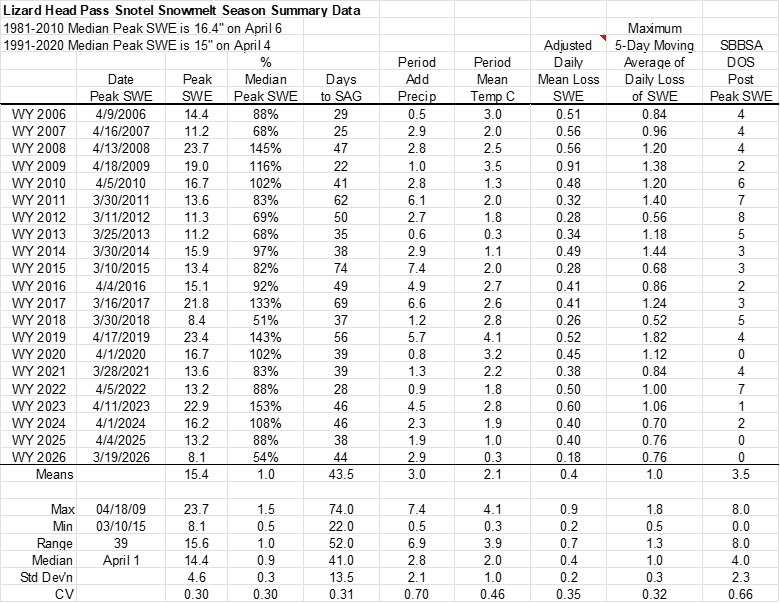
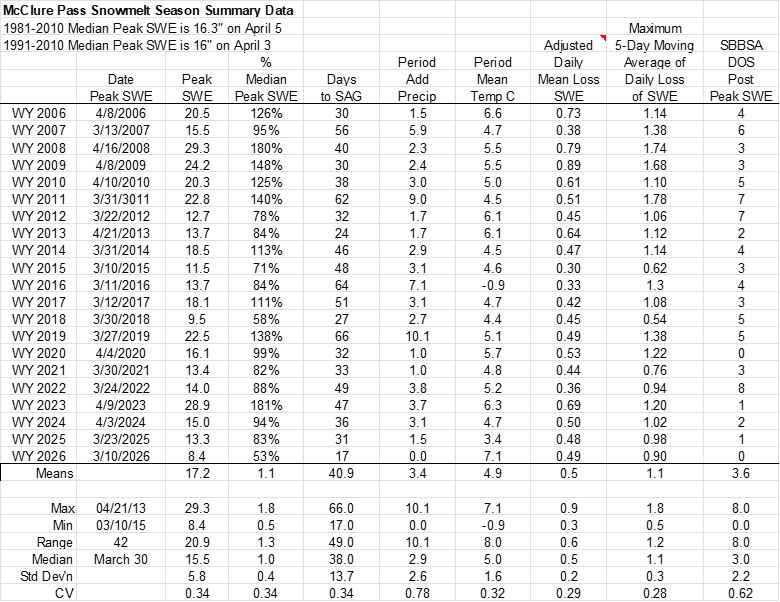
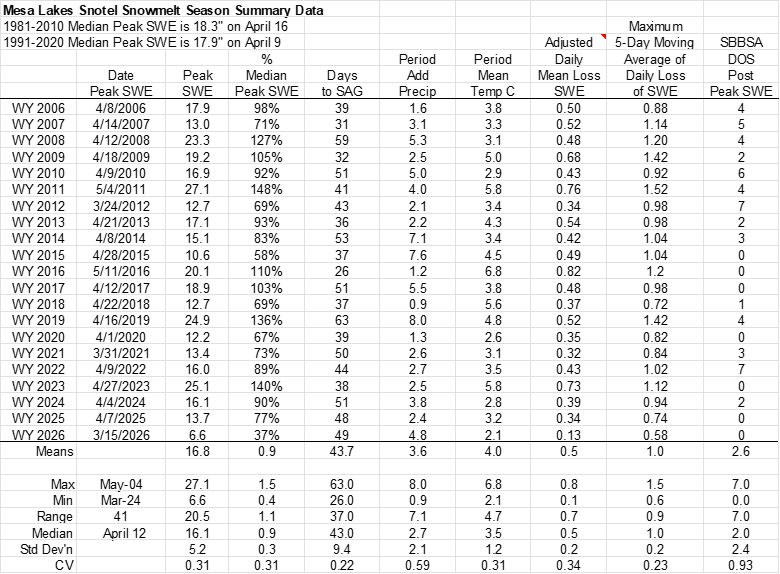
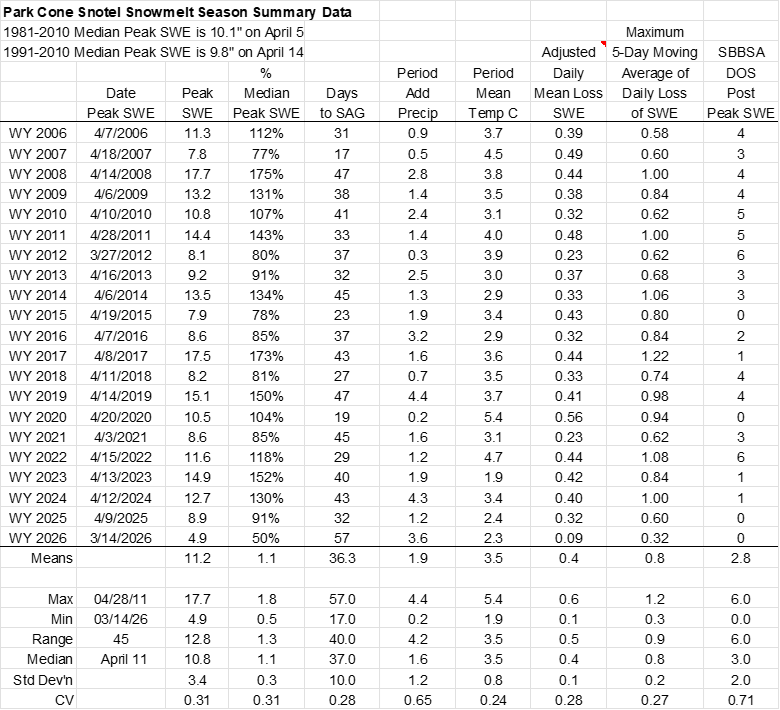
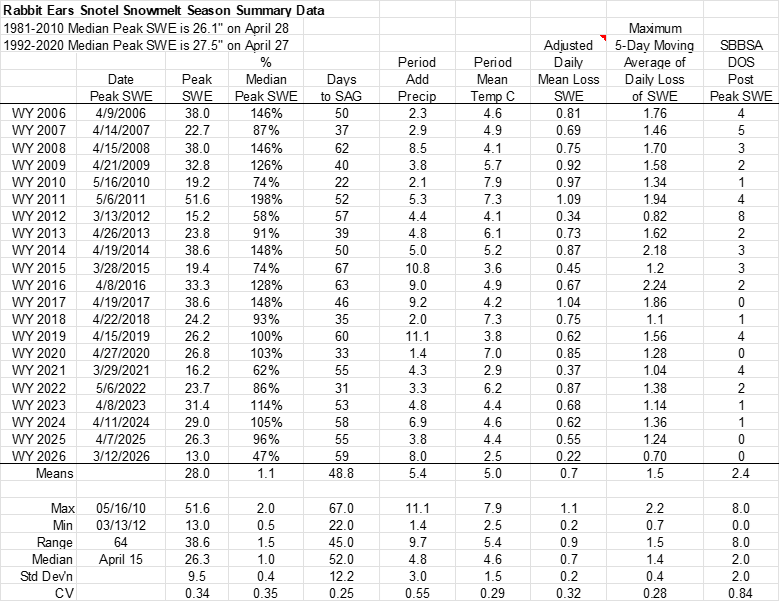
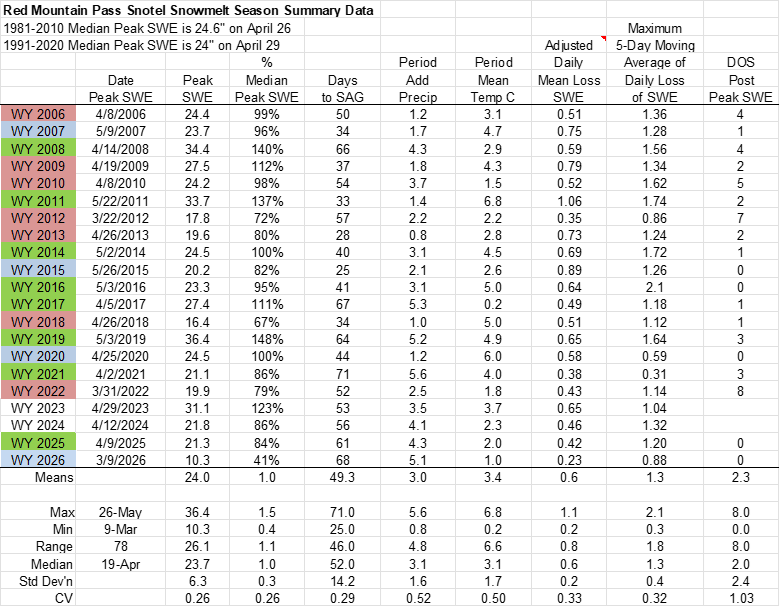
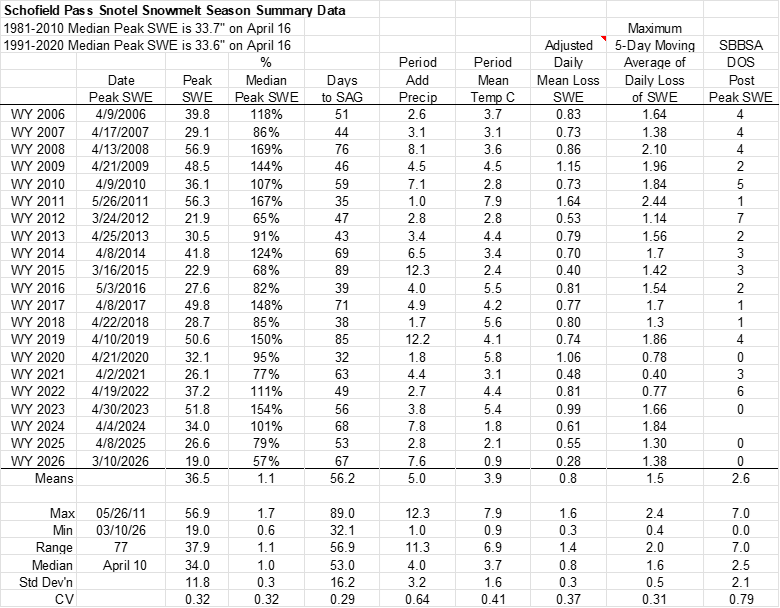
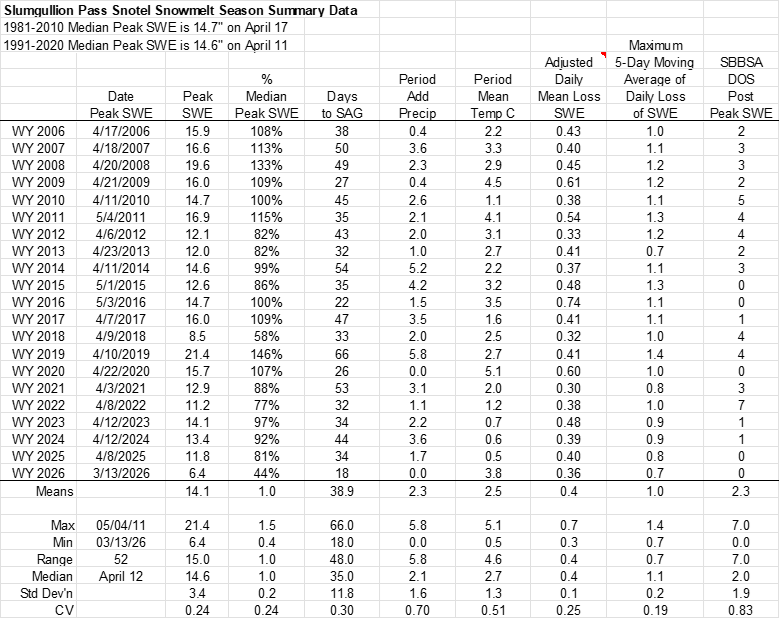
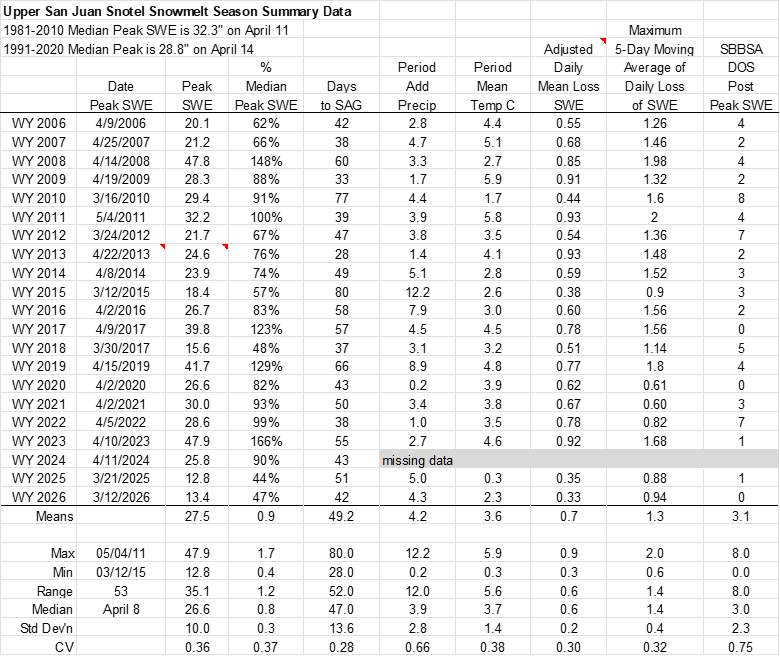
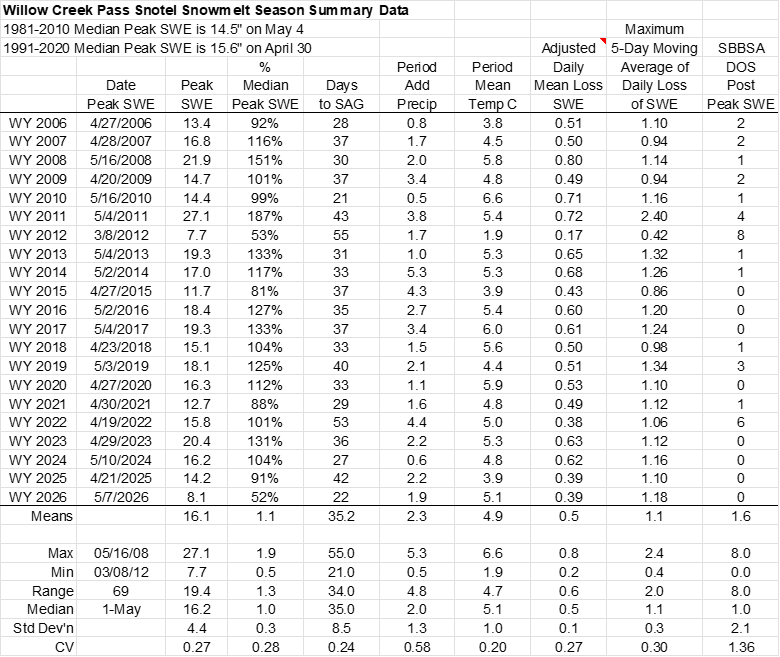
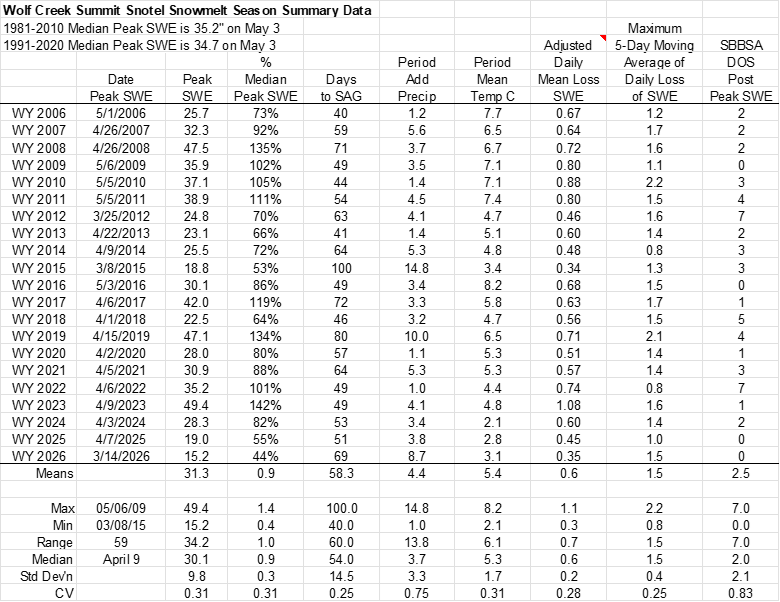
Below: Summary statistics for individual SNOTEL stations.
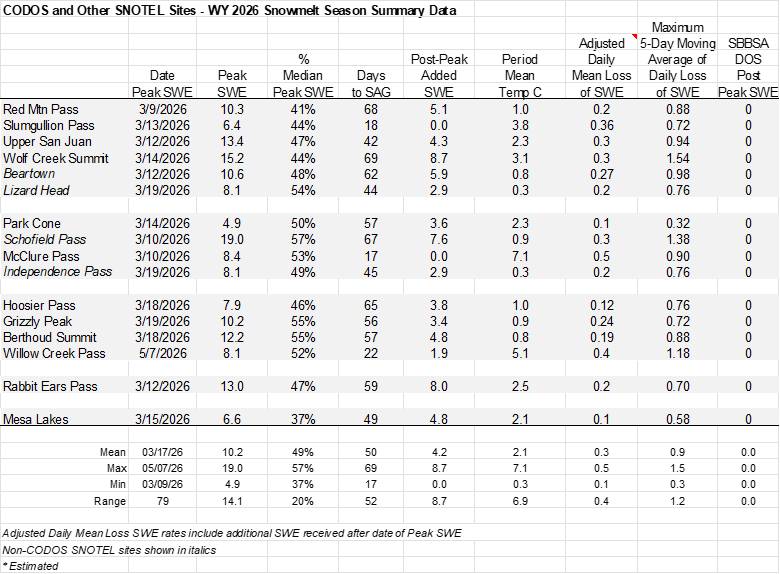
Below: Summary data for WY2026 at the 16 SNOTEL stations that CODOS monitors. The table shows peak SWE, and calculated from the day of peak SWE, melt rates, days to snow-all-gone, and mean temperature.
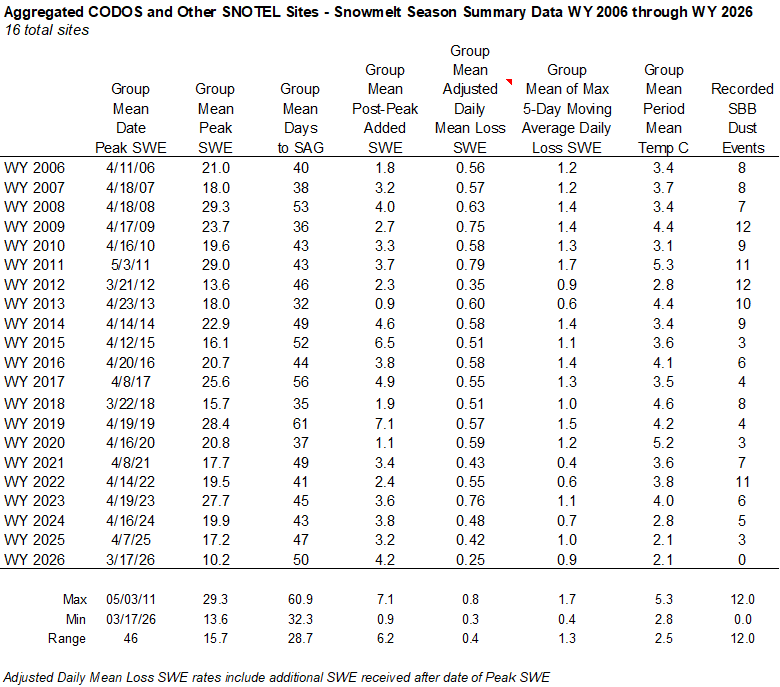
Below: A summary of WY 2006-2026 snowmelt rates and associated conditions at the 16 SNOTEL stations that CODOS routinely monitors. Days to SAG refers to the time between peak SWE and “snow all gone” at the SNOTEL sites. Adjusted Daily Mean Loss calculates the rate of snowmelt following peak SWE, including all precipitation received after peak SWE (assumed to be snow). Melt rate tables are presented for each of the 11 CODOS monitoring sites on their webpages.
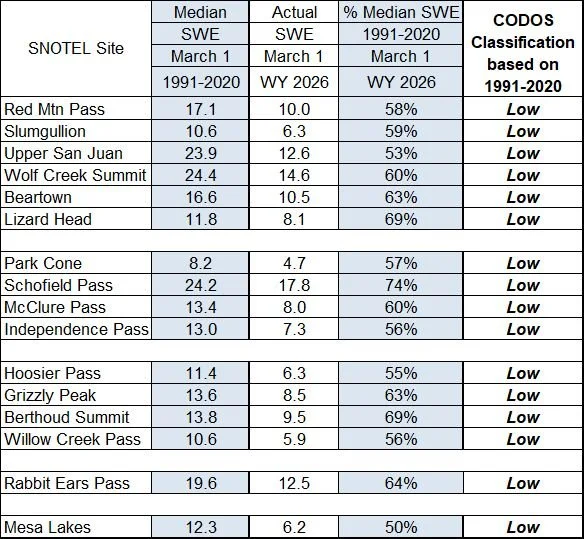
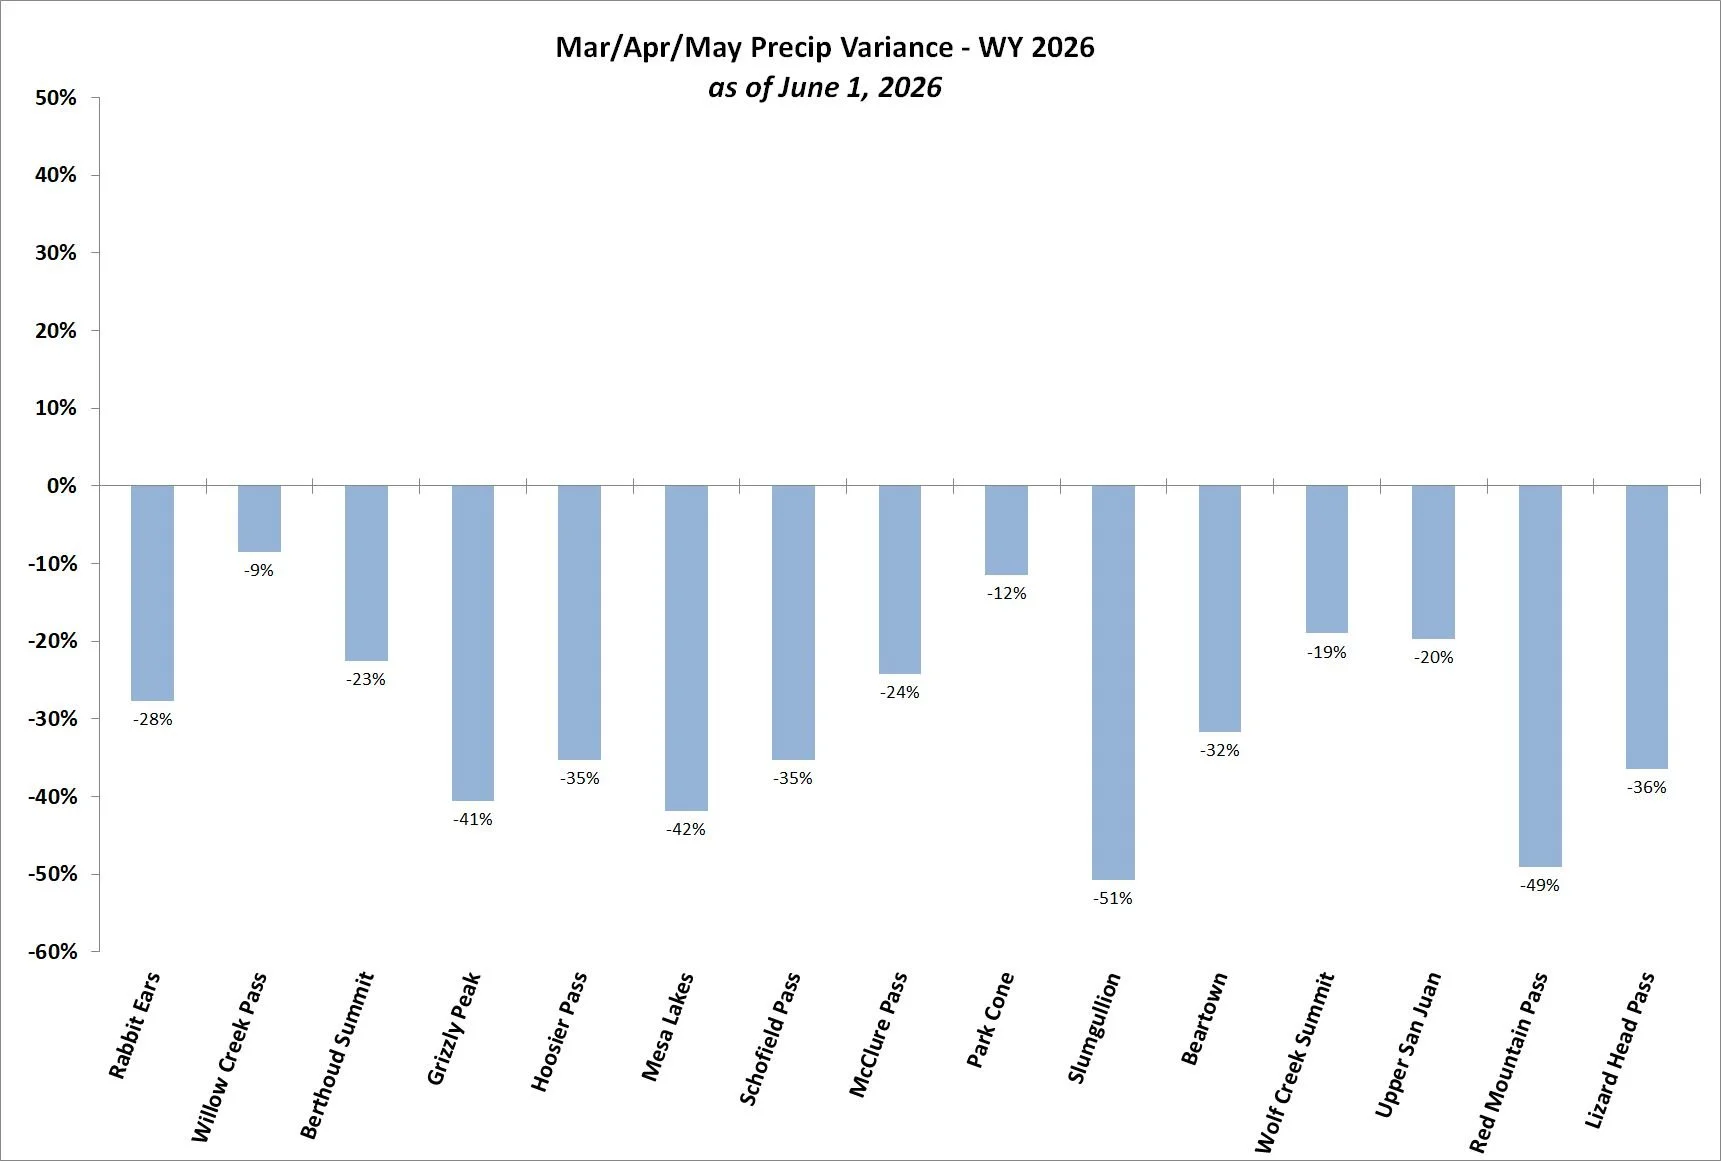
Above/Below: Our Dust Enhanced Runoff Classification (see below) has three components, 1) Snowpack conditions going into spring (March 1) 2) Dust severity, and 3) March/April/May precipitation. March 1st SWE was low across the state and spring precipitation was 9%-51% below normal.
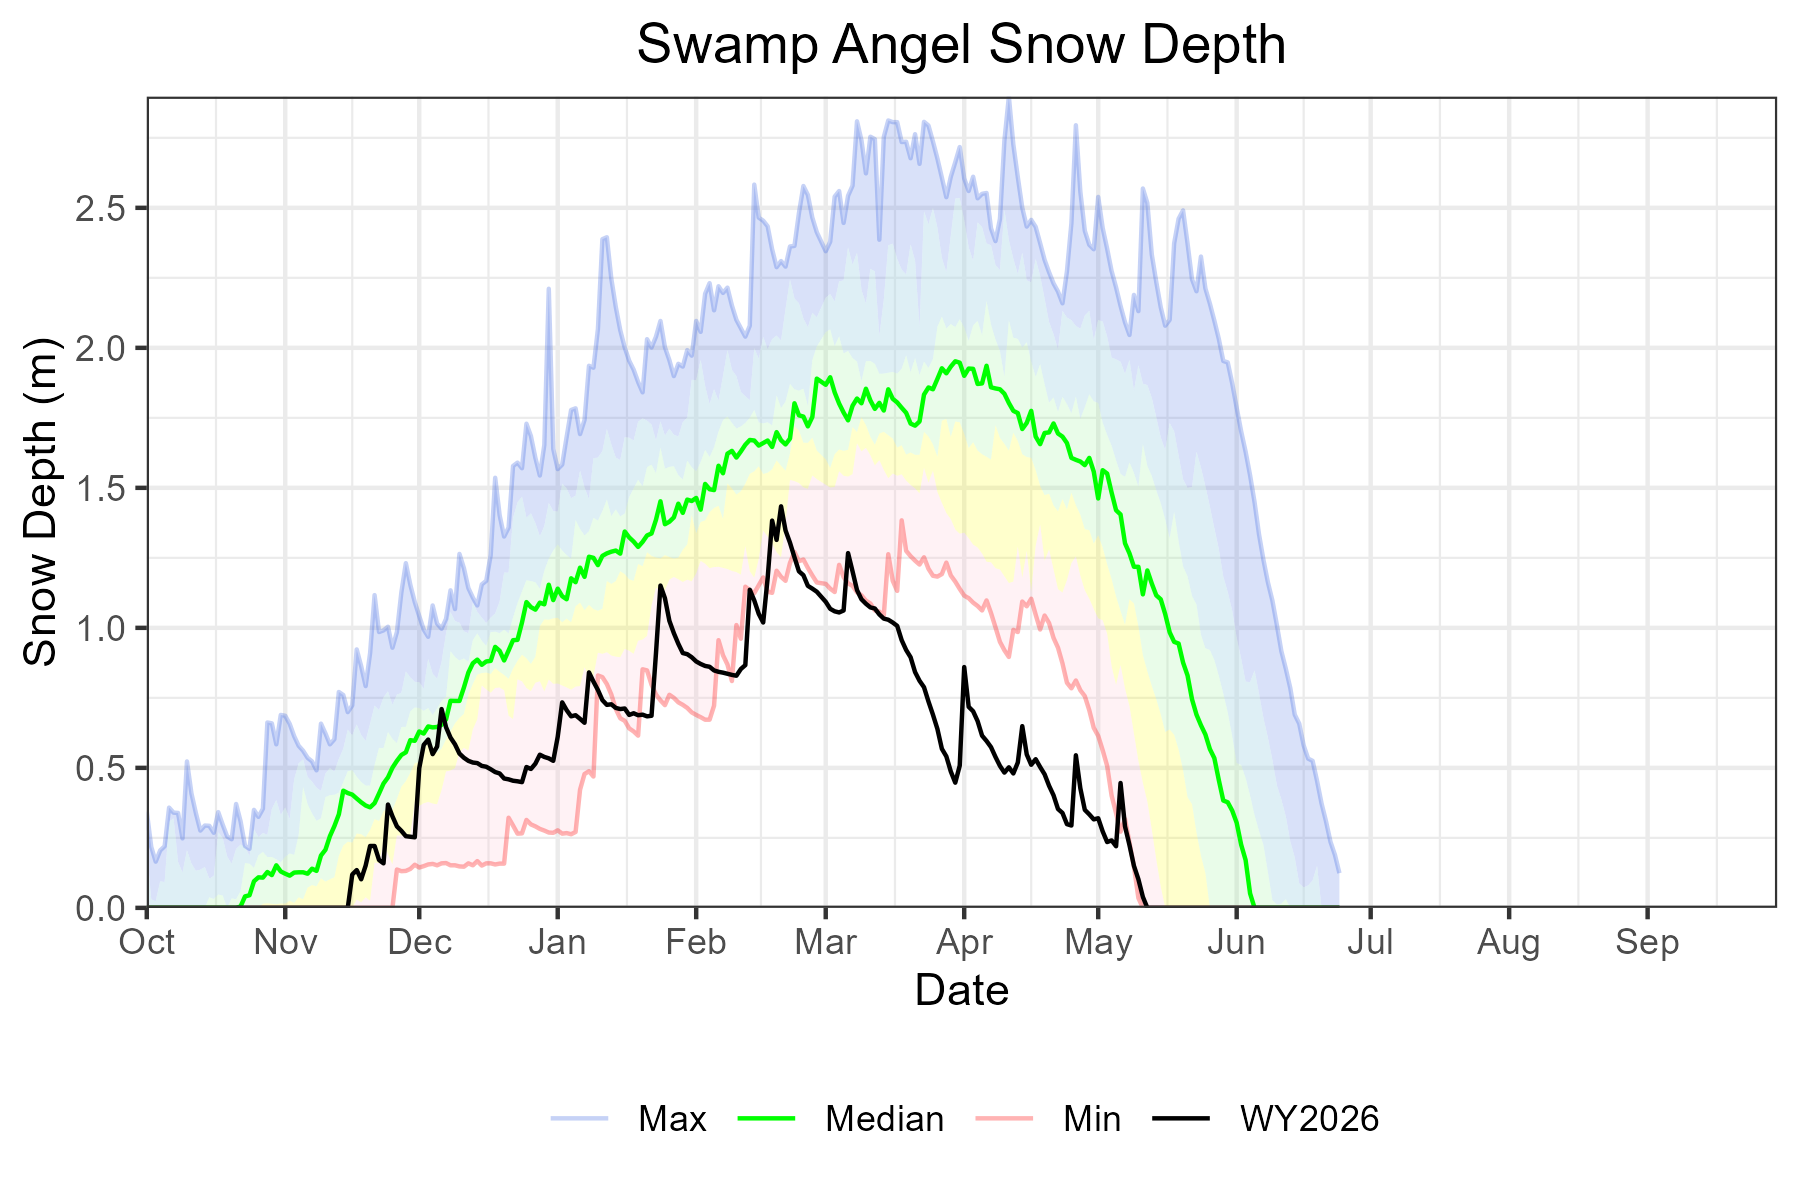
Above: Snow depth at Swamp Angel Study Plot.
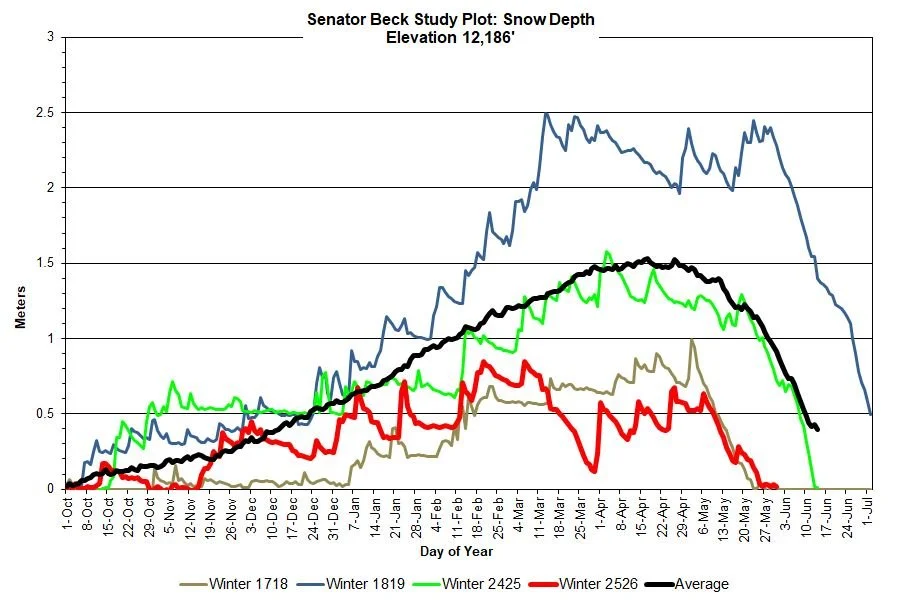
Above: Snow depth at Senator Beck Study Plot.
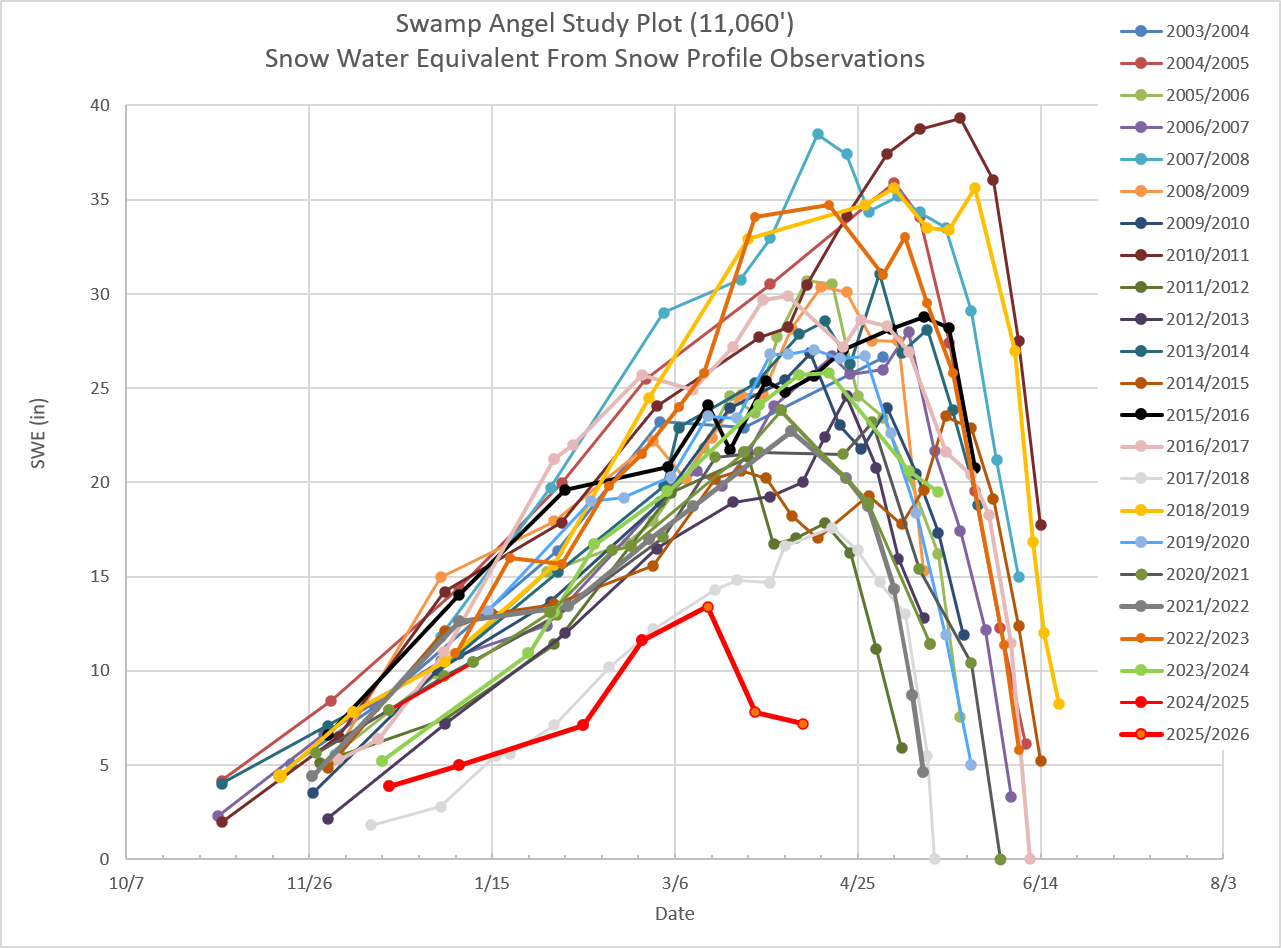
Above: Snow water equivalent at Swamp Angel from snow profiles.
DUST-ON-SNOW CONDITIONS
DUST ENHANCED RUNOFF CLASSIFICATION:
In Water Year 2015 CODOS introduced a Dust Enhanced Runoff Classification (DERC) approach to linking dust-on-snow, snowpack, and spring weather conditions to patterns in statewide hydrographs within a 3x3x3 Dust Enhanced Runoff Space. The below table presents the final DERC classification of WY2026 parameters at each of the 20 stream gauges monitored by CODOS. Water Years 2006-2026 classifications are contained in Excel workbook Runoff_Space_by_Region_and_WY.xlsx. Another workbook, Runoff_Space_by_Watershed.xlsx, contains individual DERC analyses for WY 2006-2026 for each of the 20 stream gauges.
A conceptual Dust Enhanced Snowmelt Runoff Space integrating the interactions of March 1 SWE, dust intensity, and spring precipitation.
Current and prior seasons snowpack conditions, dust severity, and spring precipitation are mapped for individual DERC space along with the hydrographs. These analyses are presented in PDF format and are available for the watersheds listed below. Referencing these DERC spaces in spring is helpful to get and idea how spring runoff will possibly unfold.
It was the mildest dust year in Colorado on record according to our observations during our CODOS tours. We like to say “no storms, no dust” as a generality, and if that could do all of the explaining, it would, seeing as this was the fewest record dust events and lowest snowpack on record. The storms were lessened and underperformed, and some snowpacks were melted out before they might have seen a dust event.
However, the relationship between the severity and extent of dust-on-snow events and climate conditions is still undetermined. There is no straightforward explanation; factors that are likely at play in dust emissions include wind speeds, wind direction, surface roughness (vegetation), human activity, and precipitation quantity and frequency over the dust source area (Naples et al., 2025, Hennen et al., 2023). Though we now have twenty years of dust-on-snow data, the trends are not clear and more research is needed. Climate patterns, including the chaotic one we are driving ourselves into with fossil fuels, can last decades. We started collecting dust-on-snow data at the start of what might be called a 26 year ‘mega-drought’ and despite our best projections, we don’t know the future.
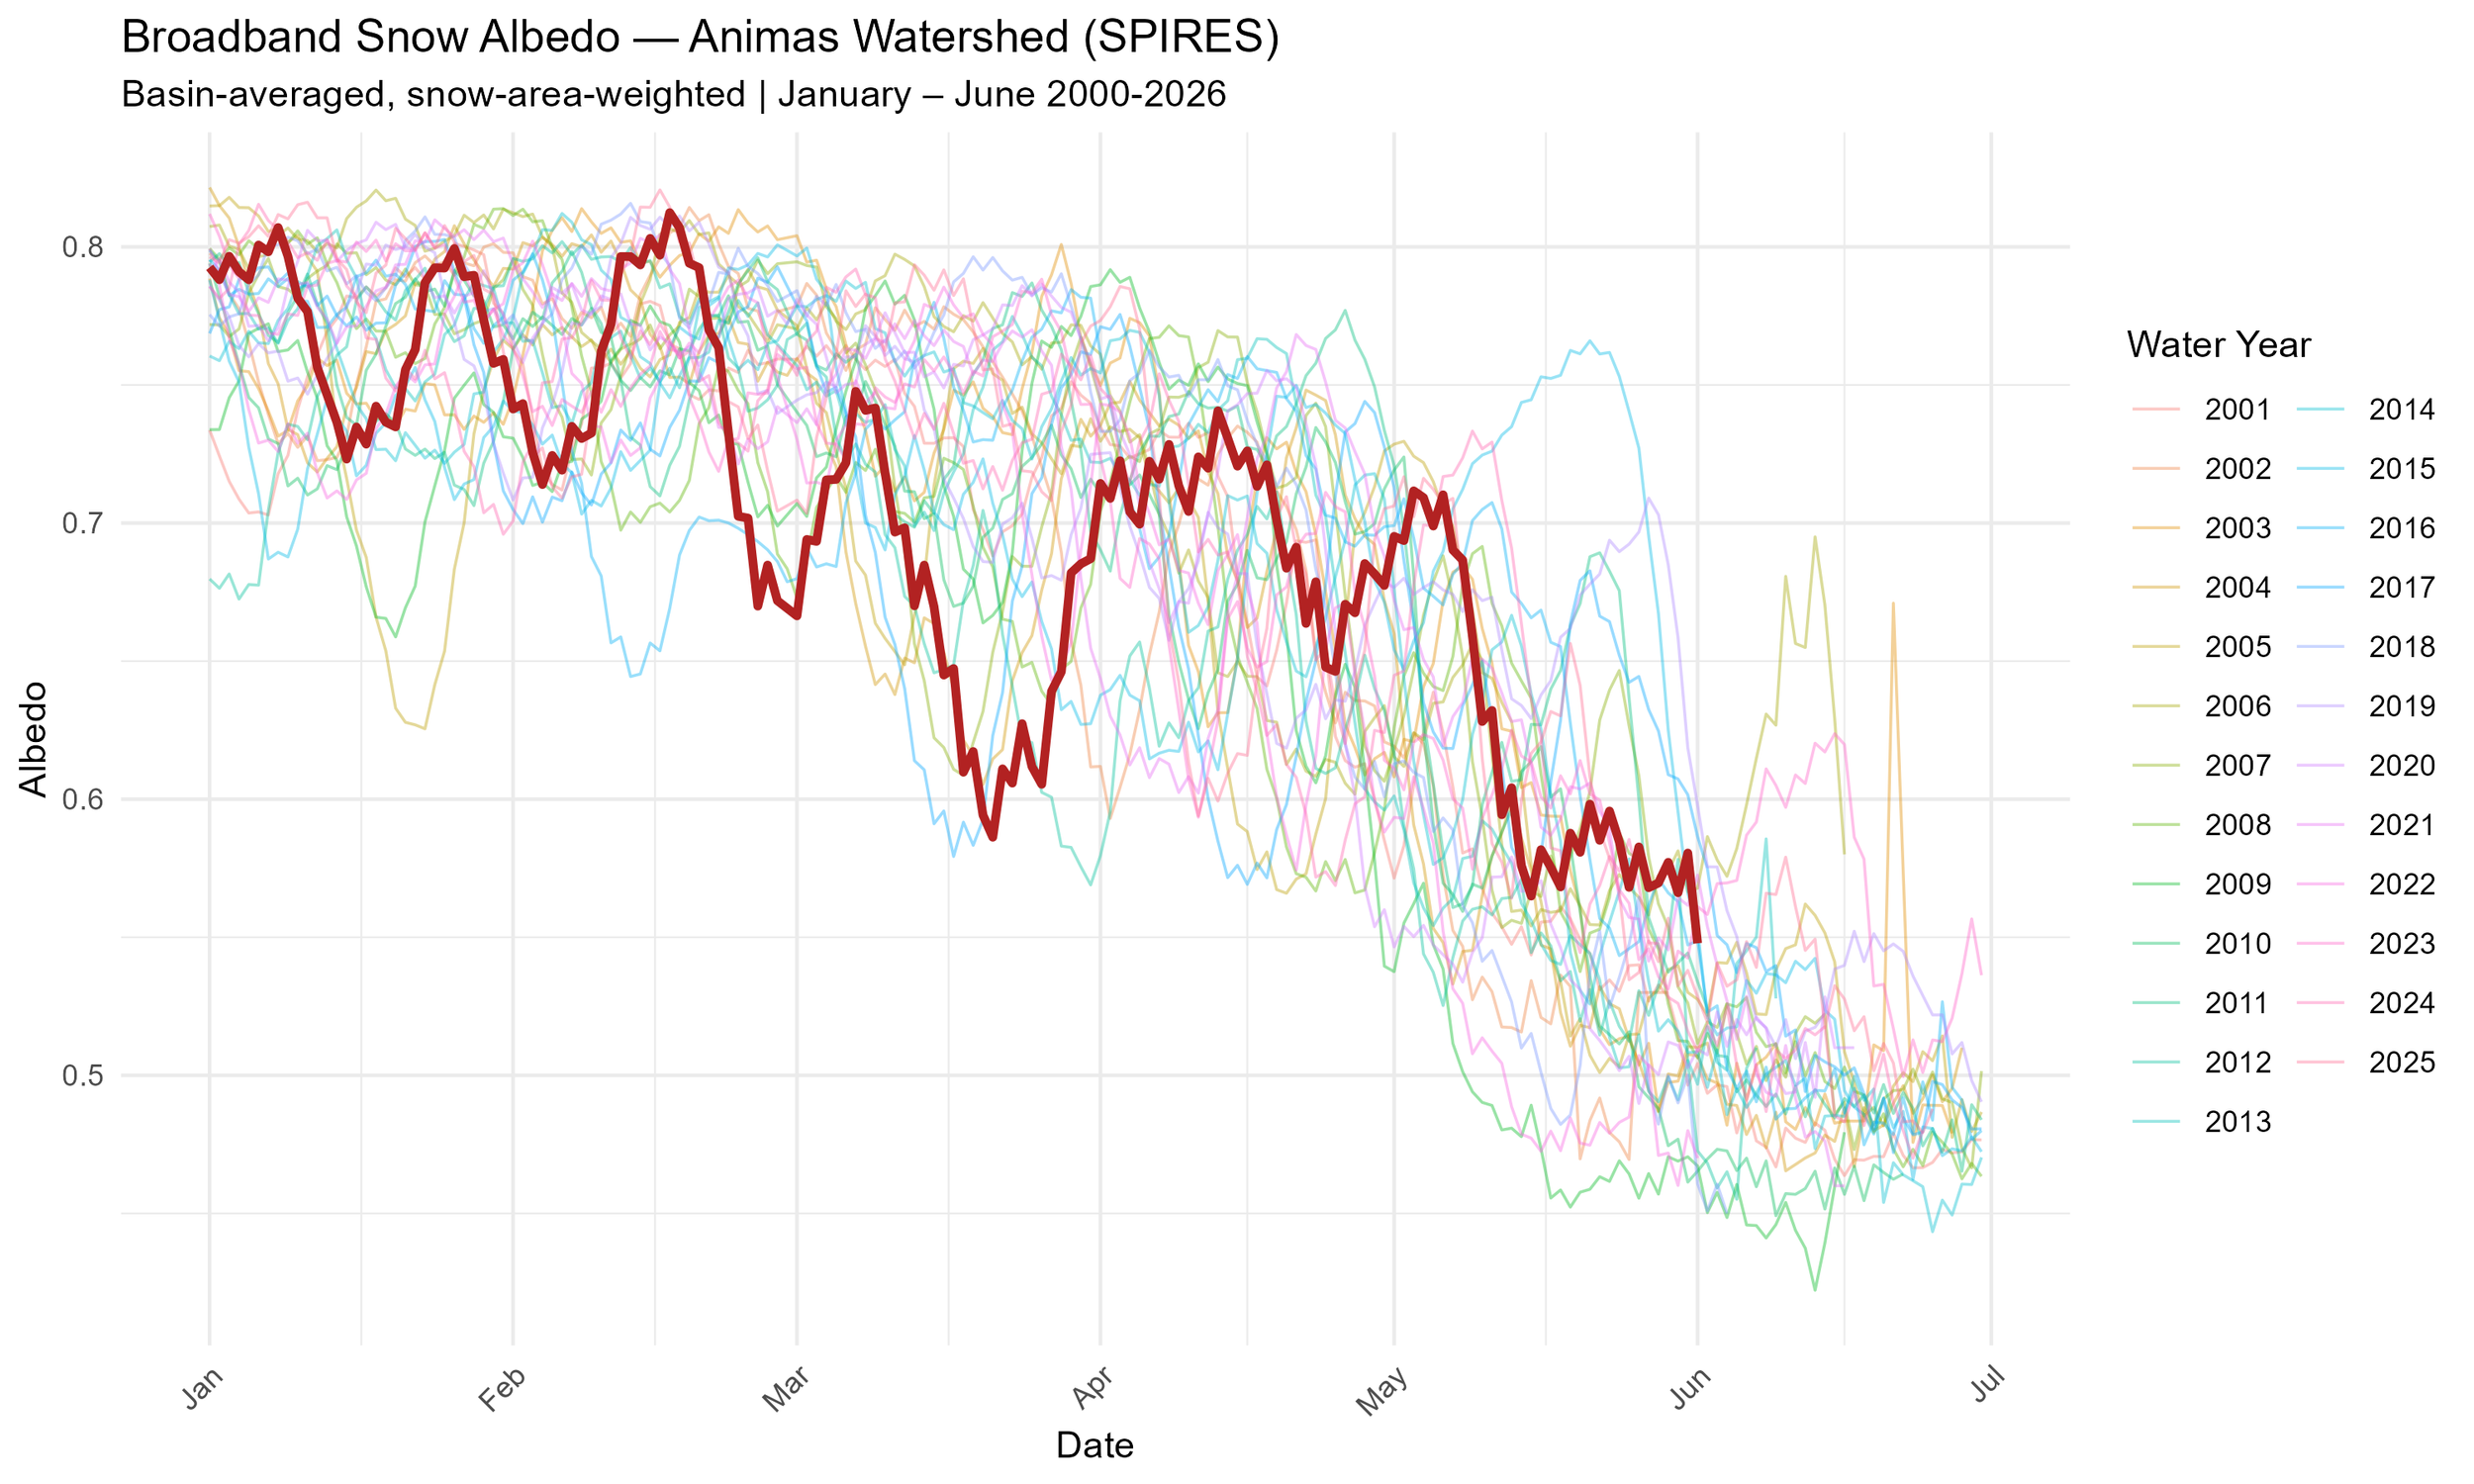
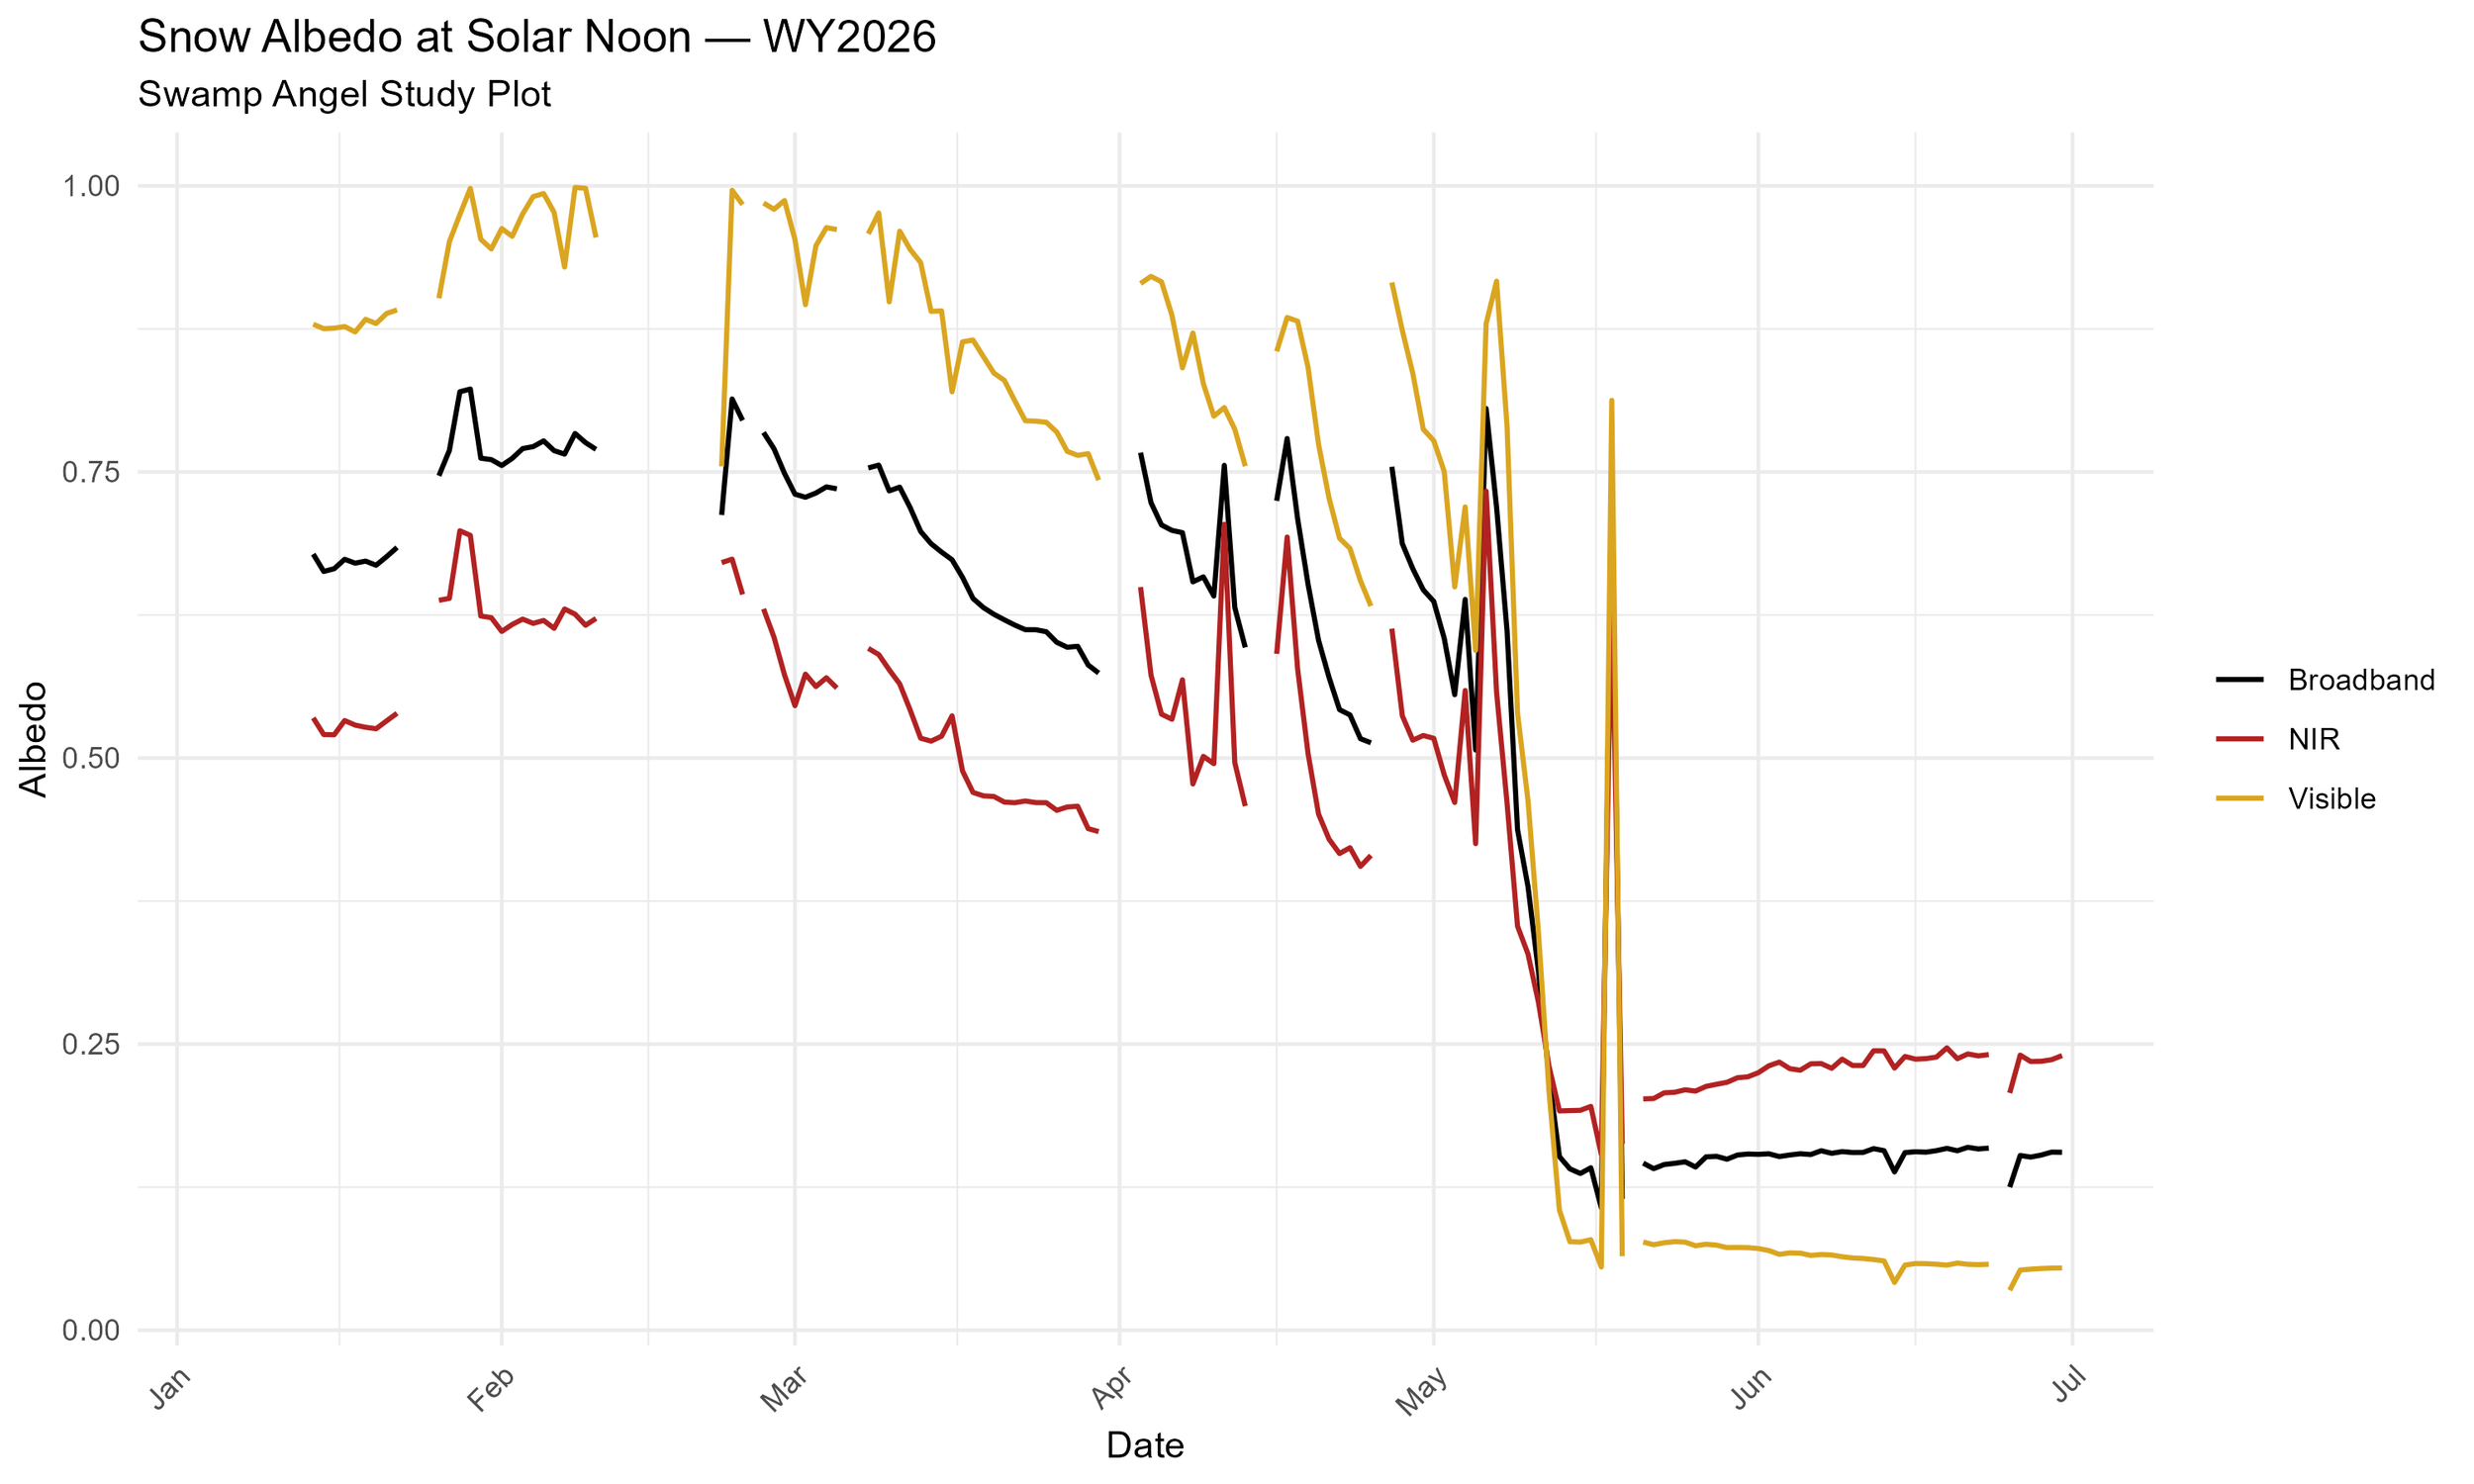
Nothing tells the story of a dusty snow surface like albedo, which is the ratio of the reflected to incoming solar radiation of the snow surface. We can go to greater detail in parsing out what is causing a drop in albedo (resulting in energy input into the snowpack and thus, warming), by looking at the specific wavelengths of reflected solar radiation. When dust is present on the snow surface, snow albedo decreases in the visible wavelengths. When snow grain size increases, as it does as the snow surface ages or ripens, snow albedo drops primarily in the near-infrared and shortwave infrared wavelengths (see Painter et al, 2012). We plotted our radiation data in both wavelengths, including the total wavelength range (broadband), and, for comparison, broadband albedo from the SPIRES_NRT MODIS satellite data clipped to the Animas watershed, which showed a lower overall albedo than our data. See plots below.
During our March CODOS, we did not observe dust in the snowpack. We saw a significant spike in melt late March, a period of prolonged lack of snowfall accompanied by a record setting heat wave. While surface dust is typically in part culpable for this type of rapid melt-out, the relatively clean snow surface means that the high melt rates were likely due to long dry stretches without precipitation leading to snowpack aging, which means snow grain metamorphism and presence of liquid water content of the snow surface. Both of these will increase the amount of solar radiation absorbed into the snowpack, increasing the melt rate, which typically drives spring melt. Dust was present in our Grand Mesa, Berthoud, Loveland, and Rabbit Ears CODOS sites during our April tour due to the March 21 dust event. Towards May and a very early snow ablation, areas of Senator Beck and Wolf Creek Pass had light dust, from a mild dust event(s), general atmospheric fallout, and/or local sources.
More information about SPIReS: Basin-averaged snow surface properties were derived from the SPIRES Near Real-Time (SPIRES_NRT V1) dataset (Rittger et al., 2025), a daily 500m resolution product derived from MODIS/Terra surface reflectance (MOD09GA v6.1) using the Snow Property Inversion from Remote Sensing (SPIReS) spectral unmixing algorithm.
Above: Total dust-on-snow events by month since 2005. March begins the more intensive part of dust-on-snow season. In WY2026, we saw one dust event on March 21.
Above: Total dust-on-snow events by year. Wet means the dust came in with precipitation. Dry means it arrived without precipitation.
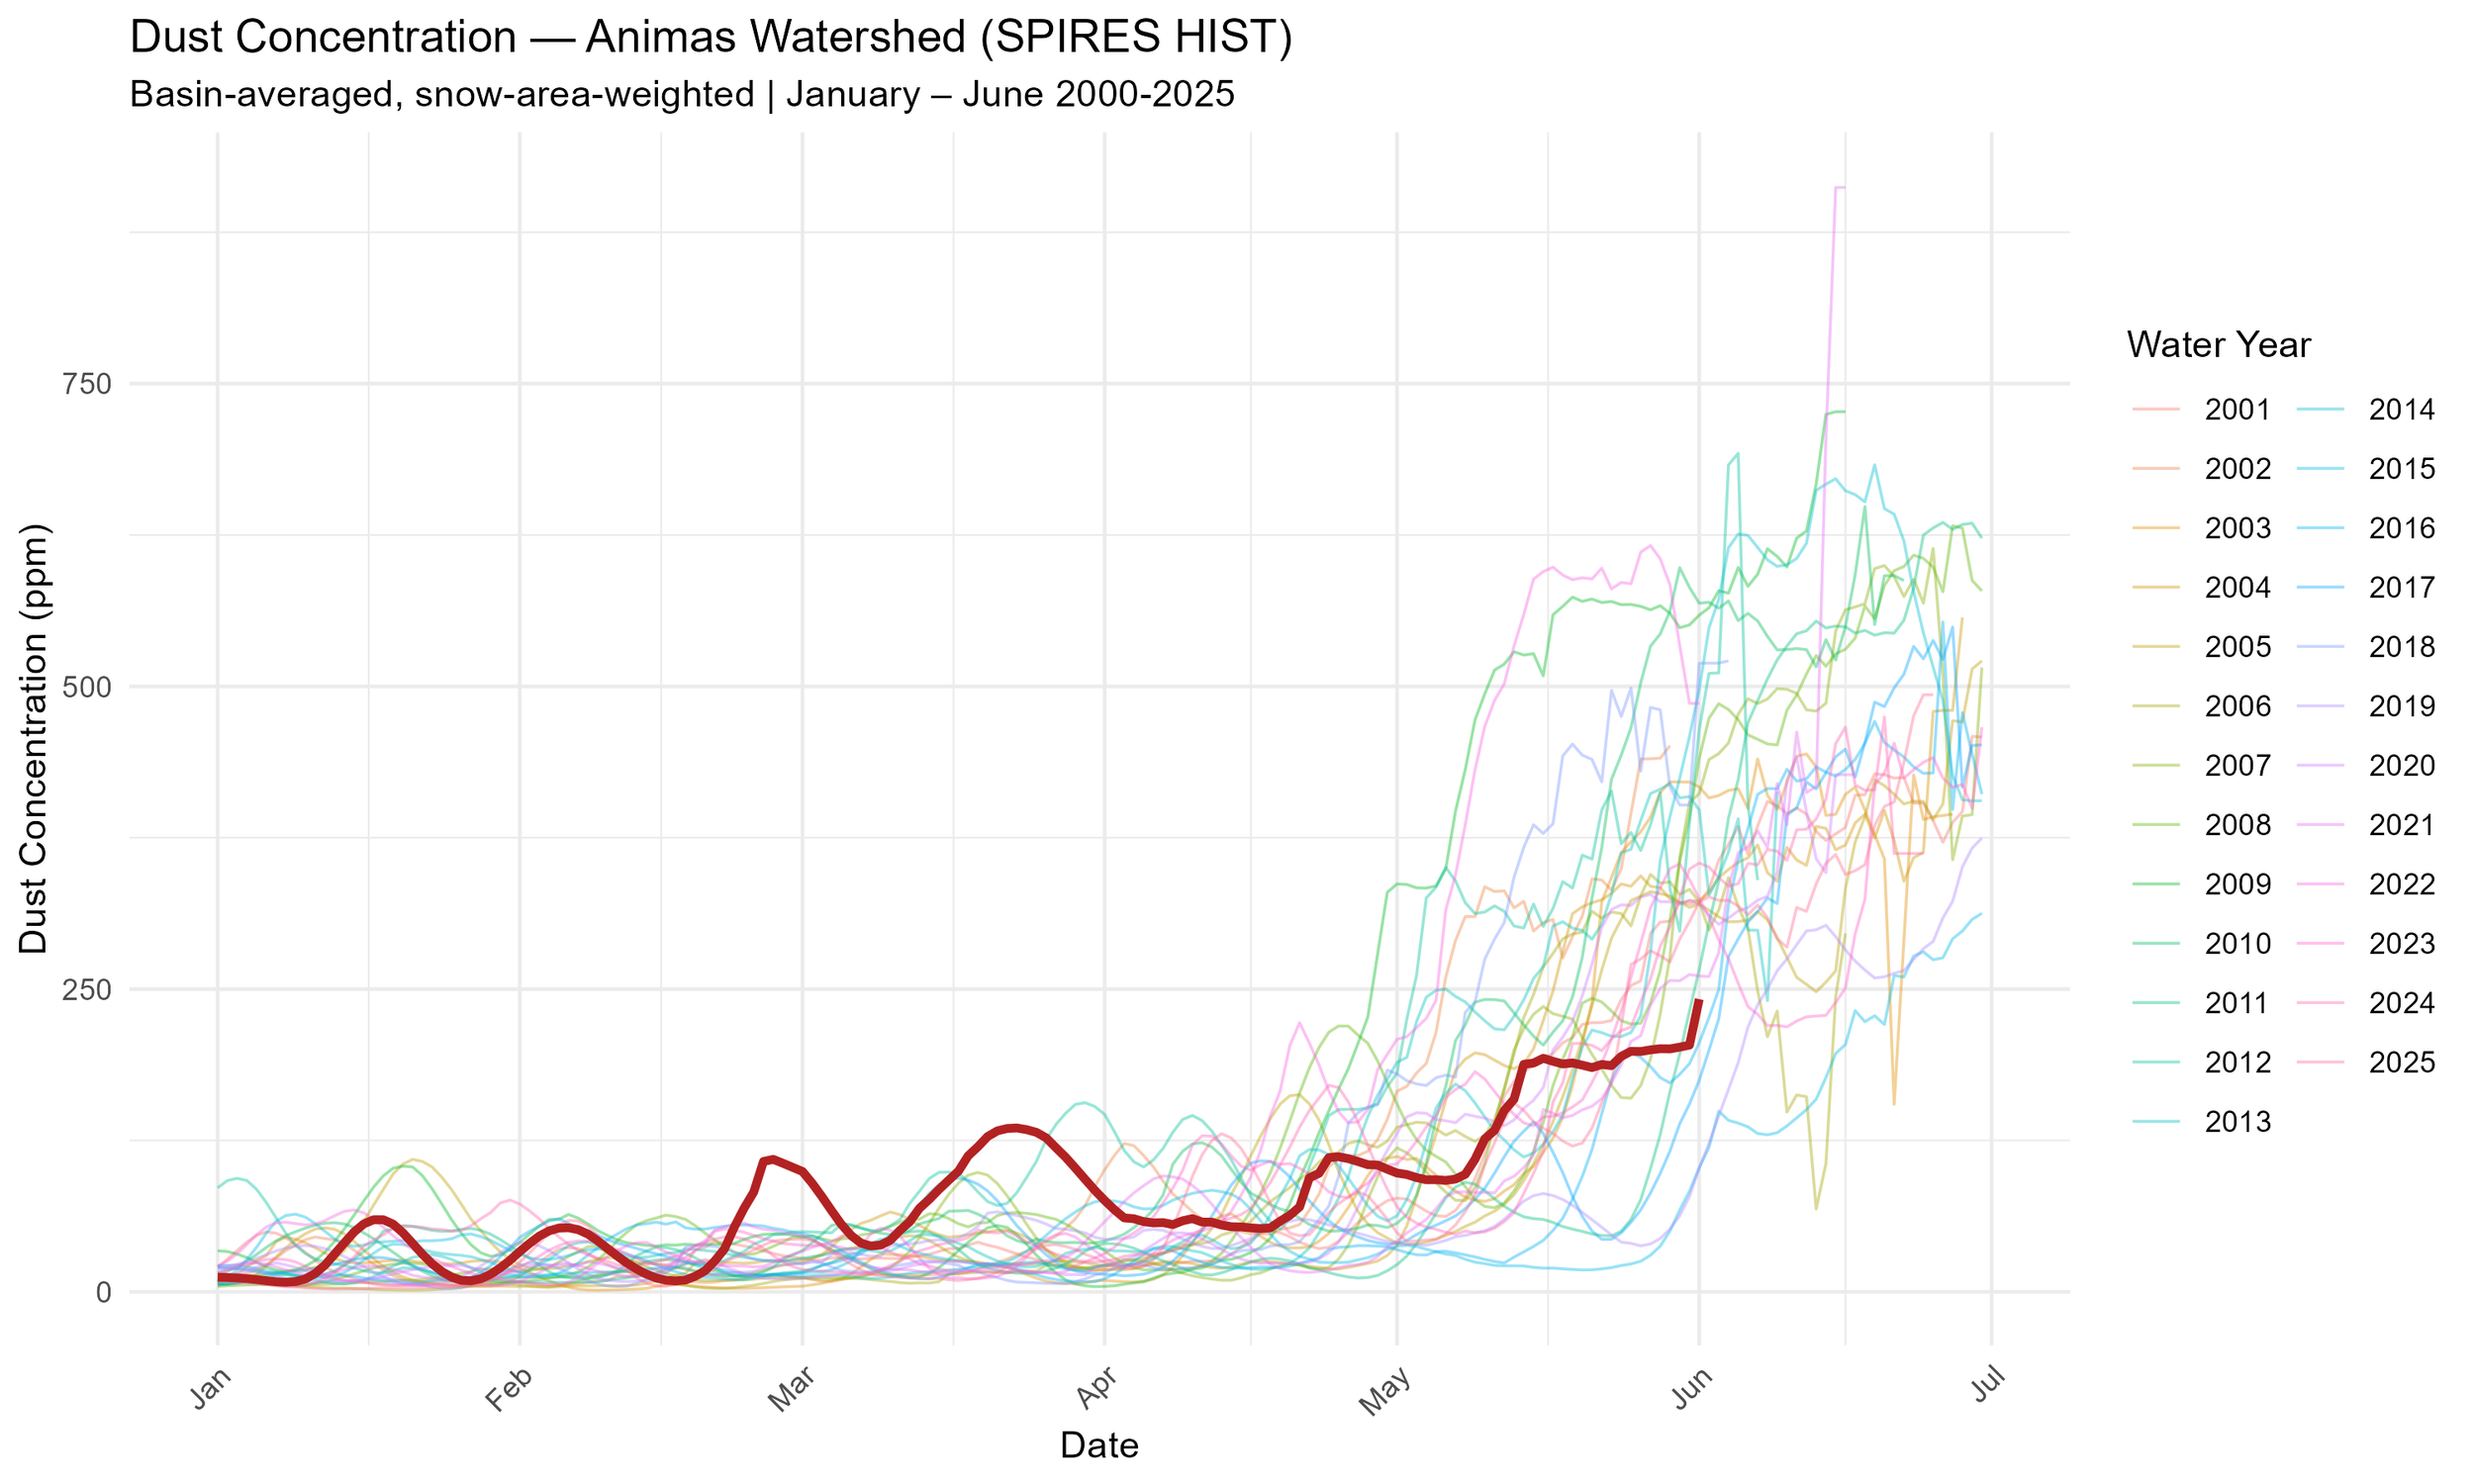
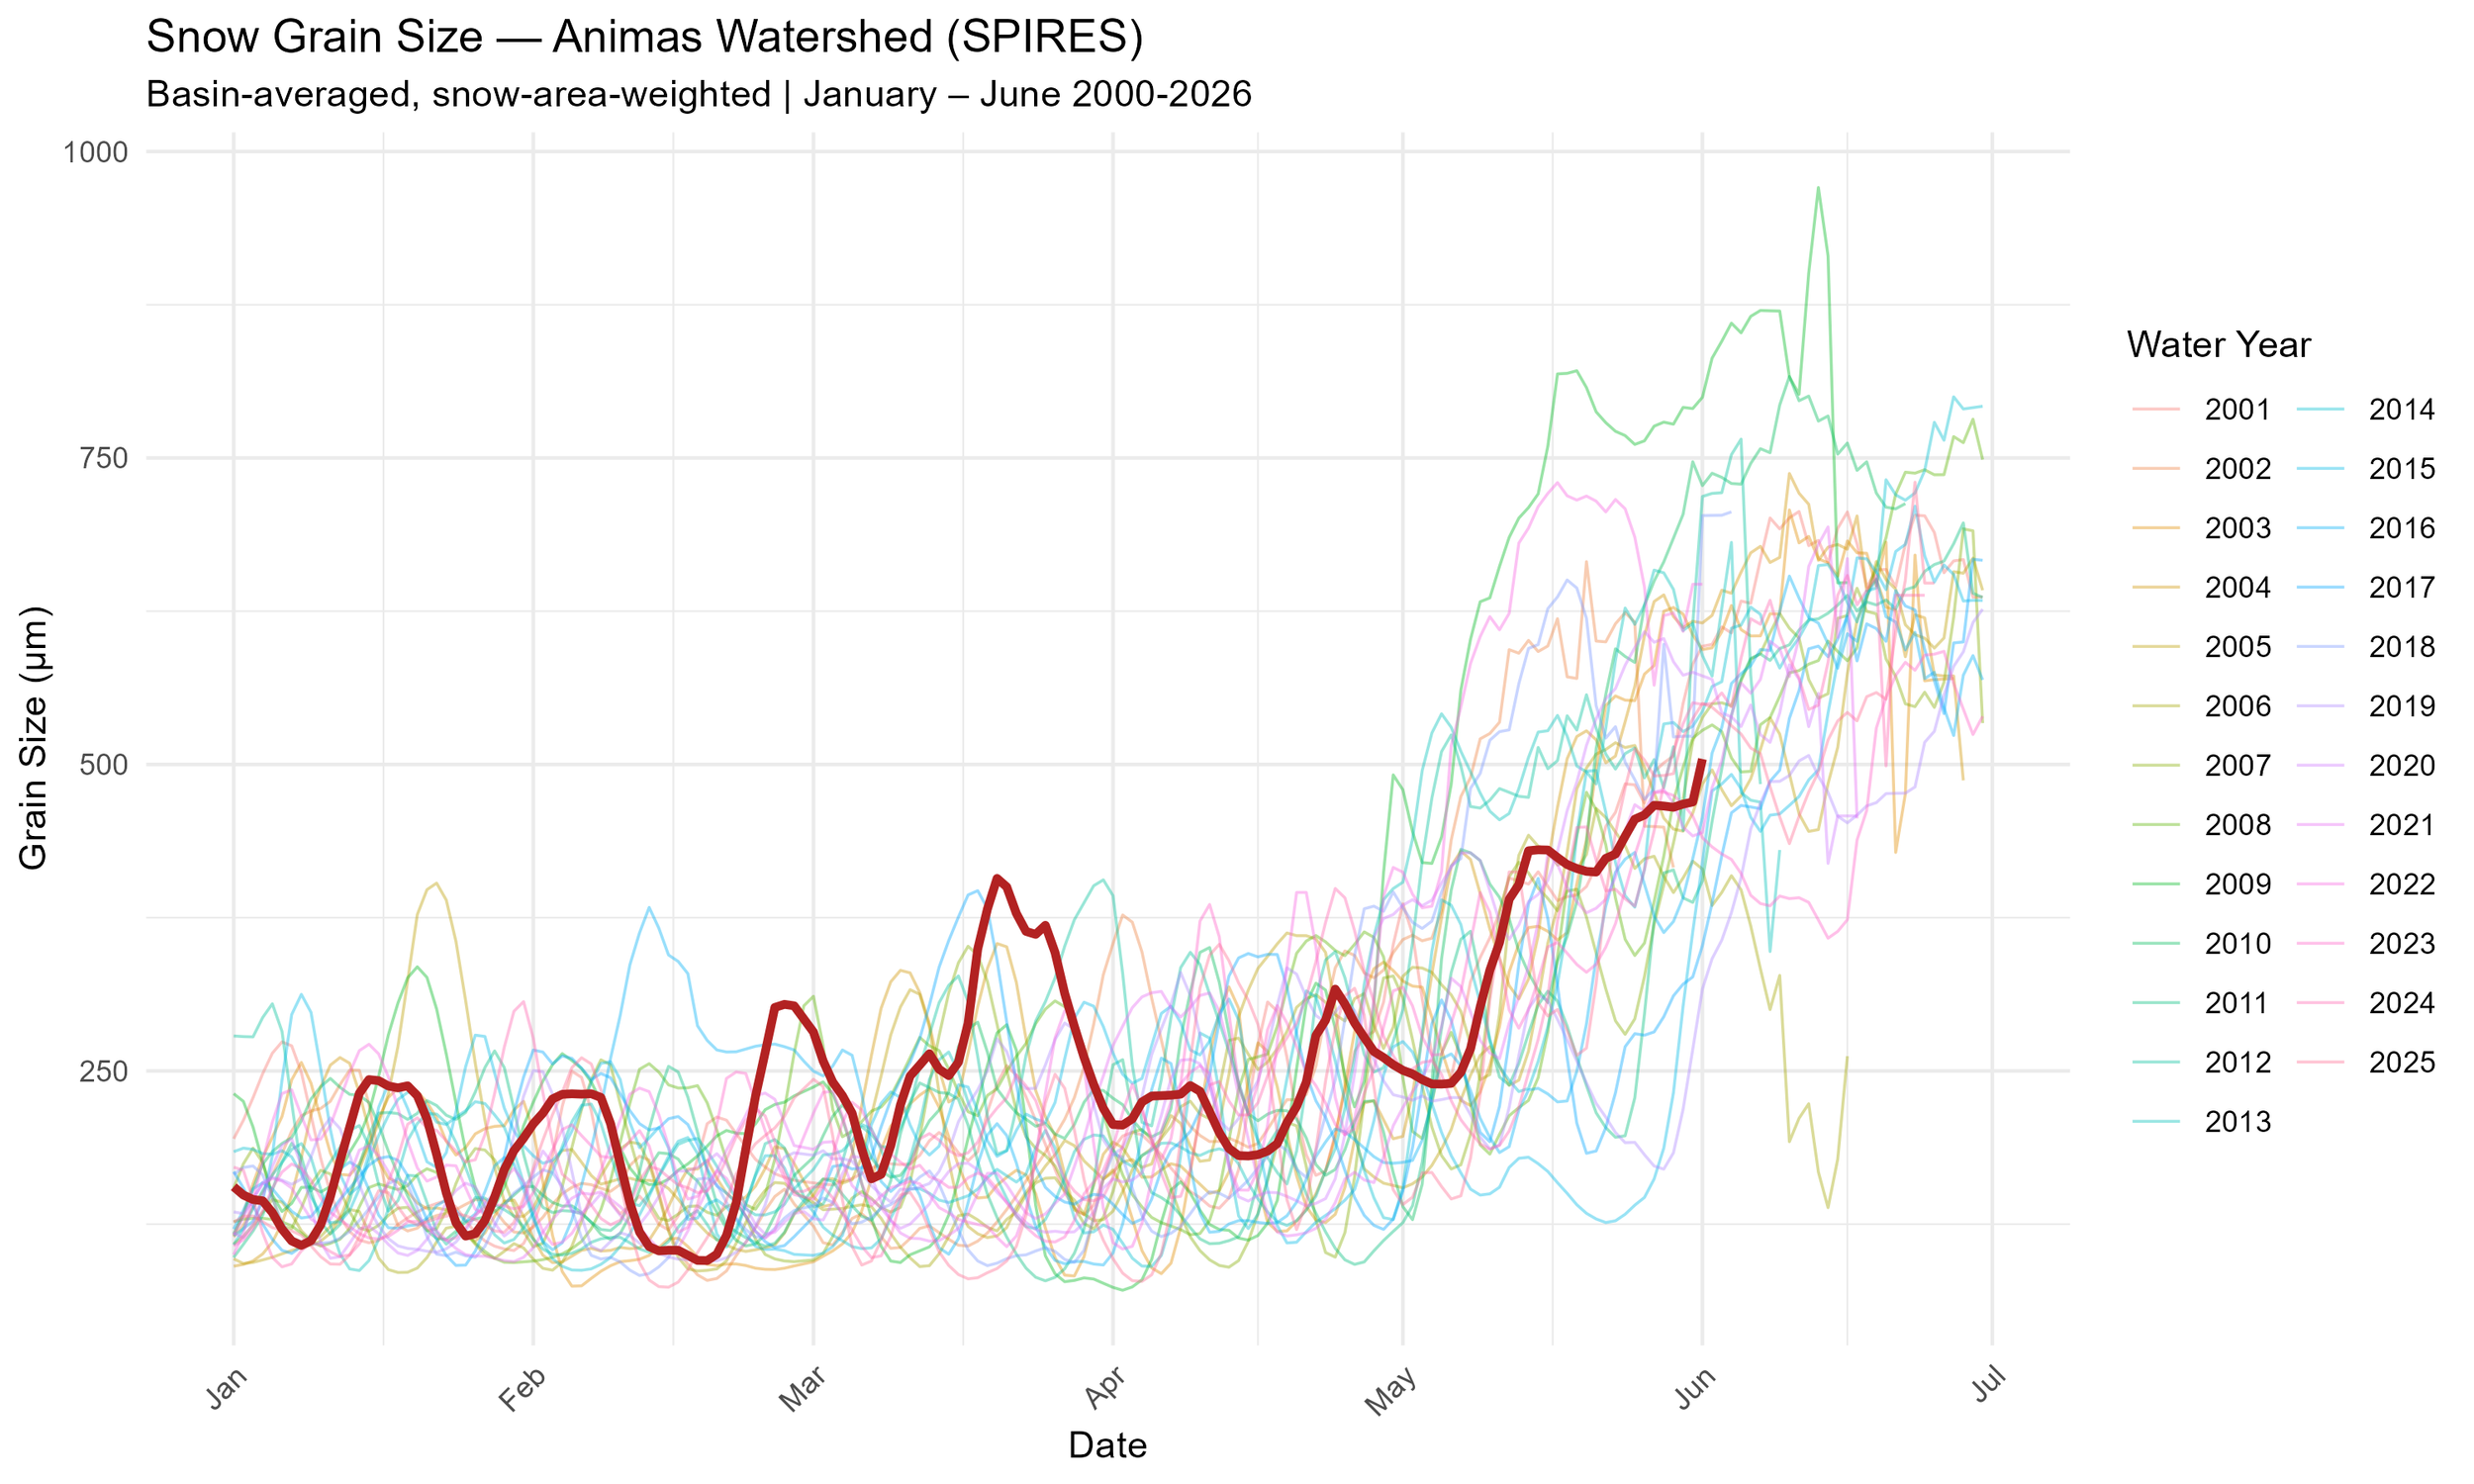
Below: Broadband albedo was some of the lowest on SPIReS MODIS data record in the Animas watershed. However, the dust concentration from SPIReS did not match our observations; in late February and mid-March, there appears to be two record high dust concentrations, but in our observational history, this year was the mildest dust year on record both in number of events and severity of dust layers. What seems more likely is grain-size growth with an aging snow surface due to prolonged dry periods, like we typically see in spring - large, rounded grains are much less reflective than fresh snow crystals (corn skiing in March, anyone?). In addition, the rounding of snow grains and warm nighttime temperature likely increased the presence of liquid water, and when at the surface, reduces albedo even more. MODIS satellite data has known limitations with its spectral unmixing in the late winter early/spring due to sun angles.
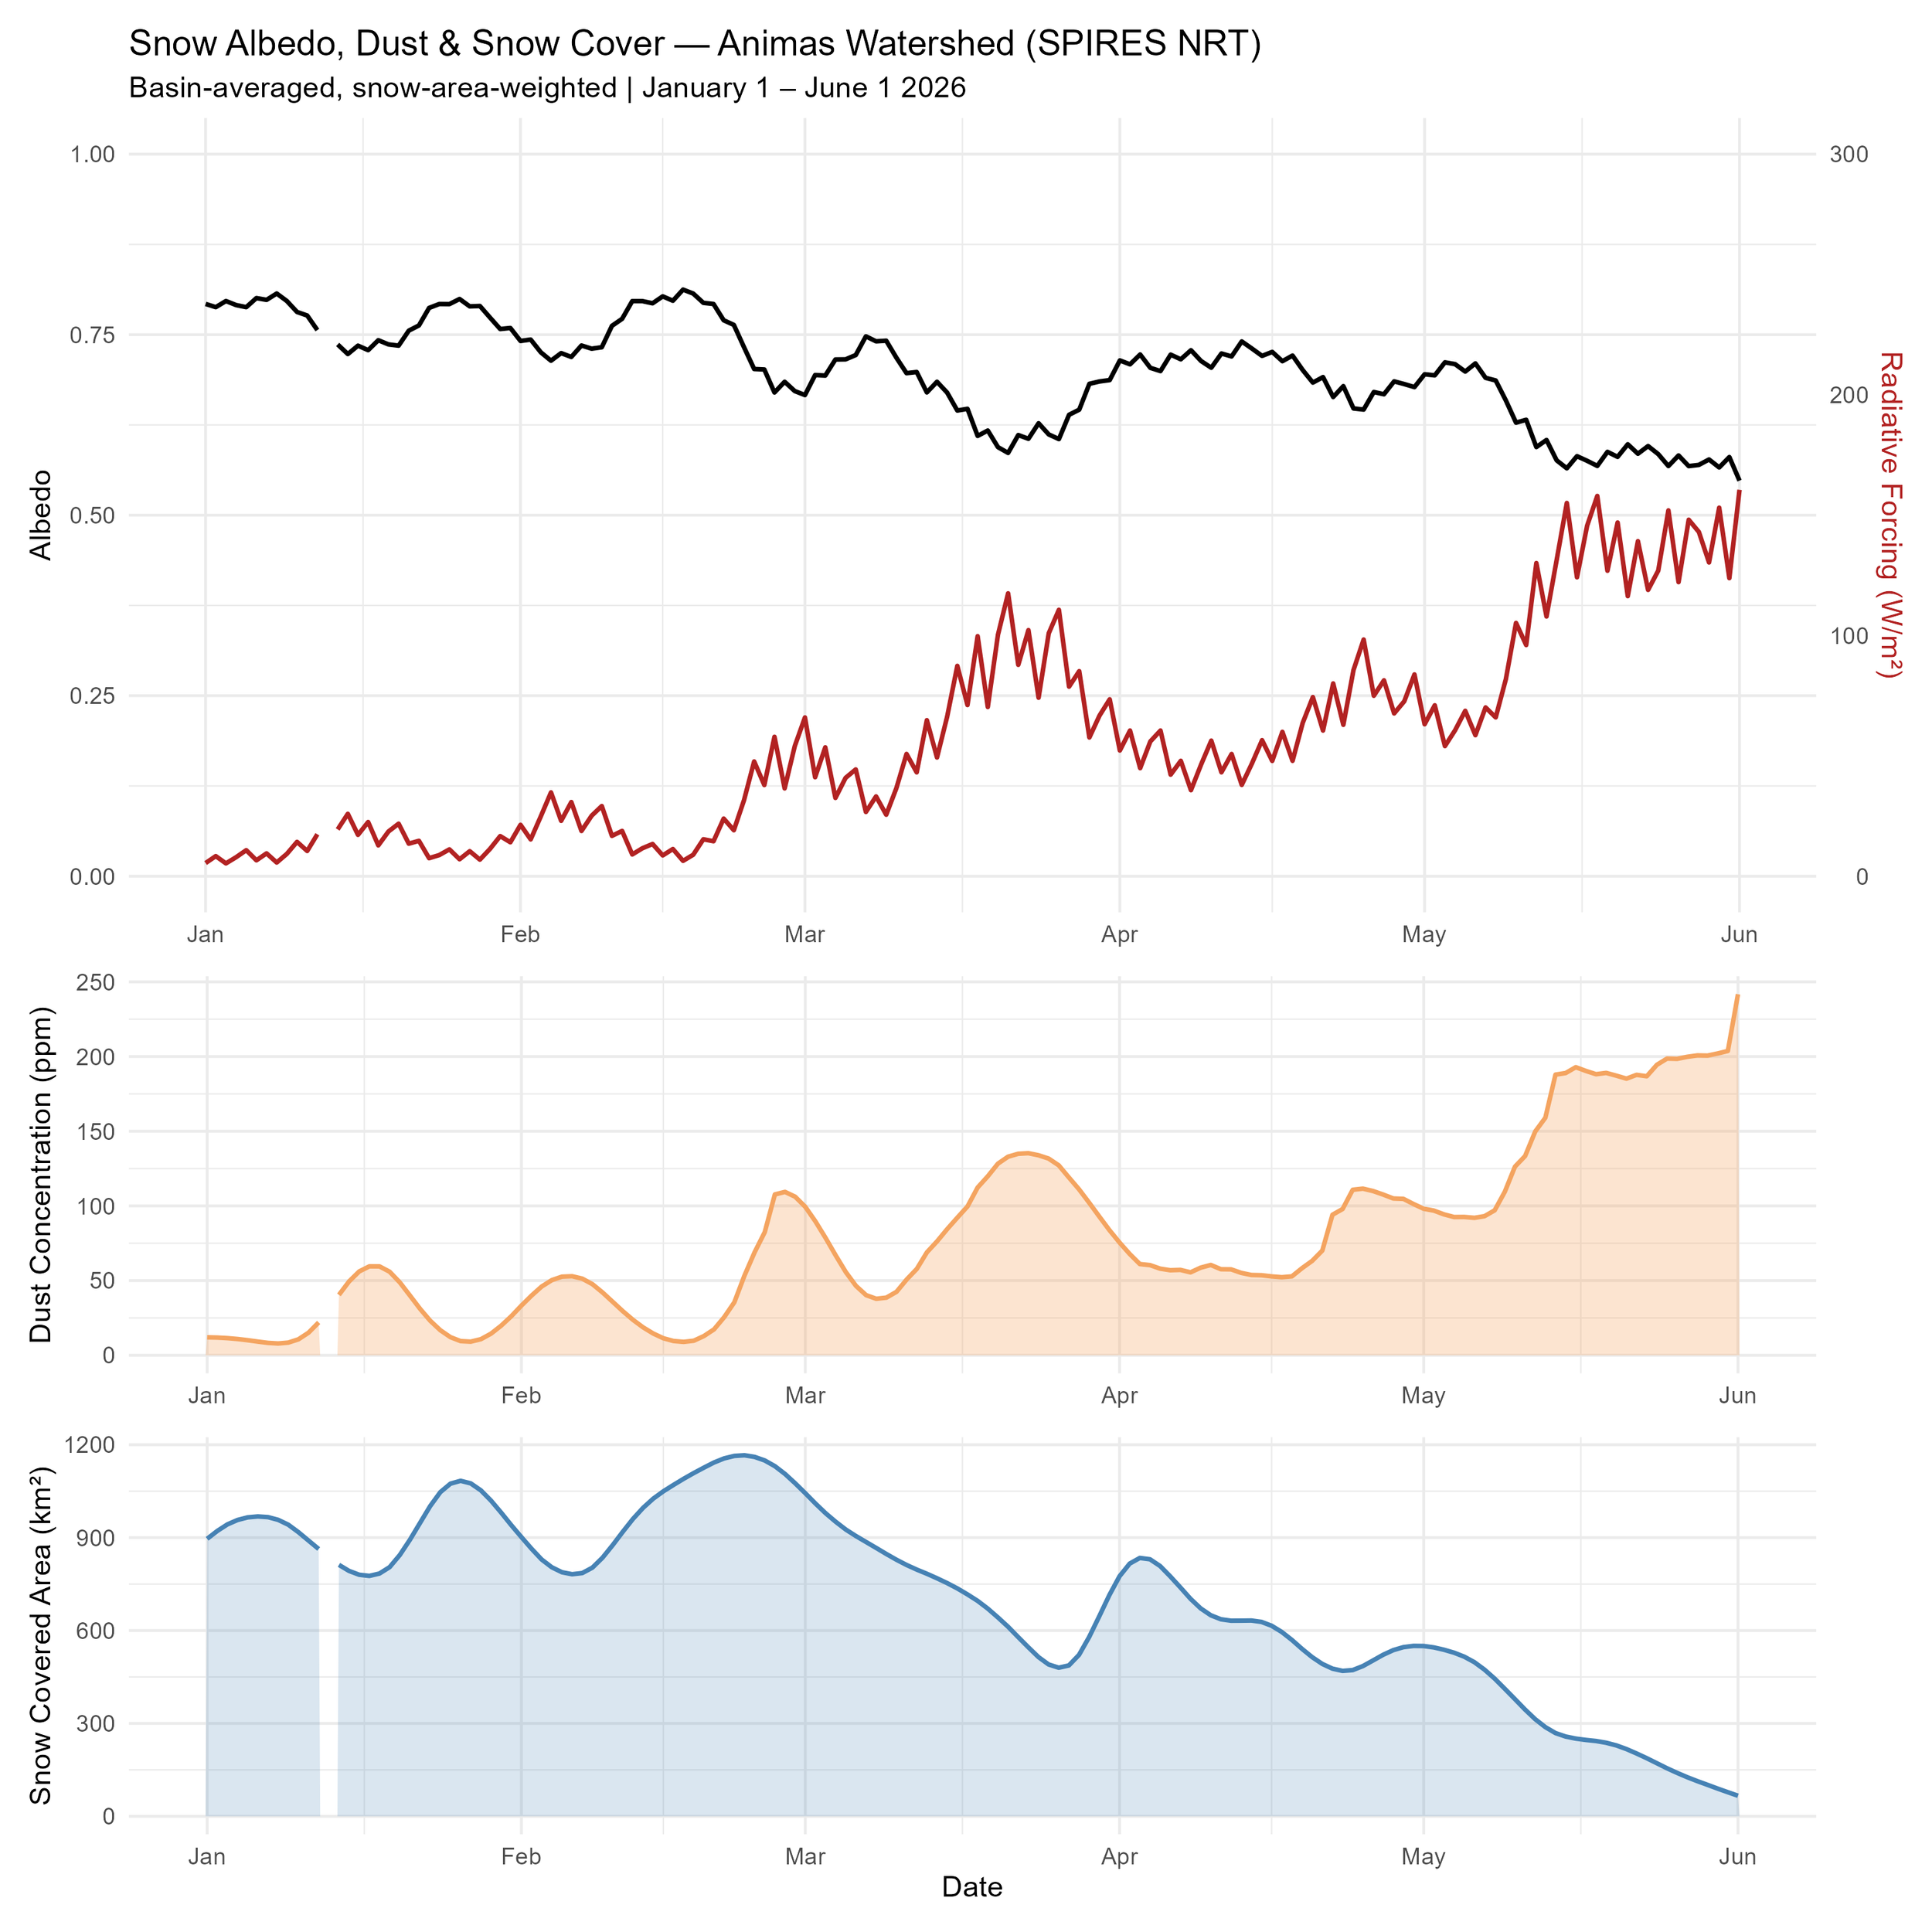
Below: Plotted is MODIS Snow Property Inversion From Remote Sensing (SPIReS) data which uses spectral unmixing to measure albedo, grain size, dust concentration and snow covered area of the land. We clipped this data to Animas watershed. The dark red thicker line represents WY2026. SASP albedo is also plotted and the Near-Infrared (NIR) wavelengths plotted separately to investigate snow-grain signal.
RUNOFF BEHAVIOR
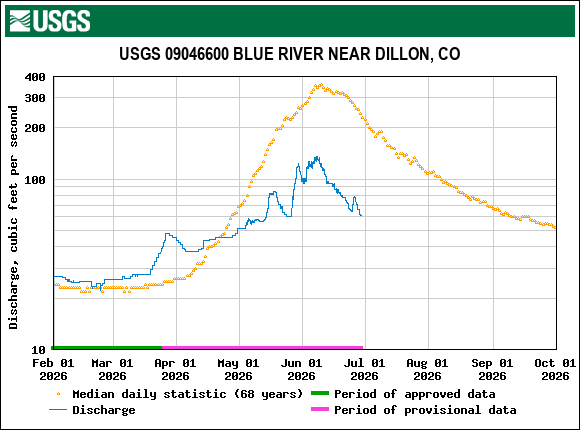
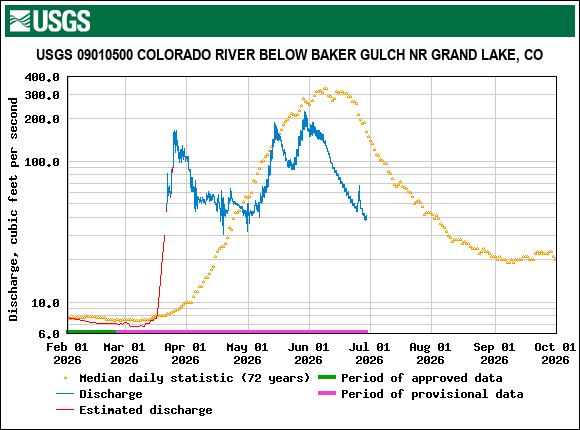
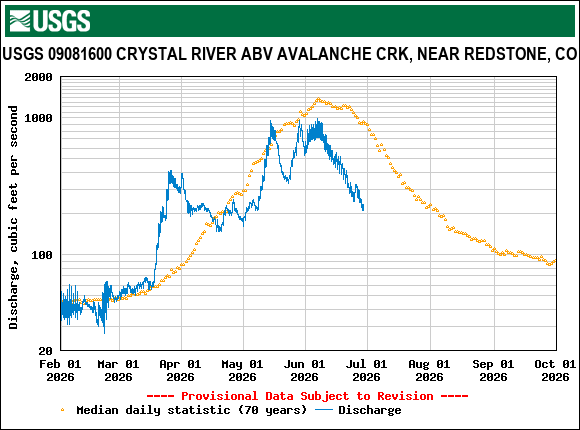
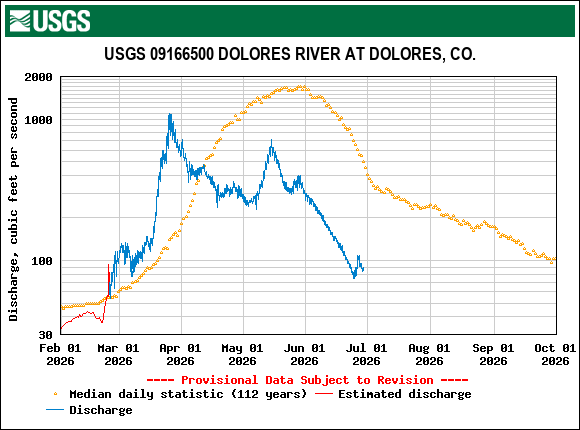
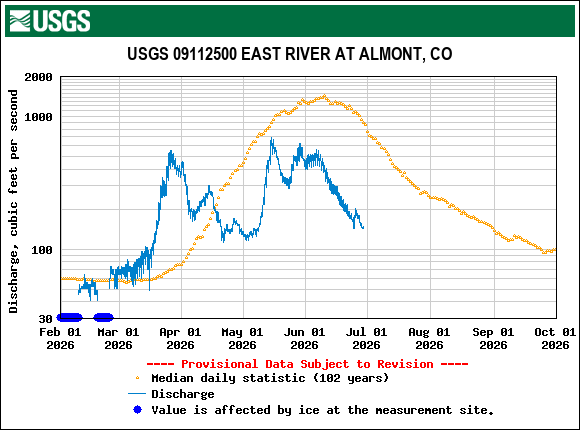
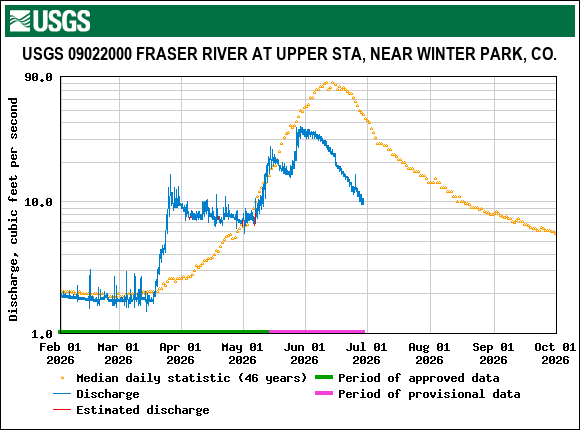
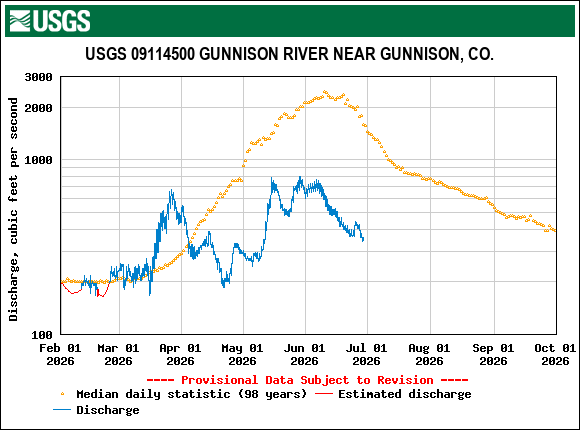
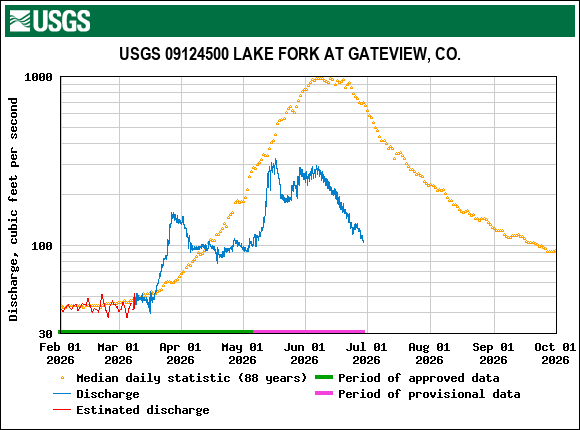
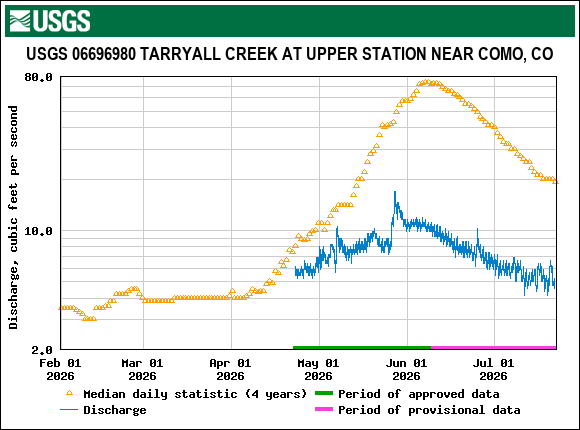
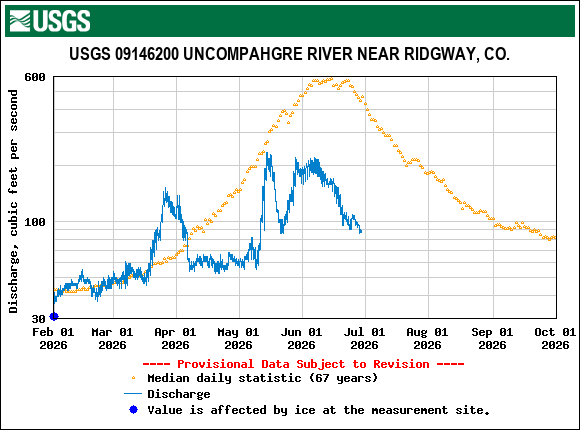
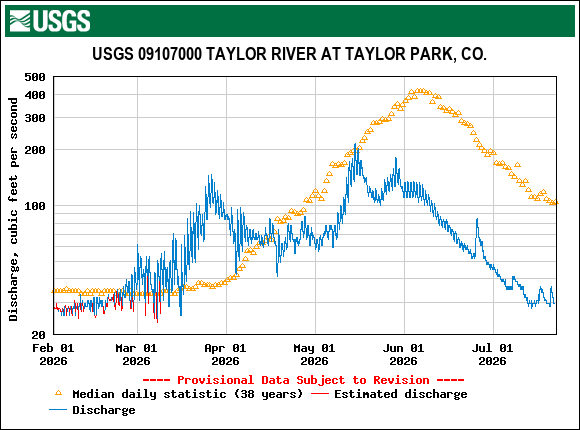
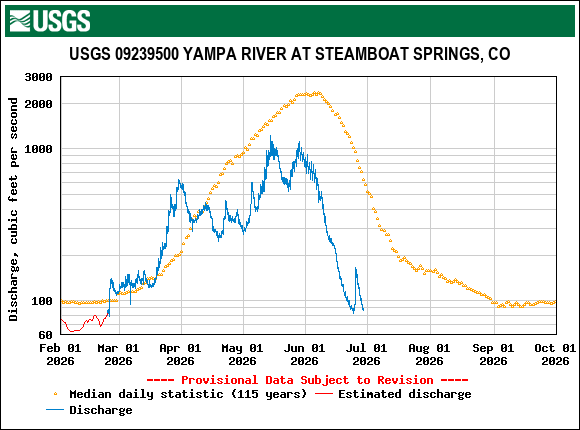
As climate change gains a firmer hold year after year, a big question is just how much a hot and dry spring advance ablation of the snowpack. This spring season we got a taste of how extreme things can get. With the end of February being near record high temperatures and continuing into May where the entire 2nd half of the month was record hot, the snowpack warmed and melted forcefully the latter half of May. Given the record low snowpack some folks were wondering if we were headed towards peak streamflow, at a time when normally we would just be seeing peak SWE. Albeit it still was hot, April ushered in some snowy days that put a damper on the rapid snowmelt and as a result streamflows backed off and stabilized.
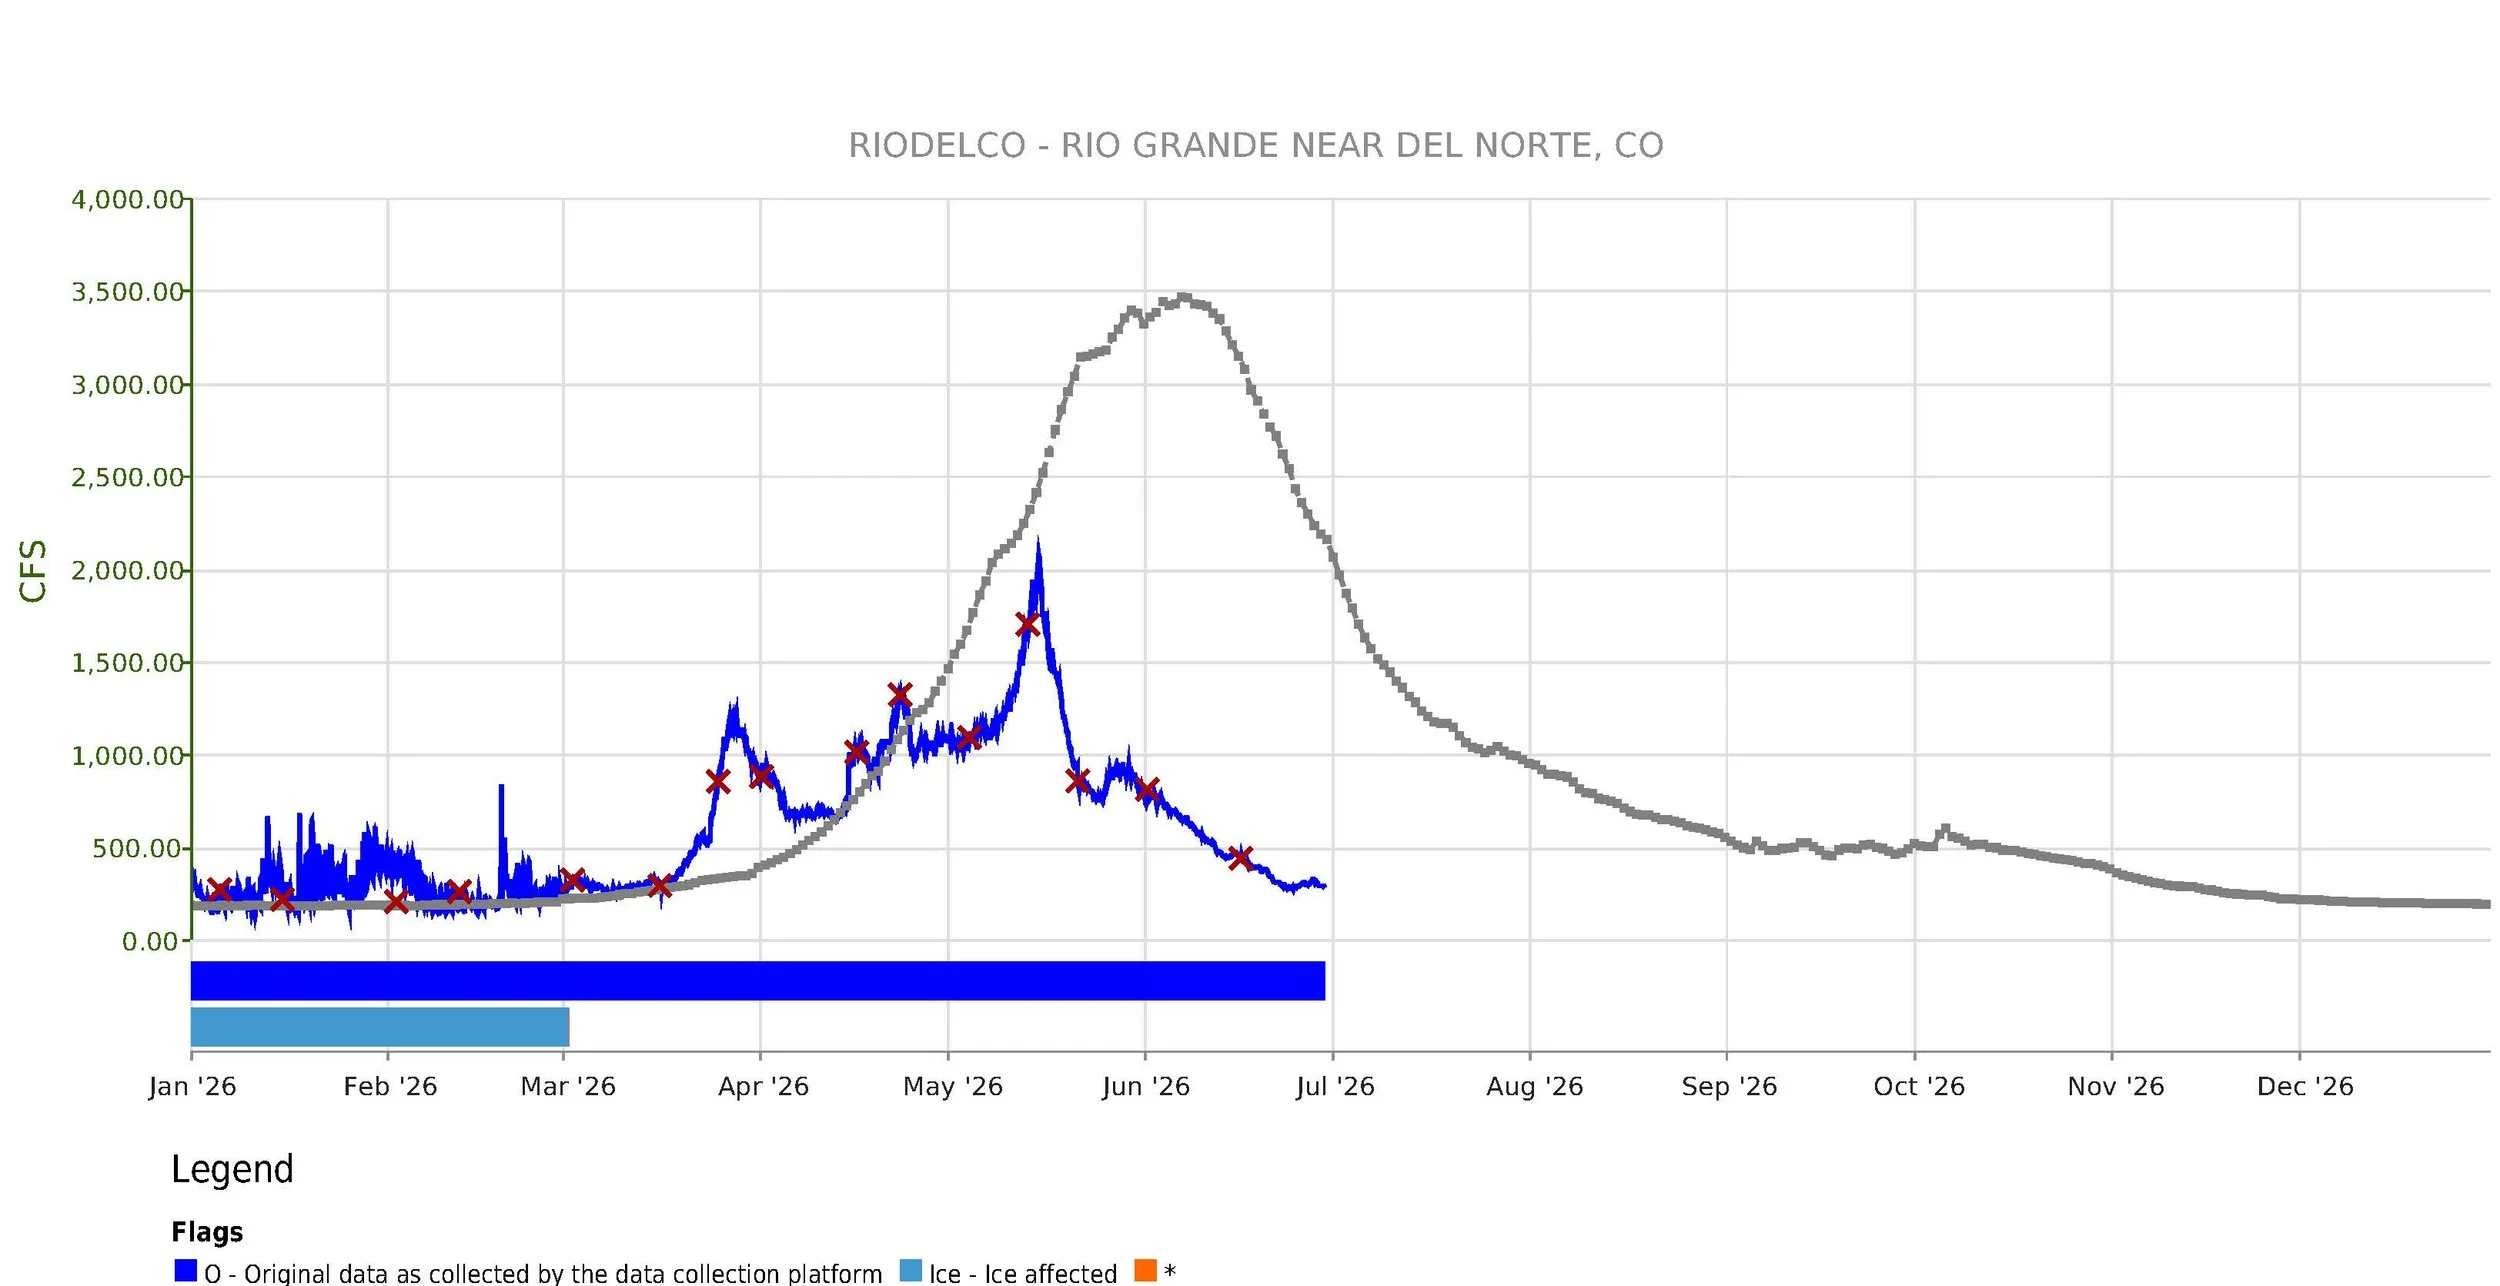
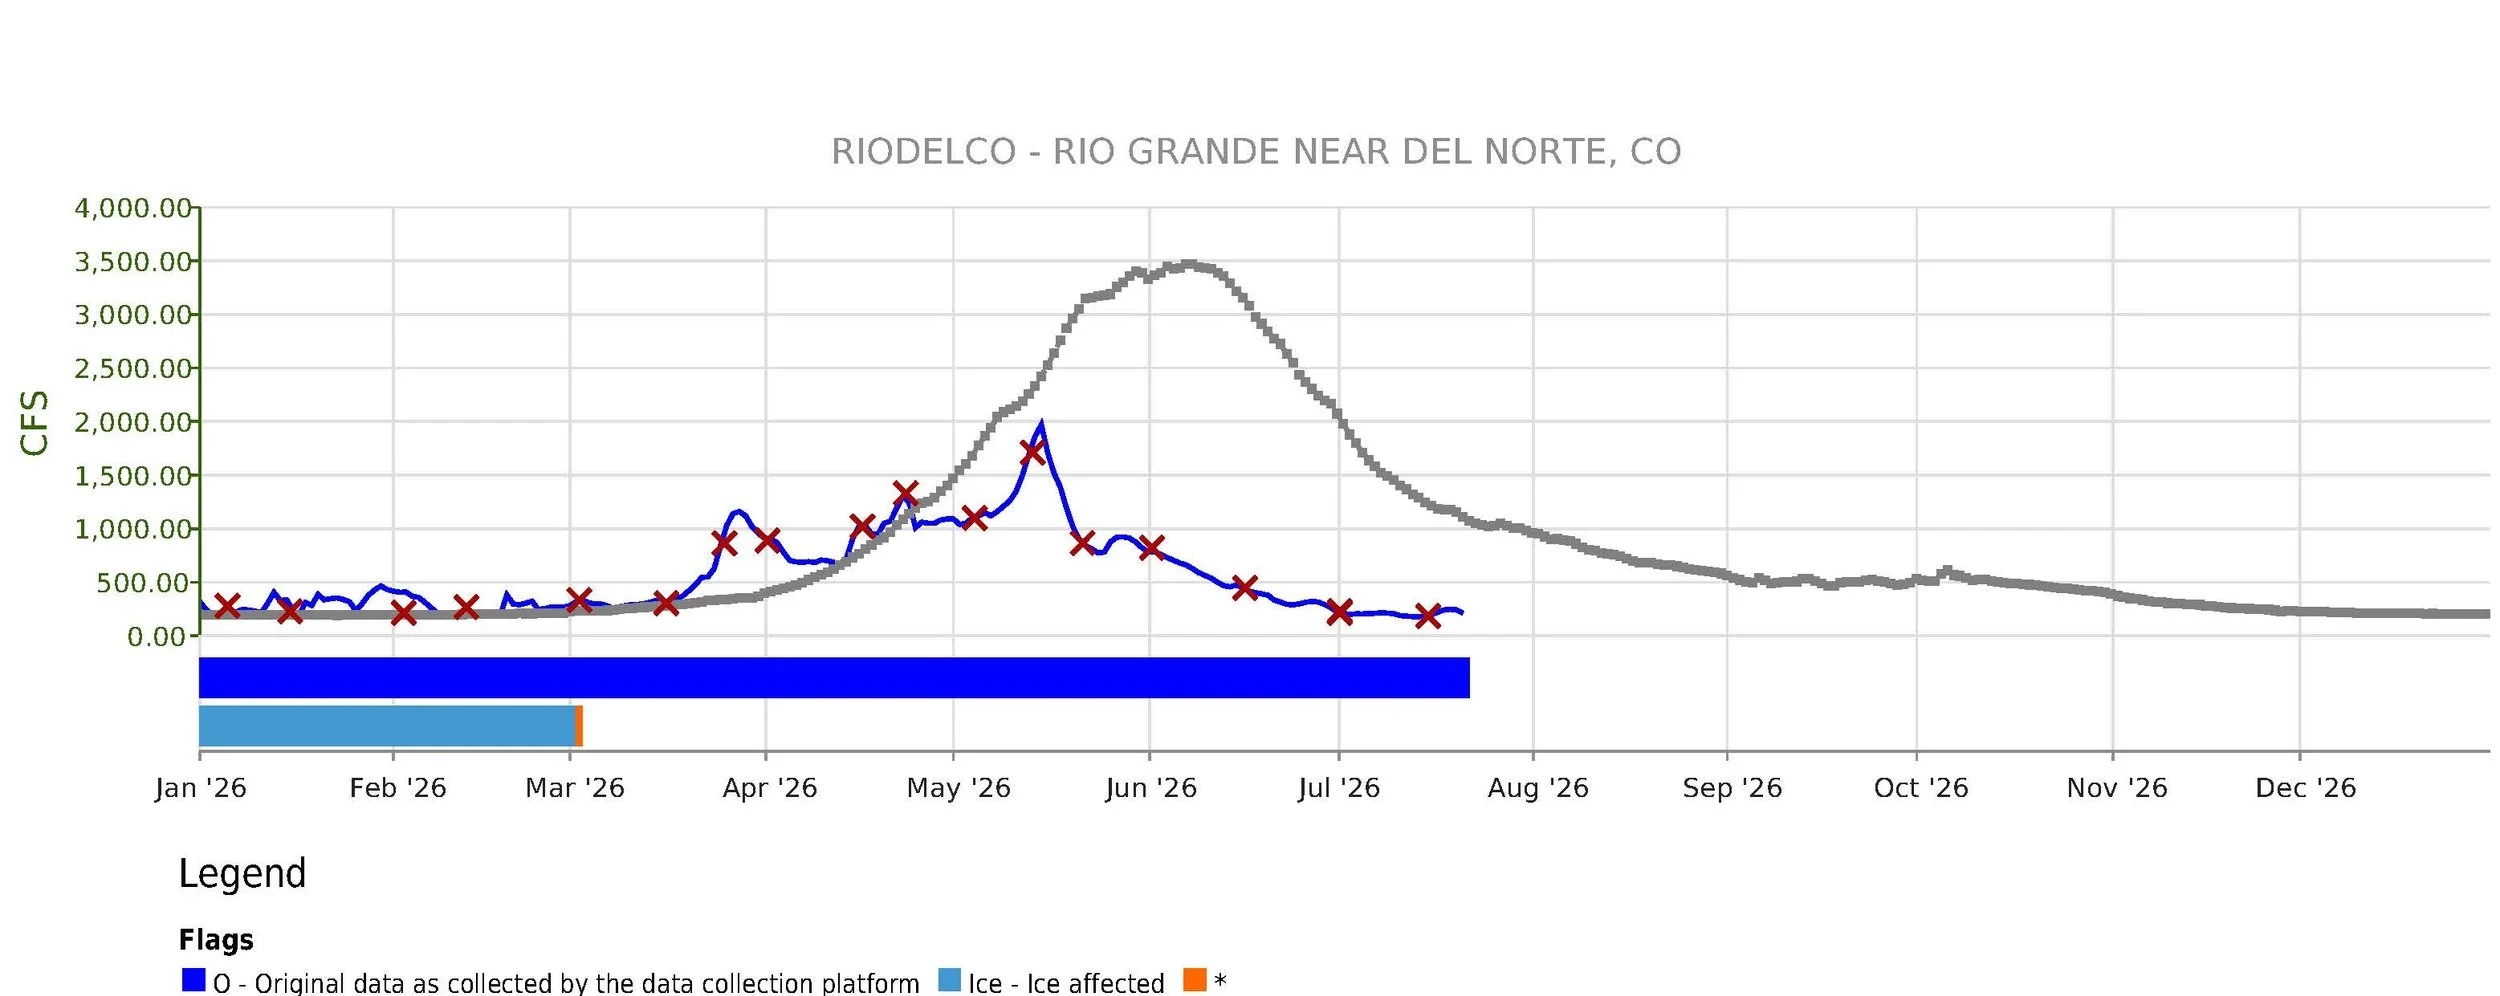
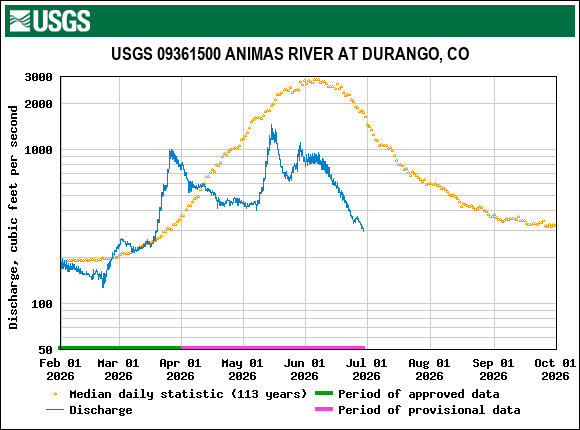
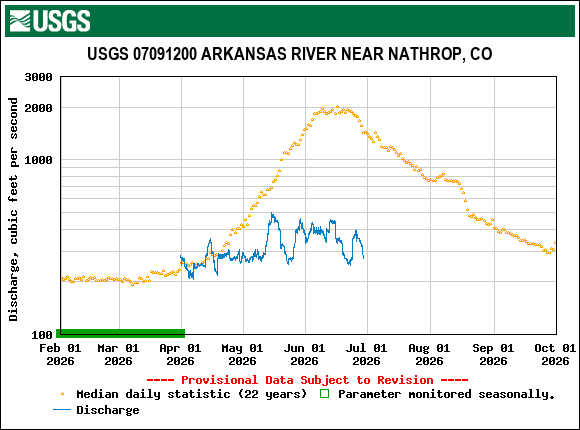
Once a string of snowy days the last days of April and first week of May ceased, increased melt rates resumed leading to a streamflow peak around May 15 timeframe for the vast majority of rivers in Colorado. And for many this was the highest peak for the snowmelt season. The second peak – fed from the higher elevation melt – occurred the last few days of May.
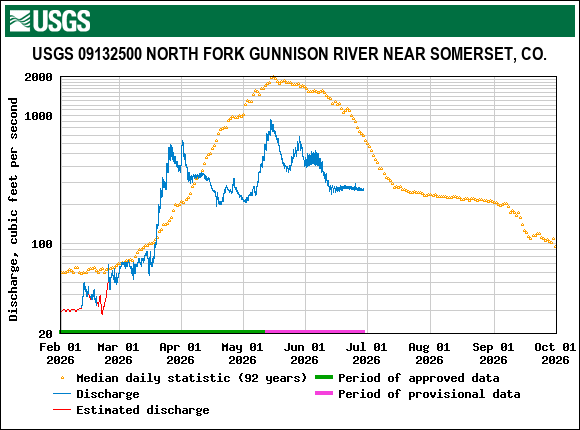
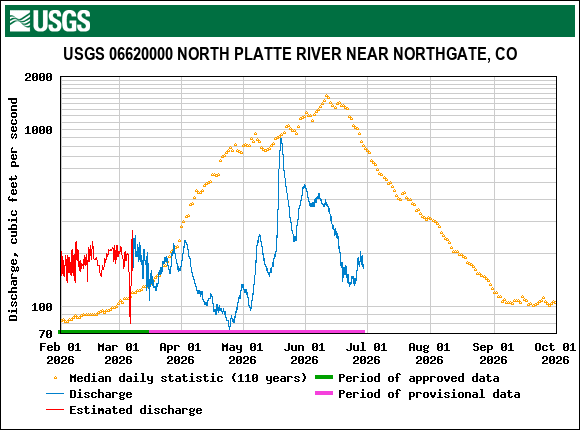
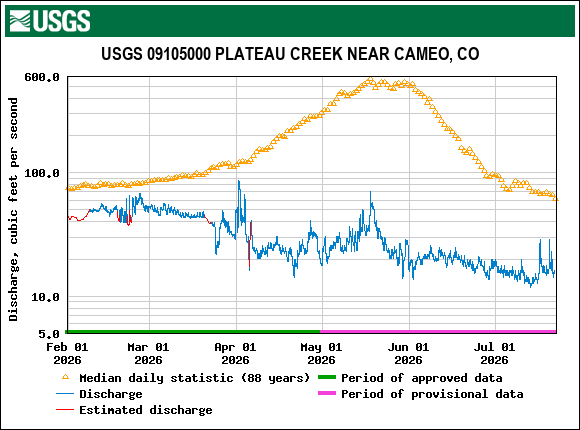
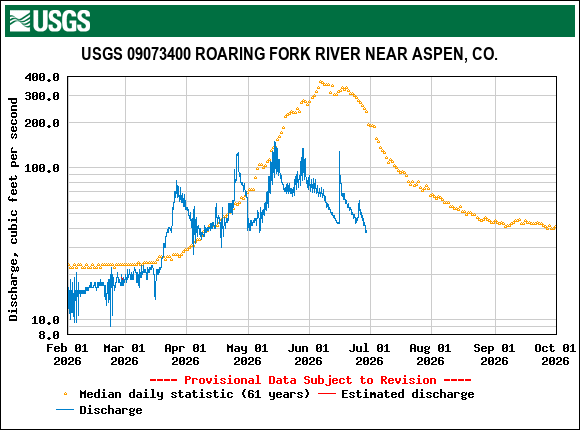
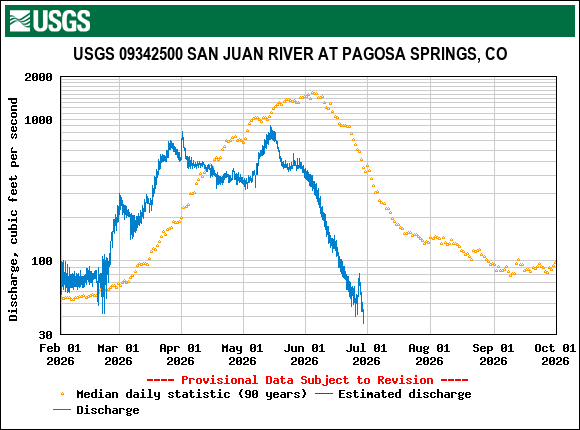
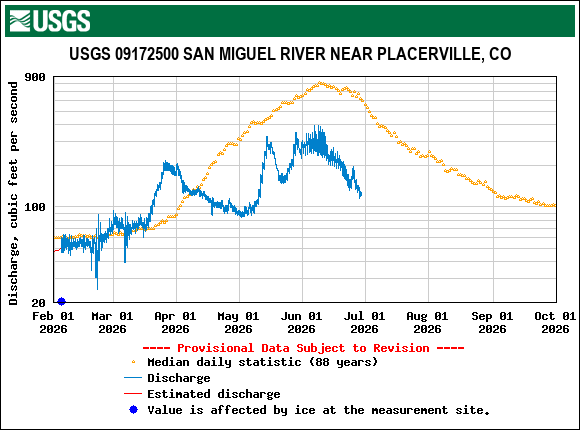
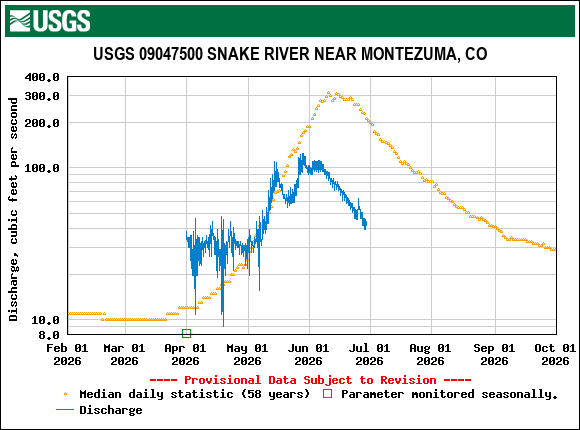
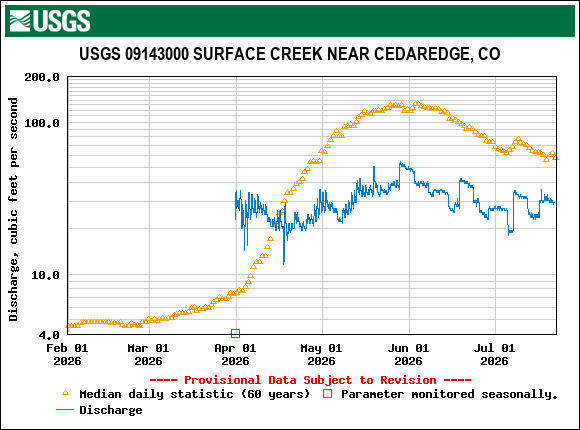
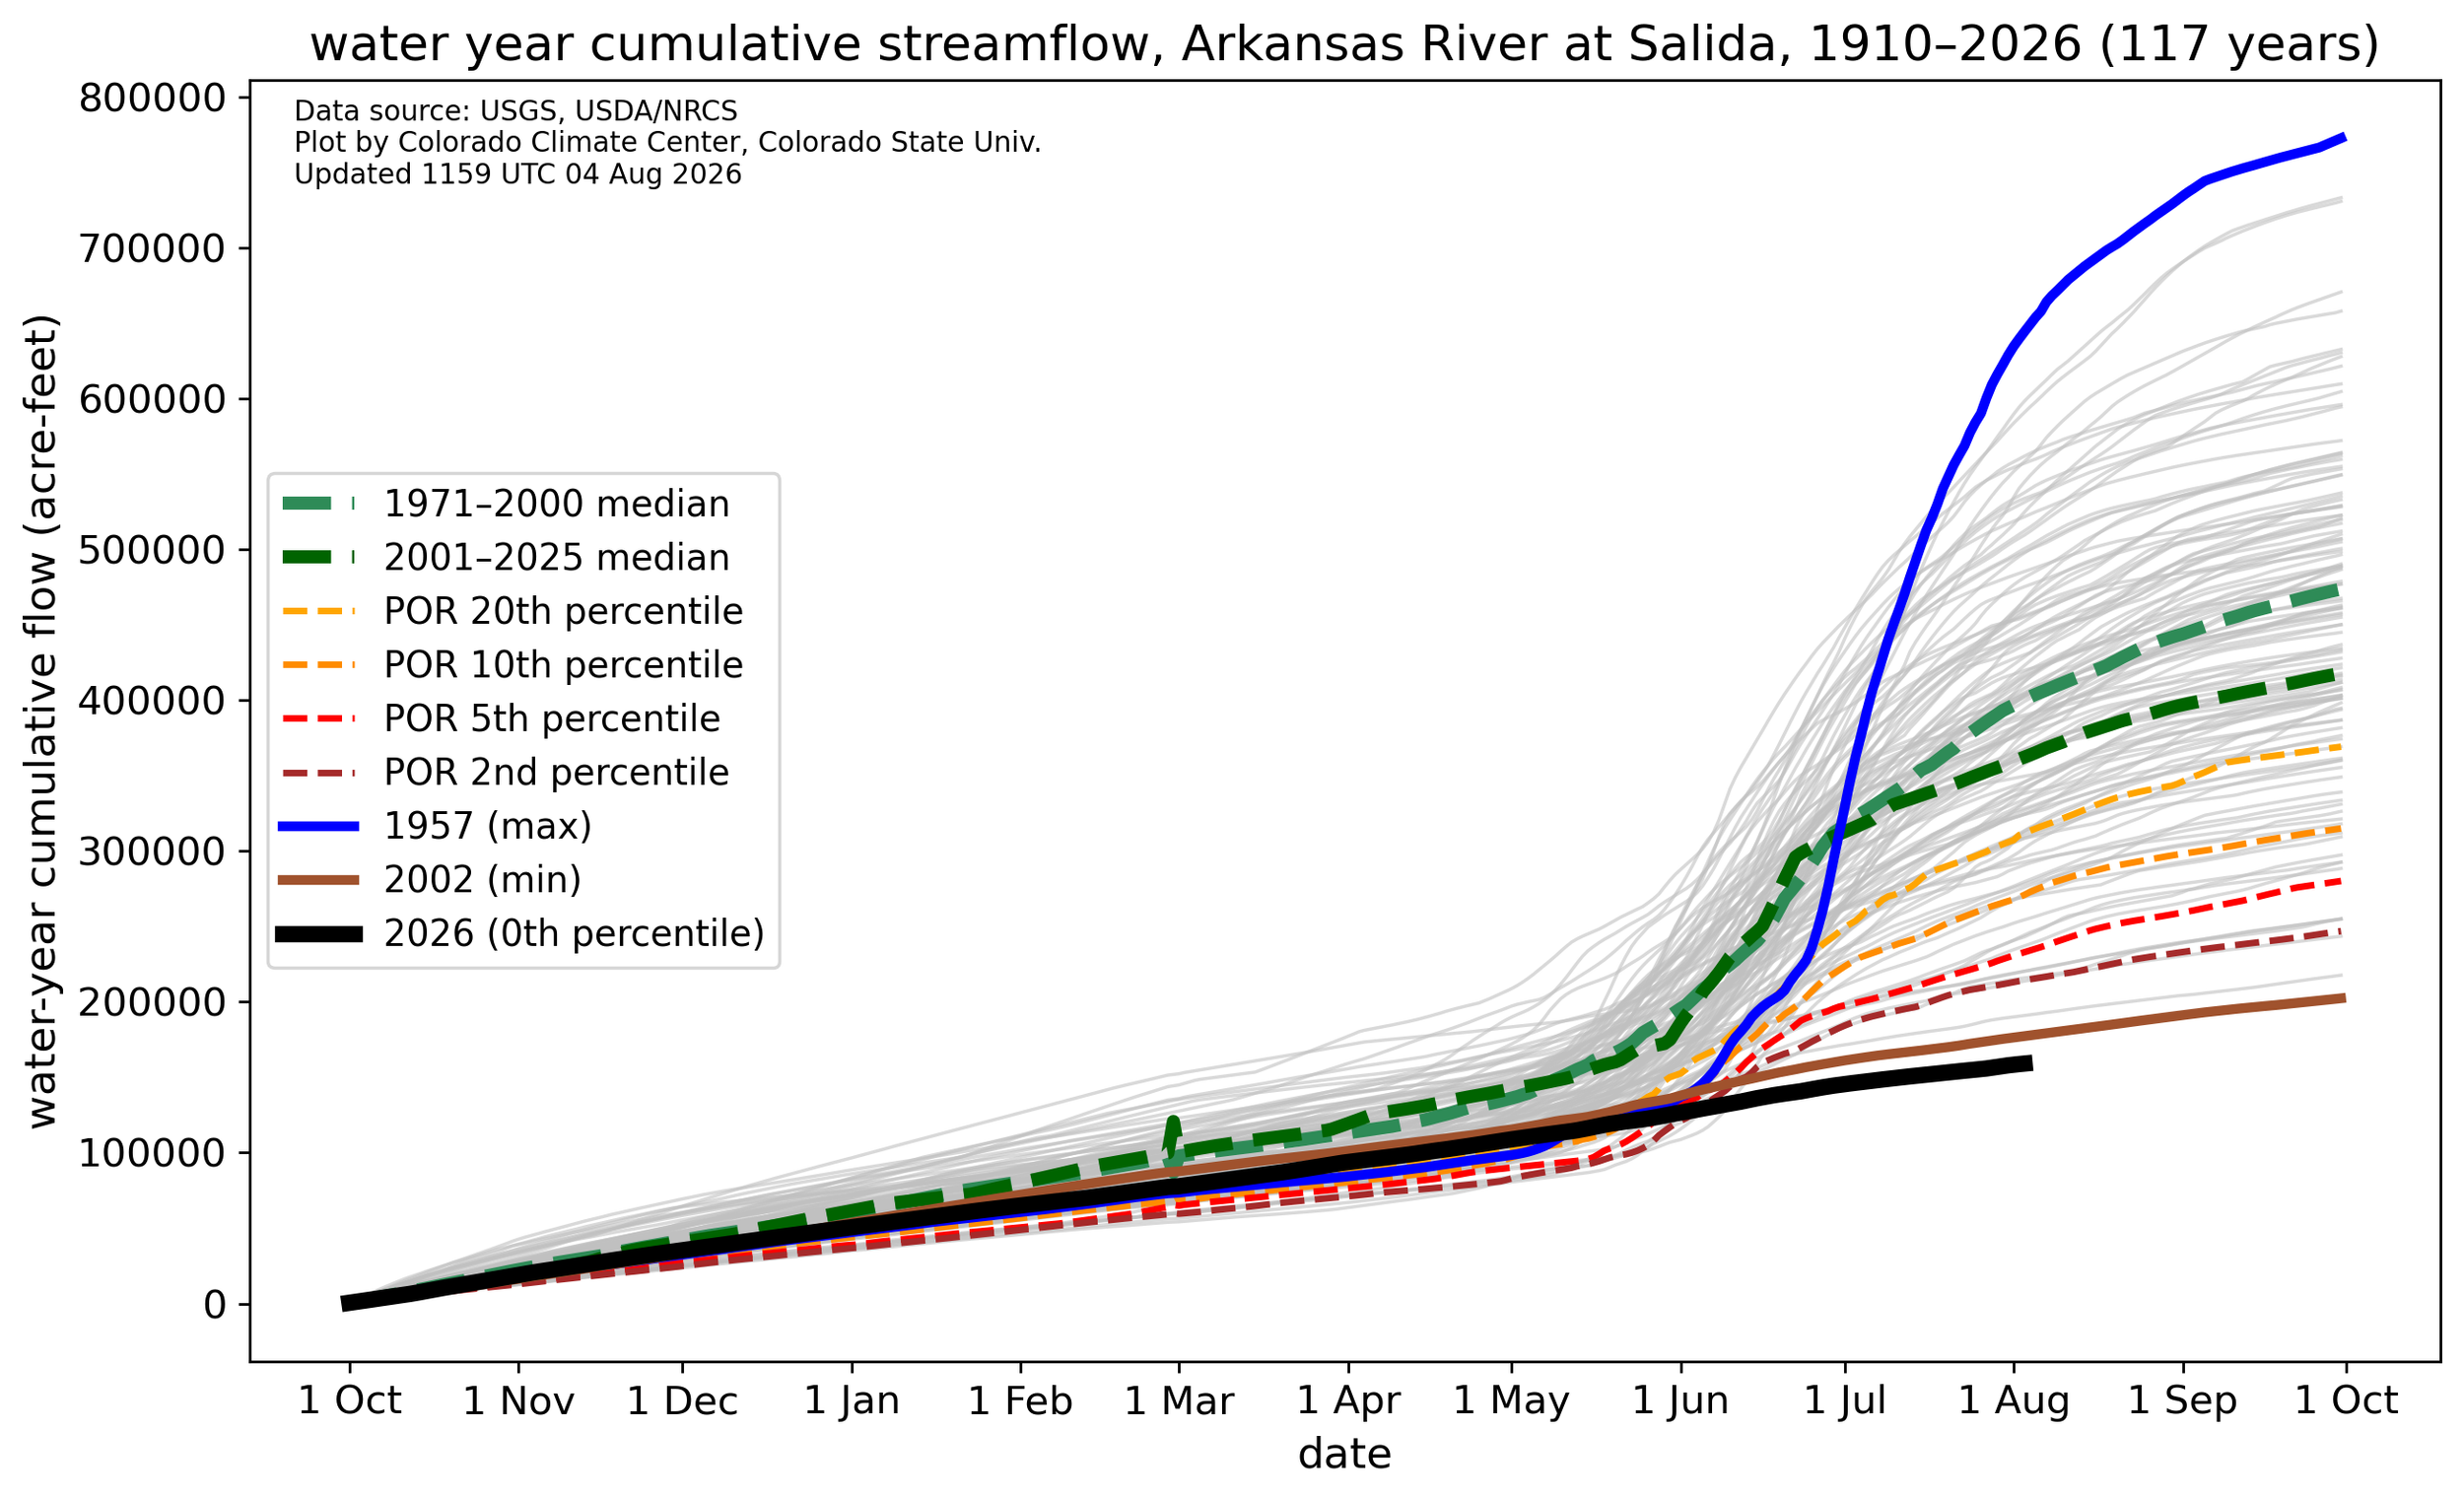
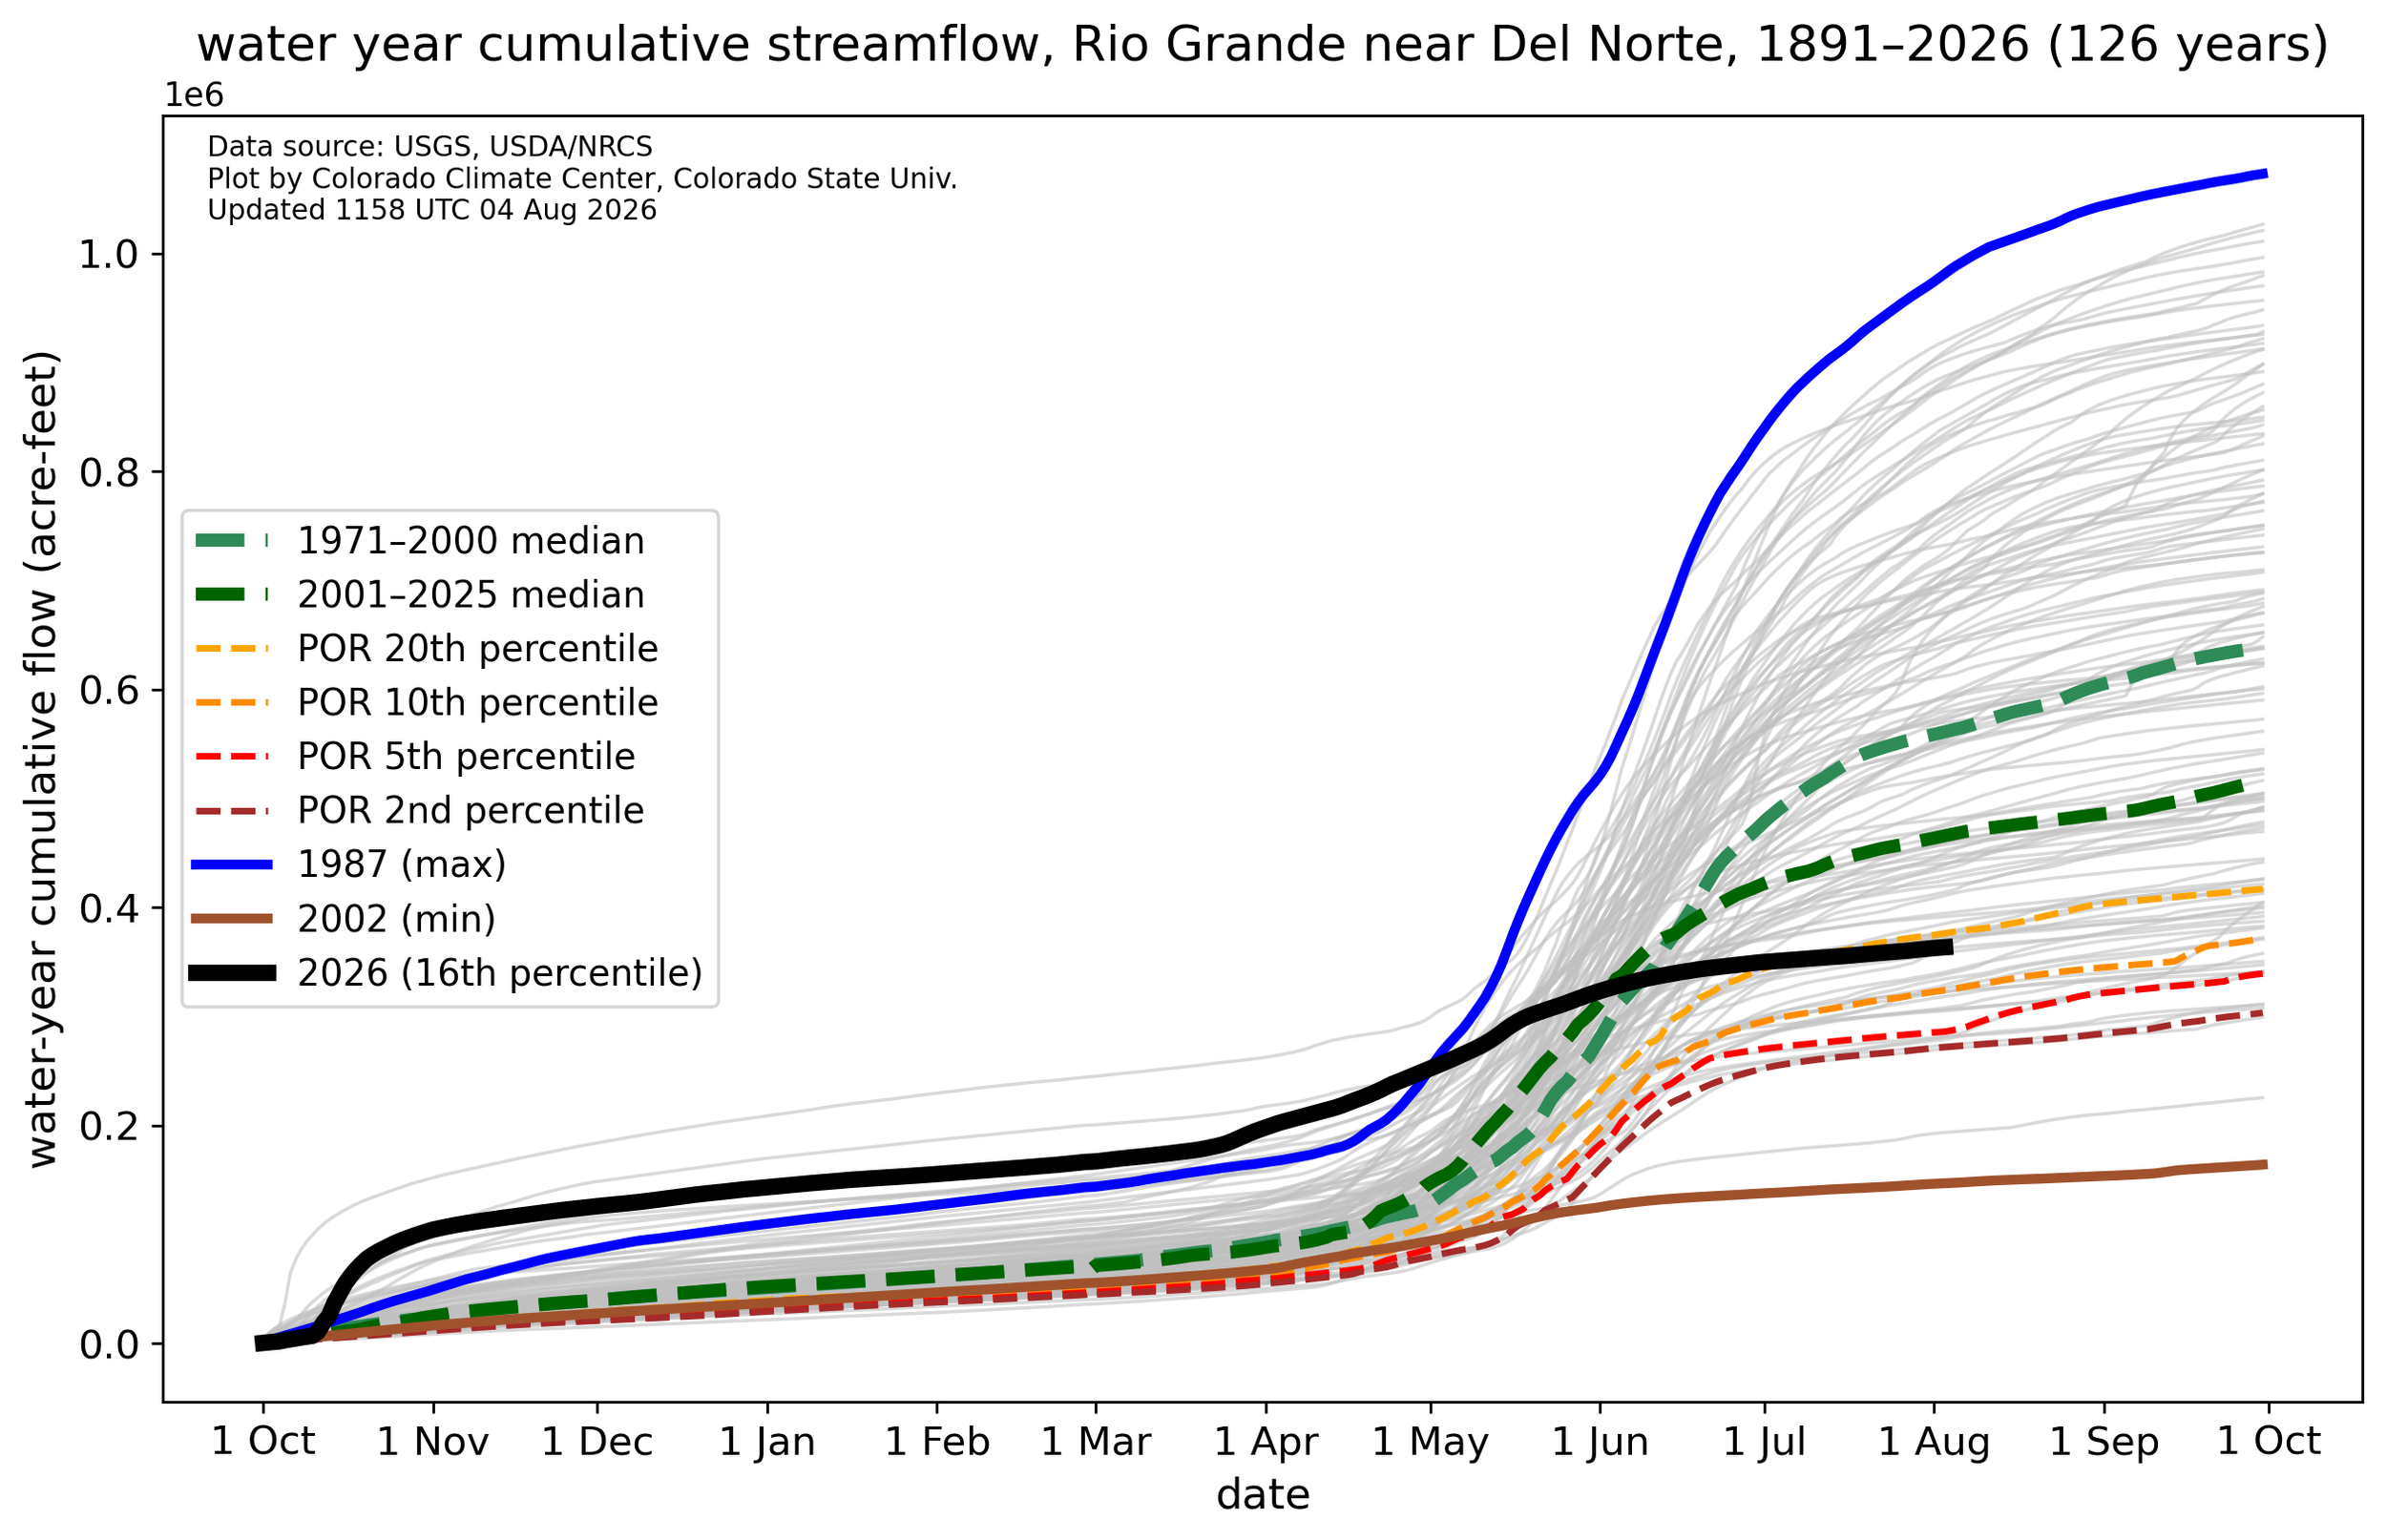
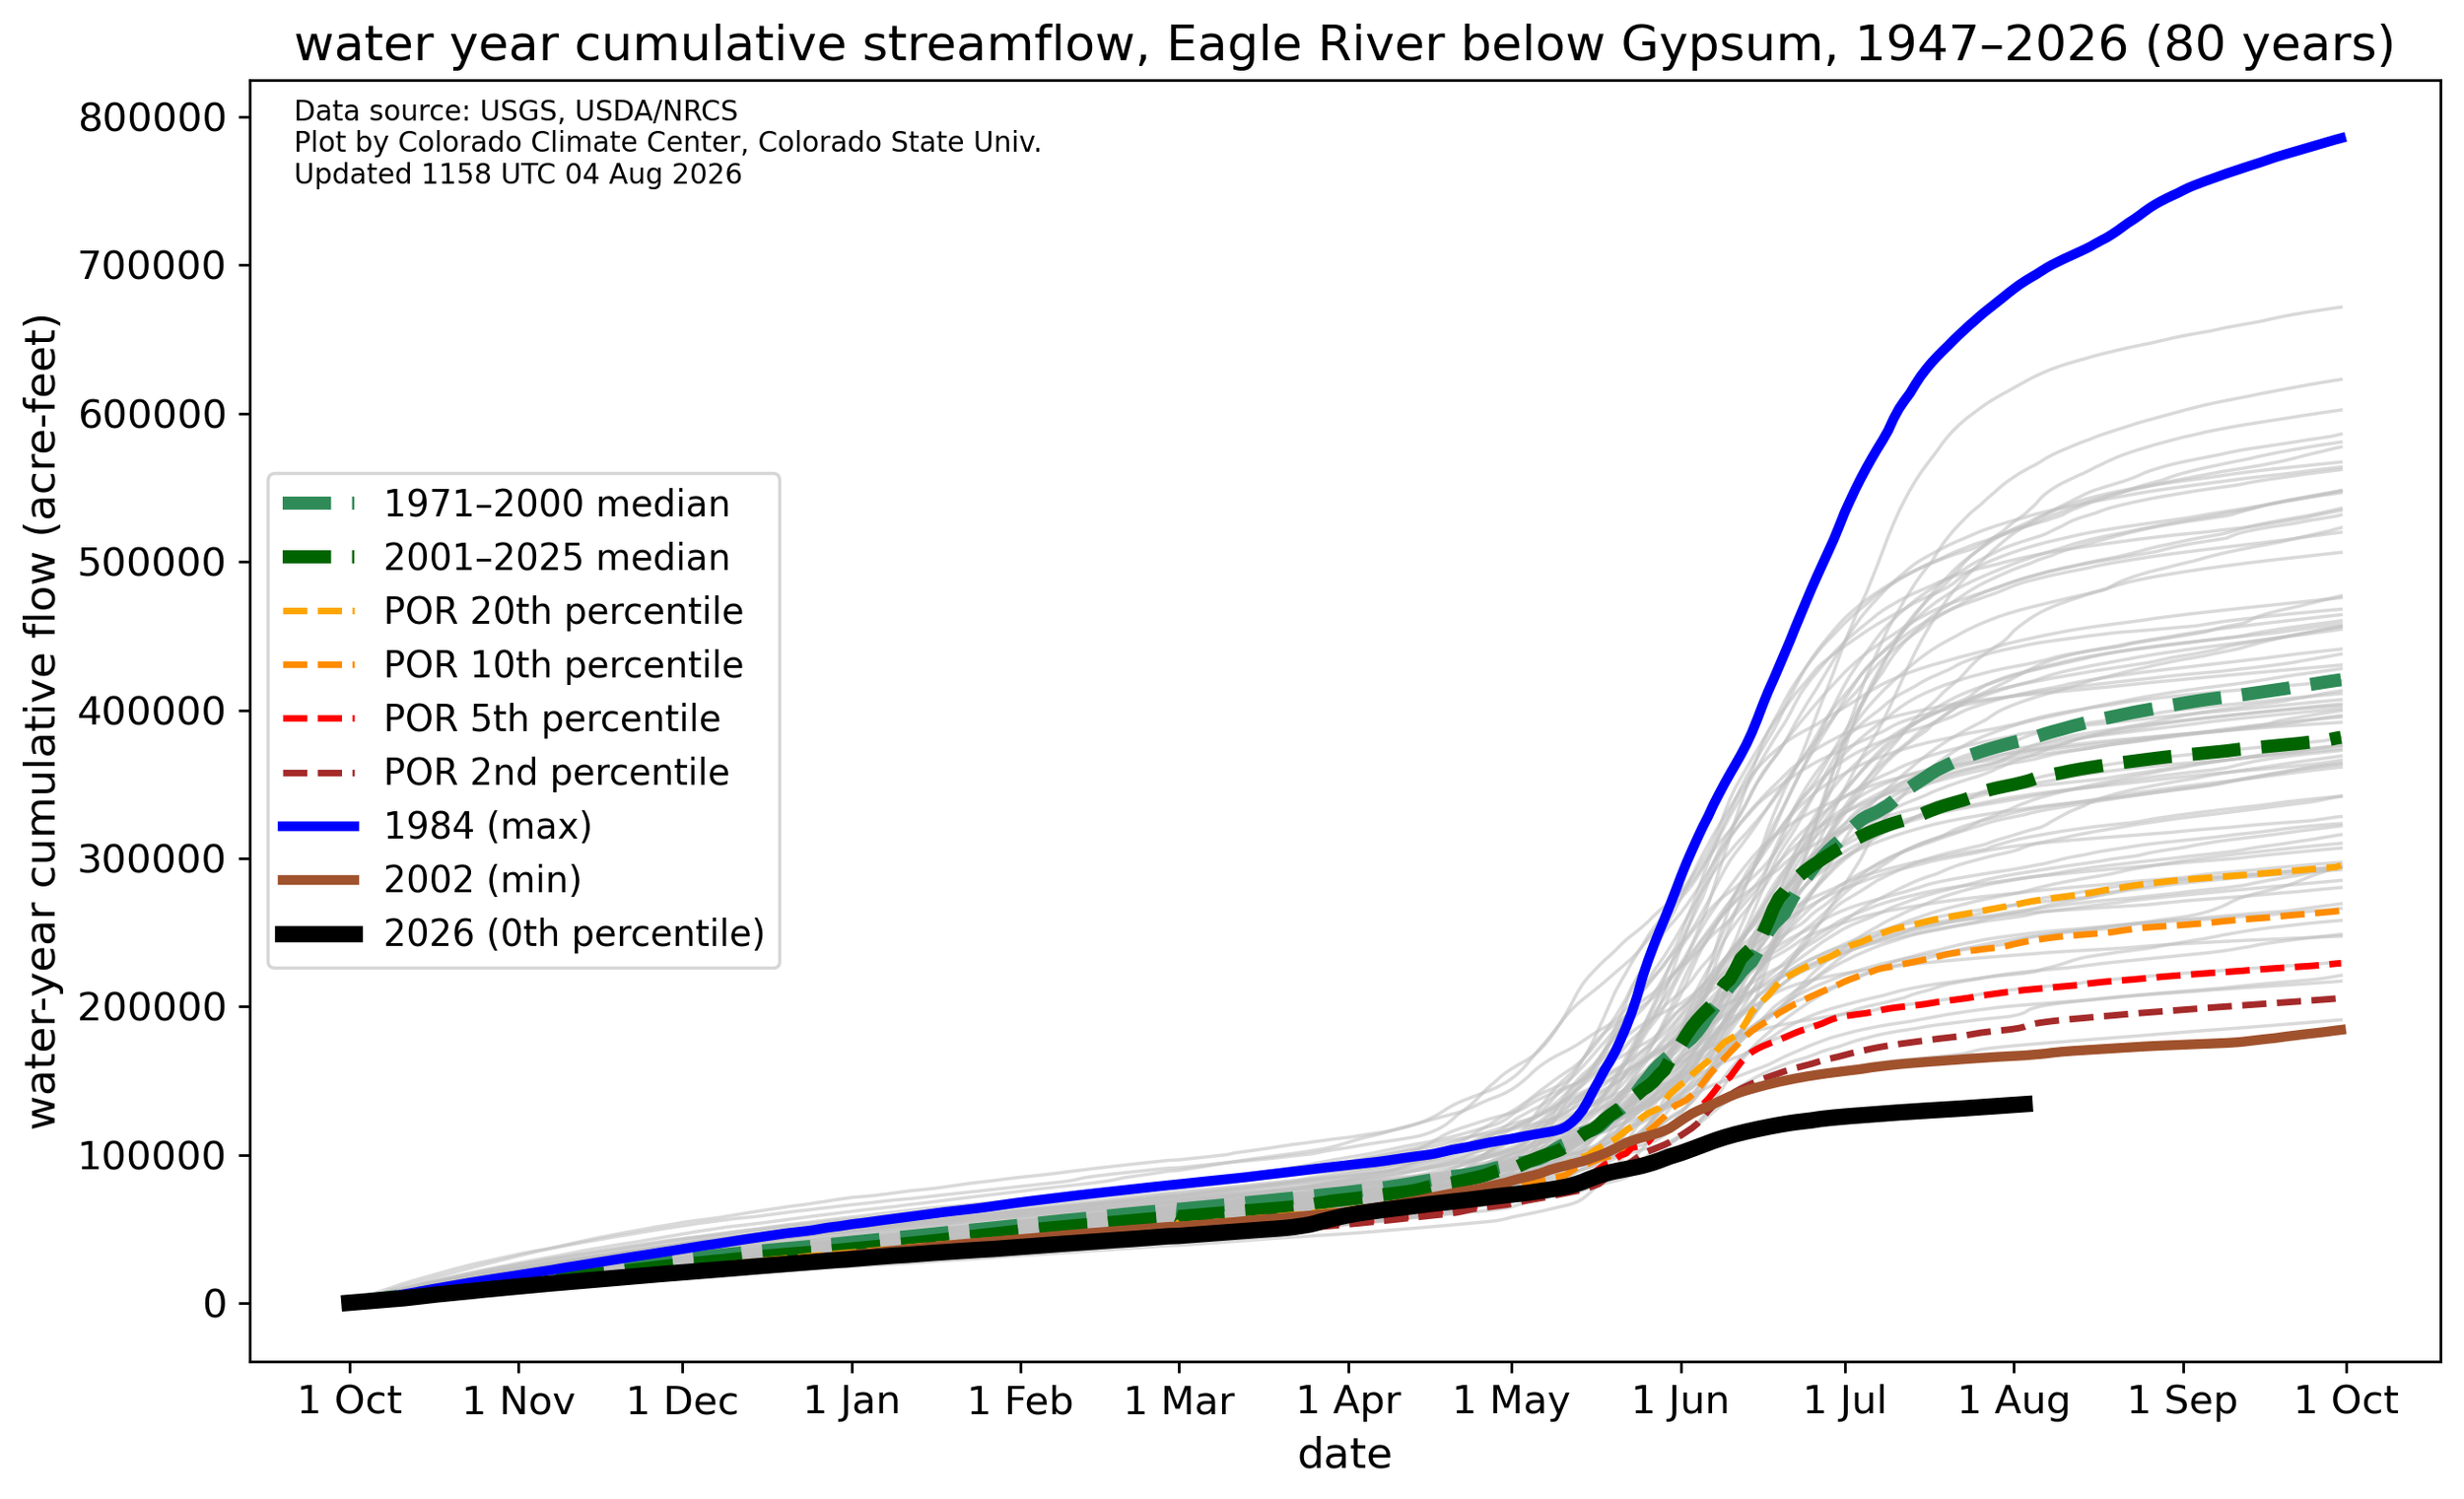
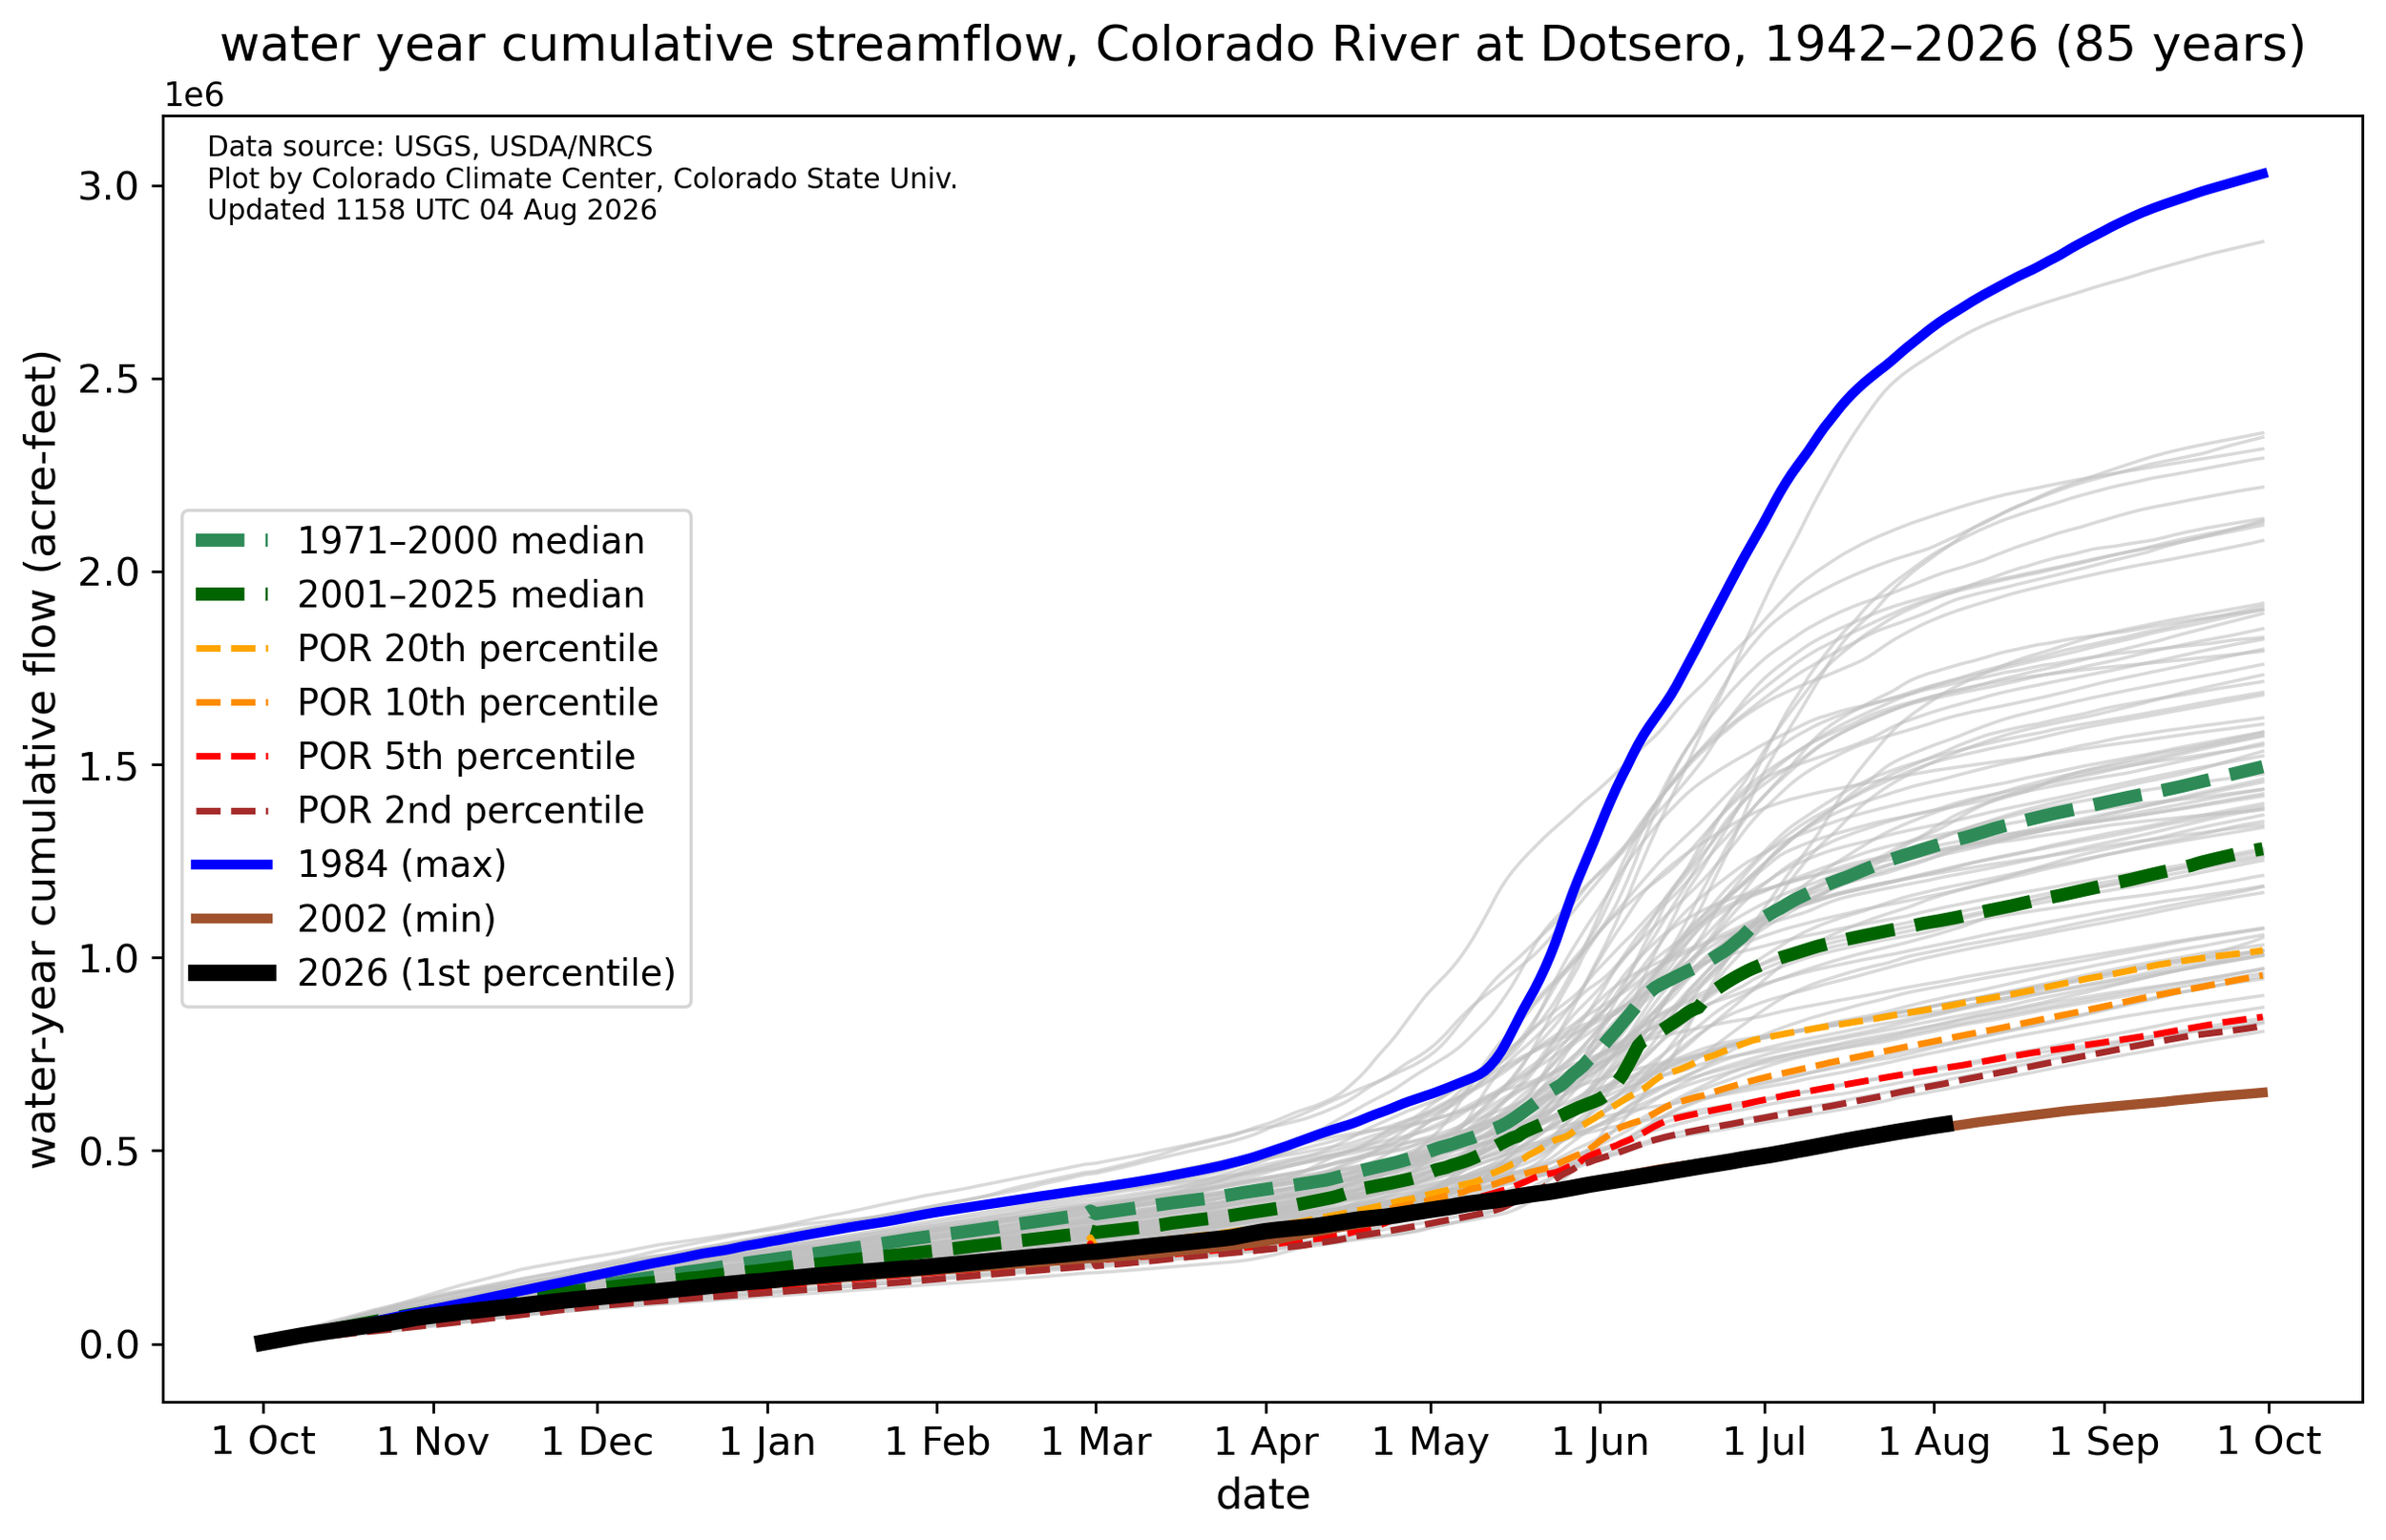
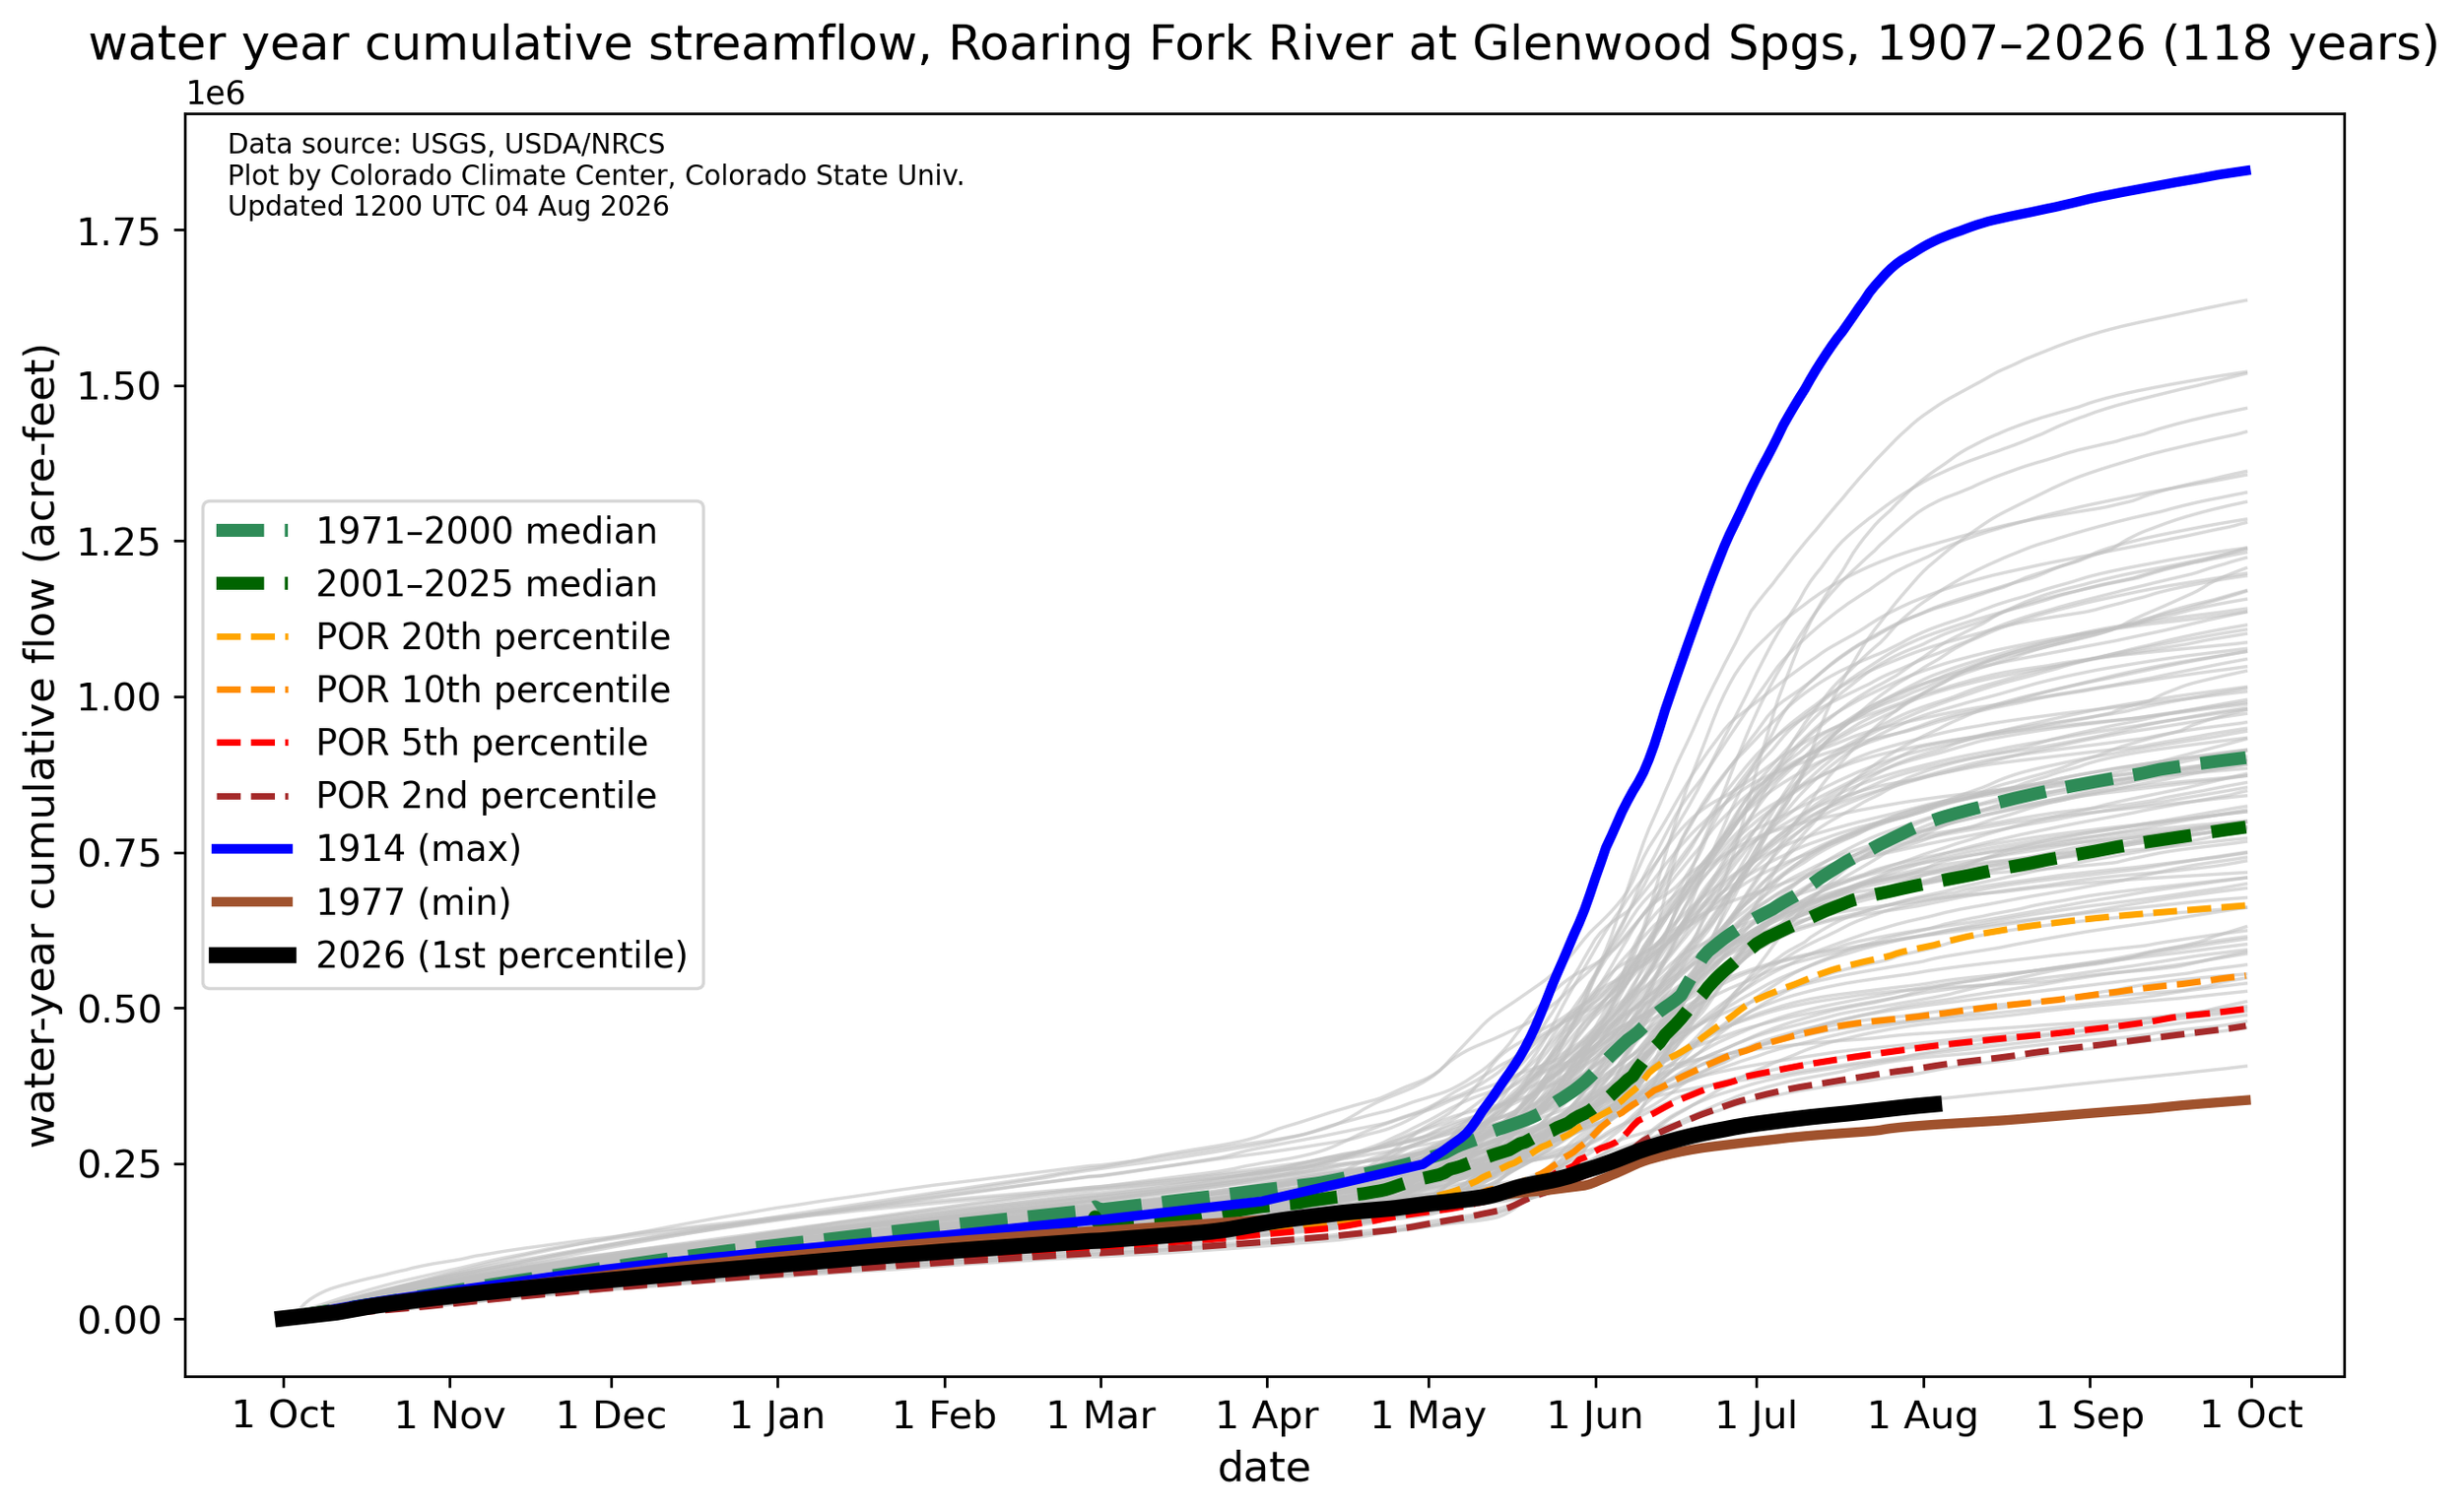
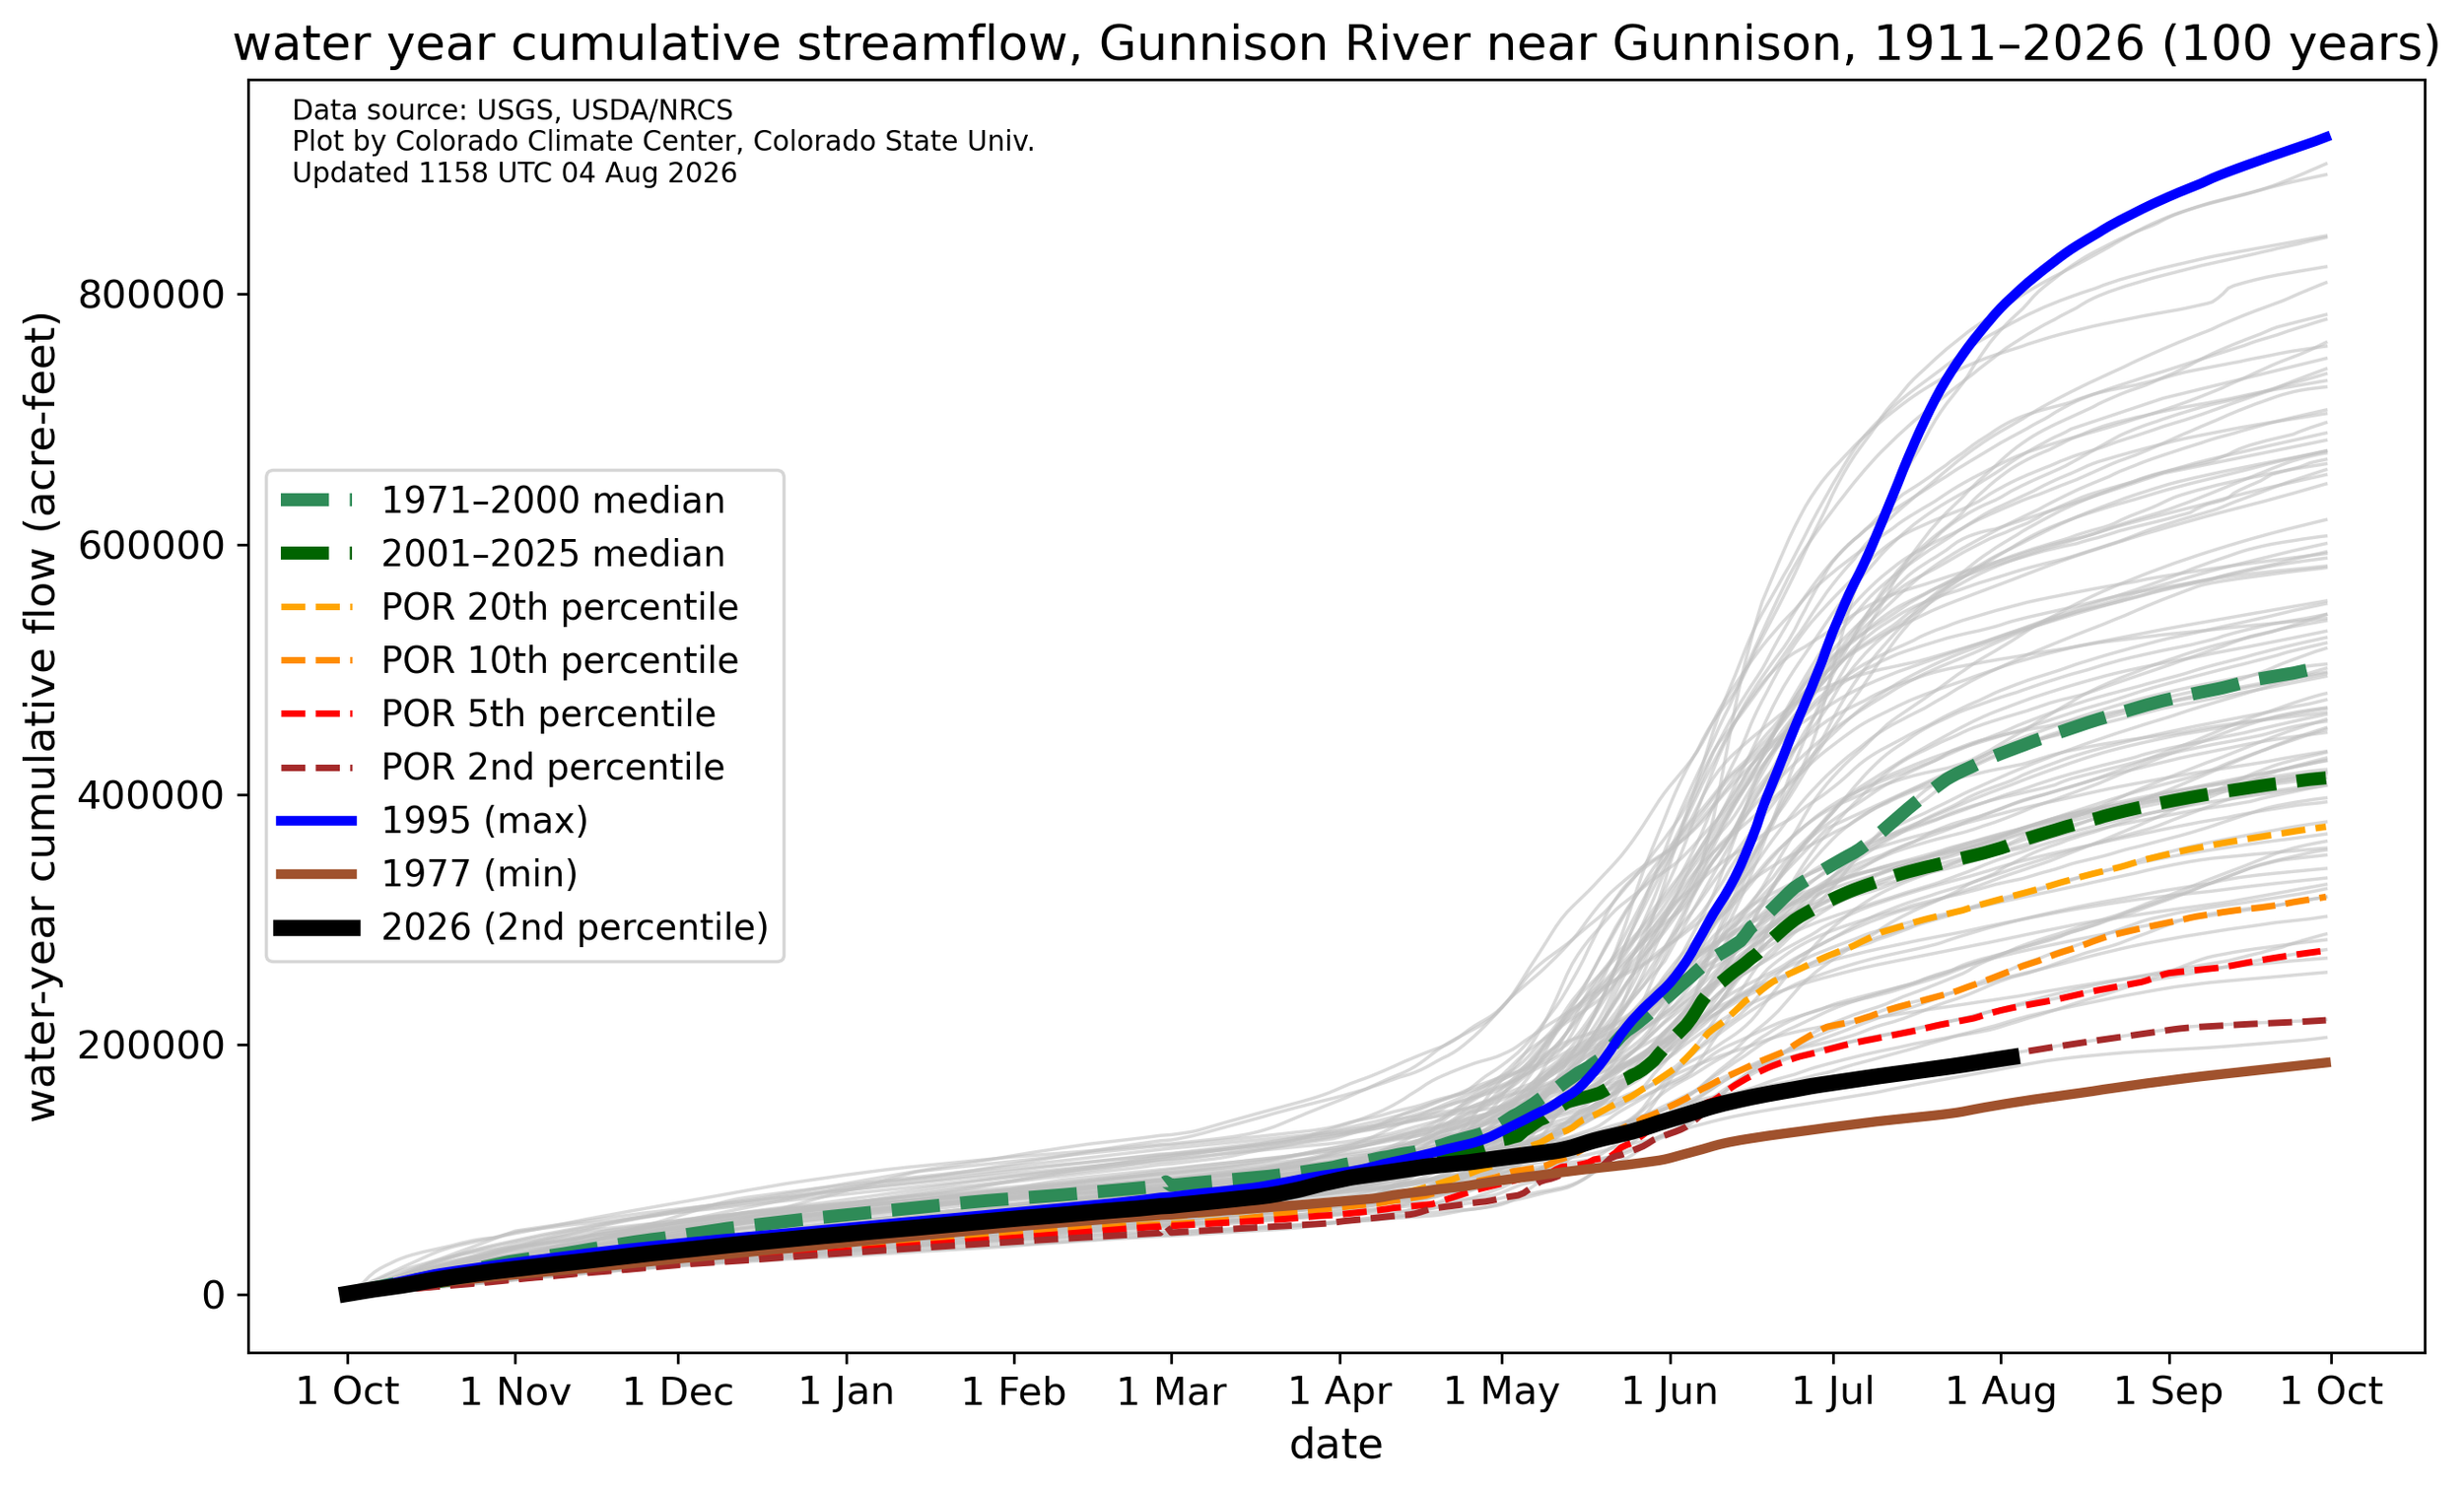
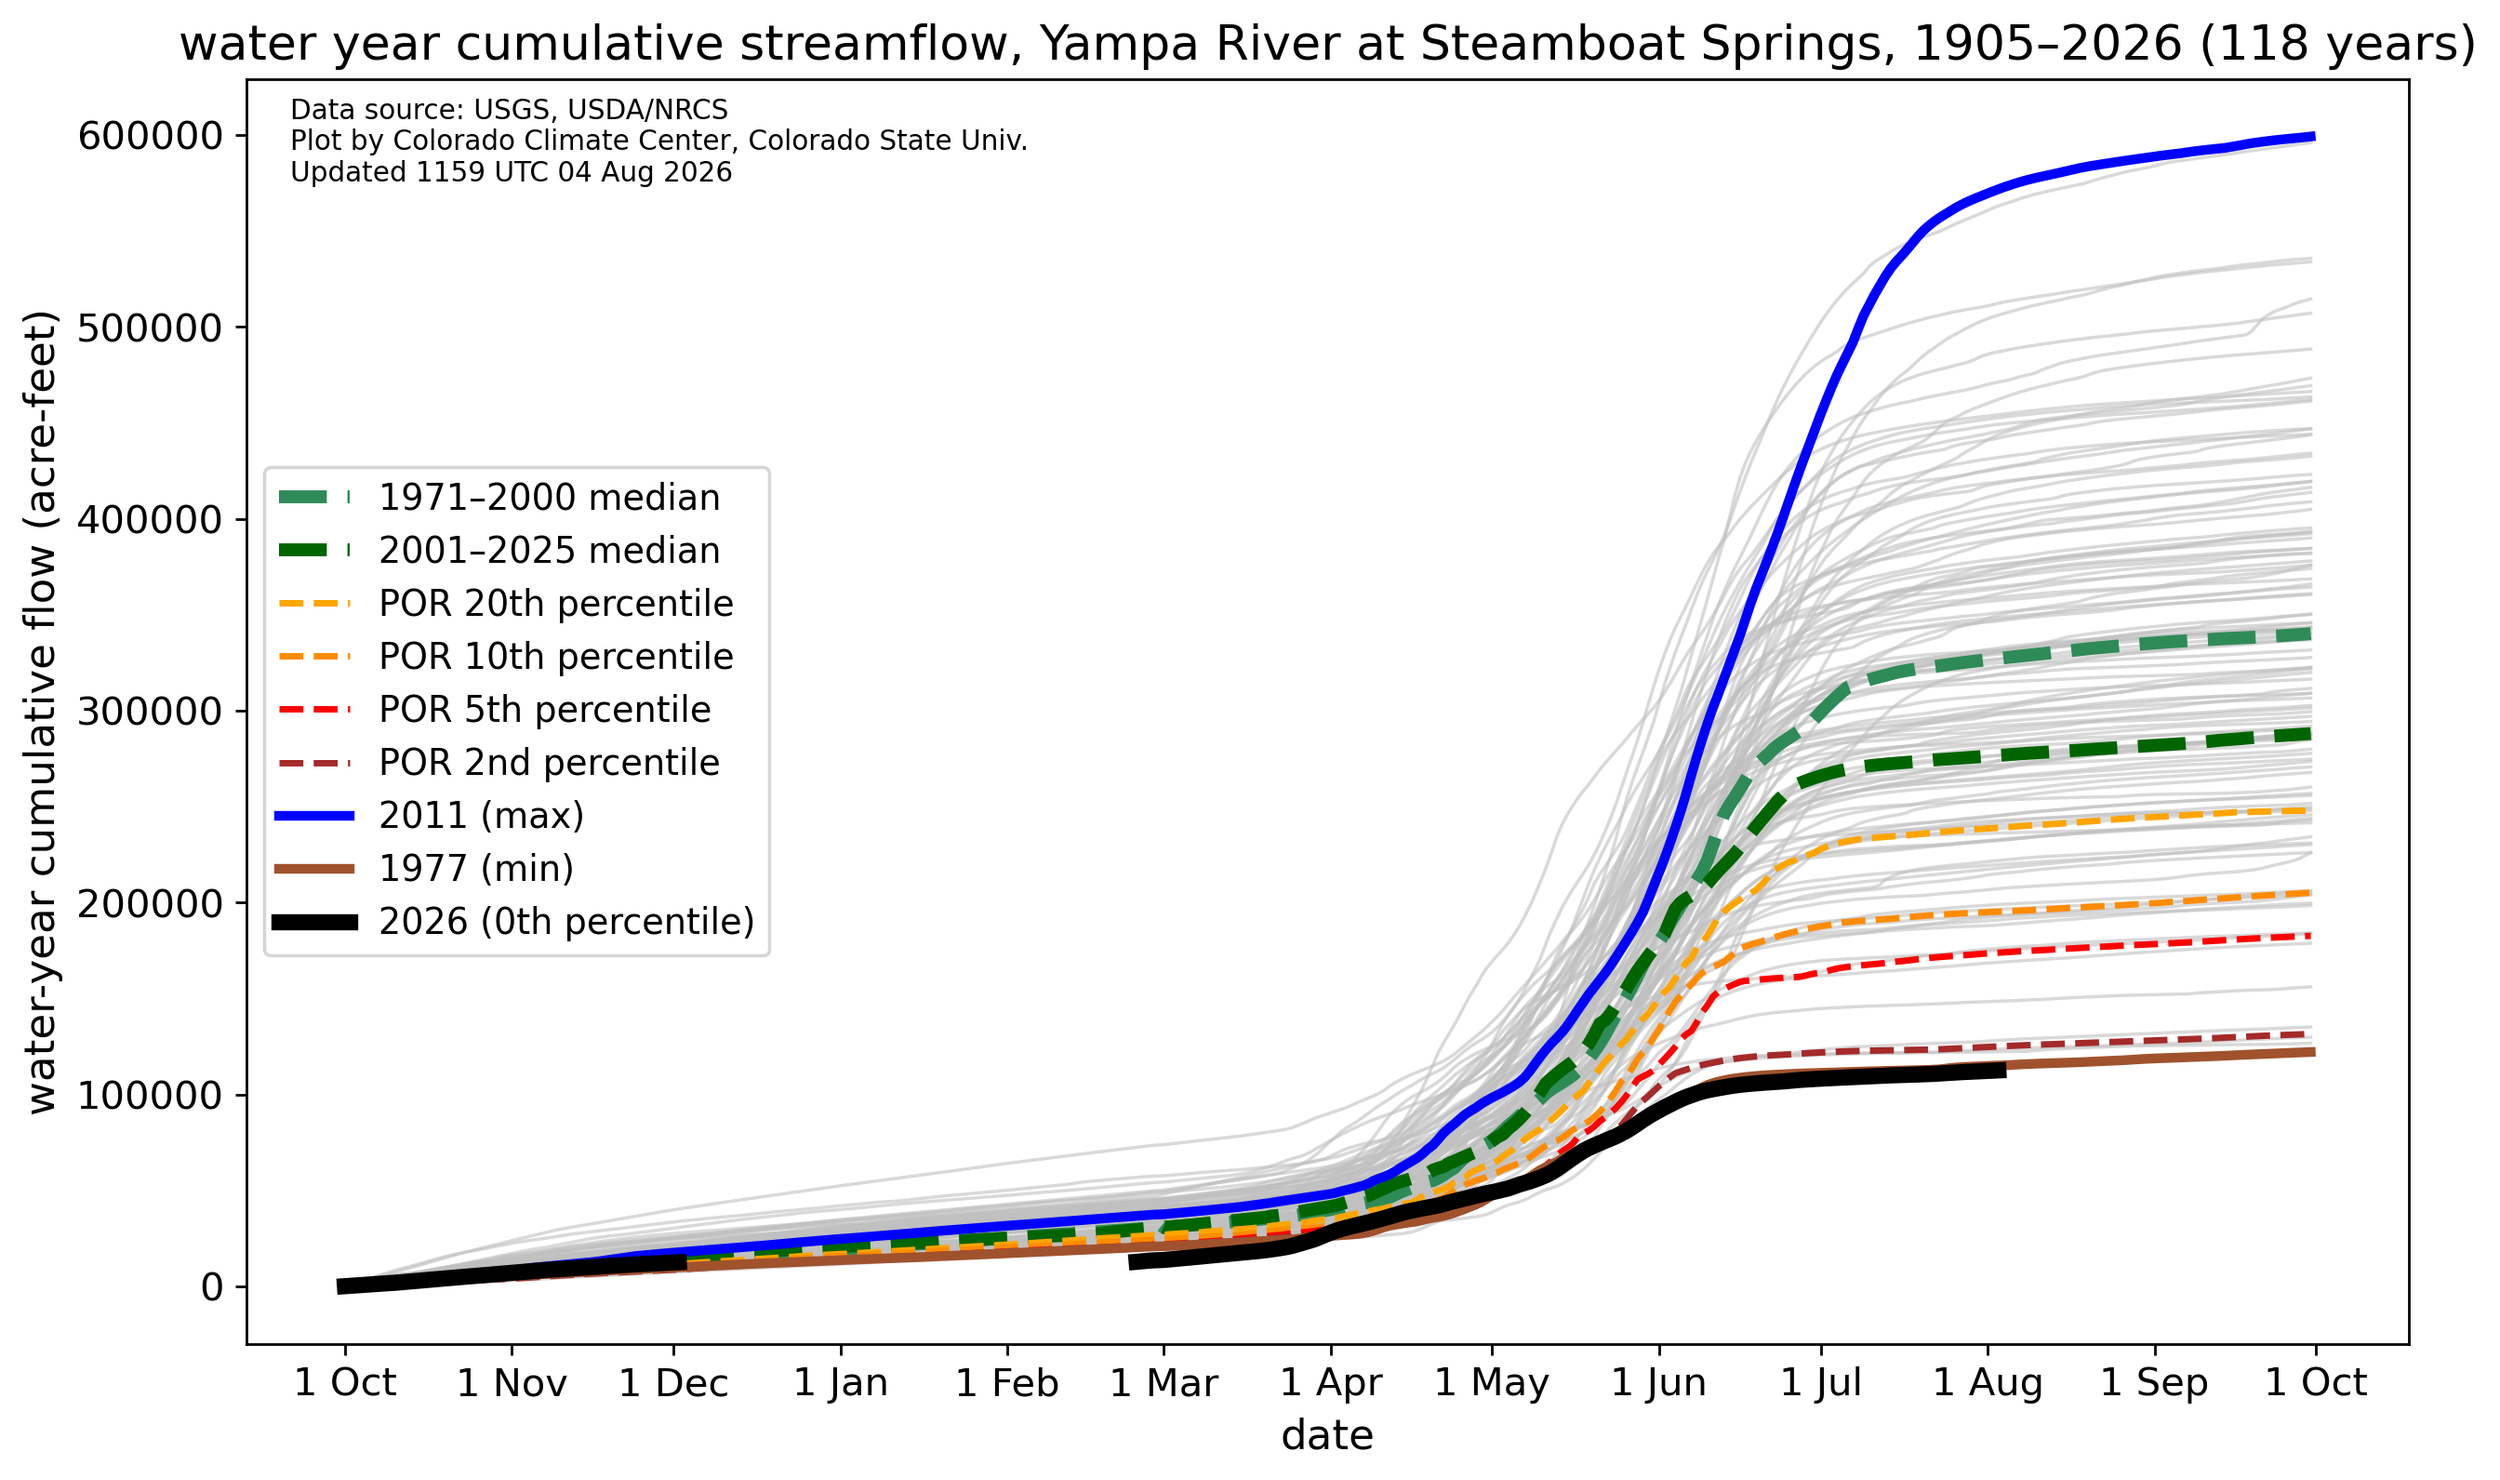
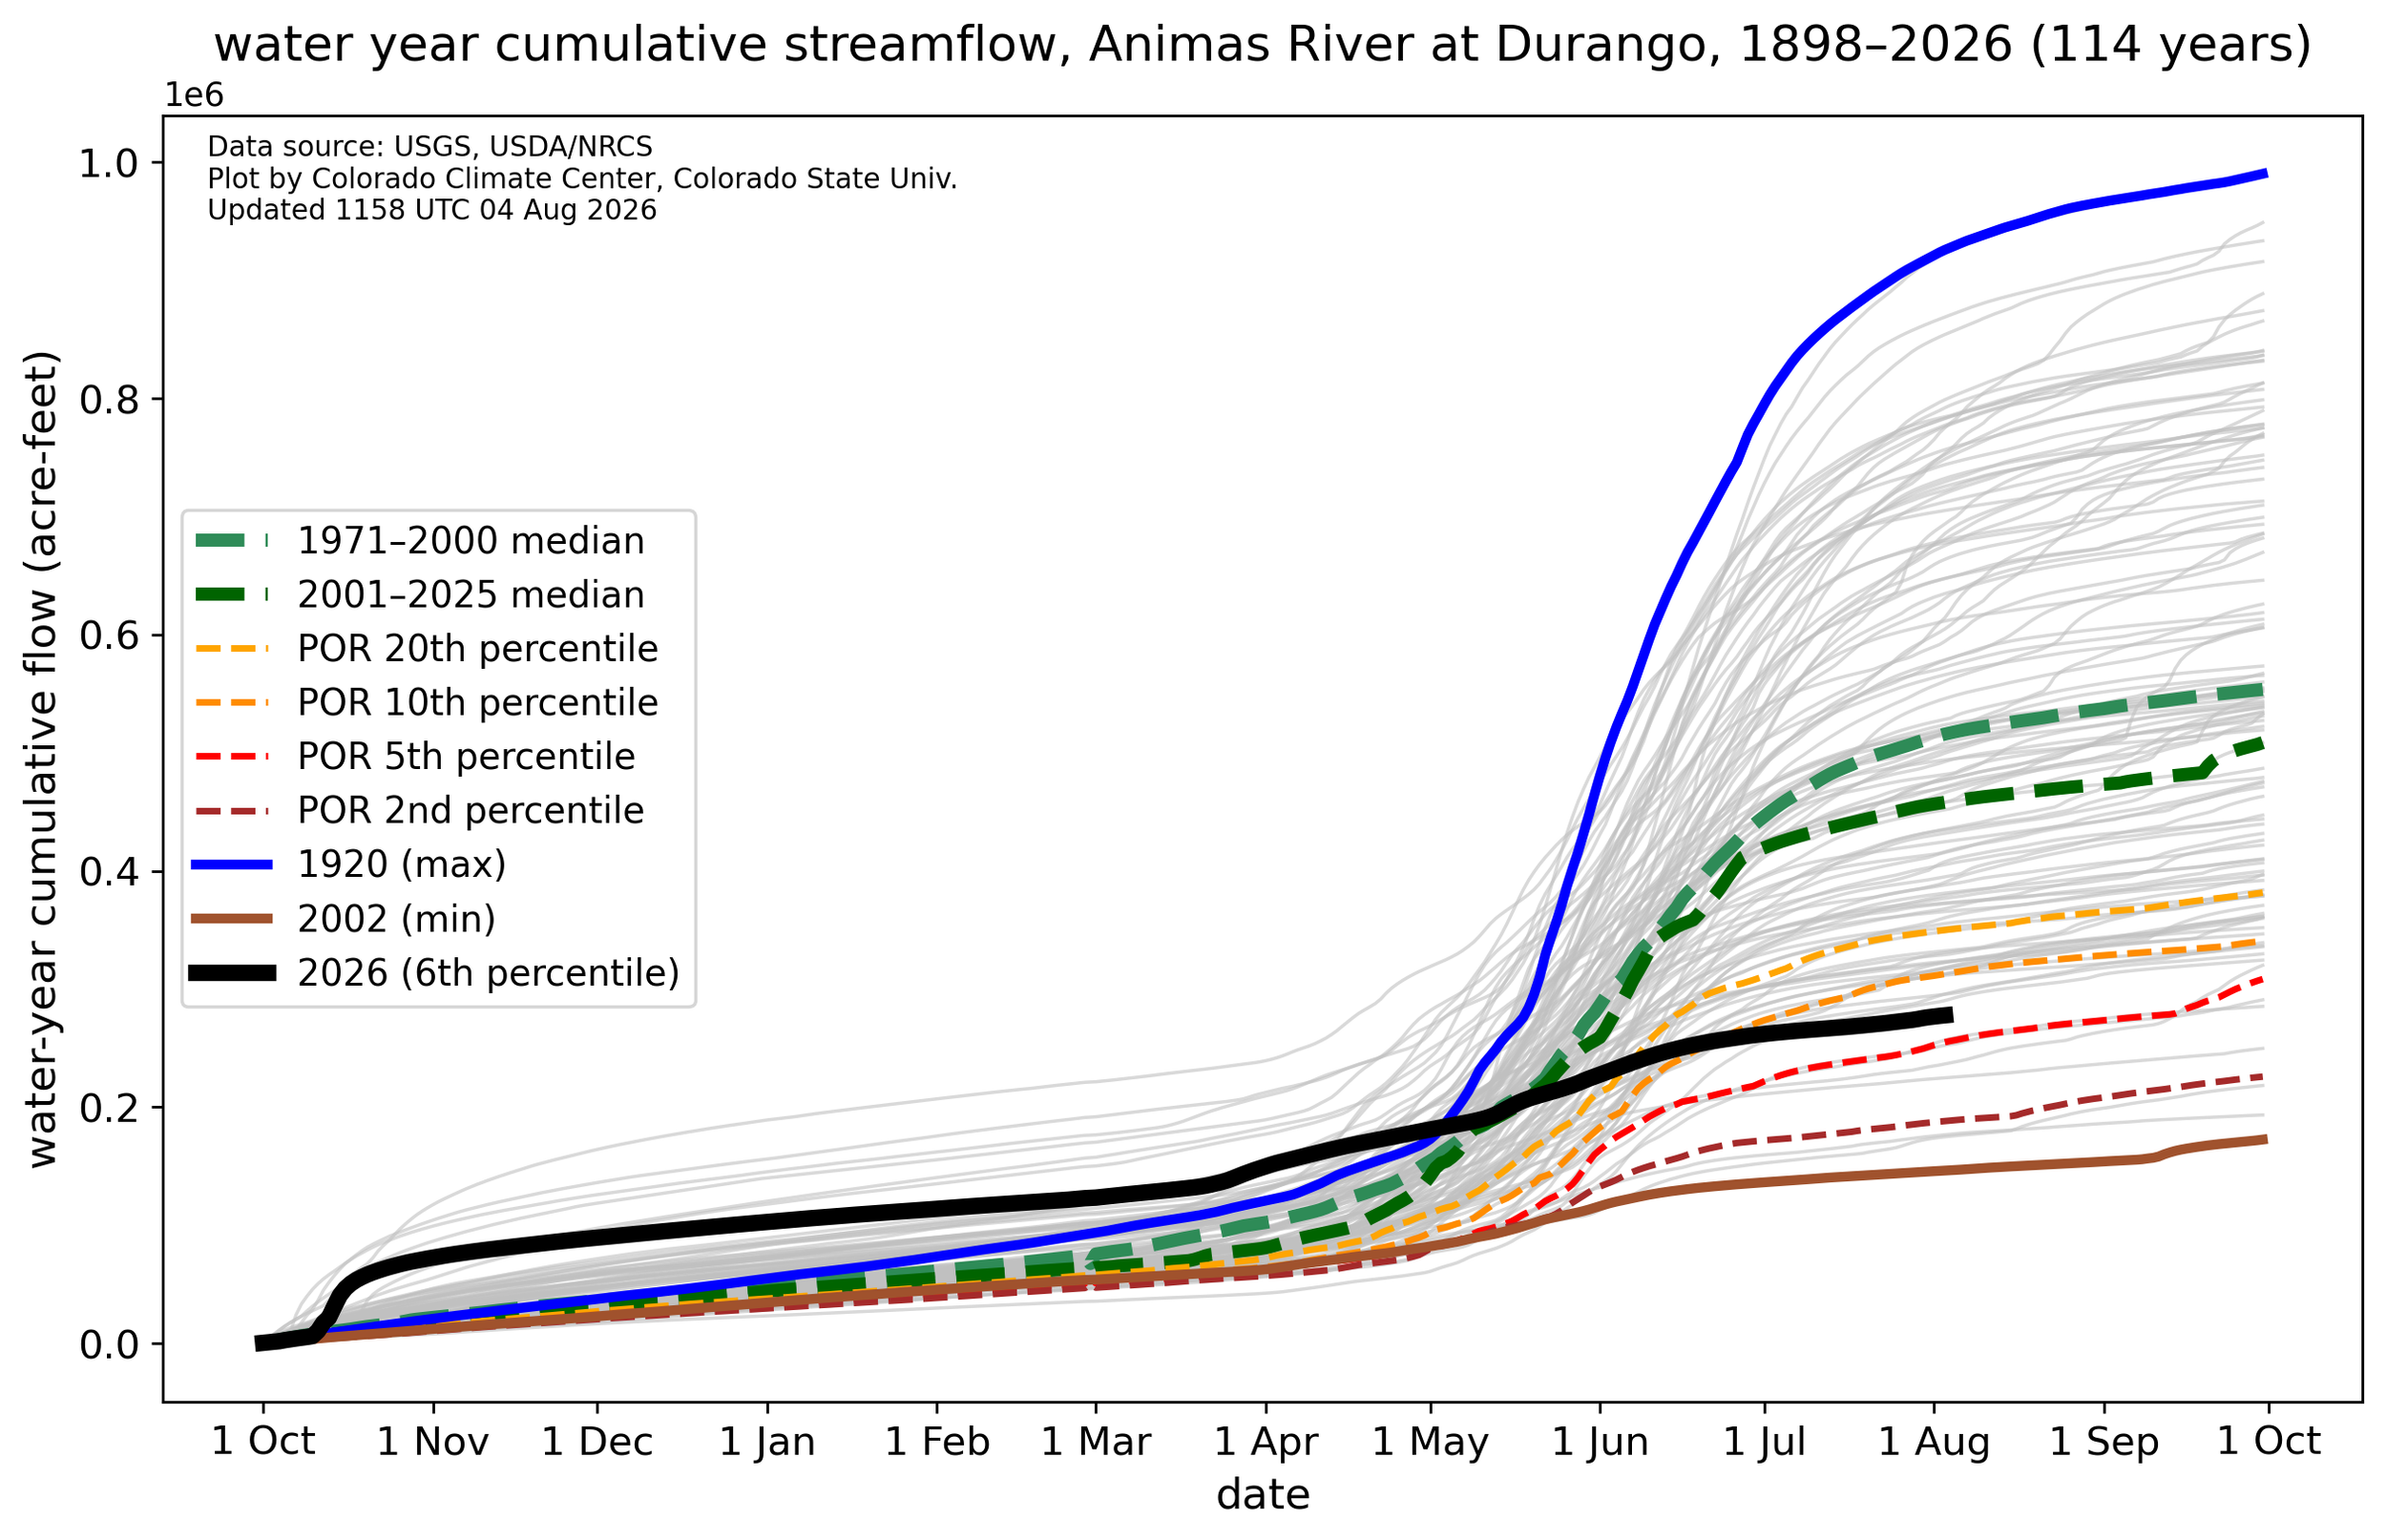
The peak in streamflow was early but not extremely so. What was expected but still alarming was streamflow volume. Streamflow volume at Colorado gauges were very near record low or established a new low altogether.

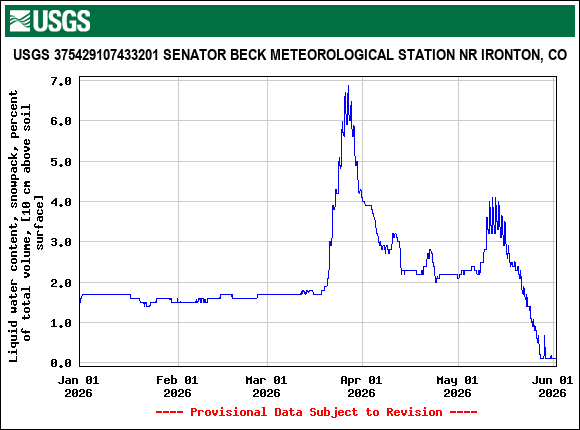
Below: Liquid water content of snowpack at USGS co-located station at Senator Beck Study plot, elevation 12,200’. The higher elevations were not safe from an early onset of snow melt this year. Plot shows liquid water influx from the March heat wave. April weather slowed things down a bit, but the isothermal snowpack was poised for continued melt when conditions allowed.
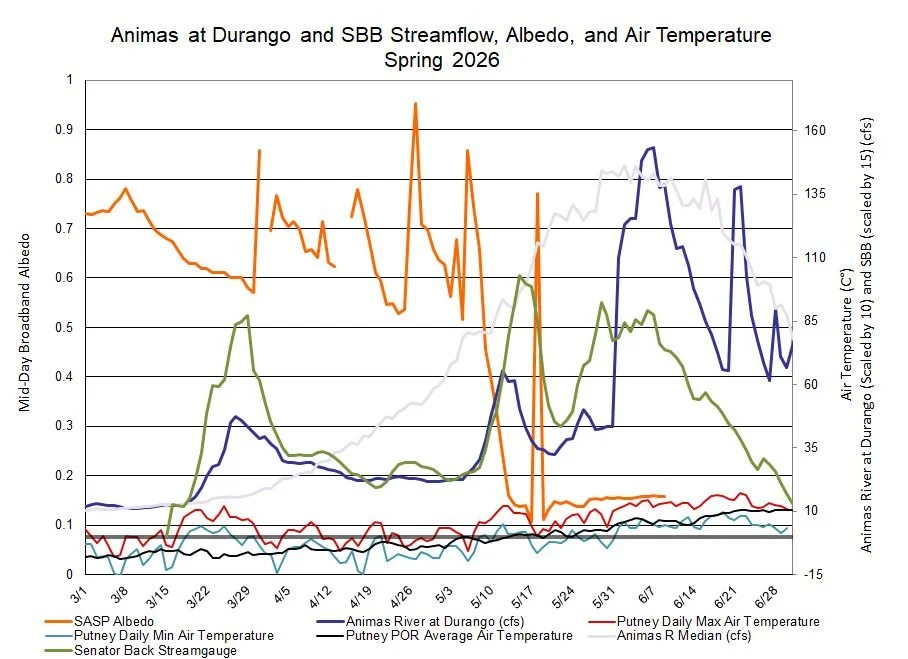
Above: Spring started off with hot/dry weather. Albedo degraded the month of March from an aging snow surface and no freshening snow fall. April precipitation events kept the snowpack on life support. As may returned to dry conditions the streamflow peak came as albedo nosedived and the snowpack raced toward full ablation around May 13, the second peak came when the higher elevations lost majority of snow around May 28.
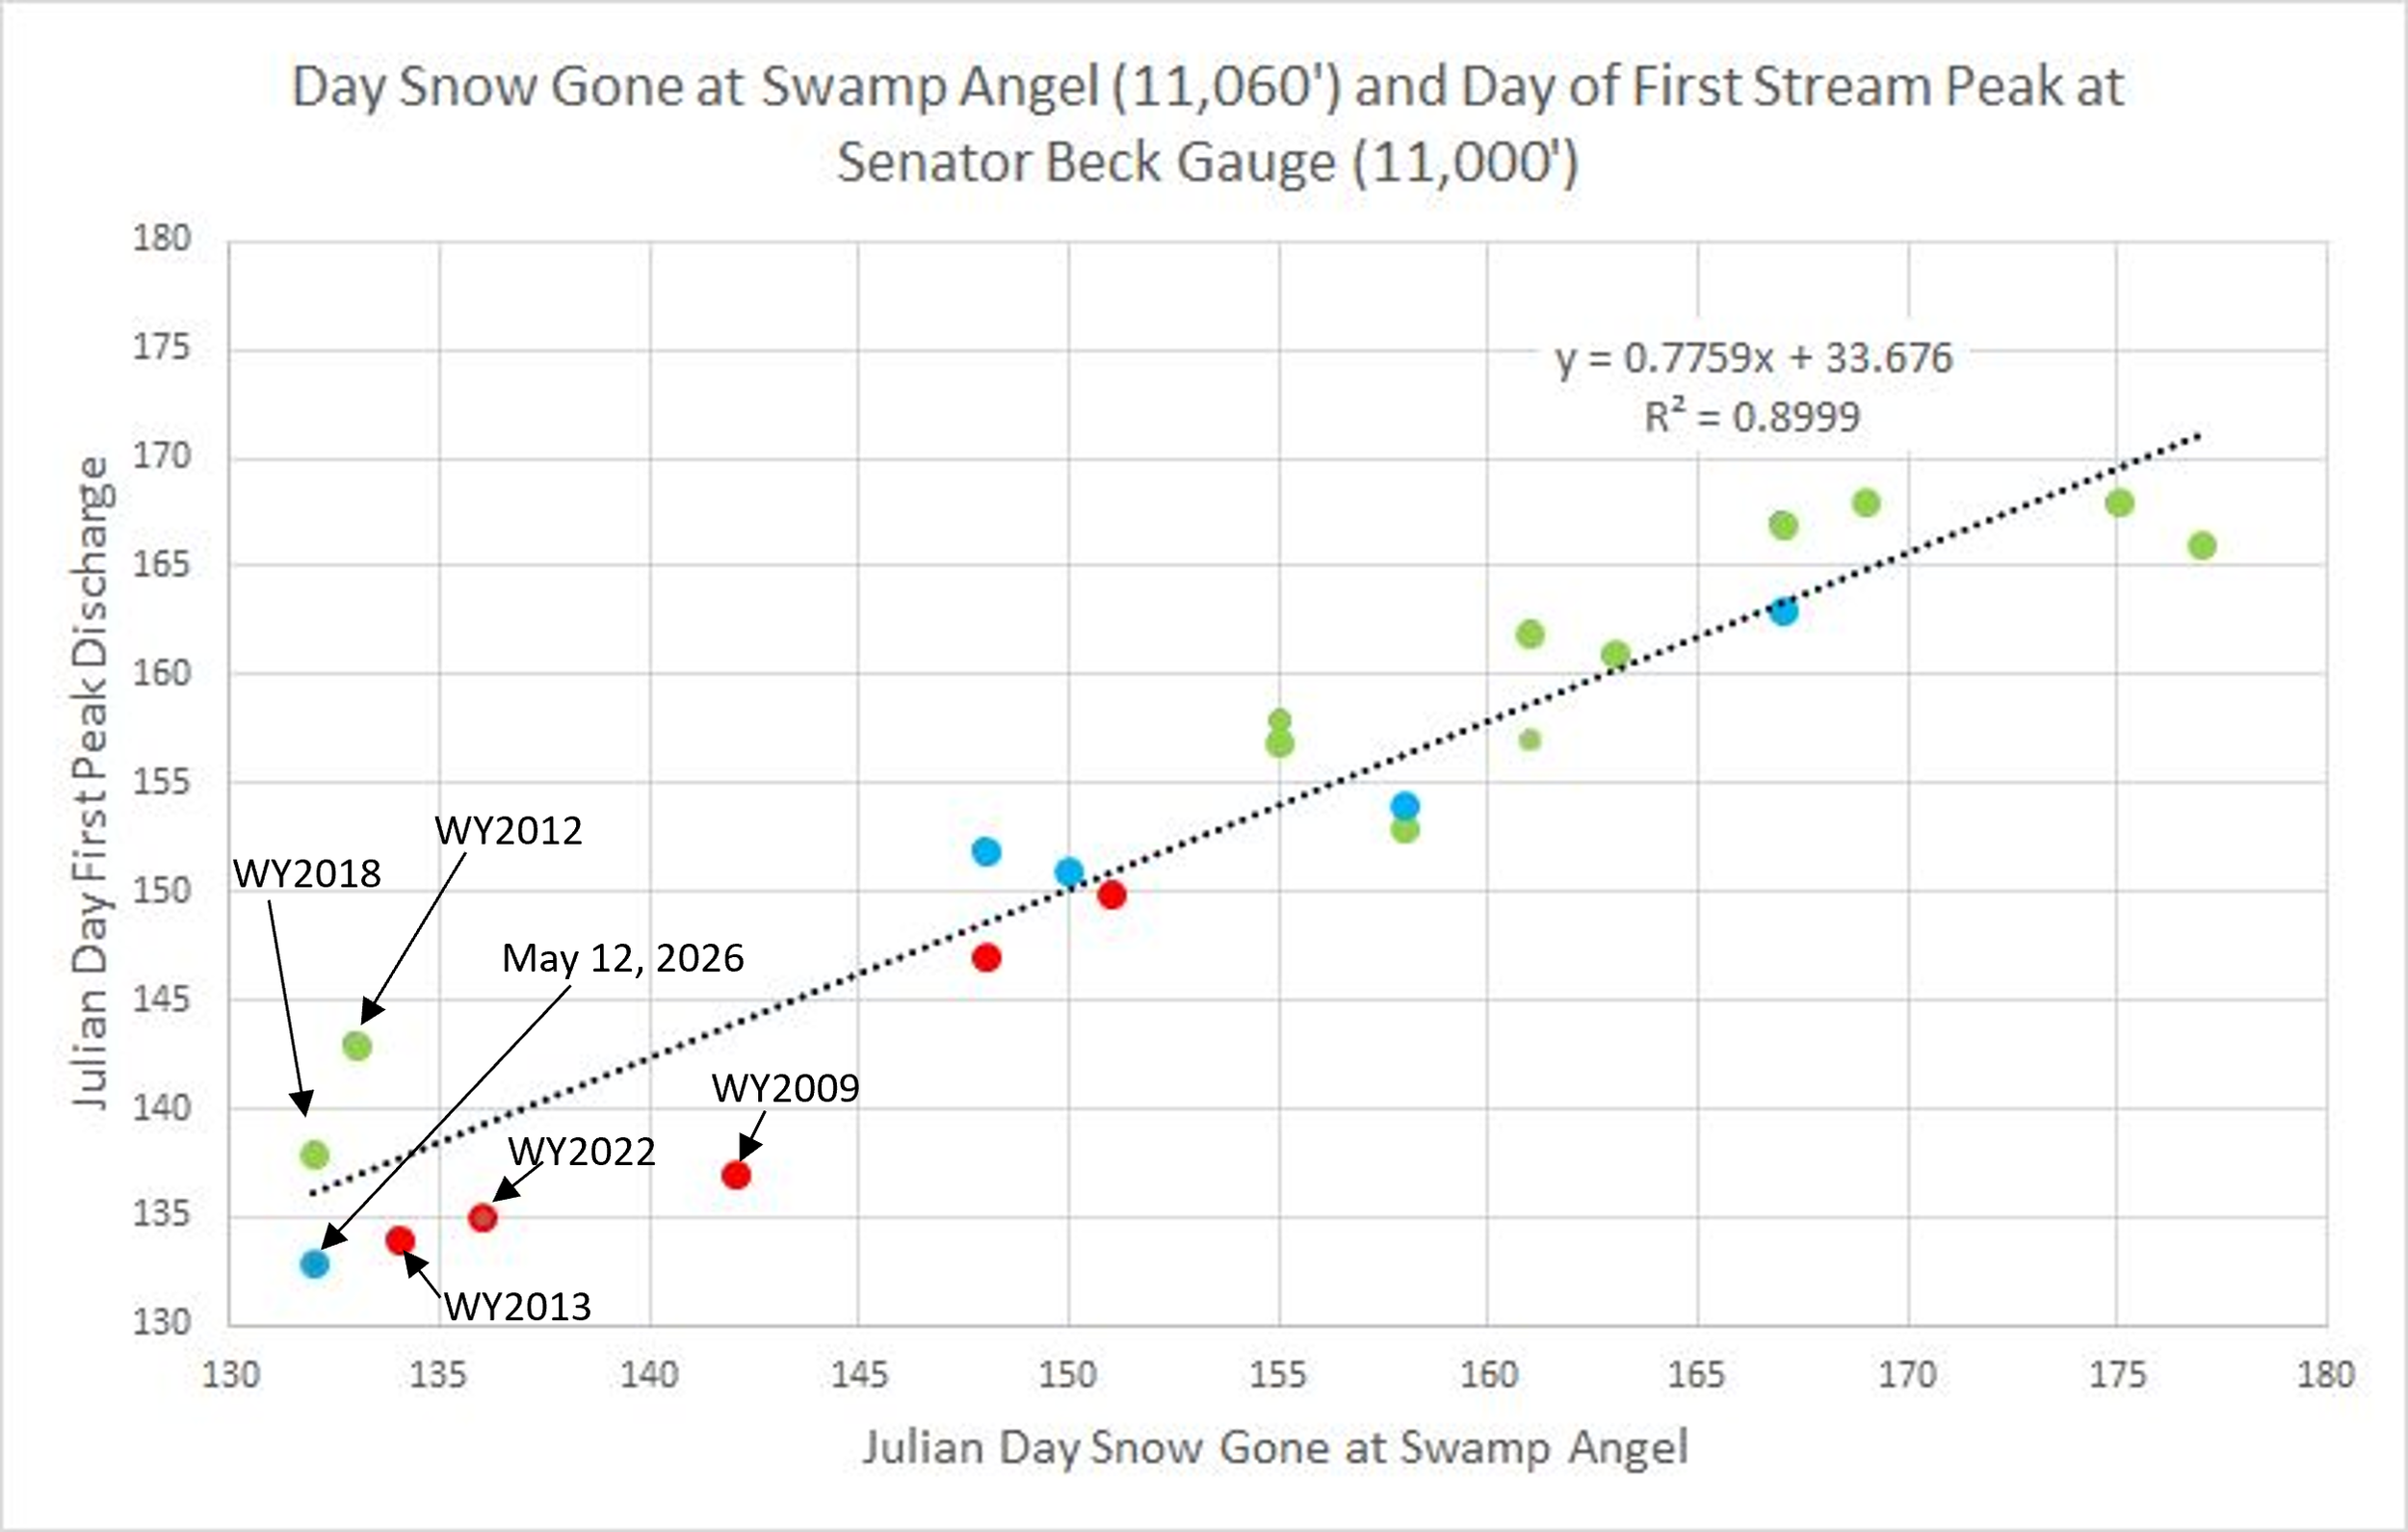
Above: Correlation of snow-all-gone (SAG) at Swamp Angel Study Plot (11,060’) and the first peak discharge at the adjacent stream gauge. All the severe dust years identified in red show SAG and peak discharge before June 1 (day 152). Low dust years are shown in blue and average in green. The two years in green at lower left make sense as this was 2012 and 2018, two notorious low snow years (and dust severity was “upper-end-of average” for 2018). This year was the earliest melt-out in our record and what makes it even more troubling is dust was of low severity. Snow-all-gone and the first streamflow peak was within a day of each other. Check out the recently published research article on this subject matter here: Twin-Peaks Streamflow Timing - Can We Use Forest and Alpine Snow Melt-Out Response to Estimate?
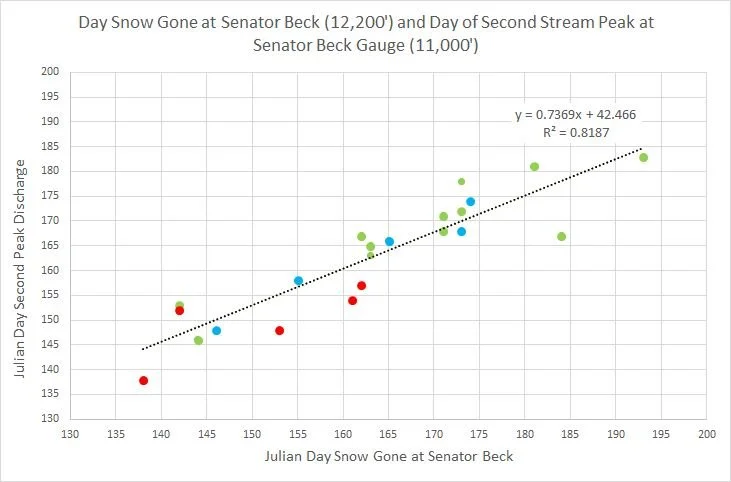
Below: Similar to Swamp Angel, Senator Beck Study Plot (12,200’) melted out very early for it being such a light dust-on-snow year. The blue dot in the lower left corner is WY2026.
Above: Cumulative discharge at our Senator Beck streamgauge was record low this spring. Most of this summer the streams have been dry in our basin. At our stream gauge water enters the stream a couple hundred feet above the gauge, fed by subsurface flow at the Swamp Angel wetland and/or groundwater surfacing.
Below: Likewise, stream gauges around the state set new record lows for cumulative streamflow or were in the bottom 20th percentile at best.
Looking Ahead
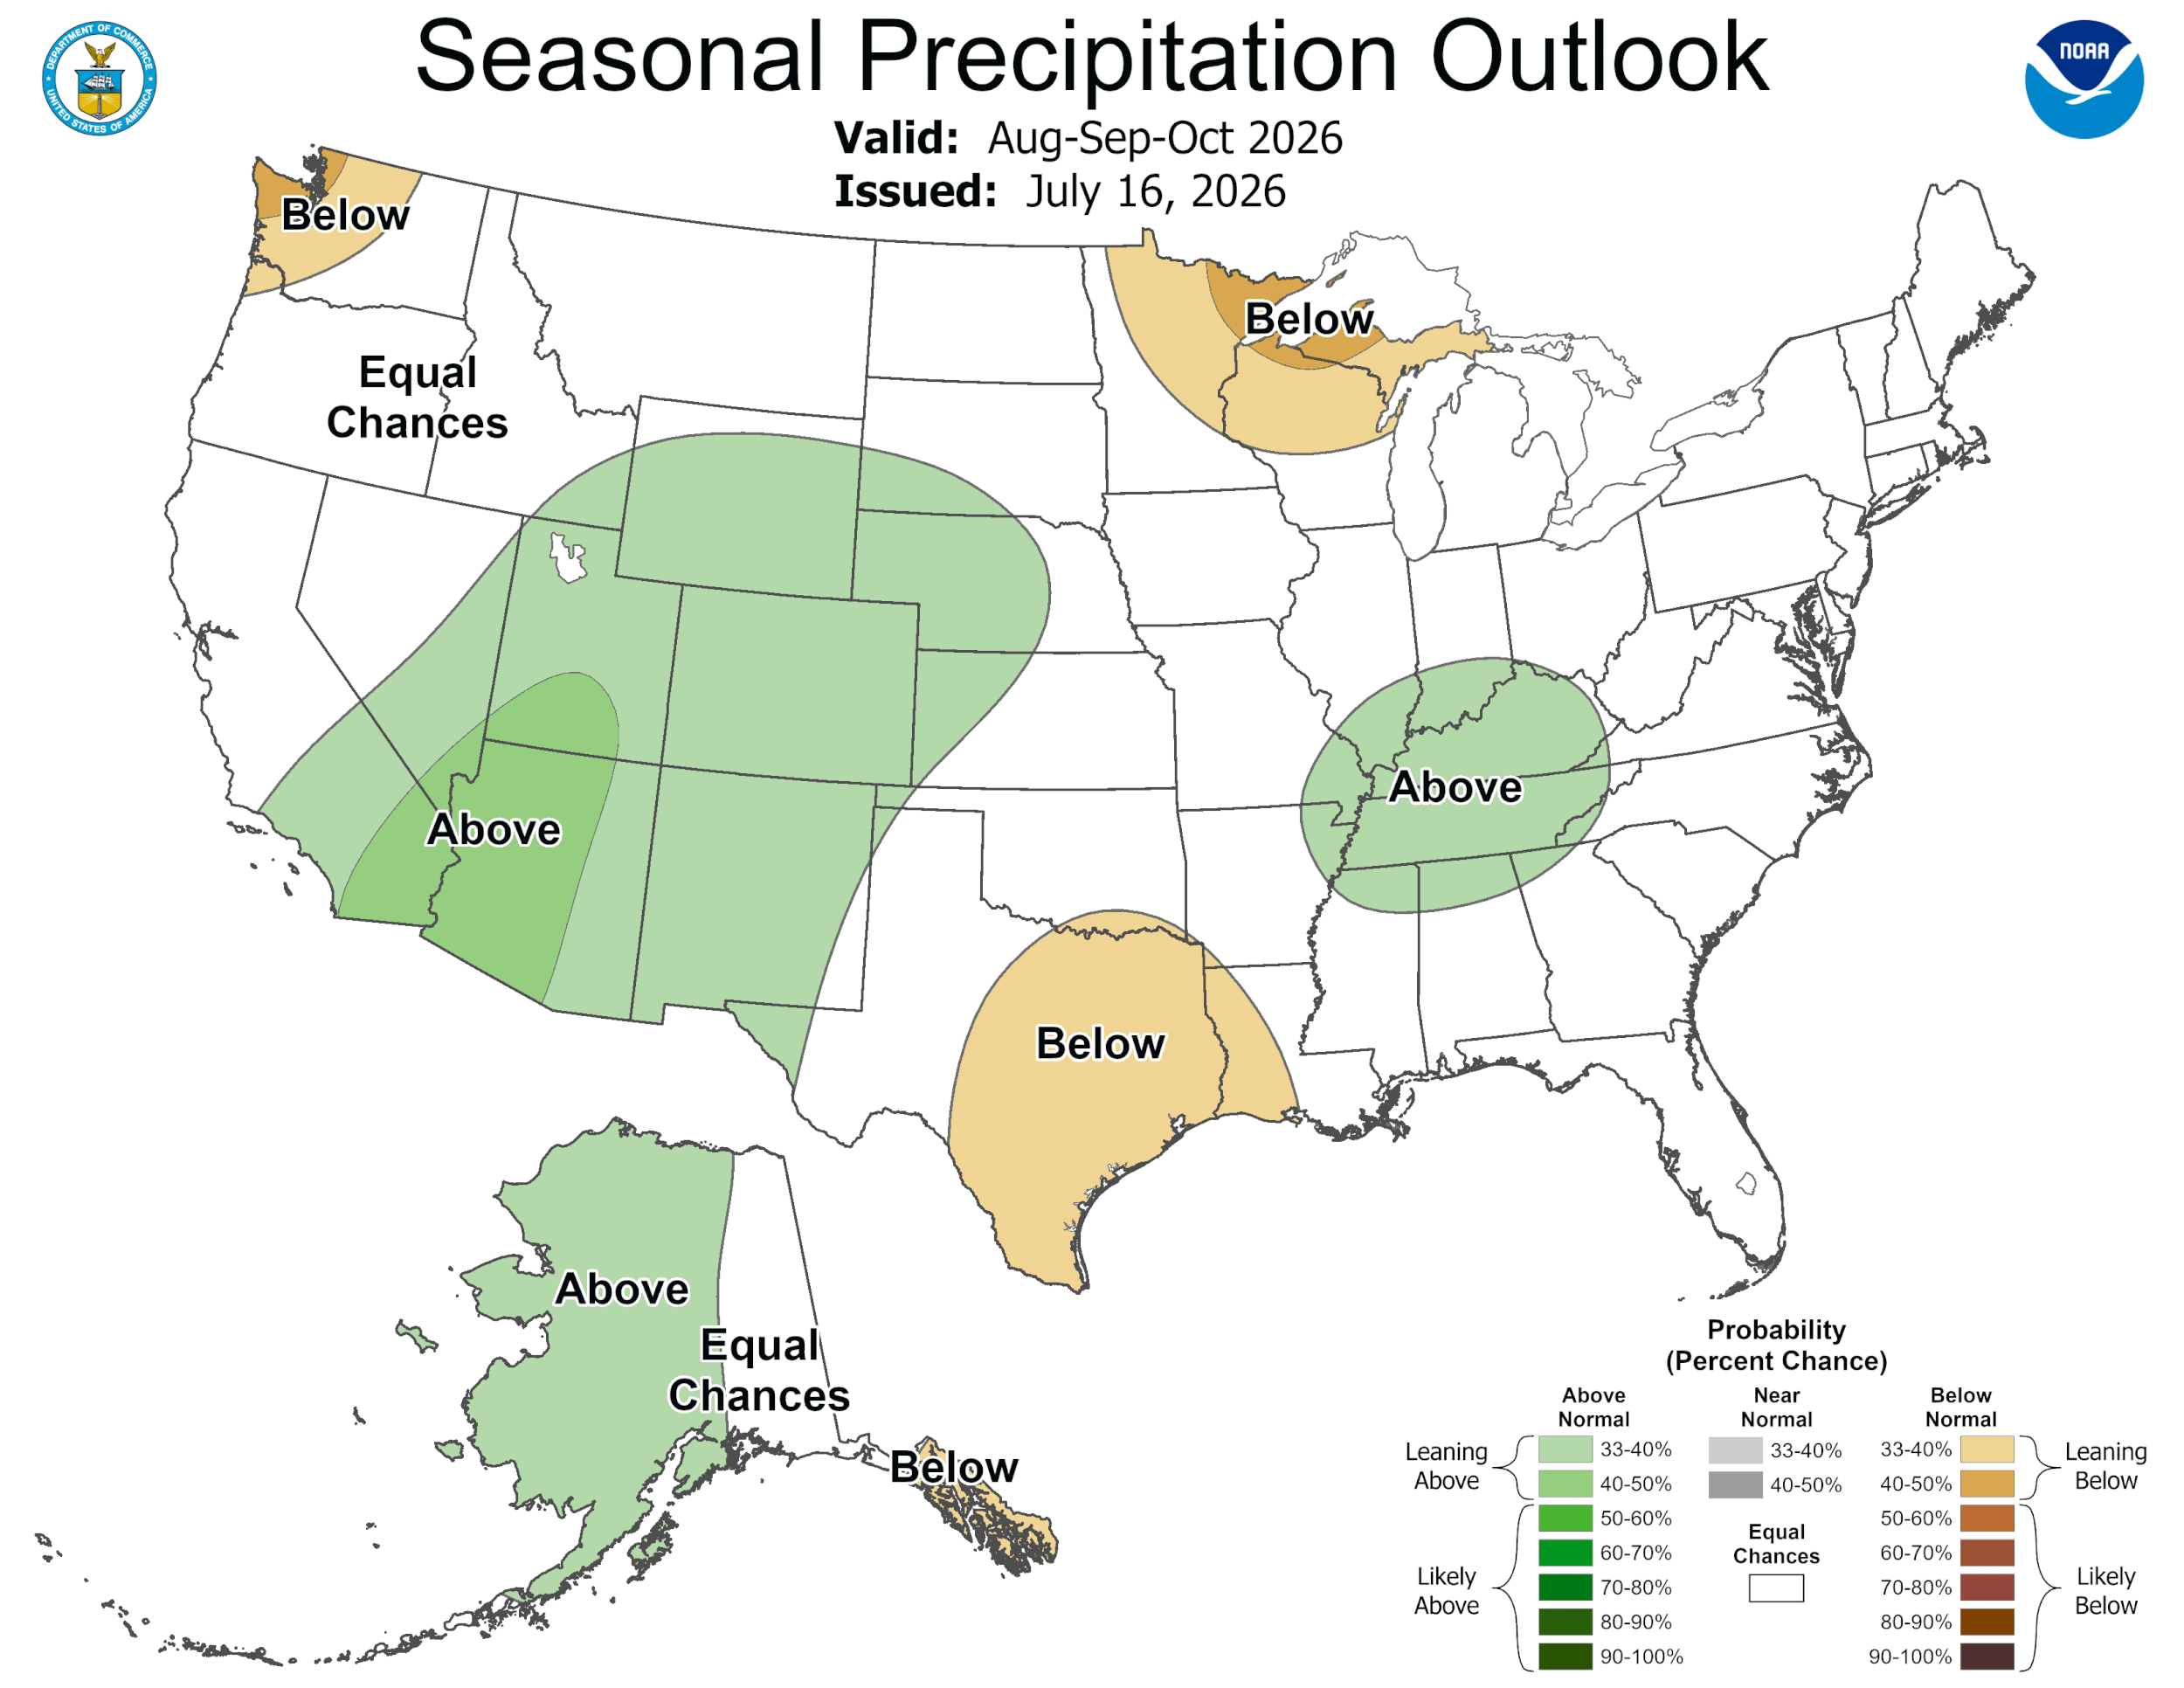
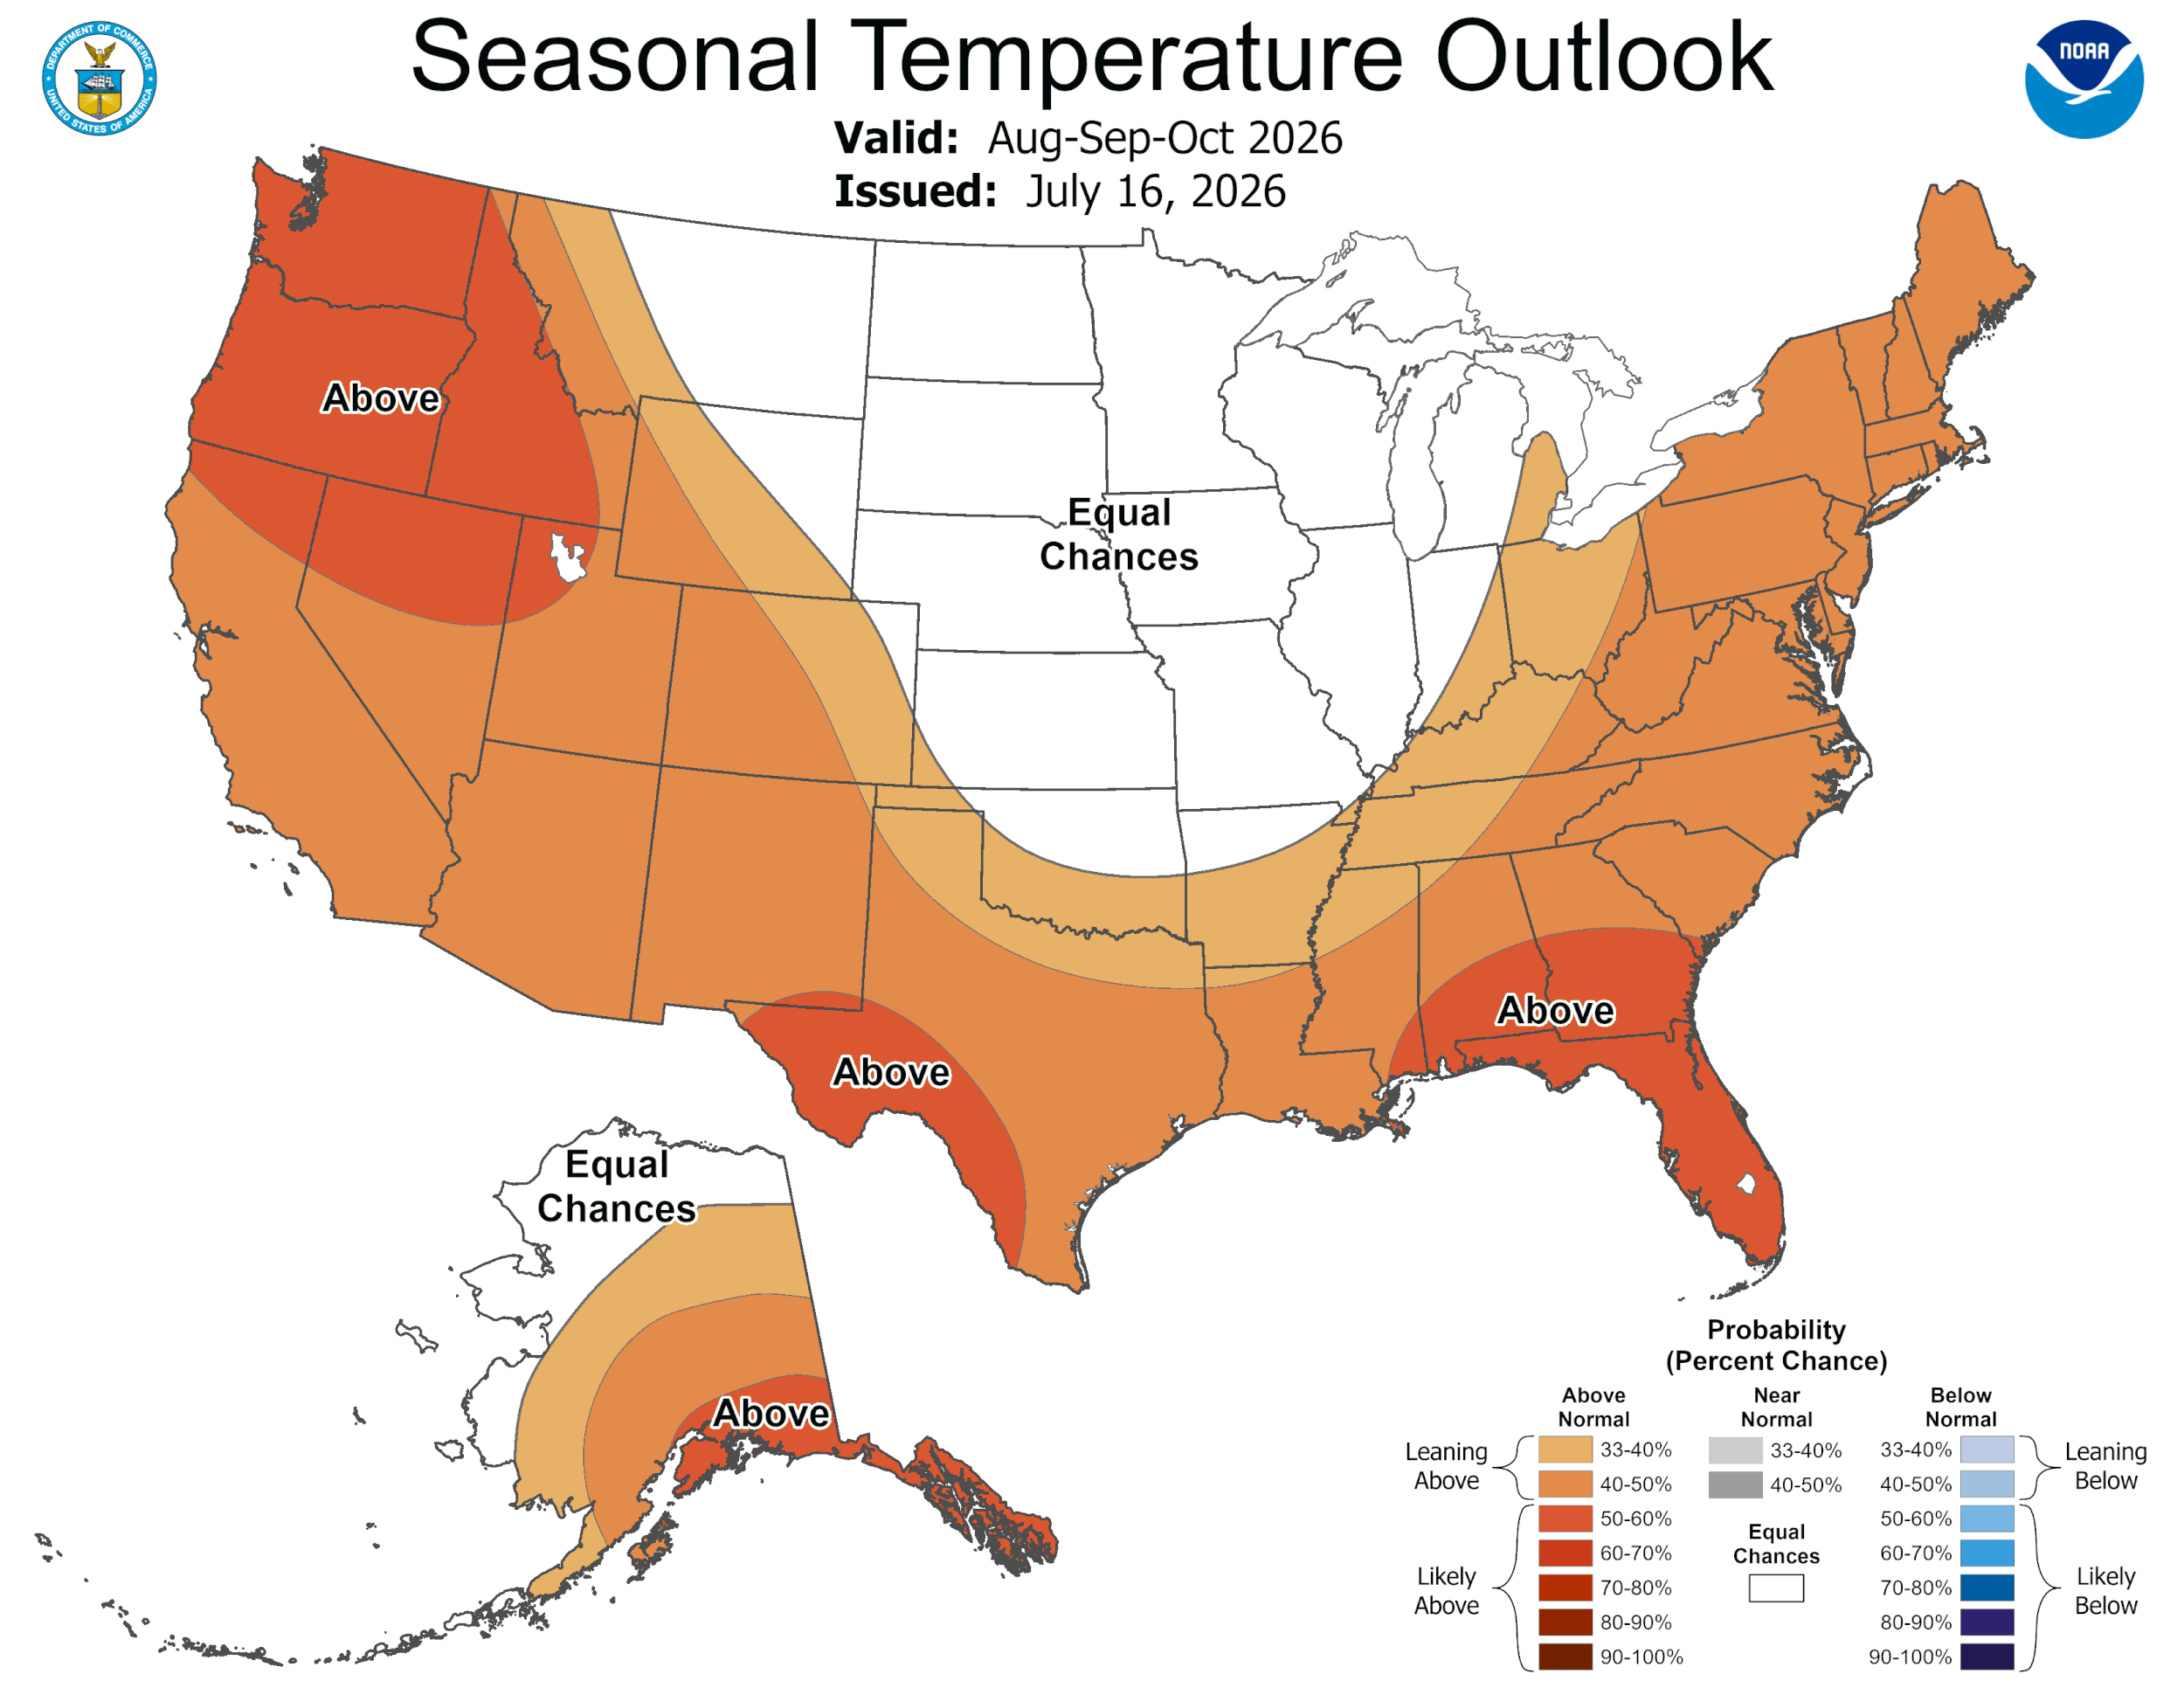
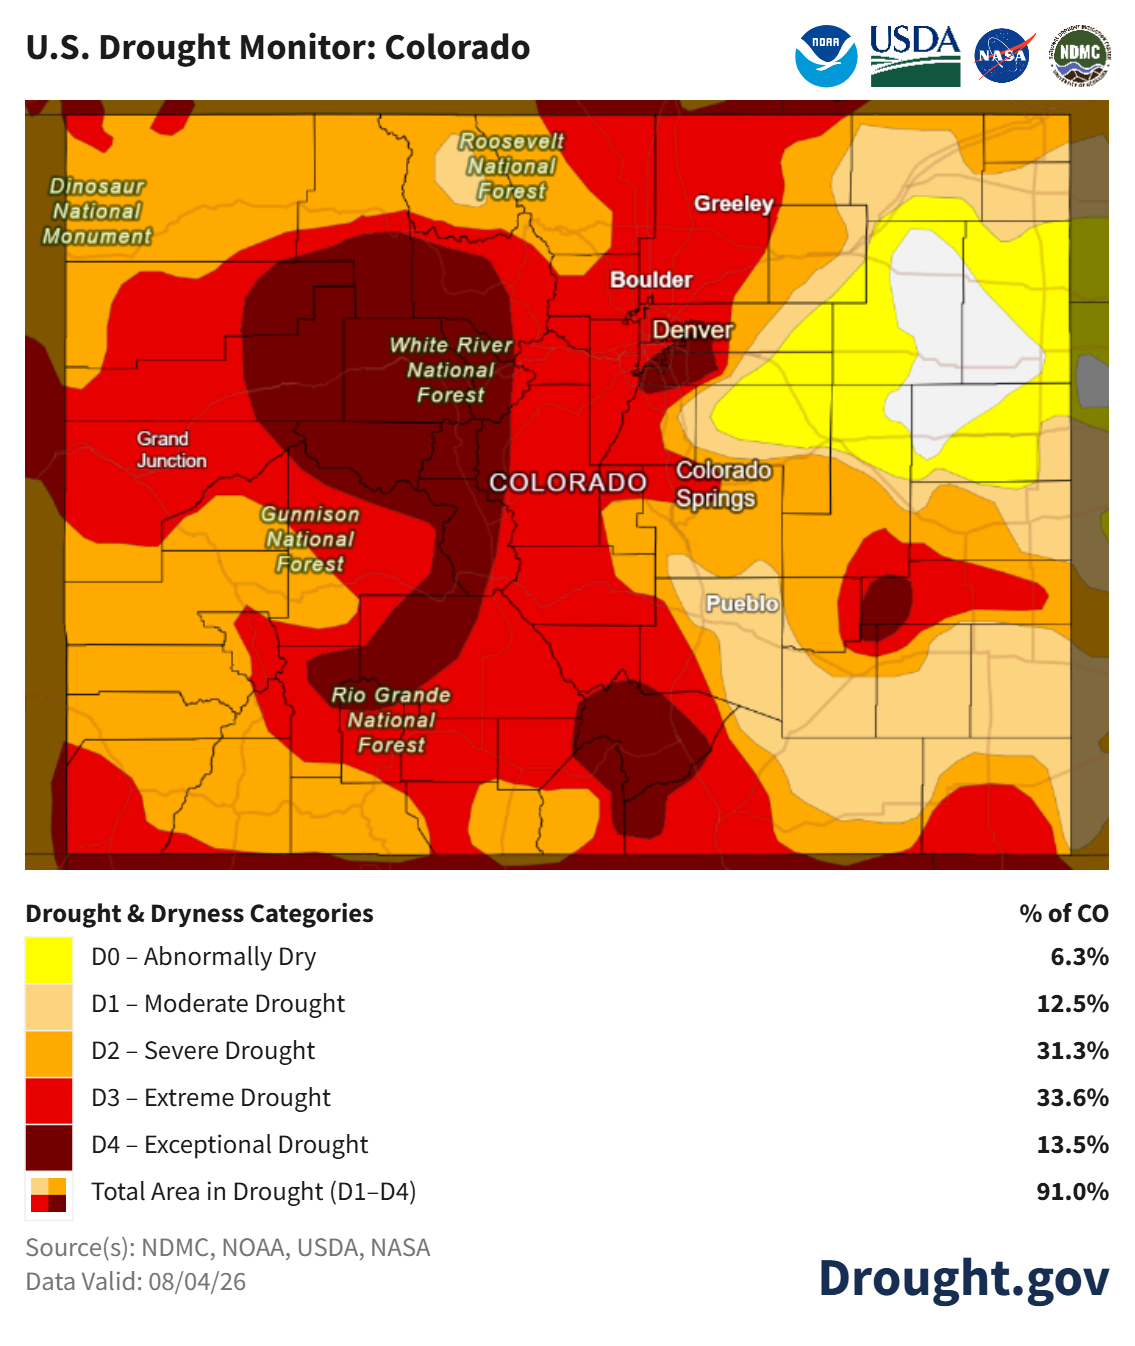
In mid-July, much of Colorado was experiencing extreme drought conditions. A series of major fires were sparked towards the end of June, and conditions were primed for the spread of these fires. In southern and southwestern Colorado, we had our eyes on the Aspen Acres, Gold Mountain, and Ferris fires.
To great relief, a big area of high pressure settled in over to the southeast of the state of Colorado, and the dew point temps in Arizona rose: these things indicate the official arrival of the summer monsoon. The monsoon storms brought challenges to firefighting, as they usually included increased lightning activity, flash flood danger, and high winds without the promise of significant wetting. The southwest flow has brought significant if choosy rain to southwestern Colorado. We were grateful for the change, though a dry pattern settled in again late July and early August. In southwestern Colorado, the monsoon is usually over by August, but there’s a chance it lingers until October (Colorado Climate Center, https://www.weather.gov/gjt/monsoon).
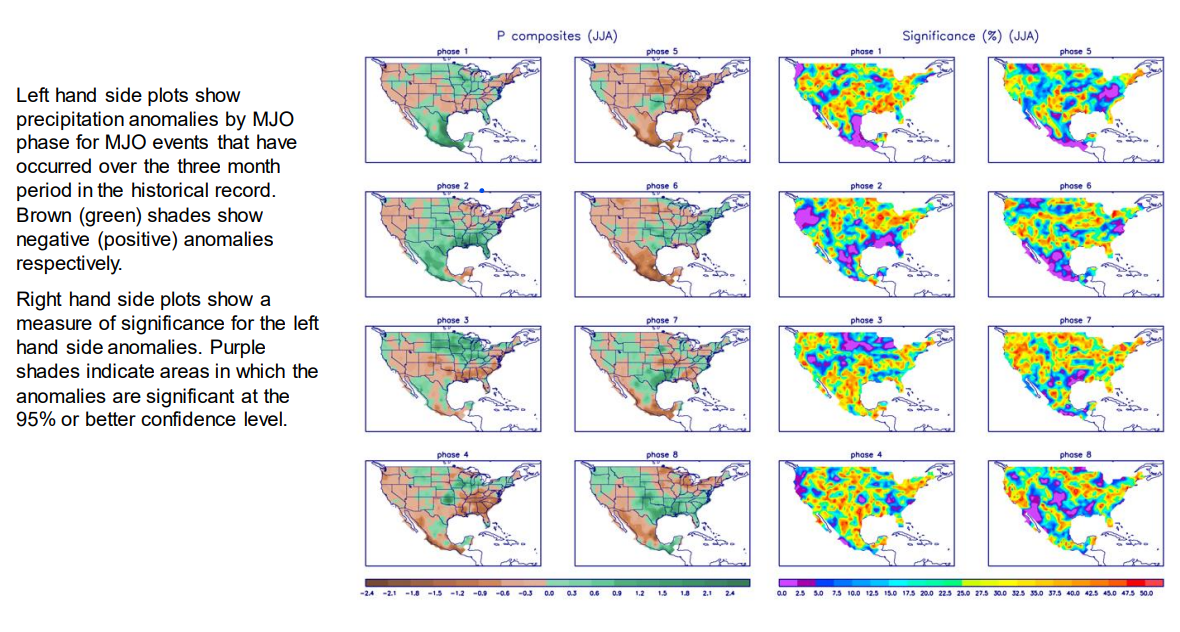
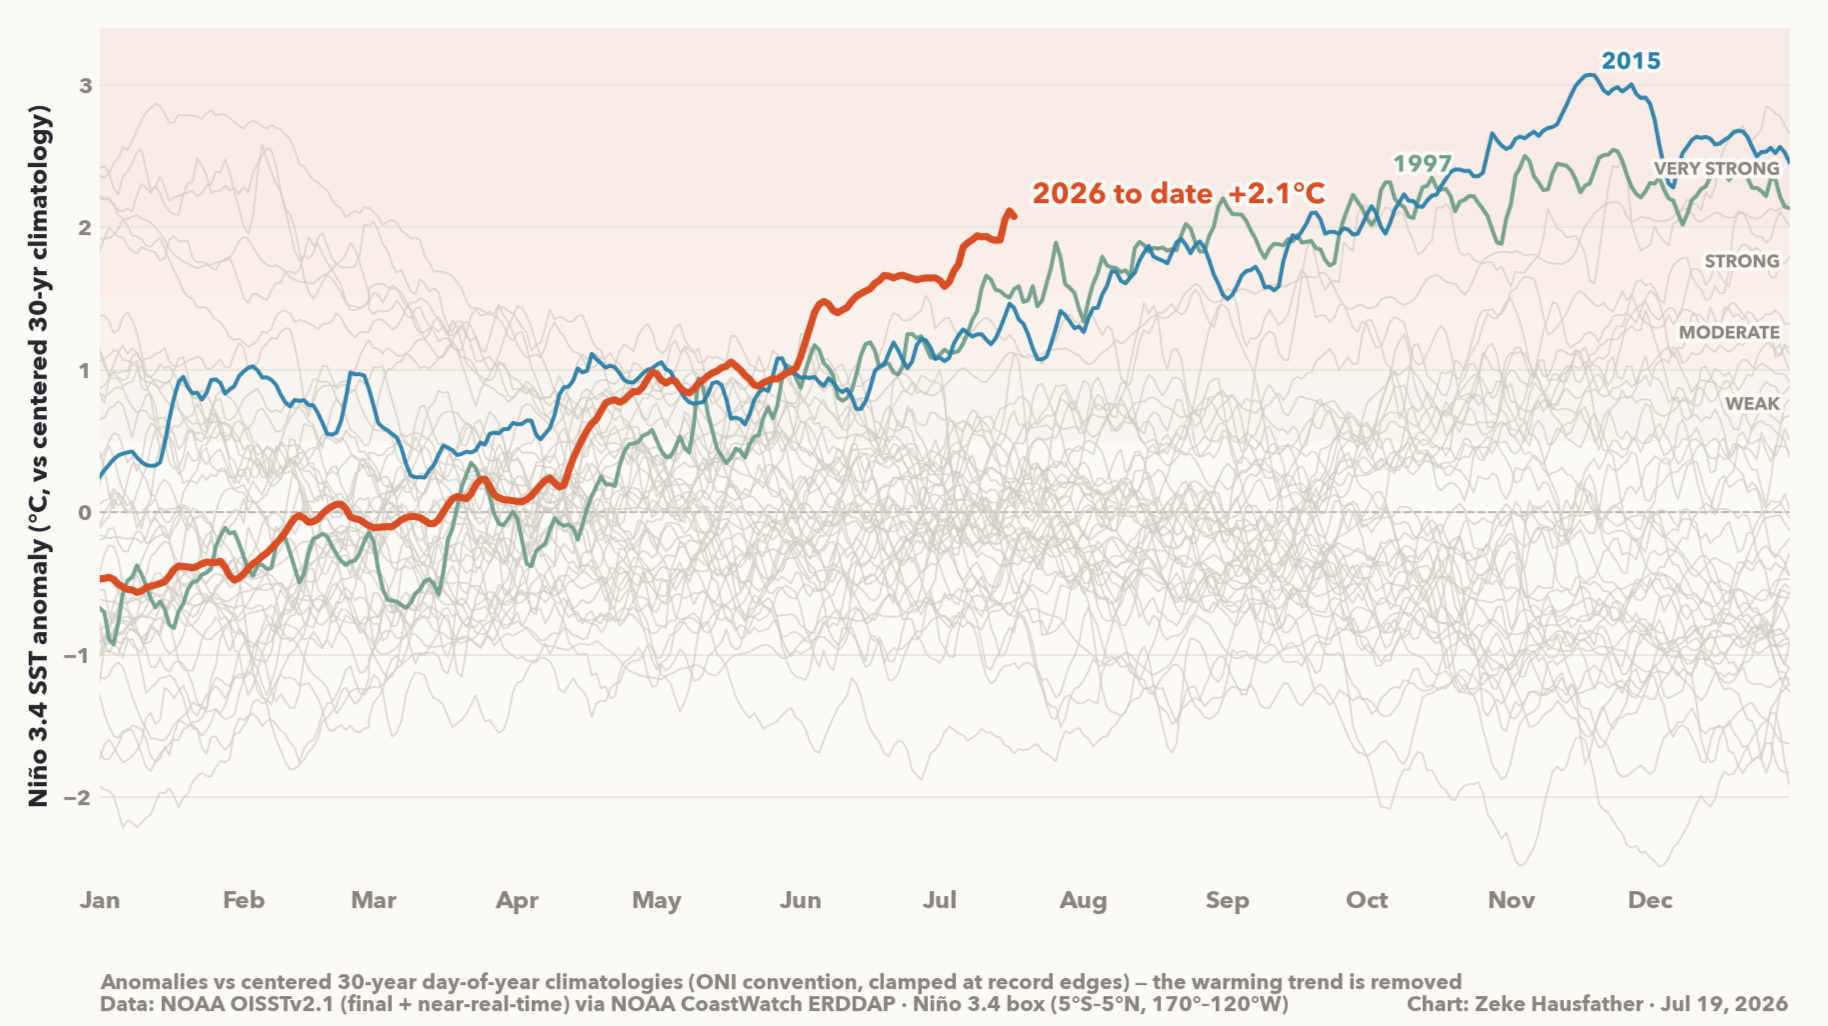
In more climate teleconnection news, El Niño conditions are strengthening, with large areas in the Pacific Ocean with above average sea surface temperature. There’s 81% chance of a very strong (super!) El Niño during October-December and a 97% chance that El Niño conditions will continue through early spring 2027 (CPC). Currently, the Madden-Julian Oscillation (MJO) is moving into Phase 8 (as of July 20th), constructively impacting El Niño conditions, making precipitation chances more favorable as well (see plot below).
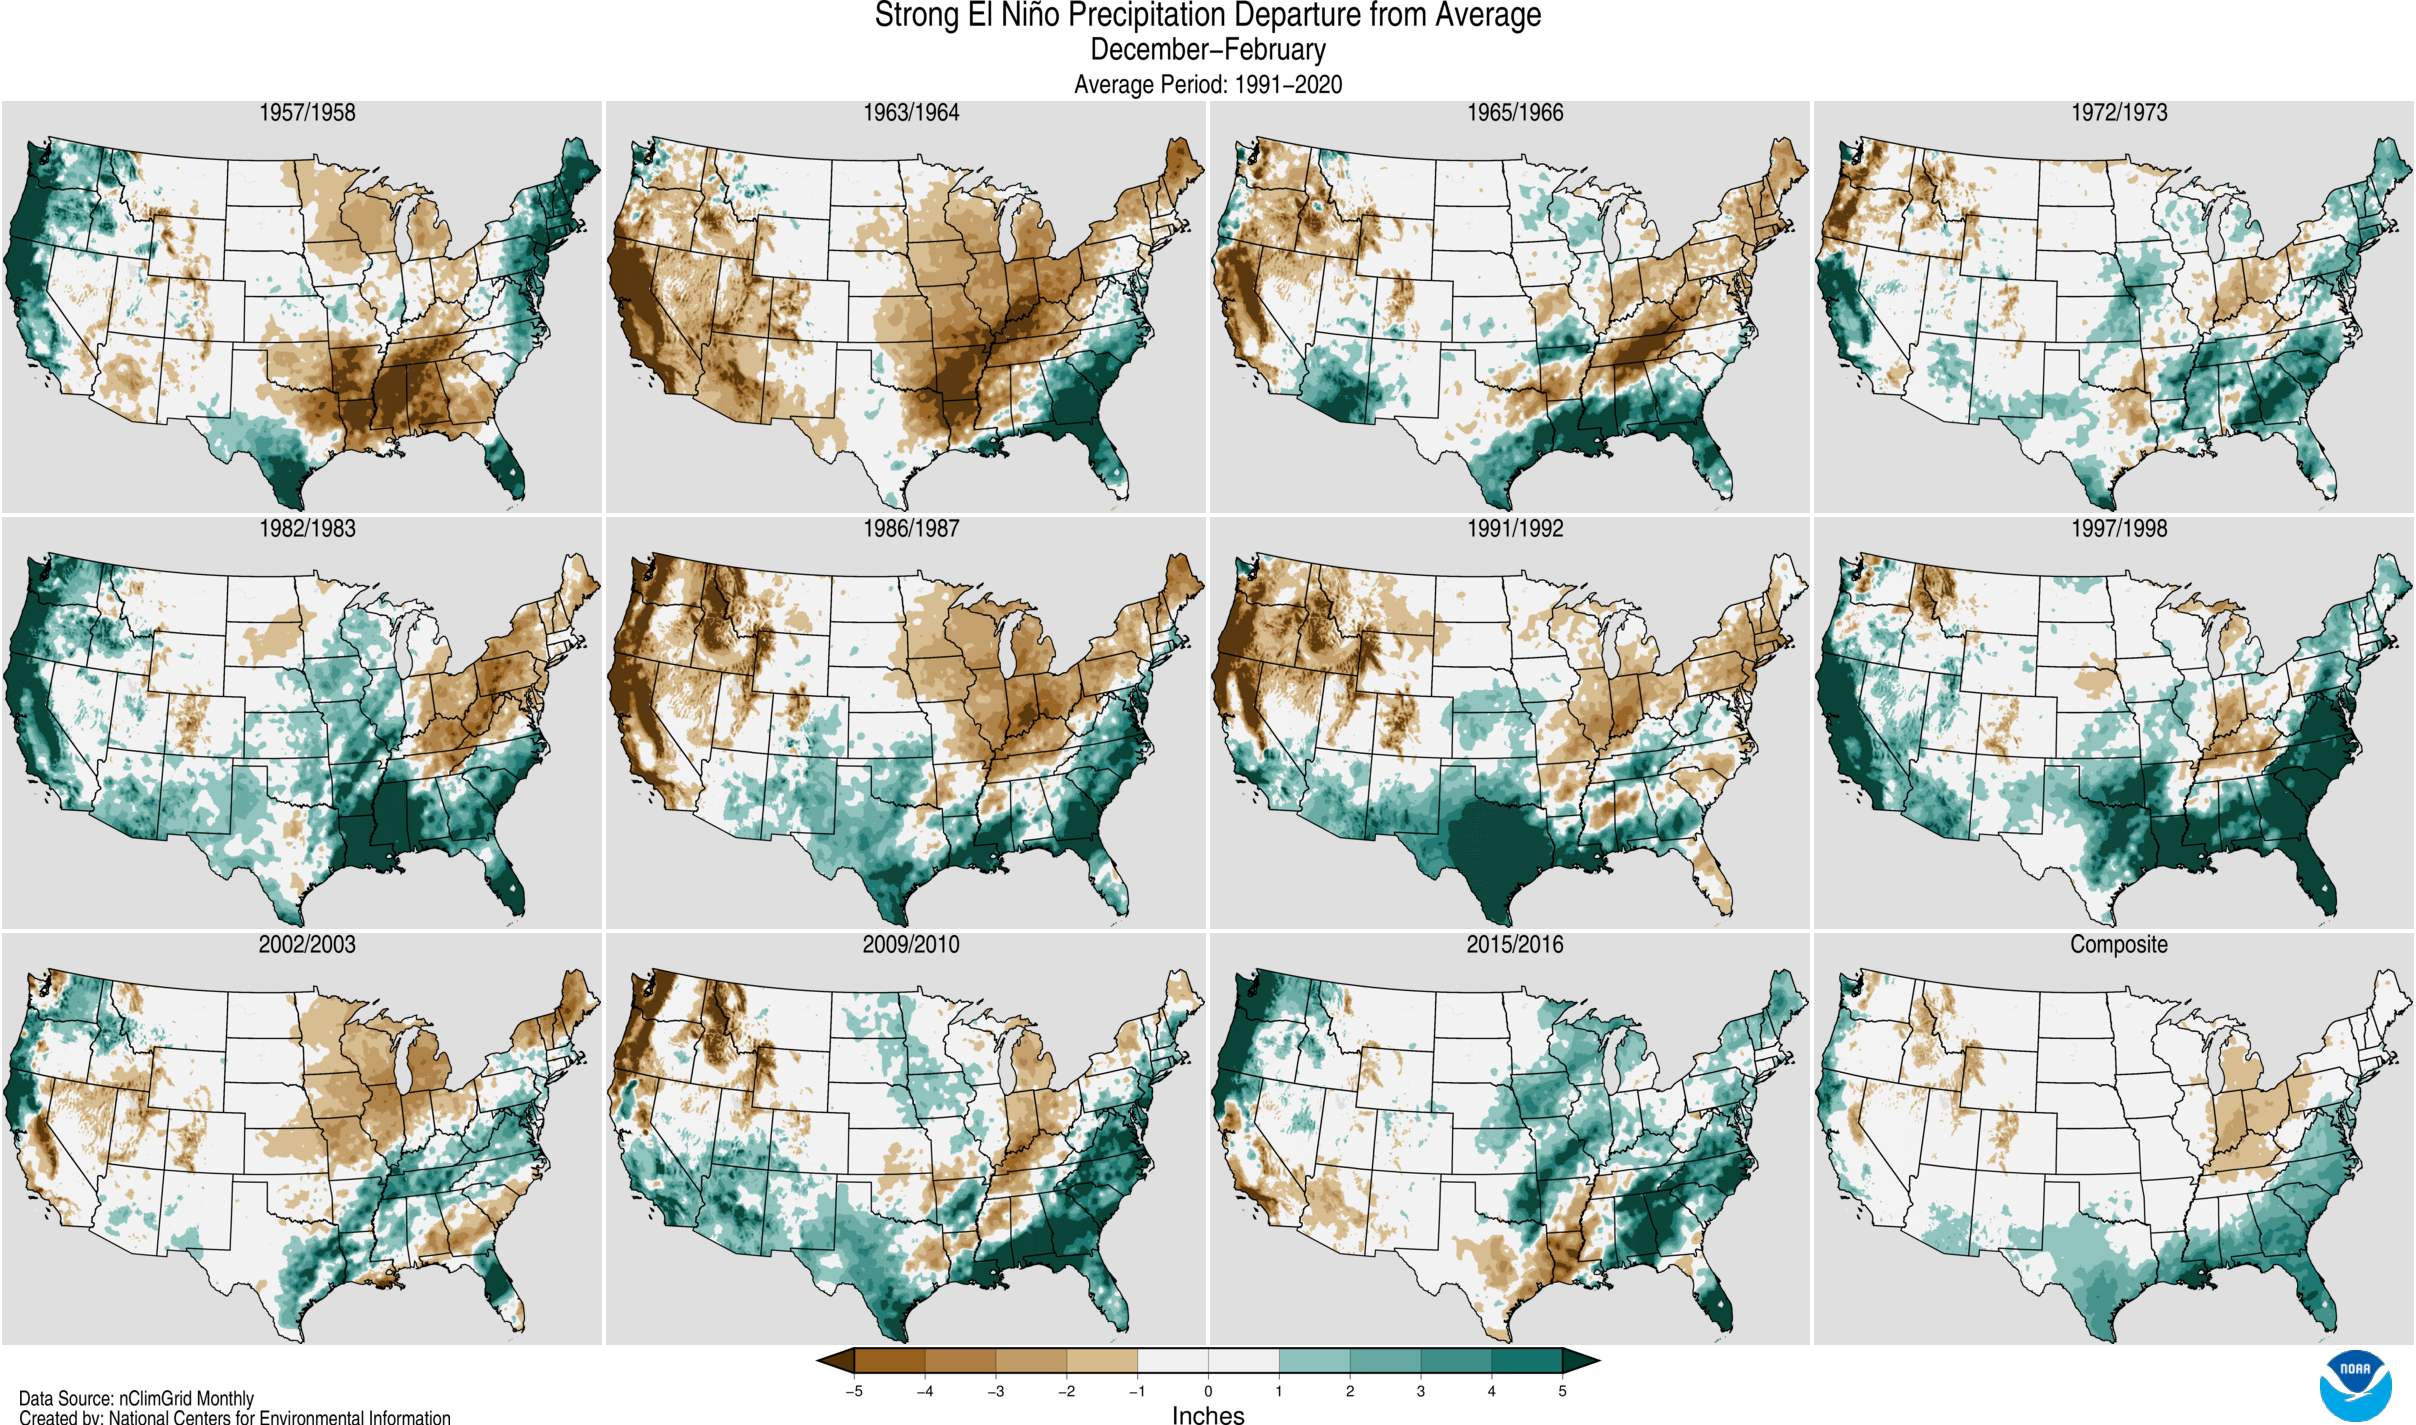
There seems to be some hope that this super El Niño bails us out of our water worries. However, correlations between snowfall and El Niño are tricky. It appears to boost the odds for southwestern Colorado high snowfall events in the spring (and early winter?), in general due to a more favorable flow of moisture and warmer temperatures, but it is in no way a guarantee. Warmer winter temperatures can also be problematic, as we saw this previous year. High snowfall odds seem to be even more of a coin flip for the rest of Colorado. We love to hope though.
Any water surplus we may stash away at the end of a historic snow year is likely only buying a couple-year buffer for our main reservoirs. In a recent paper by CU titled “Update: Colorado River Basin Storage Continues Slide”, Lake Powell, which catches the Upper Colorado river basin outflows, historical data shows that since 1999 when the reservoir was full, periodic wet years haven’t made gains against a combination of very dry years, average years and over-allocation (Castle et al., 2026). The ‘wet’ scenario in which next year’s runoff matches WY 2023 results in an amount of water that would yield just two more years of the current imbalanced supply and demand operations before returning to rock-bottom.
The overall trend of the climate is hotter and drier, and water demands are increasing, even if we book a good rebound year. In the meantime, we will continue to hope for cooler, rainy weather as summer continues.

Below: El Nino SST’s already record-high, plot from the Climate Brink.
Below: Historical “strong” El Nino precipitation averages from December to February (NOAA).
Below: The Madden-Julian Oscillation (MJO) also has a strong influence in summer precipitation patterns in the southwestern US (CPC).