SUMMARY
It was a bit worrisome going into winter of 2019/20 under such dry conditions. After a dry summer and fall due to poor monsoons Colorado started out the water year in desperate conditions that continued through most of October. Latter October started a turnaround where most of Colorado saw a start in accumulation by the end of the month, but a dry period the first half of November halted further accumulation. This eventually gave way to a wet latter half of November so that the snowpack accumulation amounts began looking normal for all major basins by end of that month. December kept us floating along right near median snowpack or slightly higher, a great comeback after a dry and apprehensive start to the water year. January was drier with the Southern Basins tapering off the steady rise that kept them slightly above median levels while Northern Basins kept benefiting from storm tracks out of the northwest that kept their snowpack building nicely. February was cooler than normal for most of the state, which is getting to be a rare occurrence, and the first week of February saw an atmospheric river event out of the northwest that was very productive for the Northern and Front Range Mountains who saw a steep increase in accumulation that resulted in well above median conditions by the end of February. However, the San Miguel/Dolores/Animas/San Juan and Upper Rio Grande Basins continued to struggle. March came through with a solid month for Southwest Colorado and hit and miss throughout the rest of the state. There was one storm March 18-22 that delivered 24” at Wolf Creek and Uncompahgre Plateau.
Keep in mind that even though the snowpack was looking normal by April 1st there was still a precipitation deficit in the Southern Basins from the beginning of the water year that we had started to recover from but still remained pronounced the beginning of April. Early season we started receiving more precipitation at a time that it was cold enough to stick around as snow, as opposed to falling as rain in early fall and contributing to replenishing soil moisture, for example. So as, when looking at SWE plots the first part of winter the full extent of the precipitation deficit might not have been noticeable. Then there is the soil moisture deficit, due to the dry summer and autumn the soils went into winter season much below average in Southern Colorado and improving as you headed into the Northern mountains. This was the status of conditions near the time of peak SWE, a near normal snowpack, a precipitation and soil moisture deficit in Southern Colorado but improving towards the northern Yampa/White Basins.
Then April/May come along and things get ugly. Beginning of April, at the time of normal peak accumulation, all major basins were very near or above their normal peak but April unfolds hot and dry in Central and Southern Basins and cooler and slightly increased precipitation towards the Northern Basins. This wave of hot/dry did a number on the snow to where by the first of May the snowpack was 50-70% of normal conditions, after achieving a near normal peak SWE!
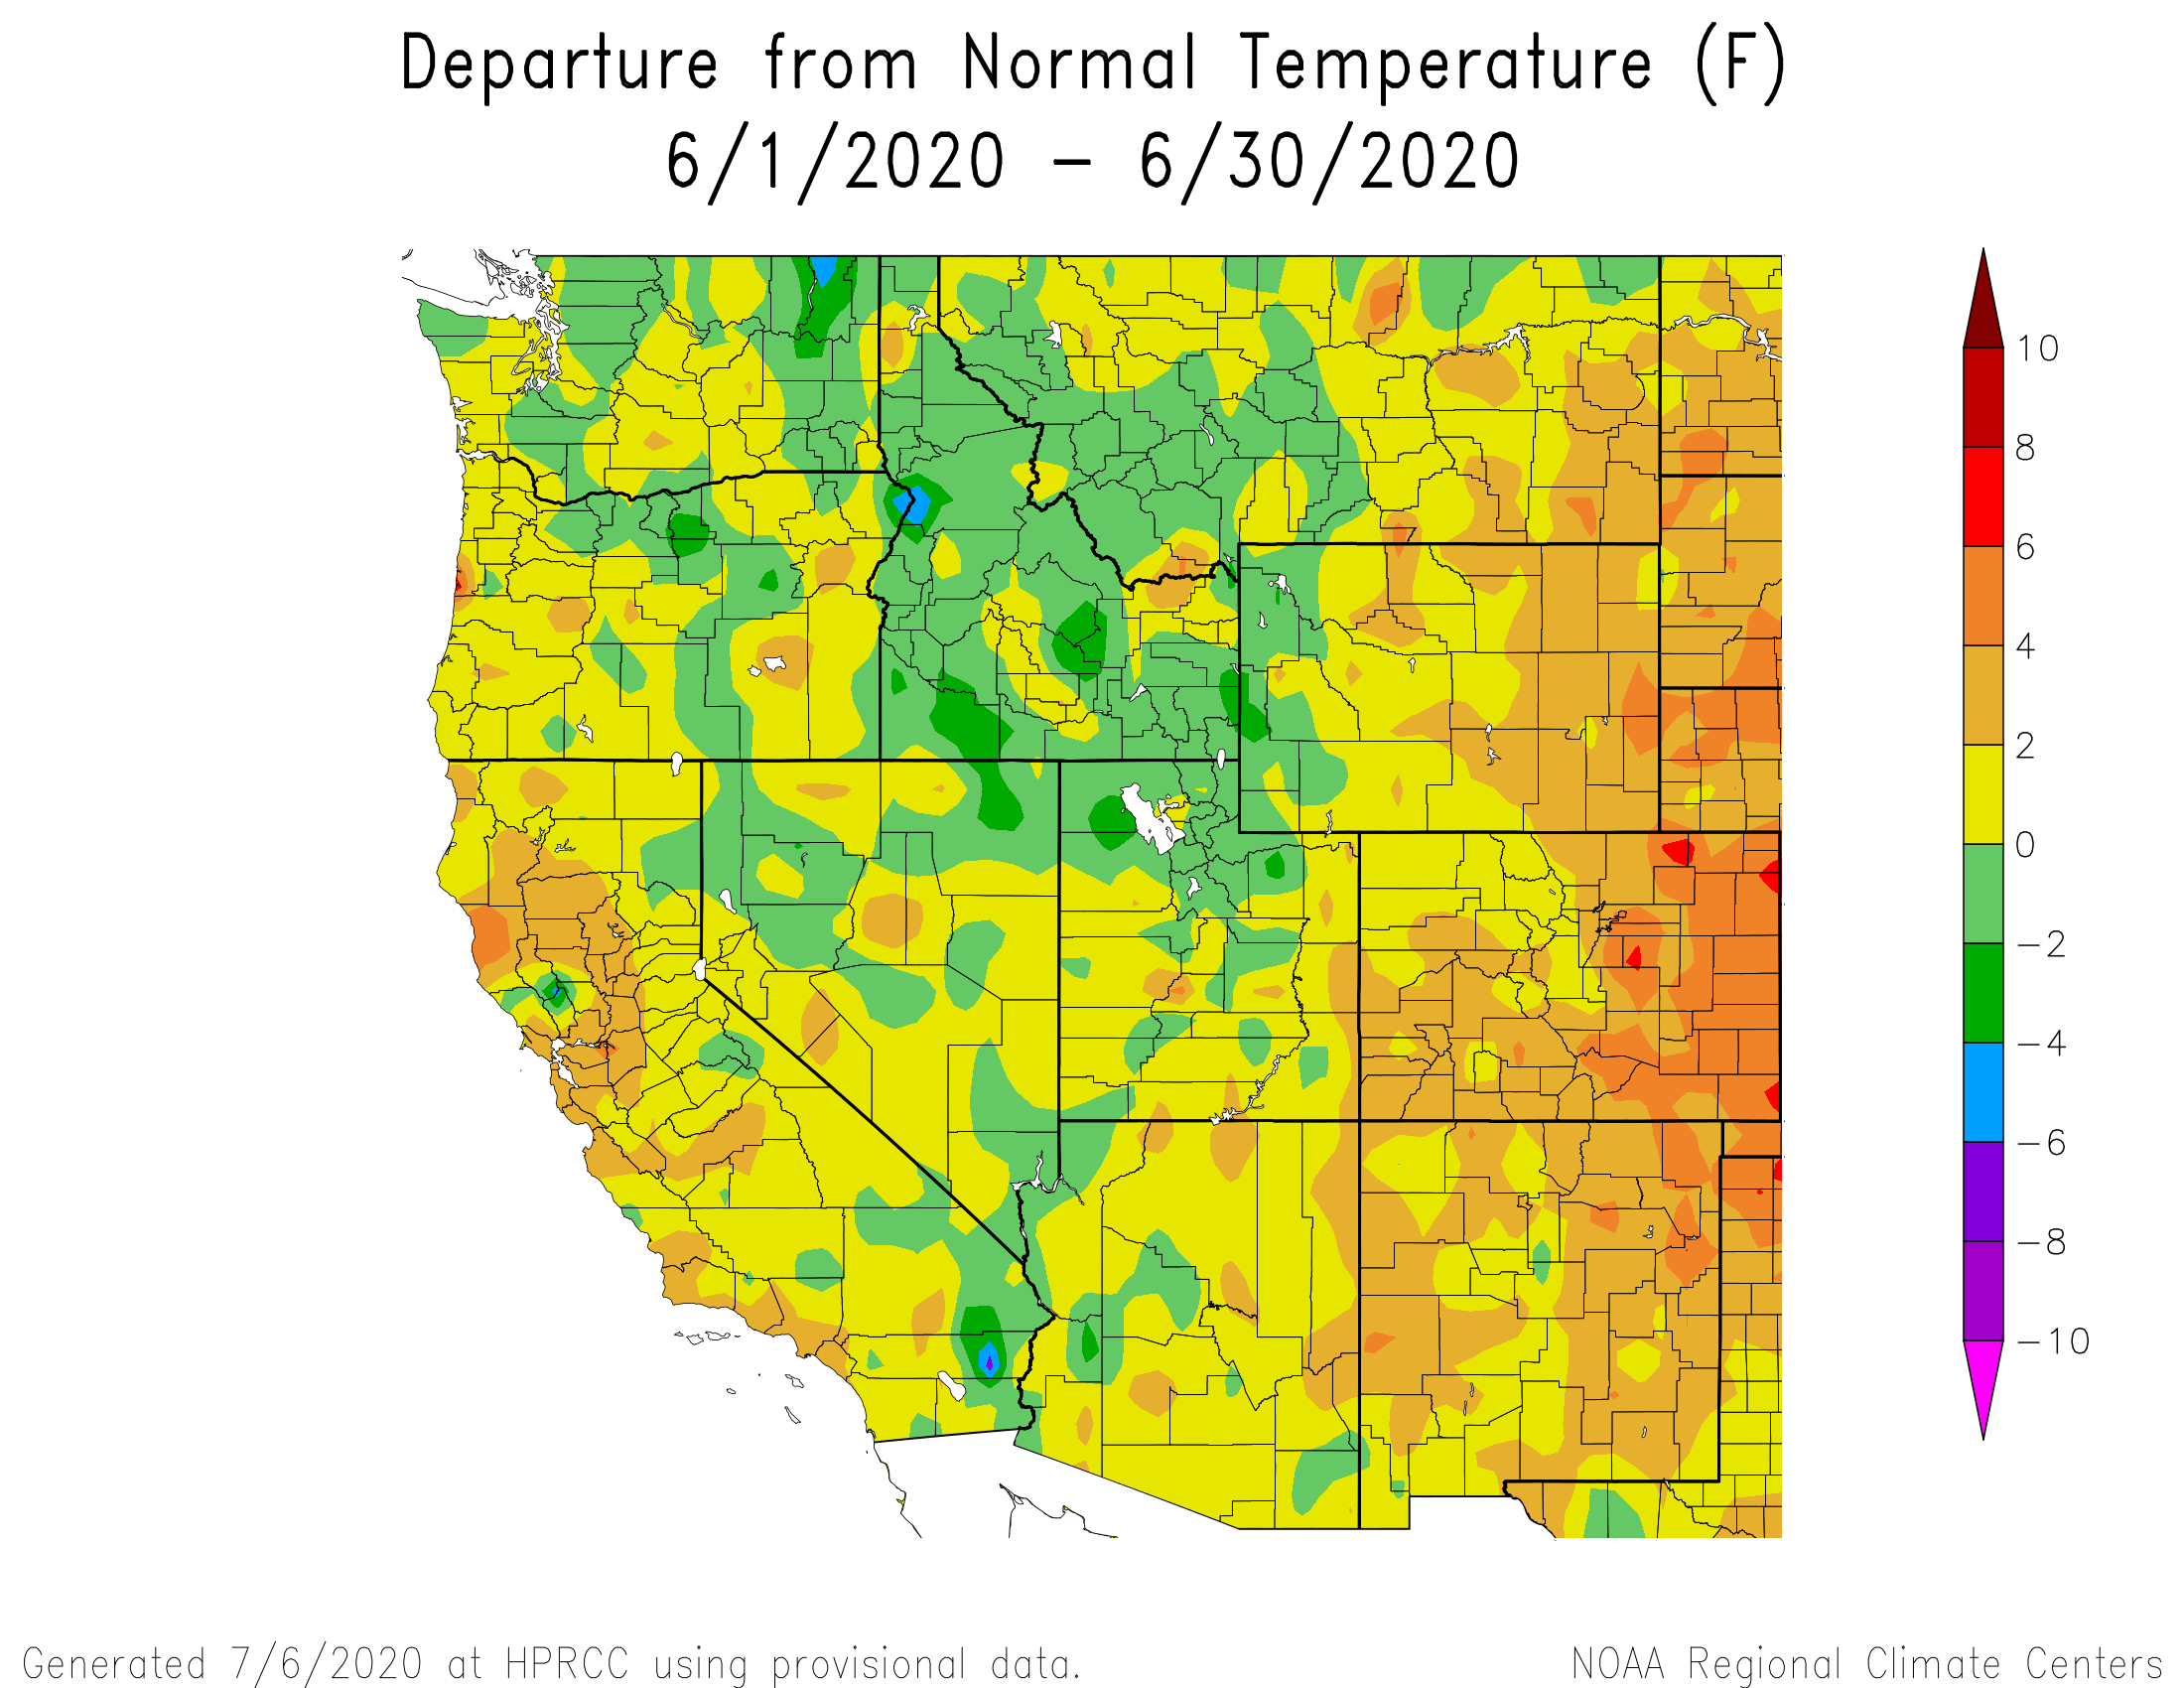
April was bad by May proved to be worse. It was hot throughout the state with temperatures in the top ten highest since 1895. At our Swamp Angel Study Plot (SASP) between April 27 and May 26 we observed one precipitation event (only 0.47” on May 11) and had not documented an official storm since April 12. With the hot temperatures, no snow storm events, minimal cloud cover, and dust-on-snow conditions, the snowpack didn’t stand a chance and melted 2-3 weeks earlier than normal in the San Miguel/Dolores/Animas/San Juan Basins and in the Upper Rio Grande an entire month early. Snow was gone at SASP (11,060’) on May 27 and gone from our Senator Beck Study Plot (12,200’) on June 3, five weeks earlier than in WY2019. The Northern Basins melted faster than normal as well but not the same degree with snow persisting longer. After the first week of May areas of Southern Colorado were back in extreme drought.
Dust-on-snow events occurred January 16/17, March 26, and April 2. The first event (D1) was very light and was initially not observable in snow profiles at SASP, however community observers reported a very light band of dust near Rico from the storm event soon after it occurred. Over time at our Senator Beck Study Basin (SBB), the primary ‘sentry site’ for the Colorado Dust-on-Snow (CODOS) program, we started to observe D1 as the snowpack consolidated. D2, occurring March 26, preceded Storm #17 with recorded gusts of 106 mph on Thursday March 26 at the CAIC Eagle weather station. With such high winds we expected some sort of dust, but nothing was obvious until a few days later we noted a very light dust layer below the snow surface. The last event on April 2 the late evening sky had a brownish tint to it and observations on April 5 indicated the presence of another light dust episode (D3) in the top 6” of the snowpack at SASP. Initially like D2, D3 was a bit diffuse and pretty light, although on April 6 the surface snow had consolidated a bit and the dust appeared more pronounced.
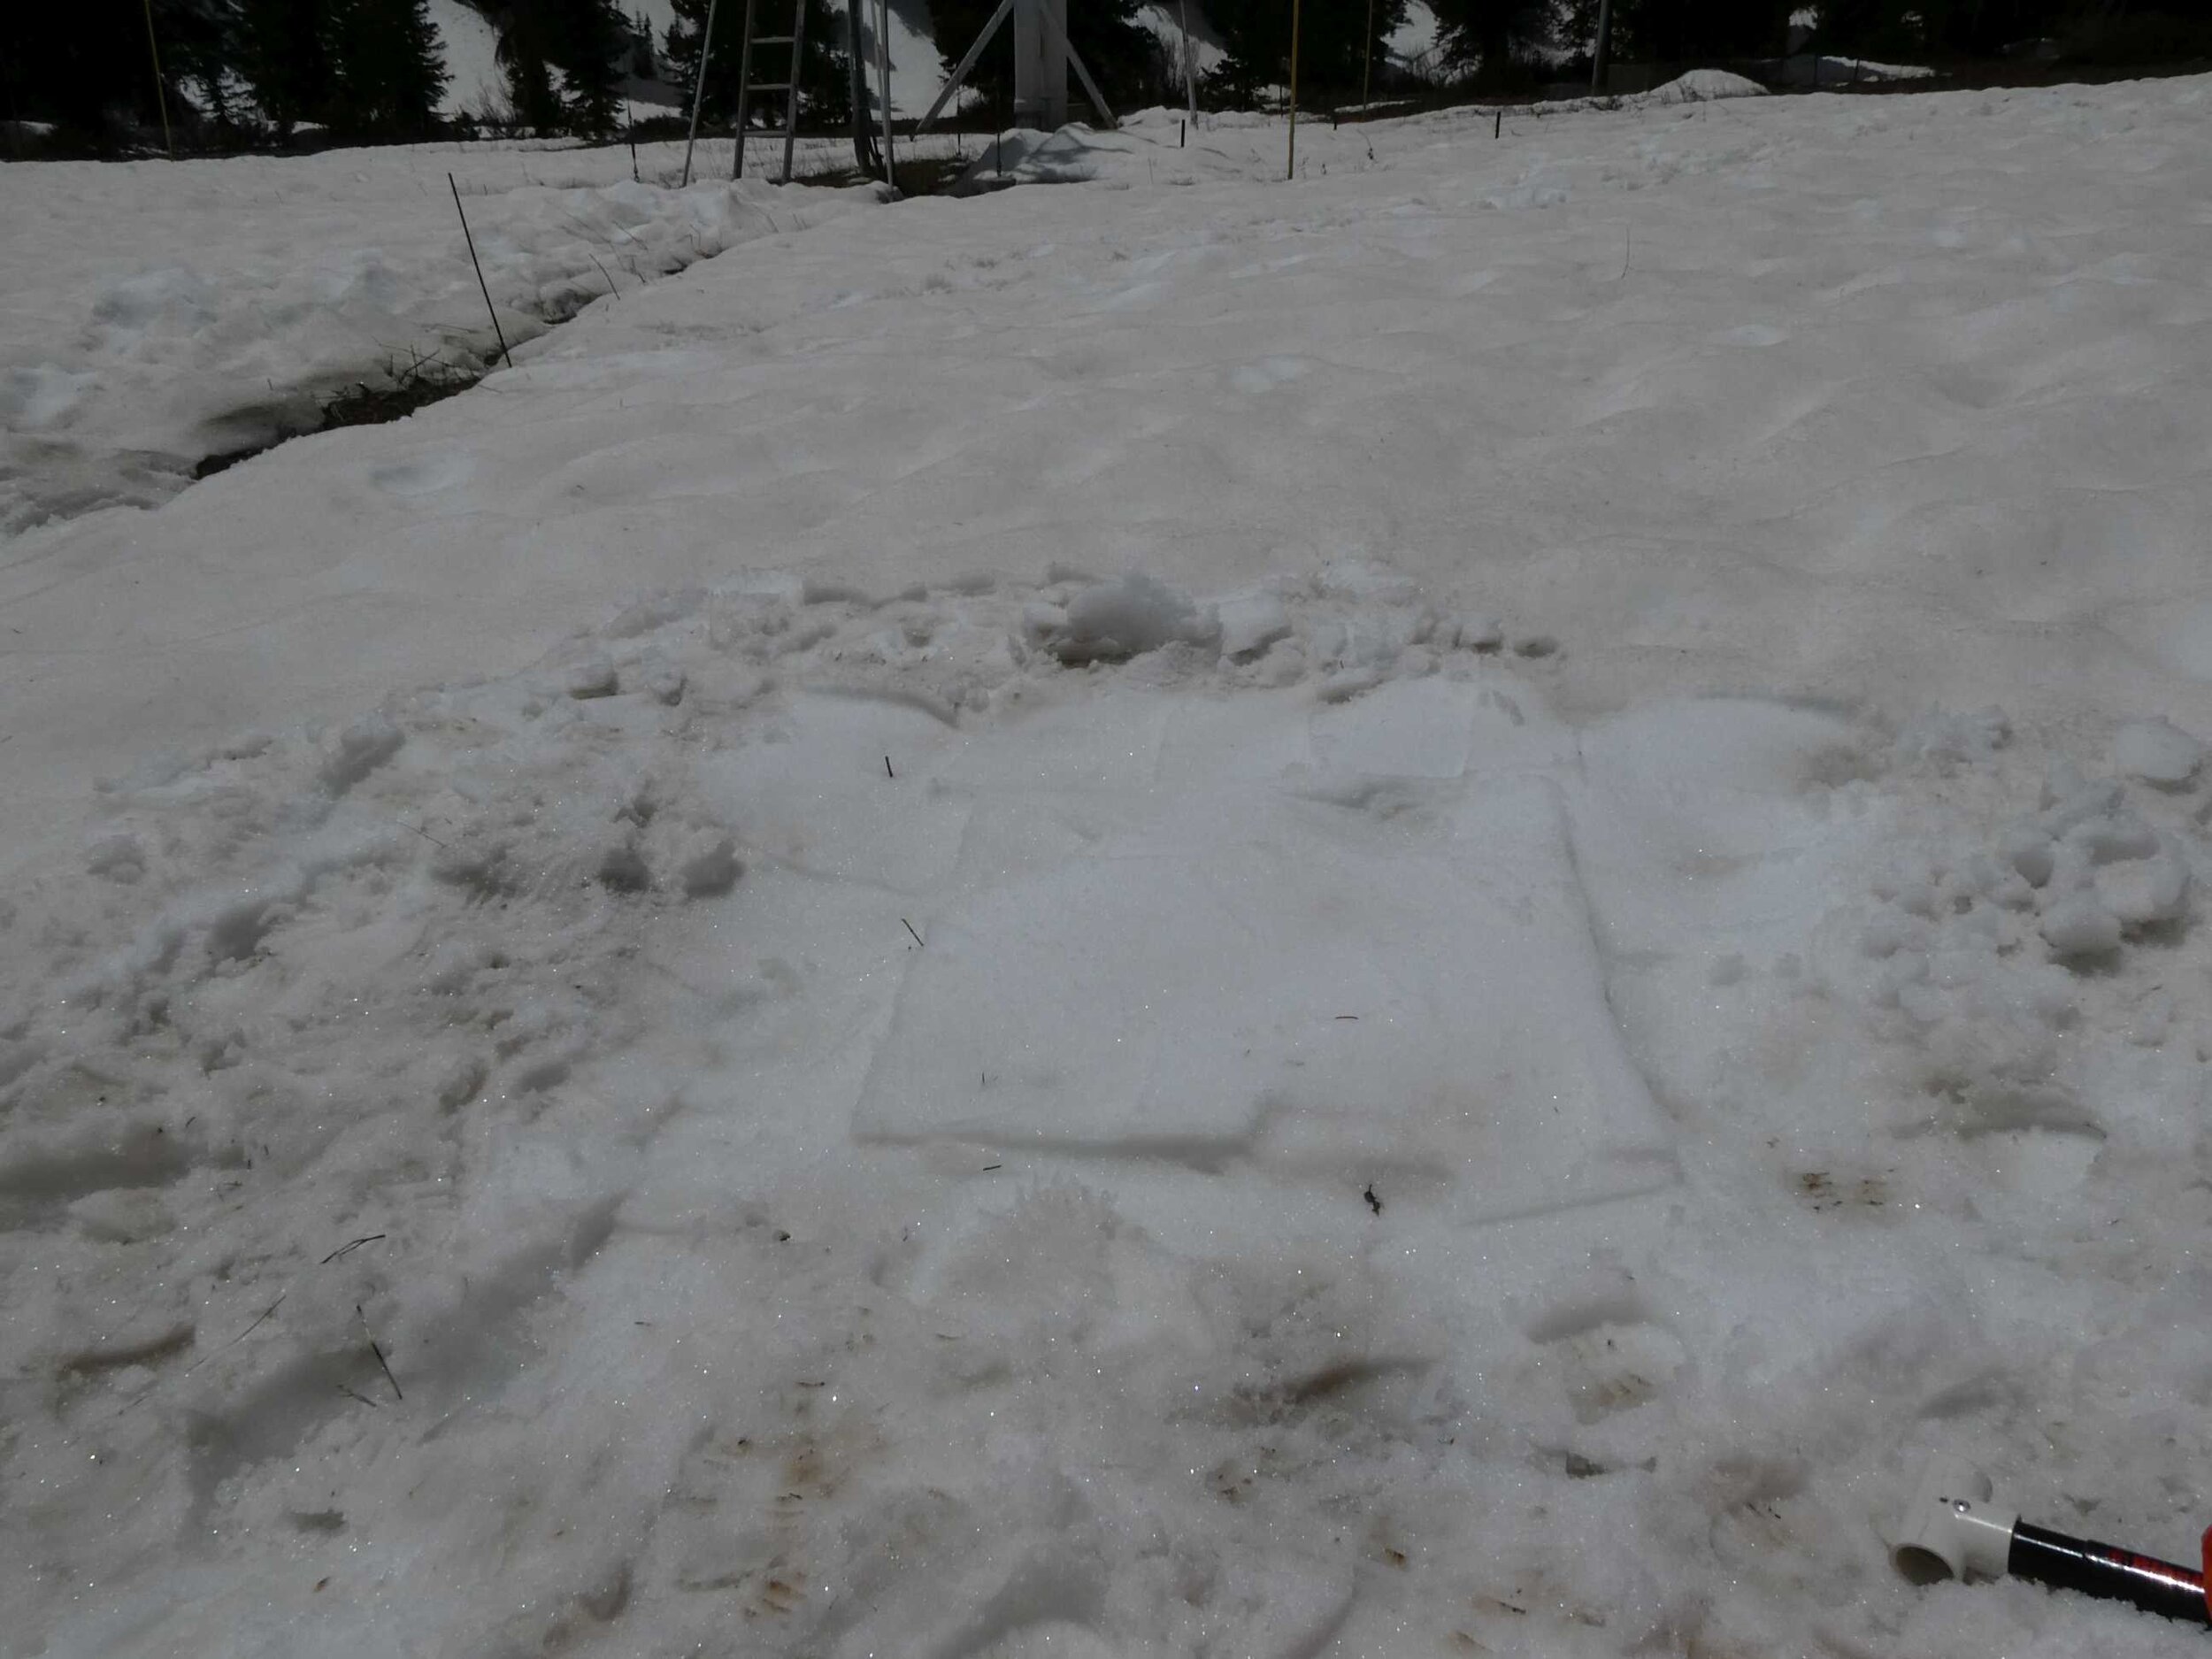
On May 18 the forecast in the Desert Southwest was for windy and dusty conditions and the USGS dust cameras showed a bit of dust in the images. It is likely the Southern Colorado Mountains received some portion of this dust. At this point all dust layers were merged at the surface. When all the season’s dust layers are at the snow surface it makes it difficult to determine if any new dust was deposited. The WY2020 season saw a few of these weather systems that may have contributed minor dust, but following these events we did not observe an increase in dust severity or new dust at our study plot where we keep a clean patch of snow to detect such events. So it is possible addition trace dust was deposited but it was not detectable.
All in all it was a low occurrence season in terms of the number of dust events observed in the San Juan Mountains and throughout the state of Colorado. Typically the San Juans receive ~7 events in a winter compared to the 3 documented this season. In terms of dust severity it was also considered low in the San Juans until all dust layers had merged together and was then classified as average. For the rest of the Colorado Mountains severity conditions remained light the entire season as Central Colorado received the same events as the San Juans but to a much less degree. Northern/Eastern Colorado received only a trace of these documented dust events, if at all.
This season the snowmelt hydrograph got hit on both ends; the beginning of the season snowmelt went towards soil moisture recharge, and an extremely dry and hot spring added very little precipitation and depleted the snowpack rapidly. Every season is unique and a learning experience, but it is always important to remember that cumulative SWE is what matters. In Central and Southern Colorado peak SWE was very near normal but the spring drought erased what we had expected to see unfold from what we were looking at in early April (even Northern Basins with strong snowpacks and slightly cooler temperatures saw a faster than normal ablation). Perhaps the opposite example of this would be WY2015 when a dry winter meant a very low peak SWE, but a very wet spring resulted in what was considered a very successful season. Of course dust-on-snow in a dry spring particularly exacerbates the problem. Southern Colorado saw dust conditions that were typical, which in Southern Colorado still means very significant conditions affecting the energy budget of the snowpack and melt rates, and this spring the dust sat on the surface for the duration except for 1-2 brief snowfall induced “albedo resets”. Central and Northern Colorado experienced light dust based on what these regions normally see. You can read the season’s dust-on-snow reports at the Colorado Dust-on-Snow website.
MONTHLY WEATHER CONDITIONS
October Weather Summary
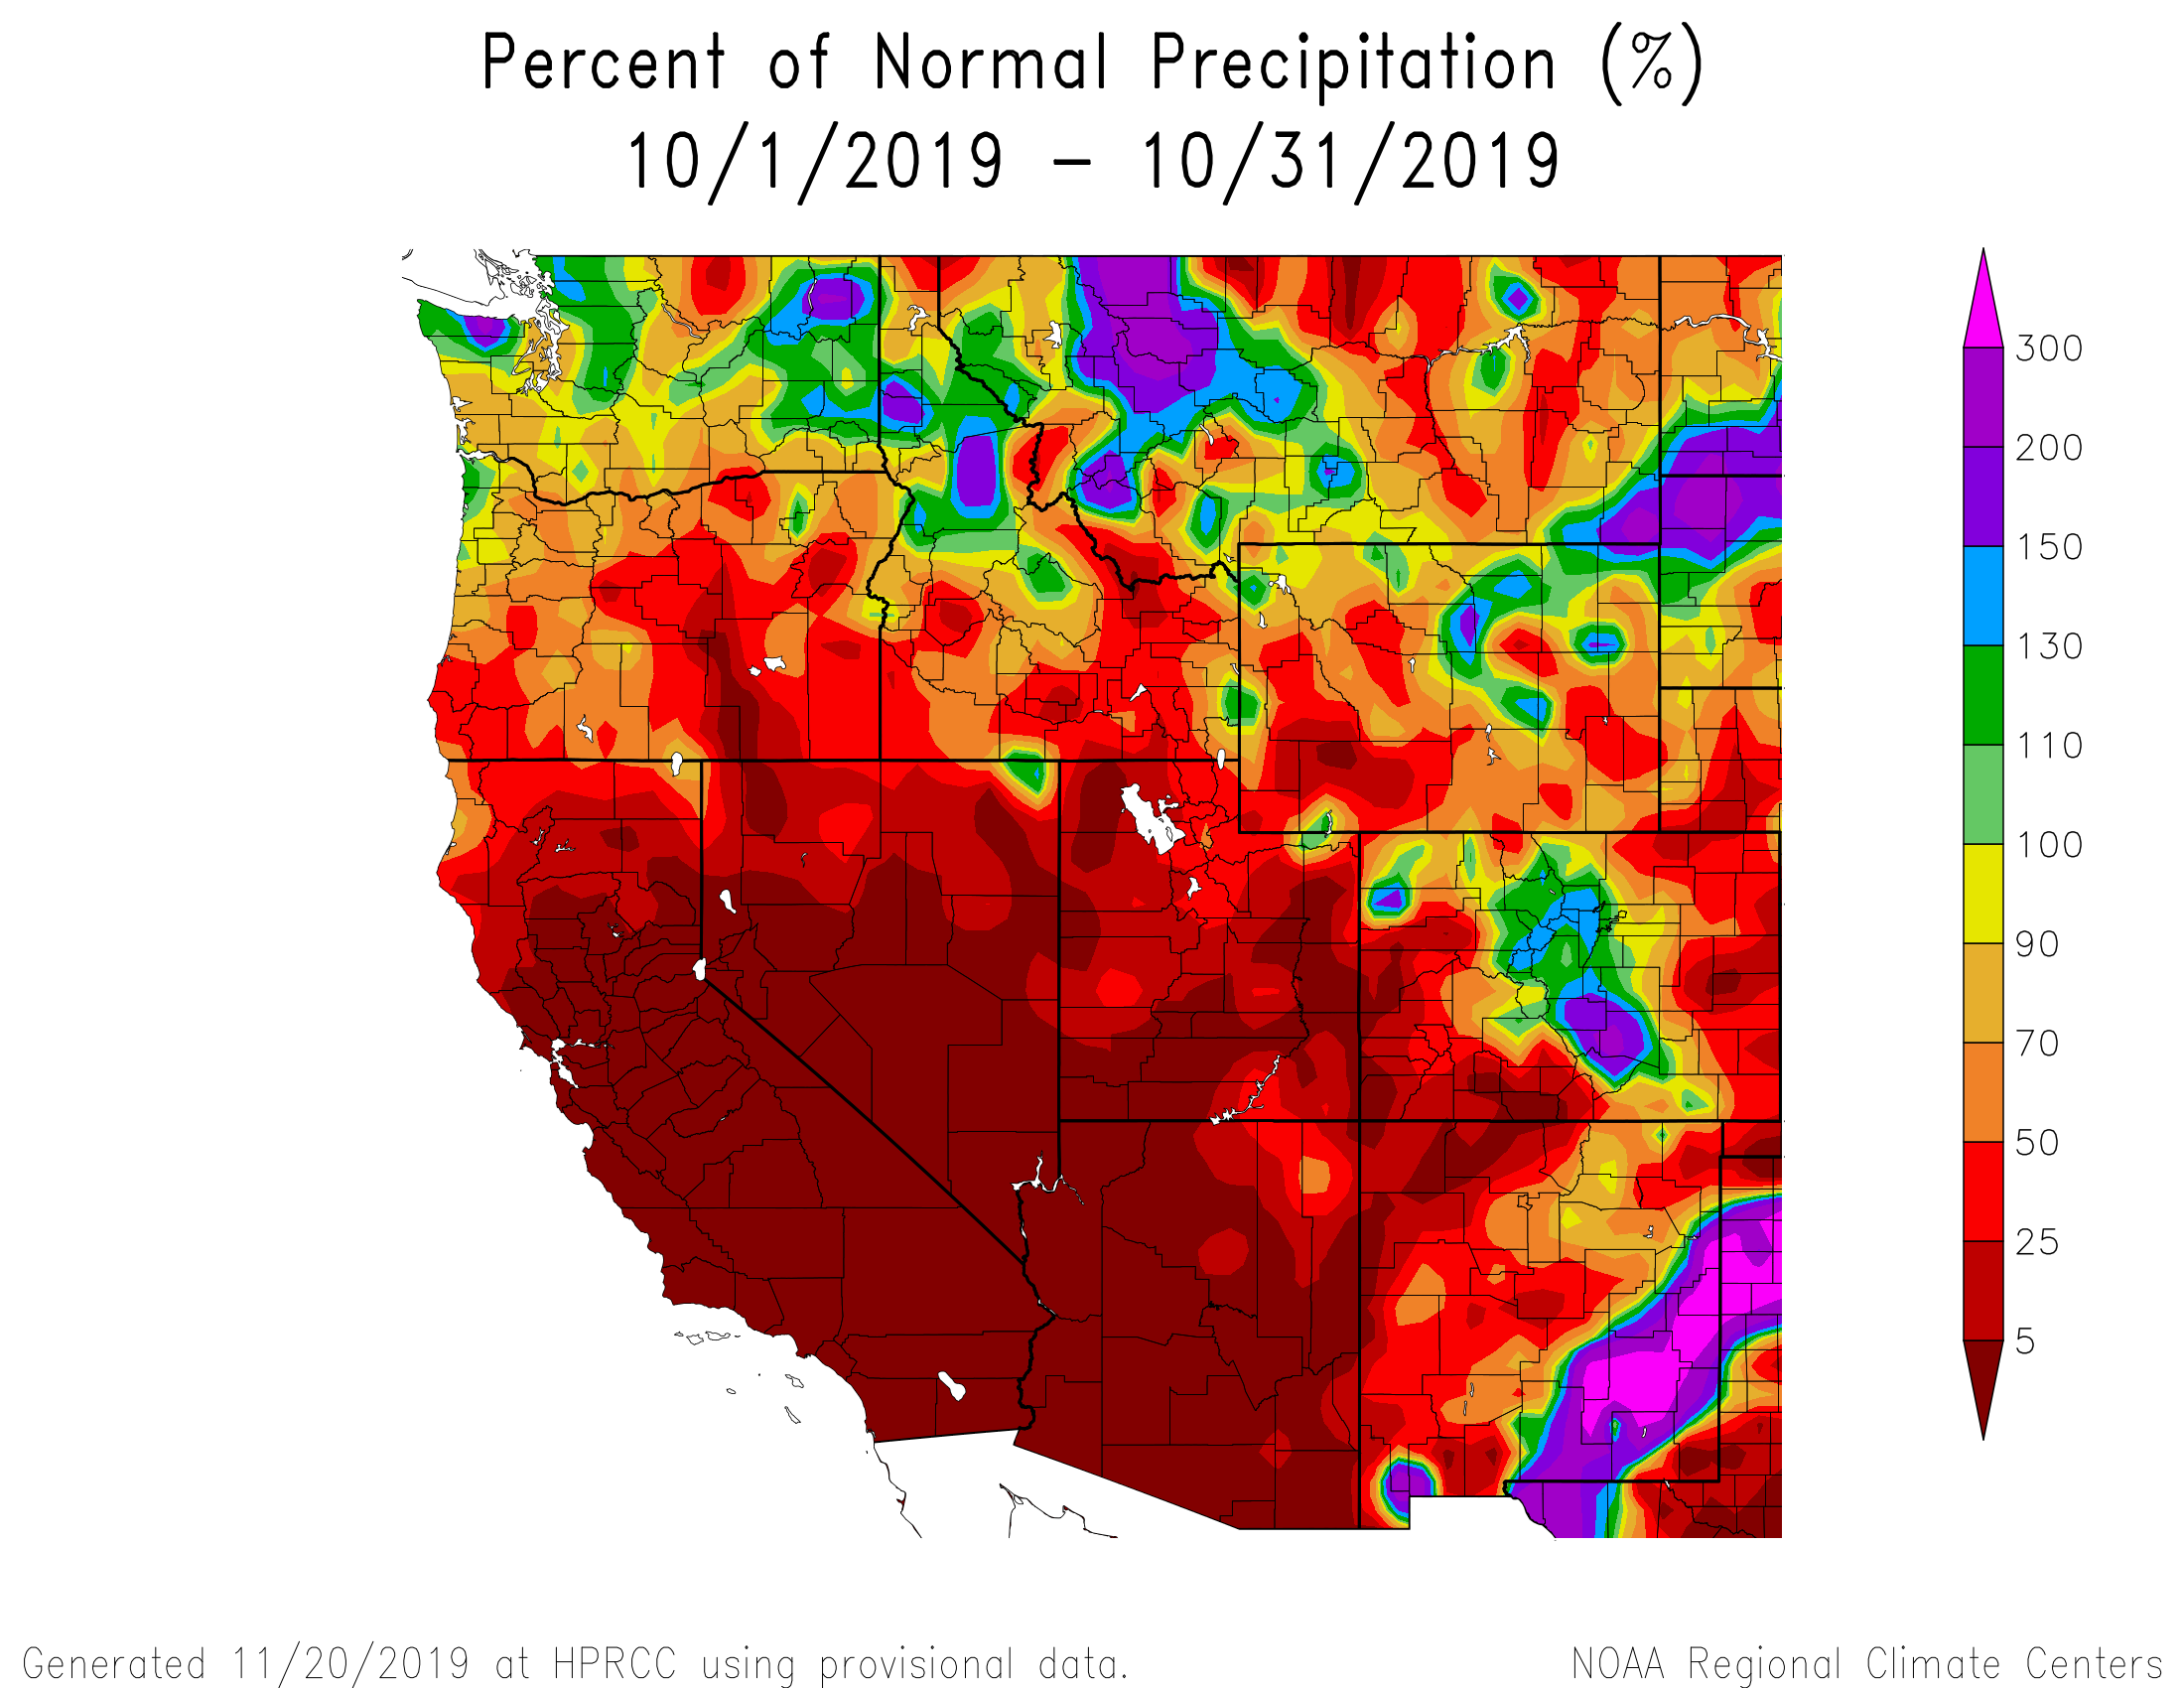
October had little precipitation and cold temperatures. After a dry summer due to poor monsoons, WY2020 began with moderate to severe drought conditions in the Four Corners Region and abnormally dry conditions across the Colorado’s Central and Northern Mountains. No winter storms were observed at SBB, and SASP received just 3.8 cm (1.5”) of precipitation. Several small snowstorms occurred, but did little to build the snowpack in the Southern Mountains with 15.2 cm (6”) at Red Mt Pass by October 31. These storm systems did begin to build the snowpack in the Central and Northern Mountains with a snow depth around 40 cm (16”) over several passes by end of the month. Over the month drought conditions worsened with severe conditions expanding in the Four Corners and moderate conditions pushing further North. Of note were record low temperatures across the western half of the state when an arctic air mass settled over the region at the end of the month. Our Putney station recorded a low temperature of -26°C (-15°F) on October 30th, setting a record for our coldest October day since operations began, with a average air temperature of -18.9°C (-2°F) for the day! After a tragically low WY2018 and an exceptionally high WY2019 will WY2020 hit the sweet spot?
November Weather Summary
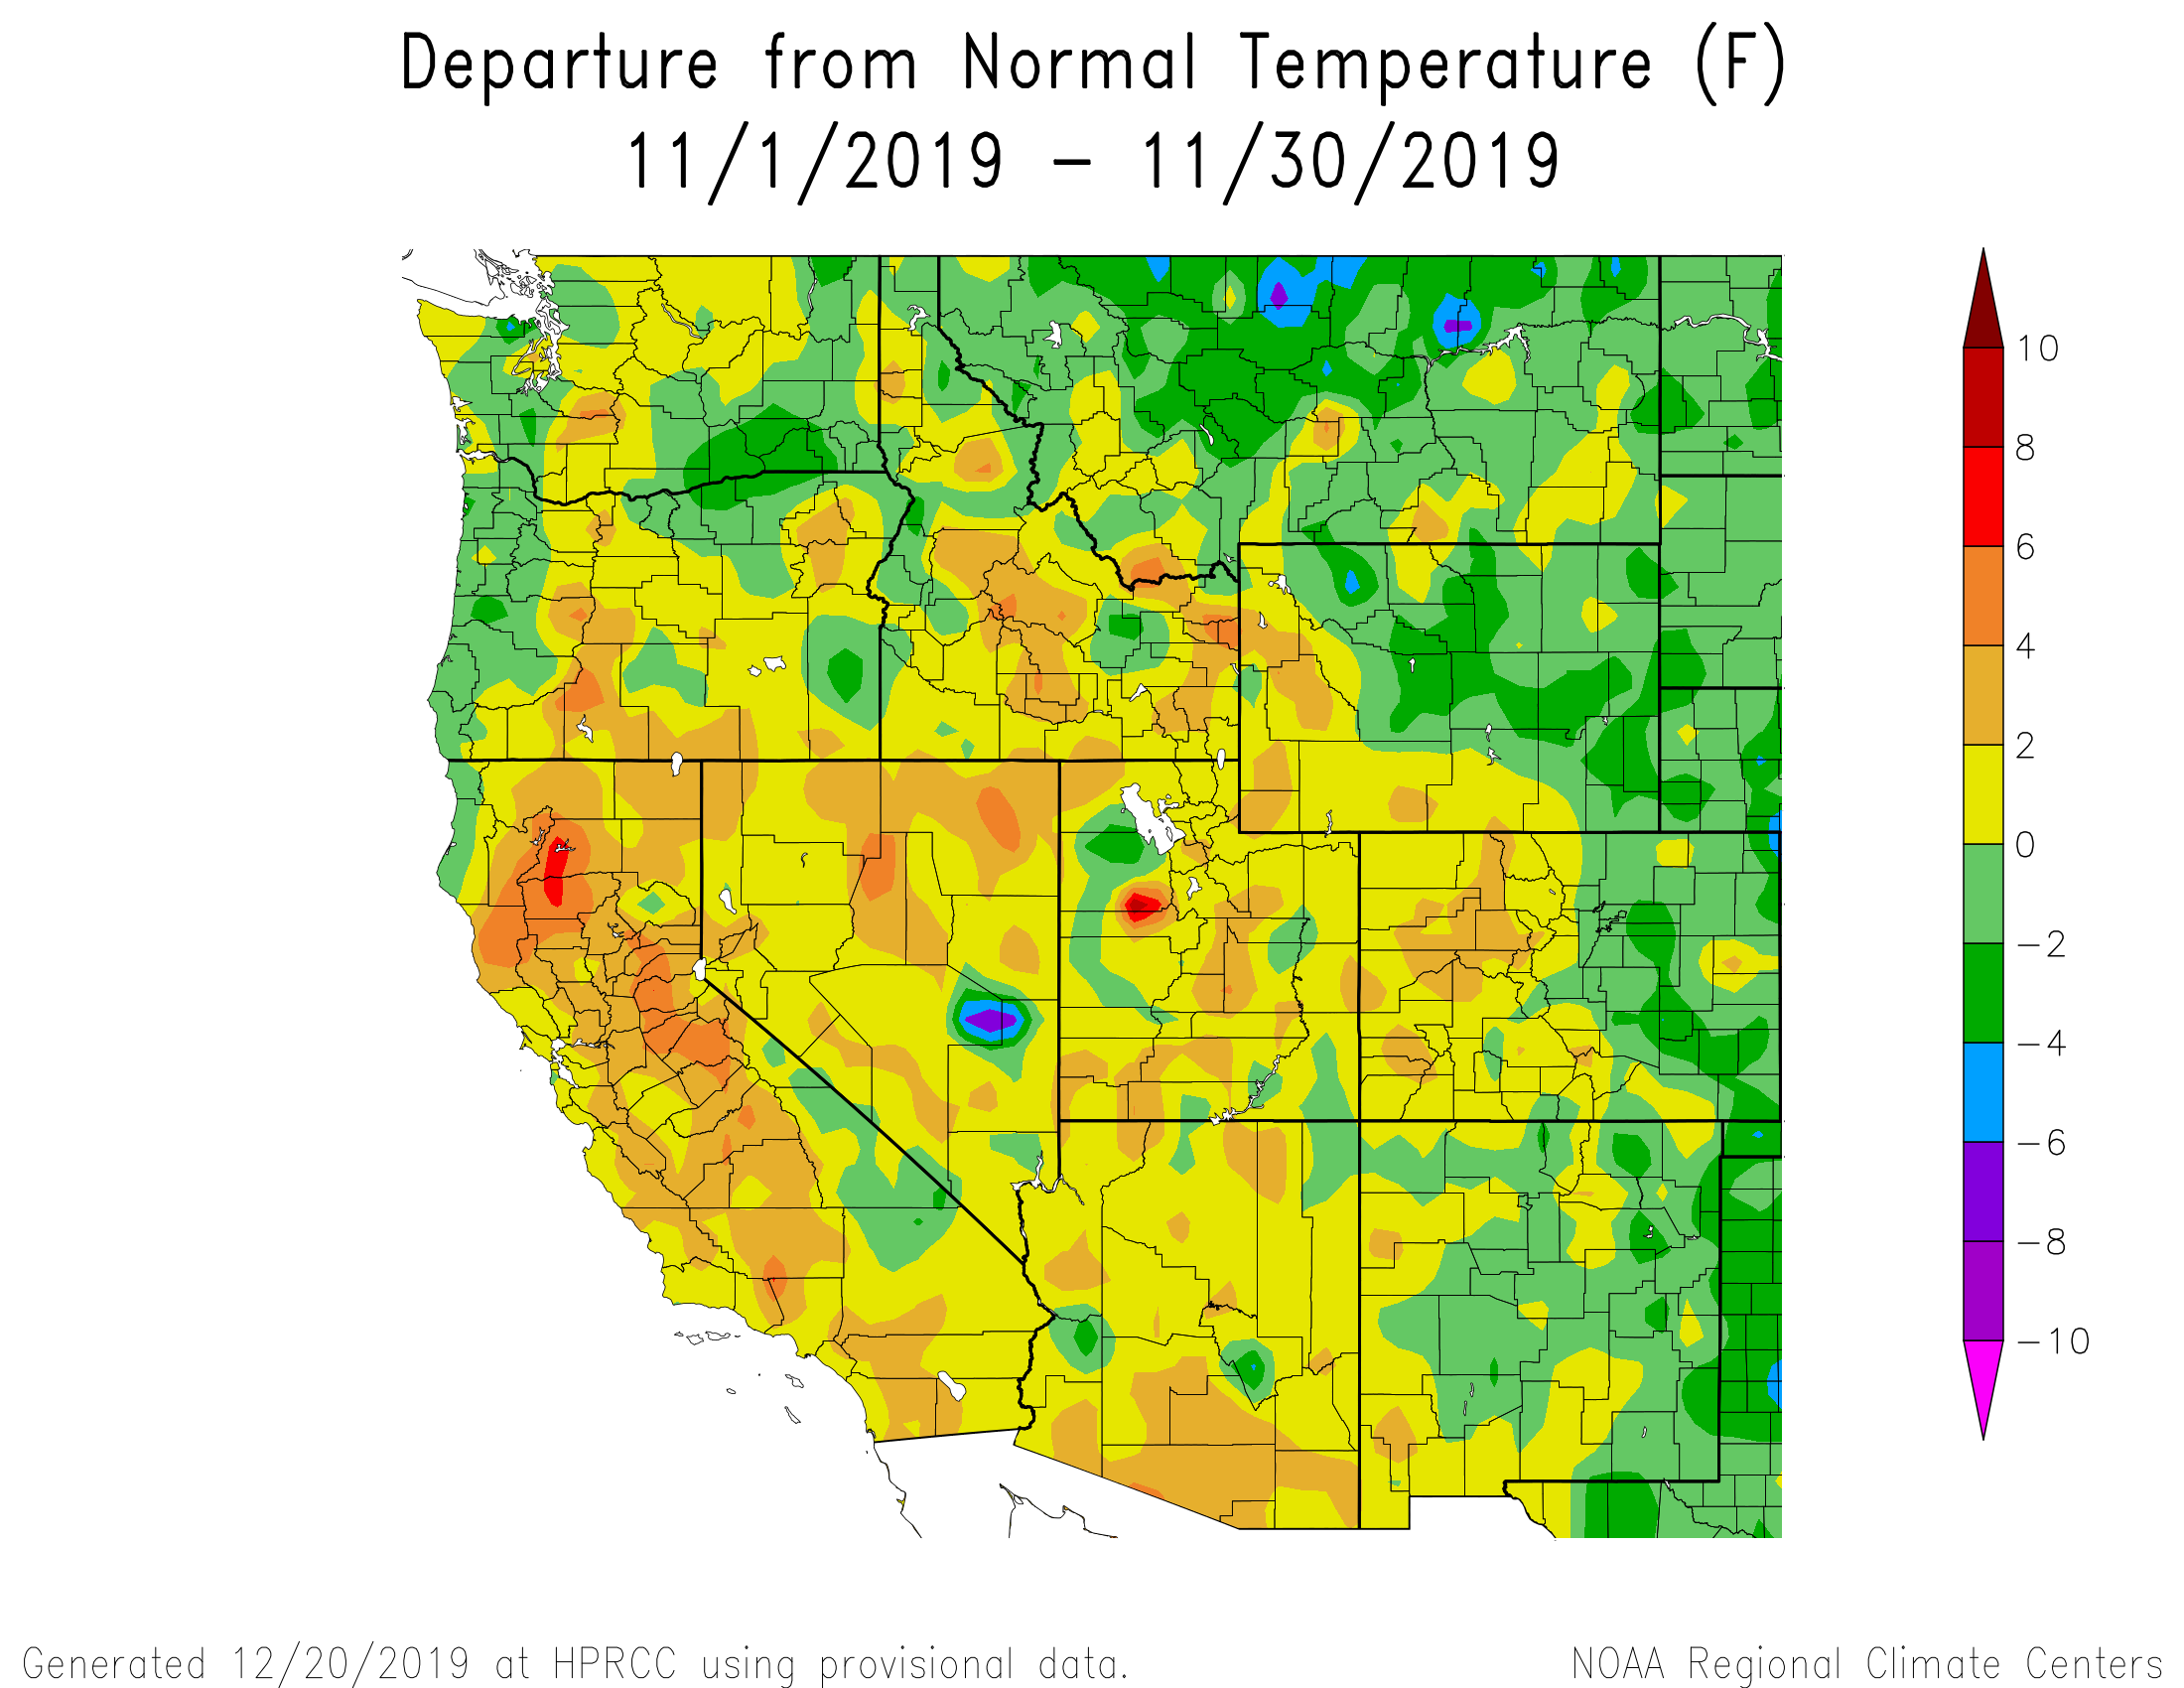
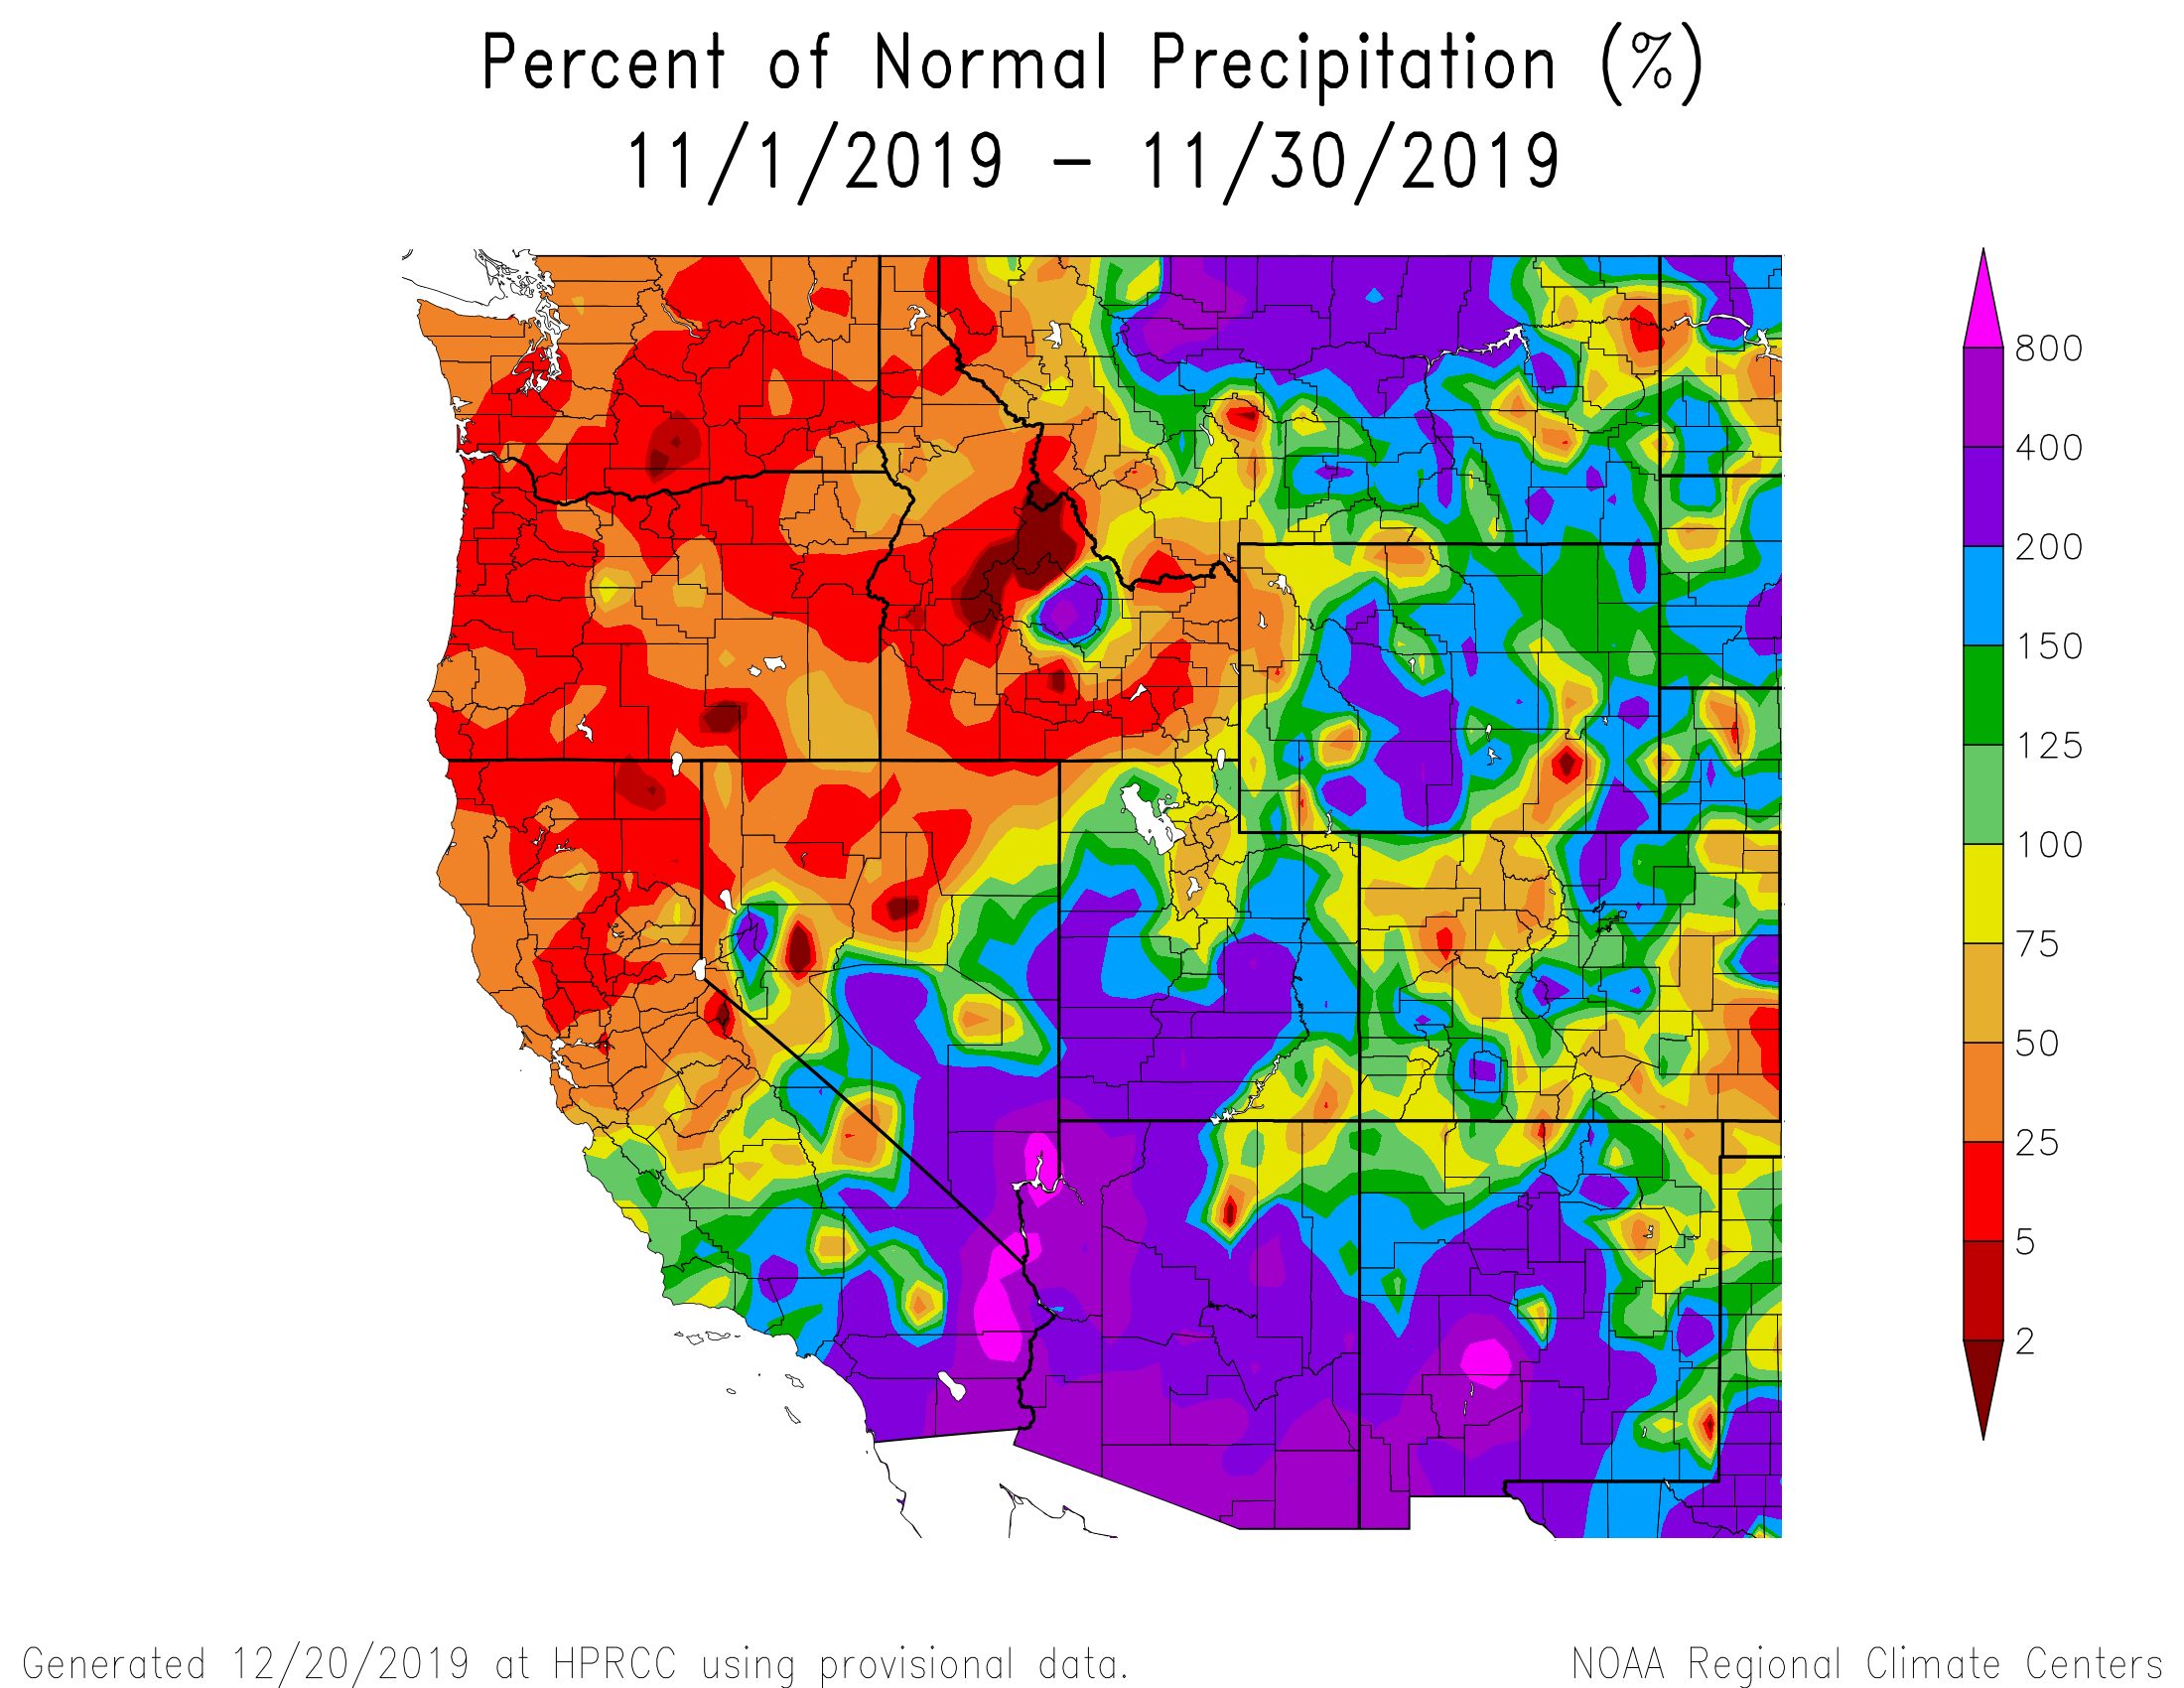
November began with a high pressure ridge off of the west coast which lead to a dry start to the month. During this period the October snow largely melted in the San Juans, SWE stayed below normal, and drought conditions persisted in the Four Corners. The Northern and Central Mountains kept their October snow and SWE remained near or above normal, leading to improvement of drought conditions. Towards the end of November precipitation returned and SBB received three winter storms. Storm #1 came November 20th, laying the foundation of the San Juan snowpack, with 27.1 cm (10.7”) of snow as 27 mm (1.1”) of precipitation at SASP. Storm #2 and Storm #3 came as back to back events, from November 25th to November 30th, making for a snowy Thanksgiving for Colorado. The two storms contributed 48.3 cm (19”) of snow as 75 mm (2.9”) of precipitation at SASP. The month’s total of 102 mm (4”) of precipitation received in the San Juans for November was enough to bring SWE from very low levels to above normal for the San Miguel/Dolores/Animas/San Juan River Basins. The rest of Colorado ended the month with SWE near or above normal as well. Drought Conditions improved across the Northern and Central mountains, while the Southern mountains did not receive enough precipitation to improve. Nonetheless, snow covered peaks and a climate outlook of above average precipitation leave us optimistic for a snowy December.
December Weather Summary
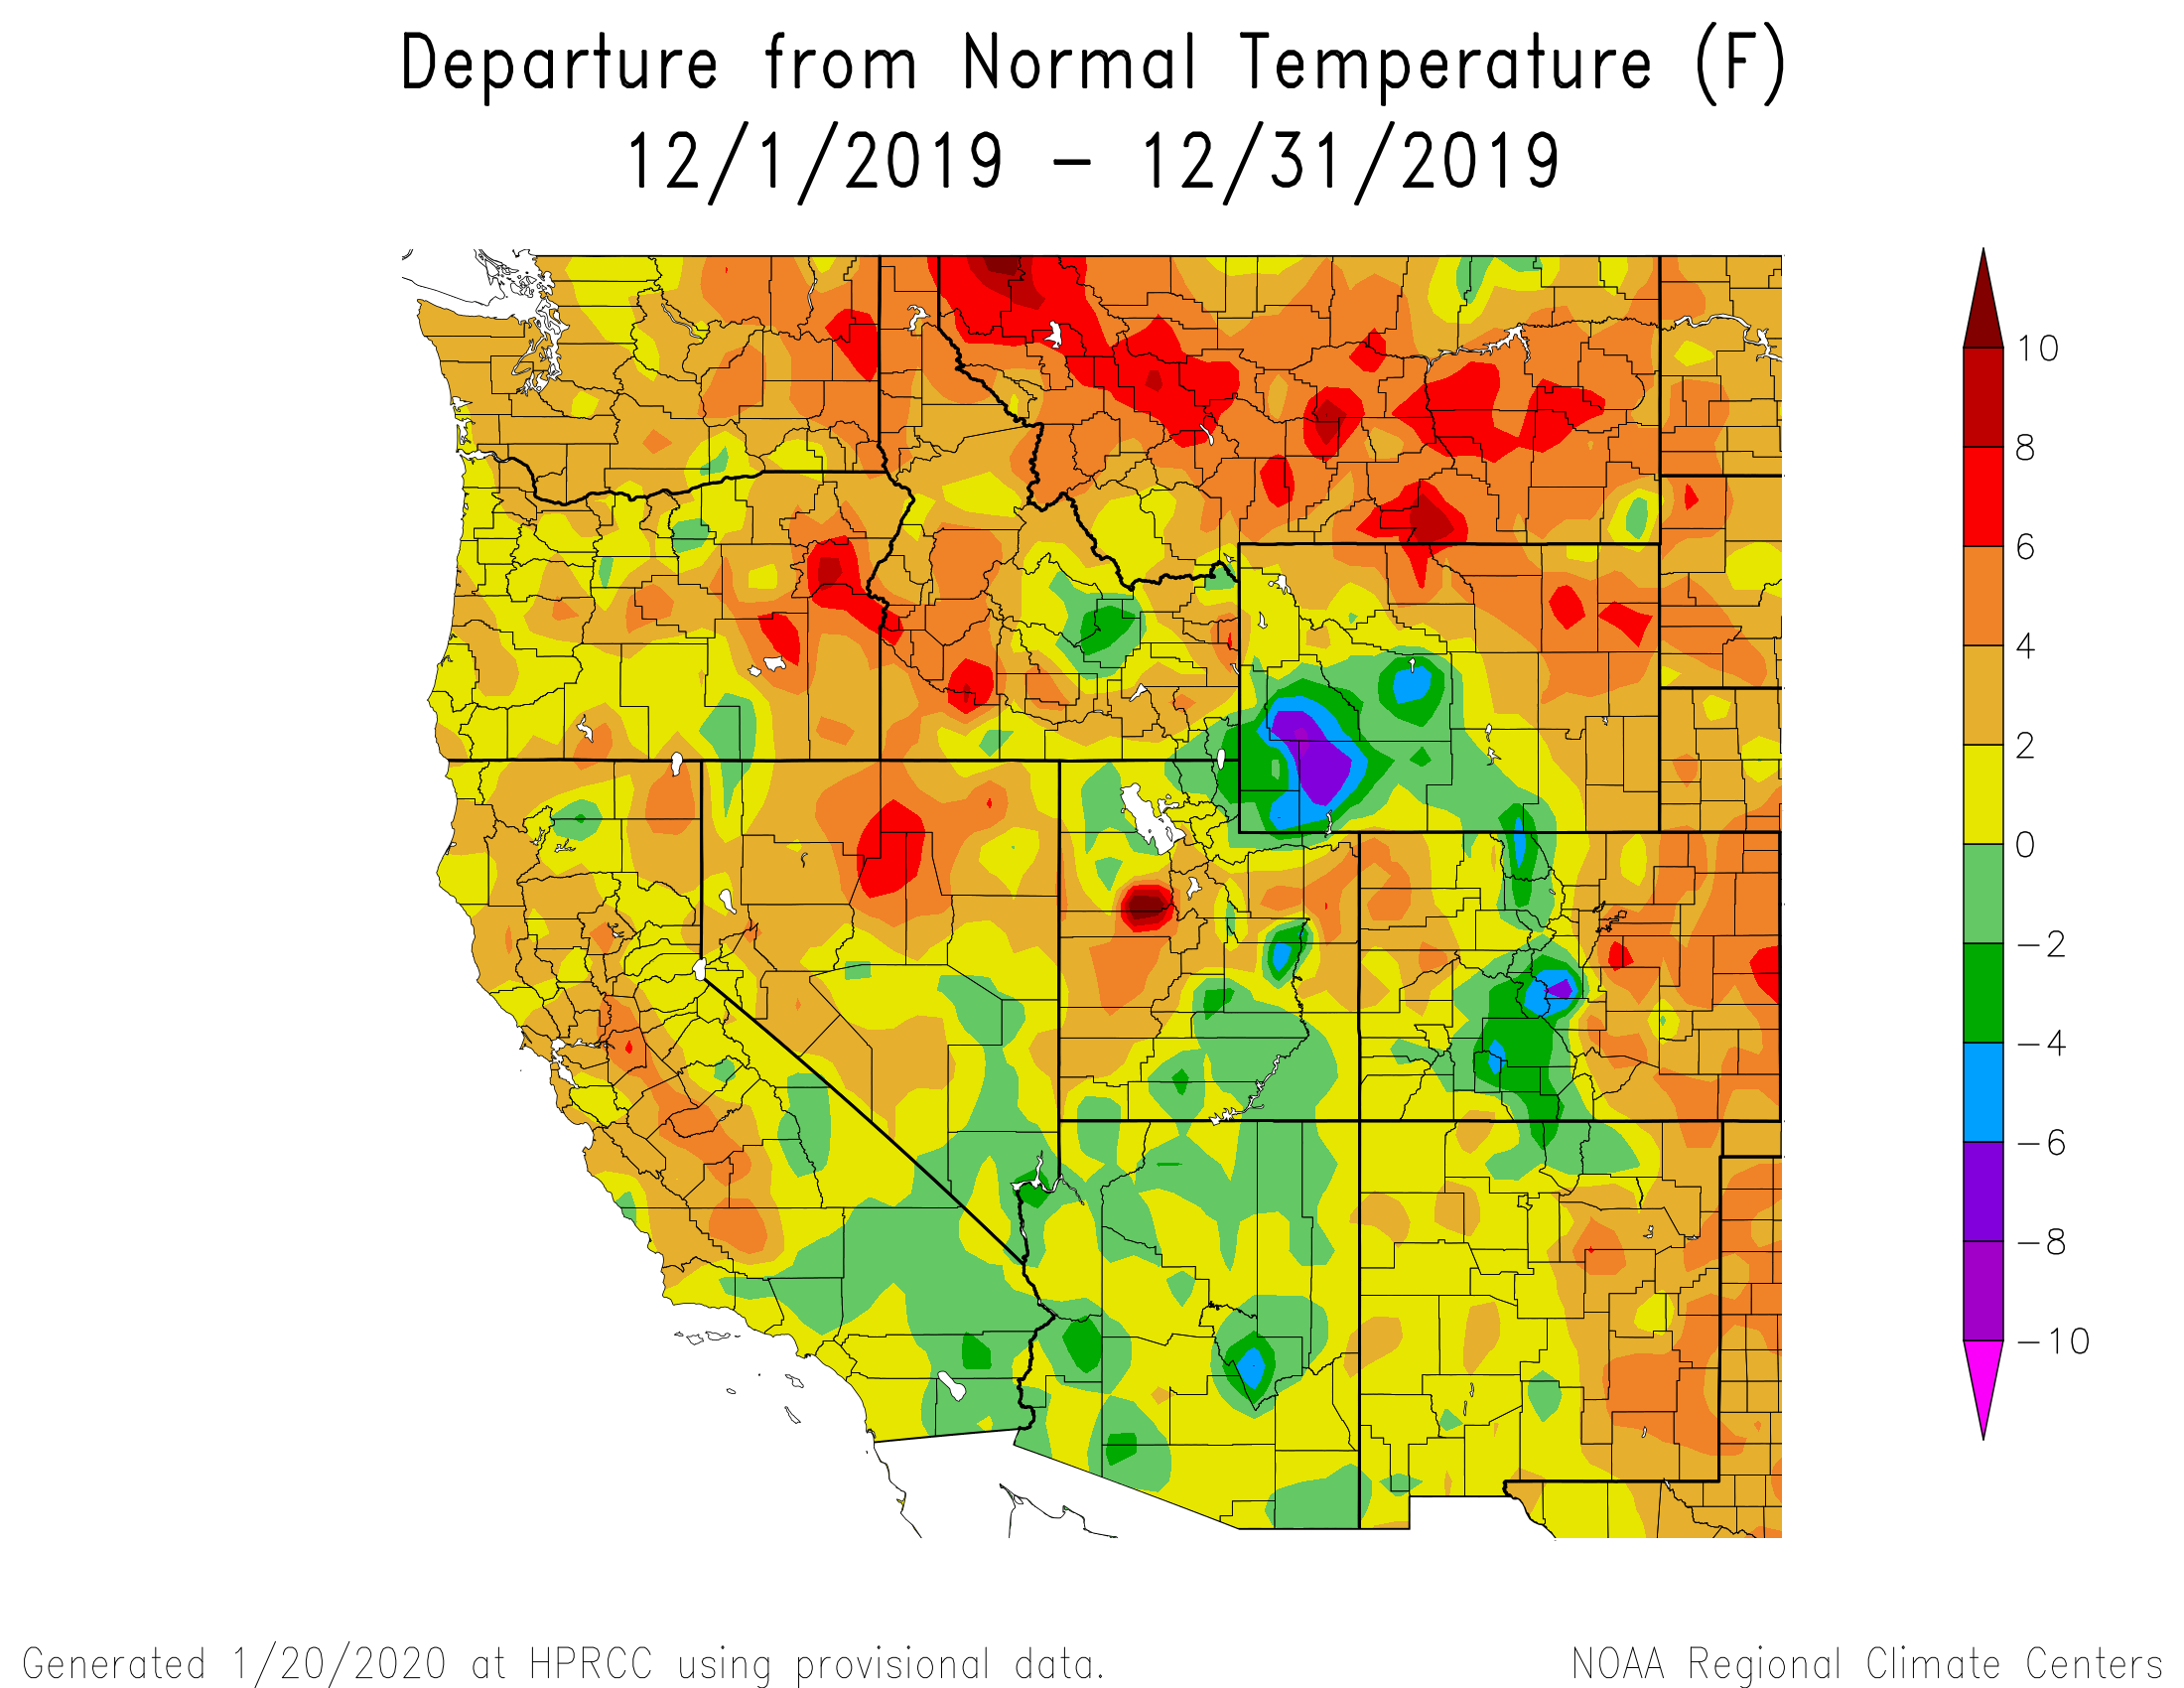
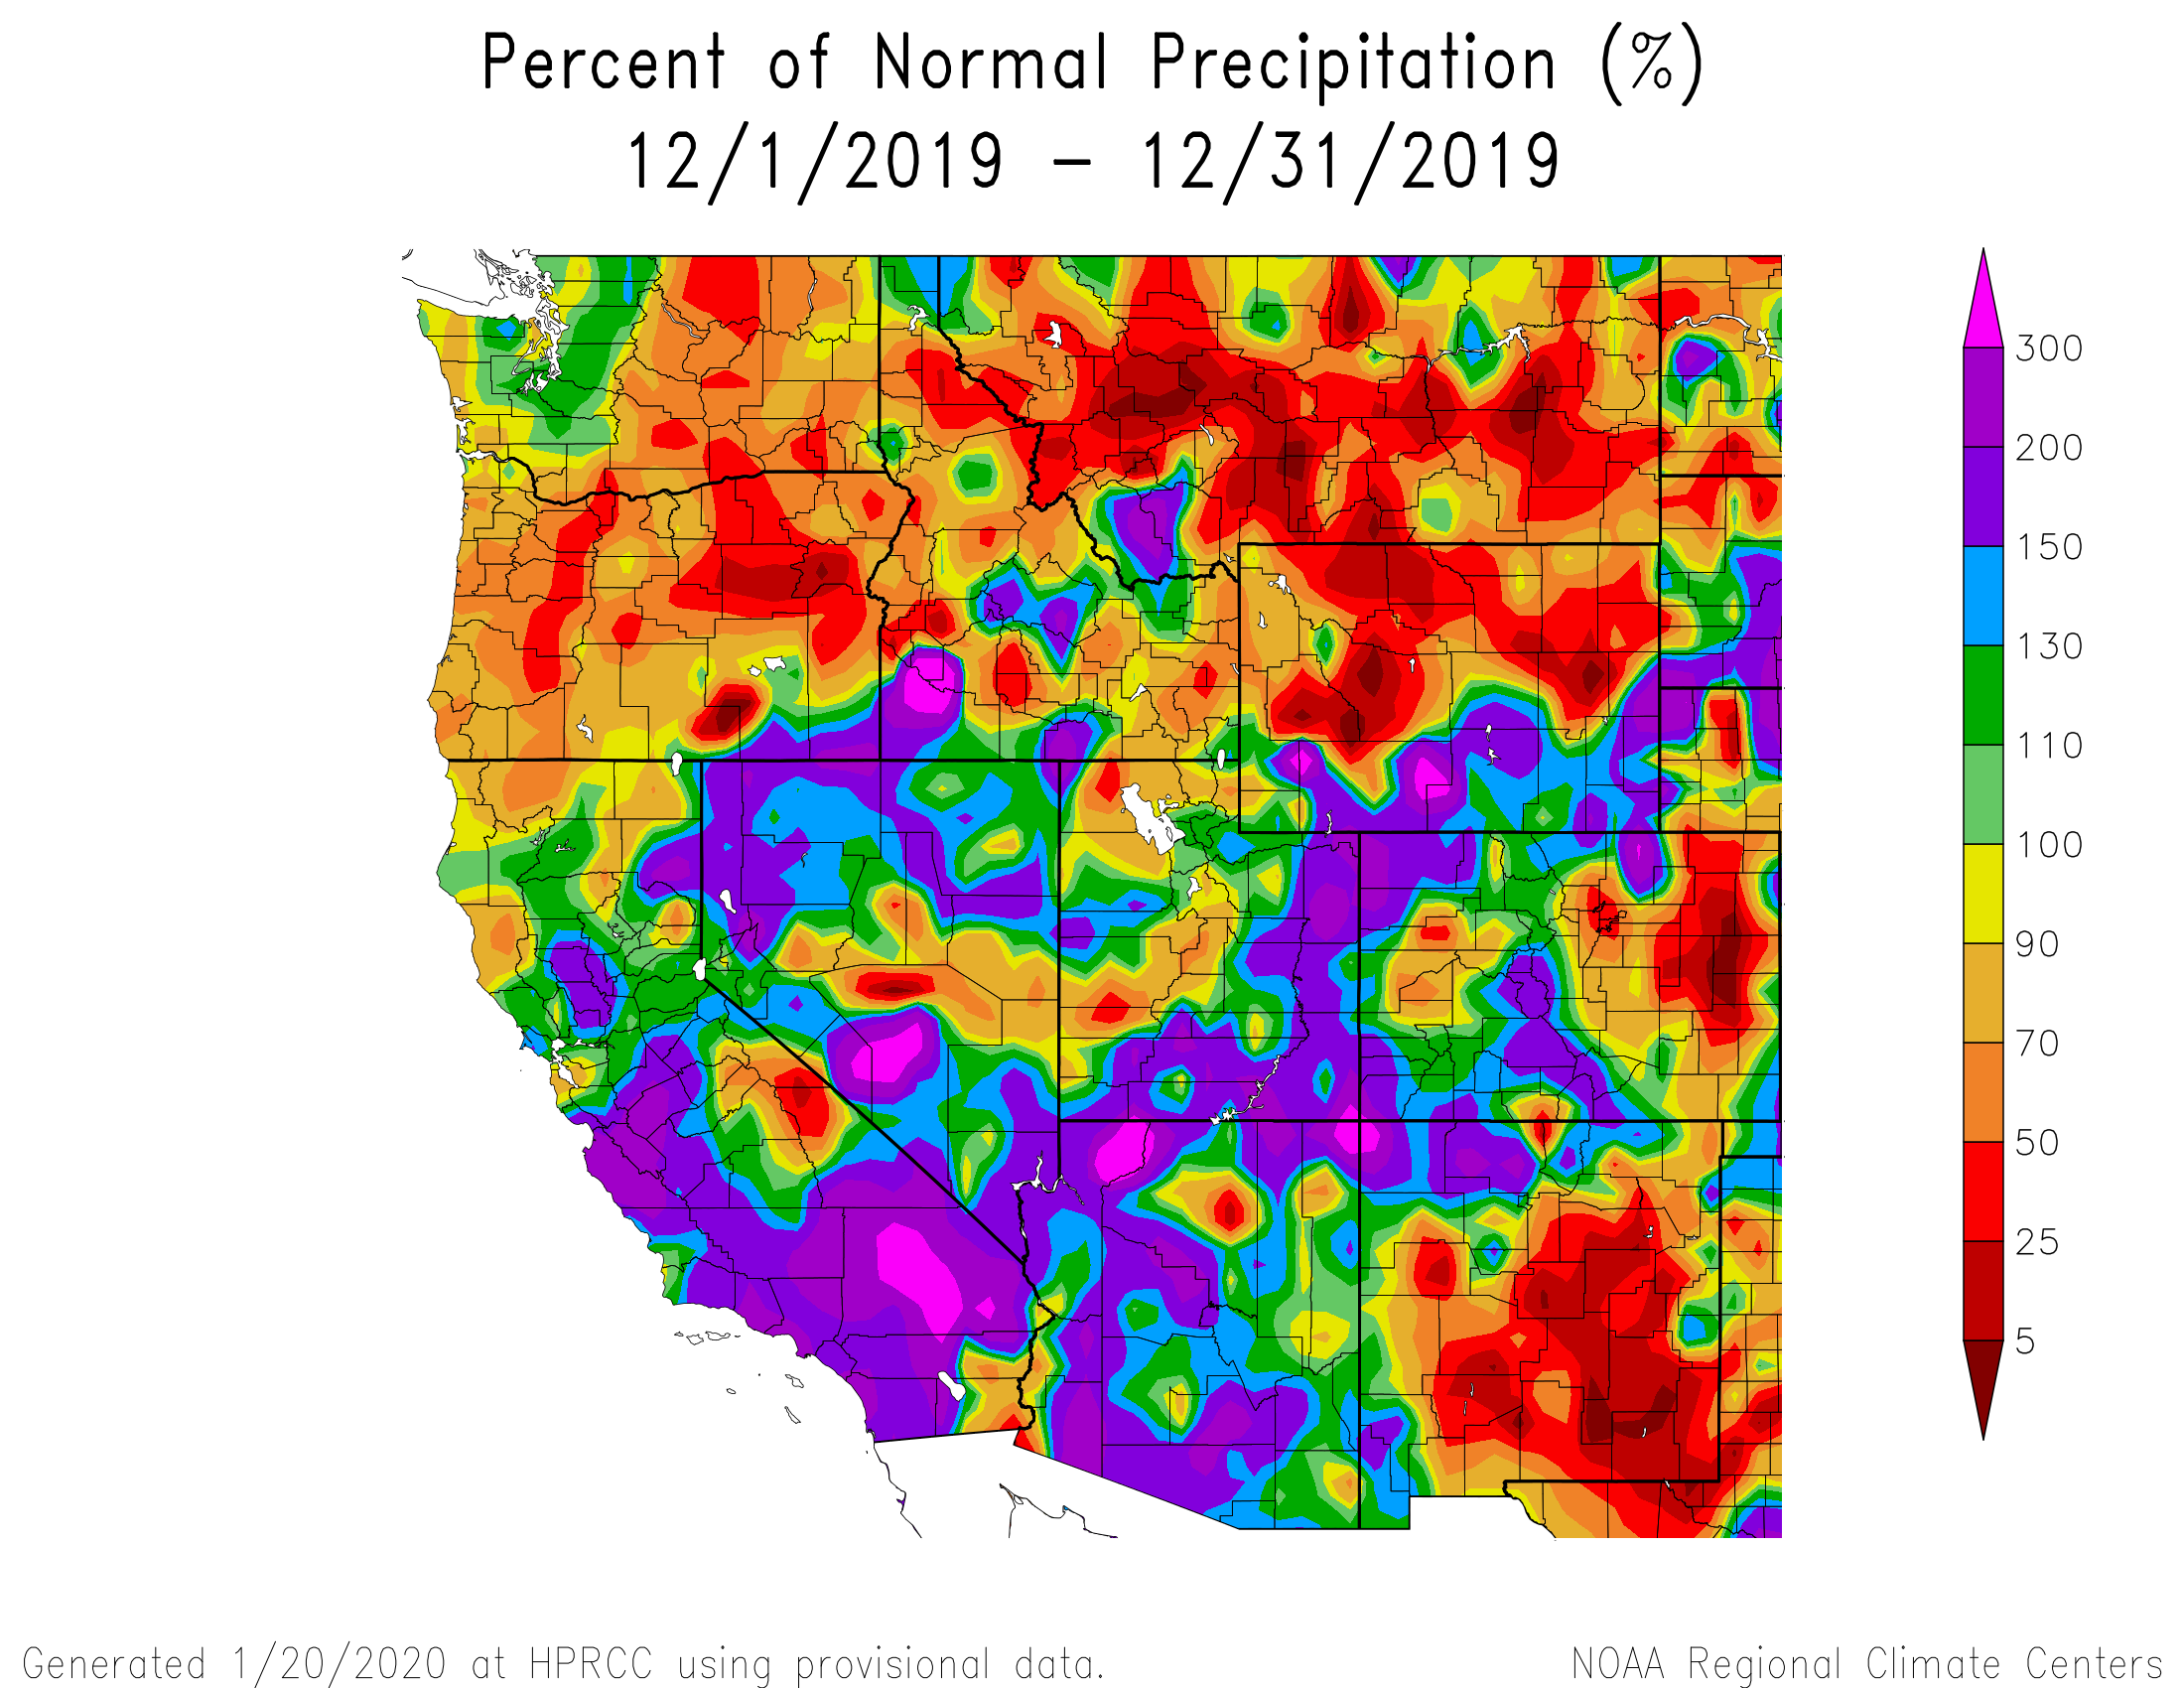
December was a snowy month. At SBB we saw 5 winter storms, which is above the average of 3.7. Historically, December is the month which receives the most precipitation at SBB. The water year is far from over, but it looks like the trend will hold true after receiving 169 mm (6.7”) of precipitation at SBB, well above the average of 125 mm (4.9”). Winter storms for the month came at a near weekly pace with Storm #4 on December 7, Storm #5 on December 13, Storm #6 delivering a white Christmas, and back to back Storms #7 and #8 closing out 2019. These 5 events brought 118.8 cm (46.8”) of snow accumulation to SASP and left the snowpack over the 1-meter mark at 1.43 m (56”) by December 31. In the Northern and Central Mountains snowfall began earlier, around December 3rd, with impressive totals. Many areas received over 30” of snow in the first half of the month. Breckenridge ski area reported 48” in 3 days! 2019 came to an end with improving drought conditions in the four corners region and statewide SWE totals above average.
January Weather Summary
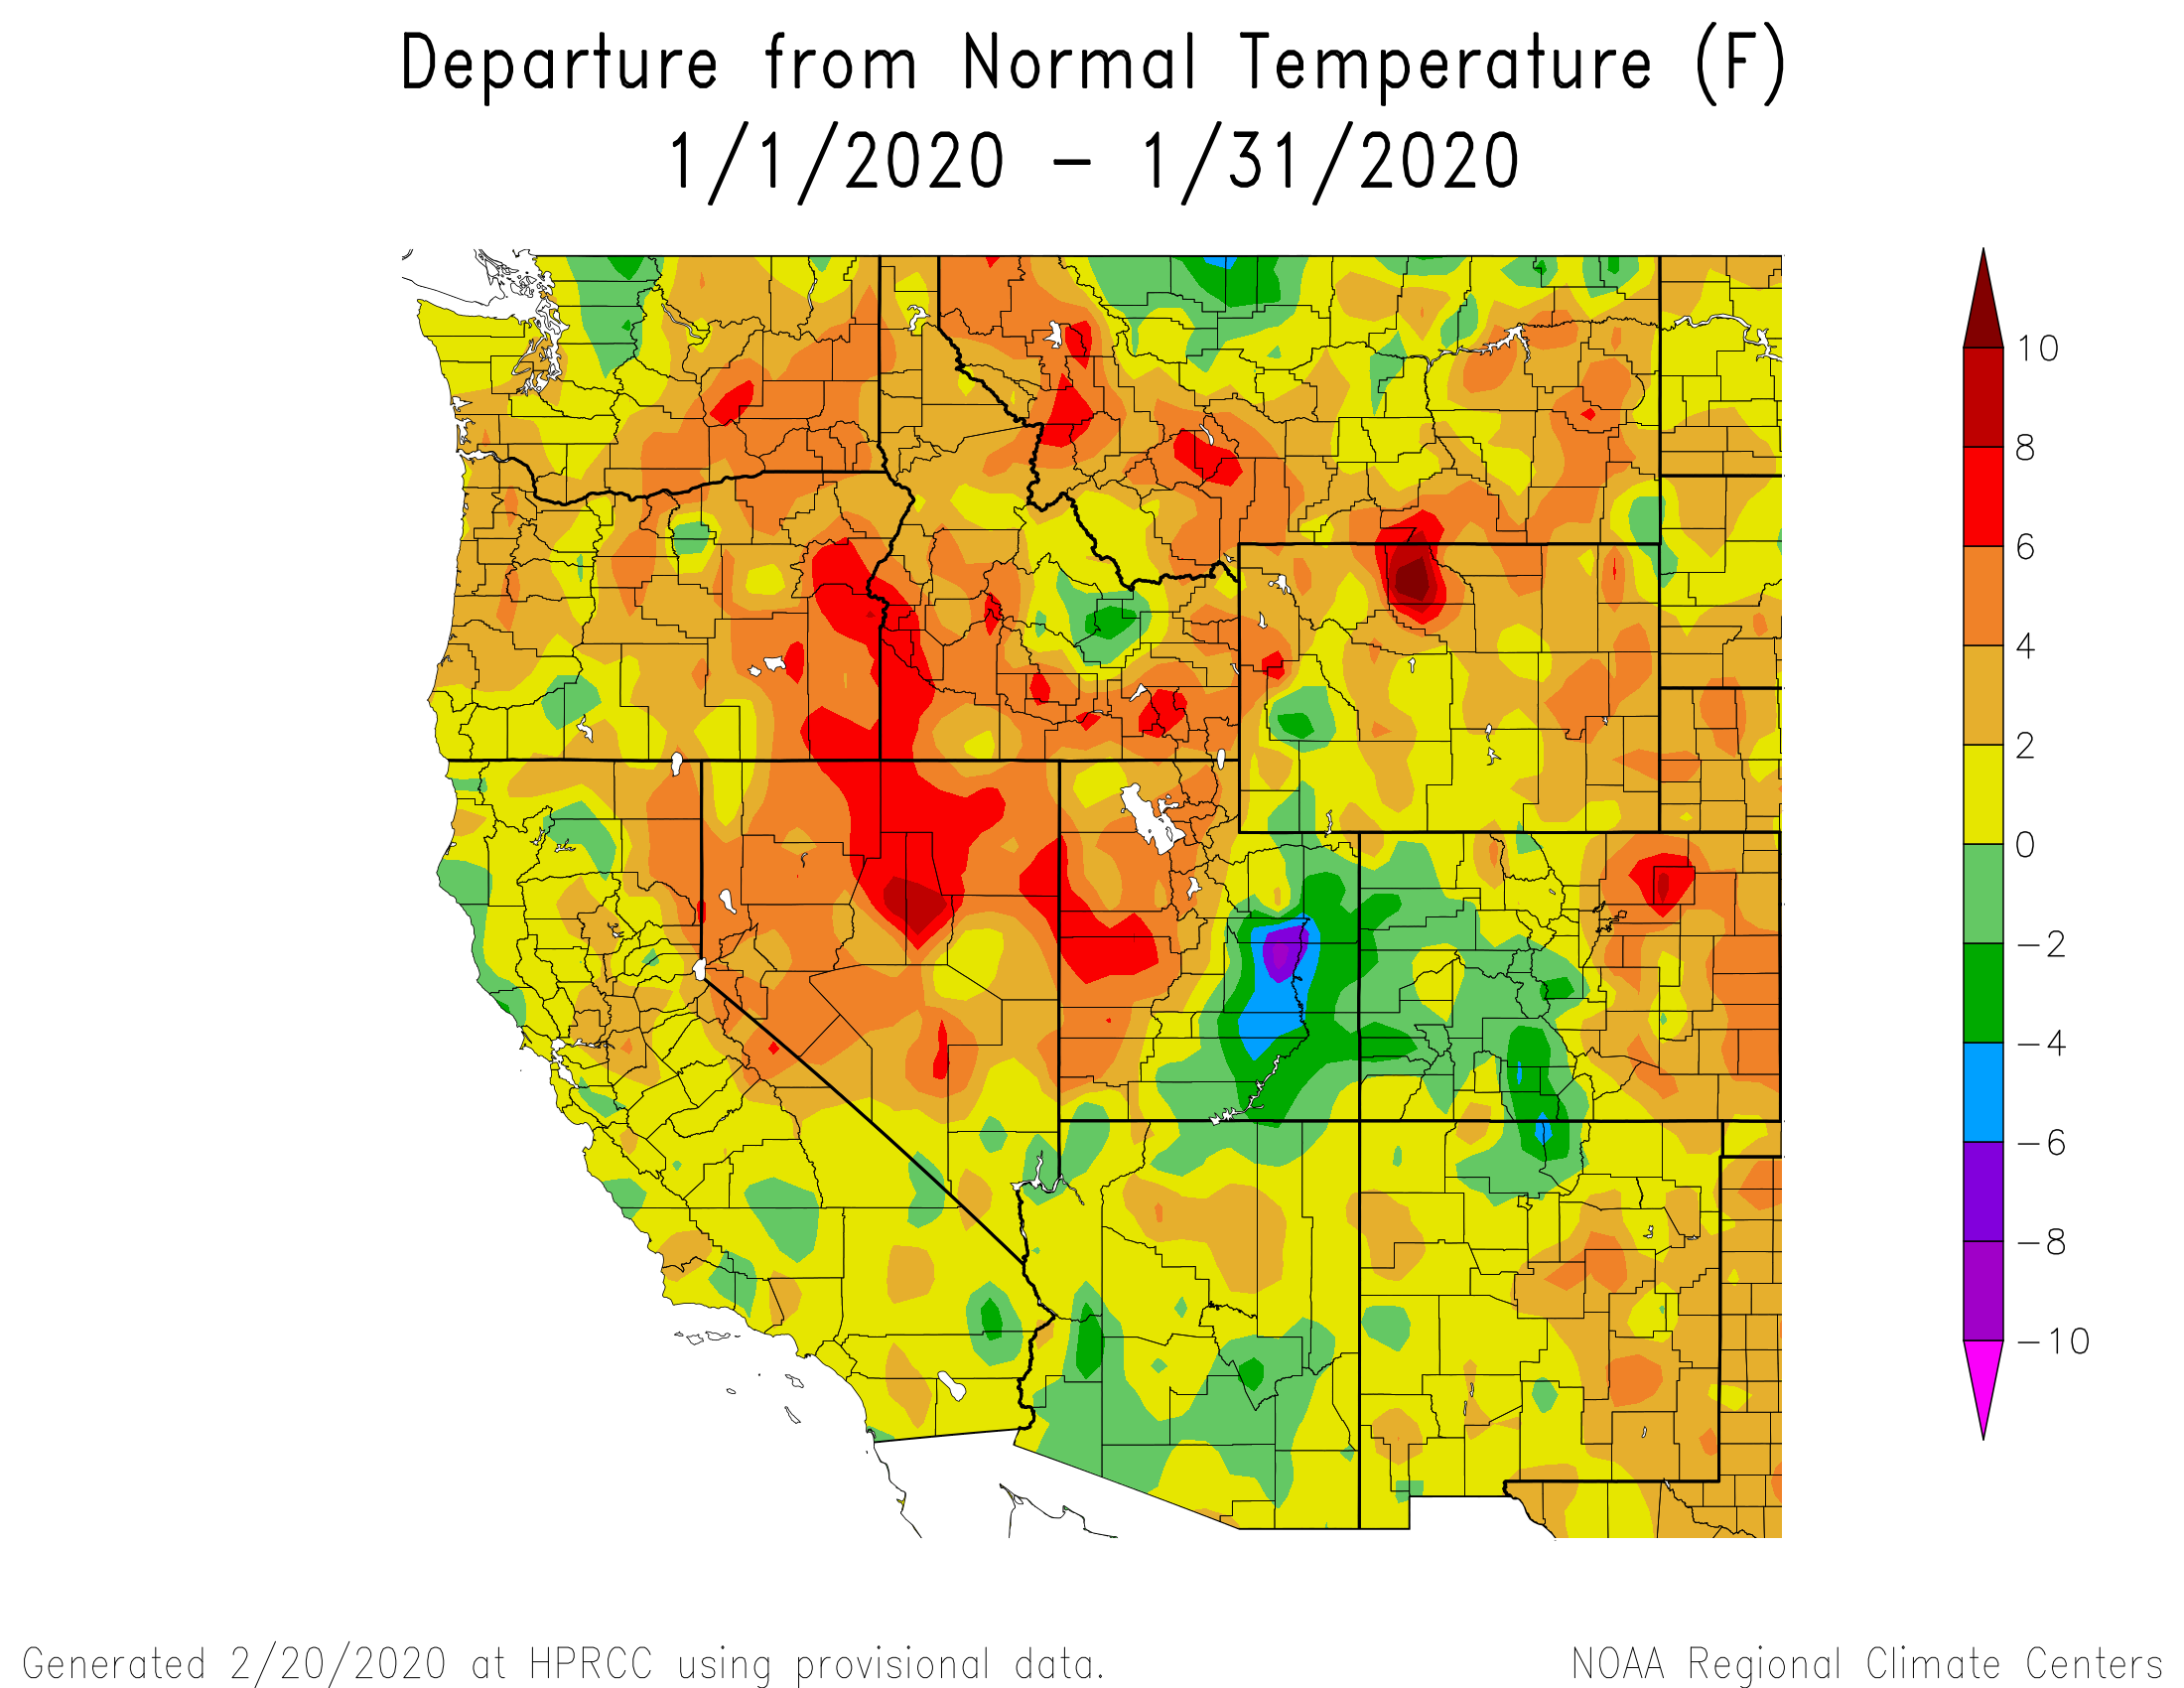
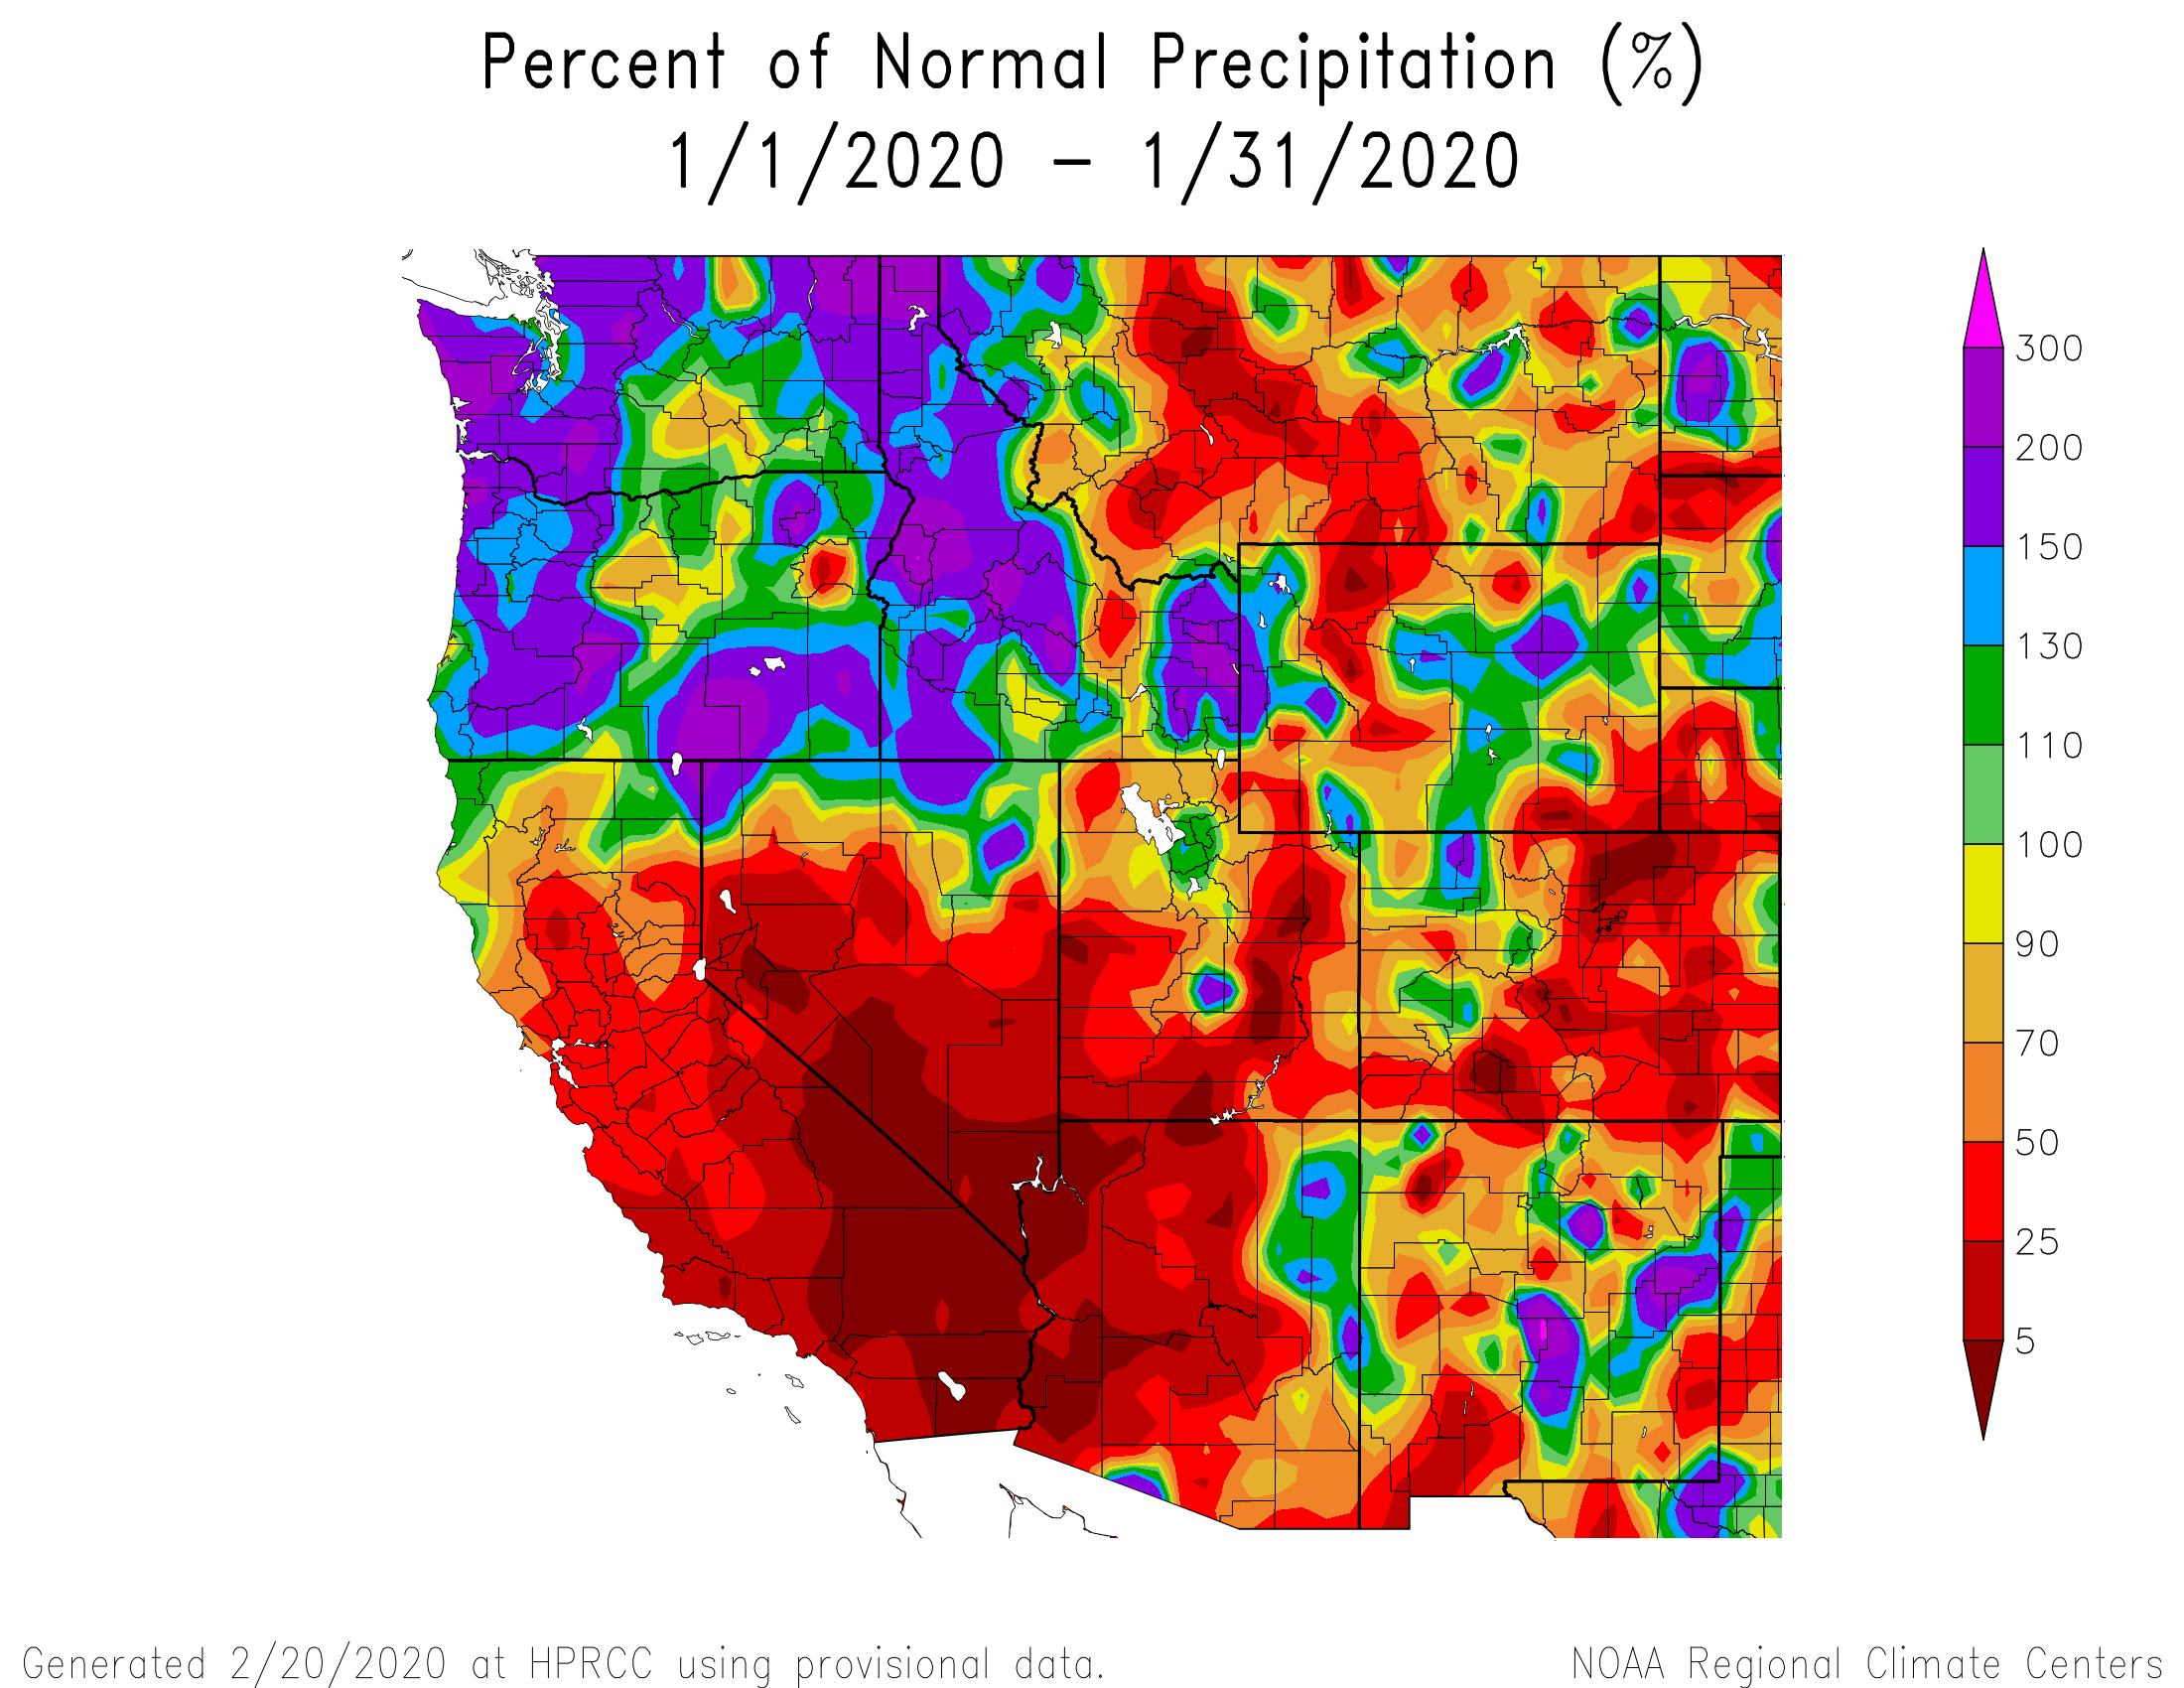
Precipitation in January was less eventful than December. Most regions in the state received near to below average precipitation for the month; SBB was barely included in that category with 107 mm (4.2”) of SWE observed with the average being 116 mm (4.6”). We issued 4 storm reports for the month. The first of which, Storm #9, began with the New Year on January 1 and was accompanied with impressive precipitation intensity of 9 mm/hour leaving 24 cm (9.4”) of snow at SASP. January did not see any more significant precipitation until the second half of the month when Storm #10 began on January 16 delivering 13 mm (0.51”) of precipitation as 17 cm (6.7”) of snowdepth. This storm was just enough to qualify as a storm, but winds were impressive with hourly average speeds at Putney over 40 mph. This windy storm was also the culprit of our first observed dust on snow event for WY2020. Storm #11 came 5 days later with 27 mm (1.1”) of precipitation as 31.8 cm (12.5”) of snowdepth. A final storm on January 27th produced 12 mm (0.47”) of precipitation as 20.7 cm (8.1”) new accumulation. These four storms totaled 93 cm (36”) of snow, and brought the depth of the snowpack up to 1.75 m (68.9”) at SASP. Of note for the month of January was the wind, which did an excellent job of scouring slopes and redistributing snow cover in all of Colorado’s mountains. Despite below average precipitation for the month, SWE across the state was above median by the end of January, and no changes were made to drought conditions.
February Weather Summary
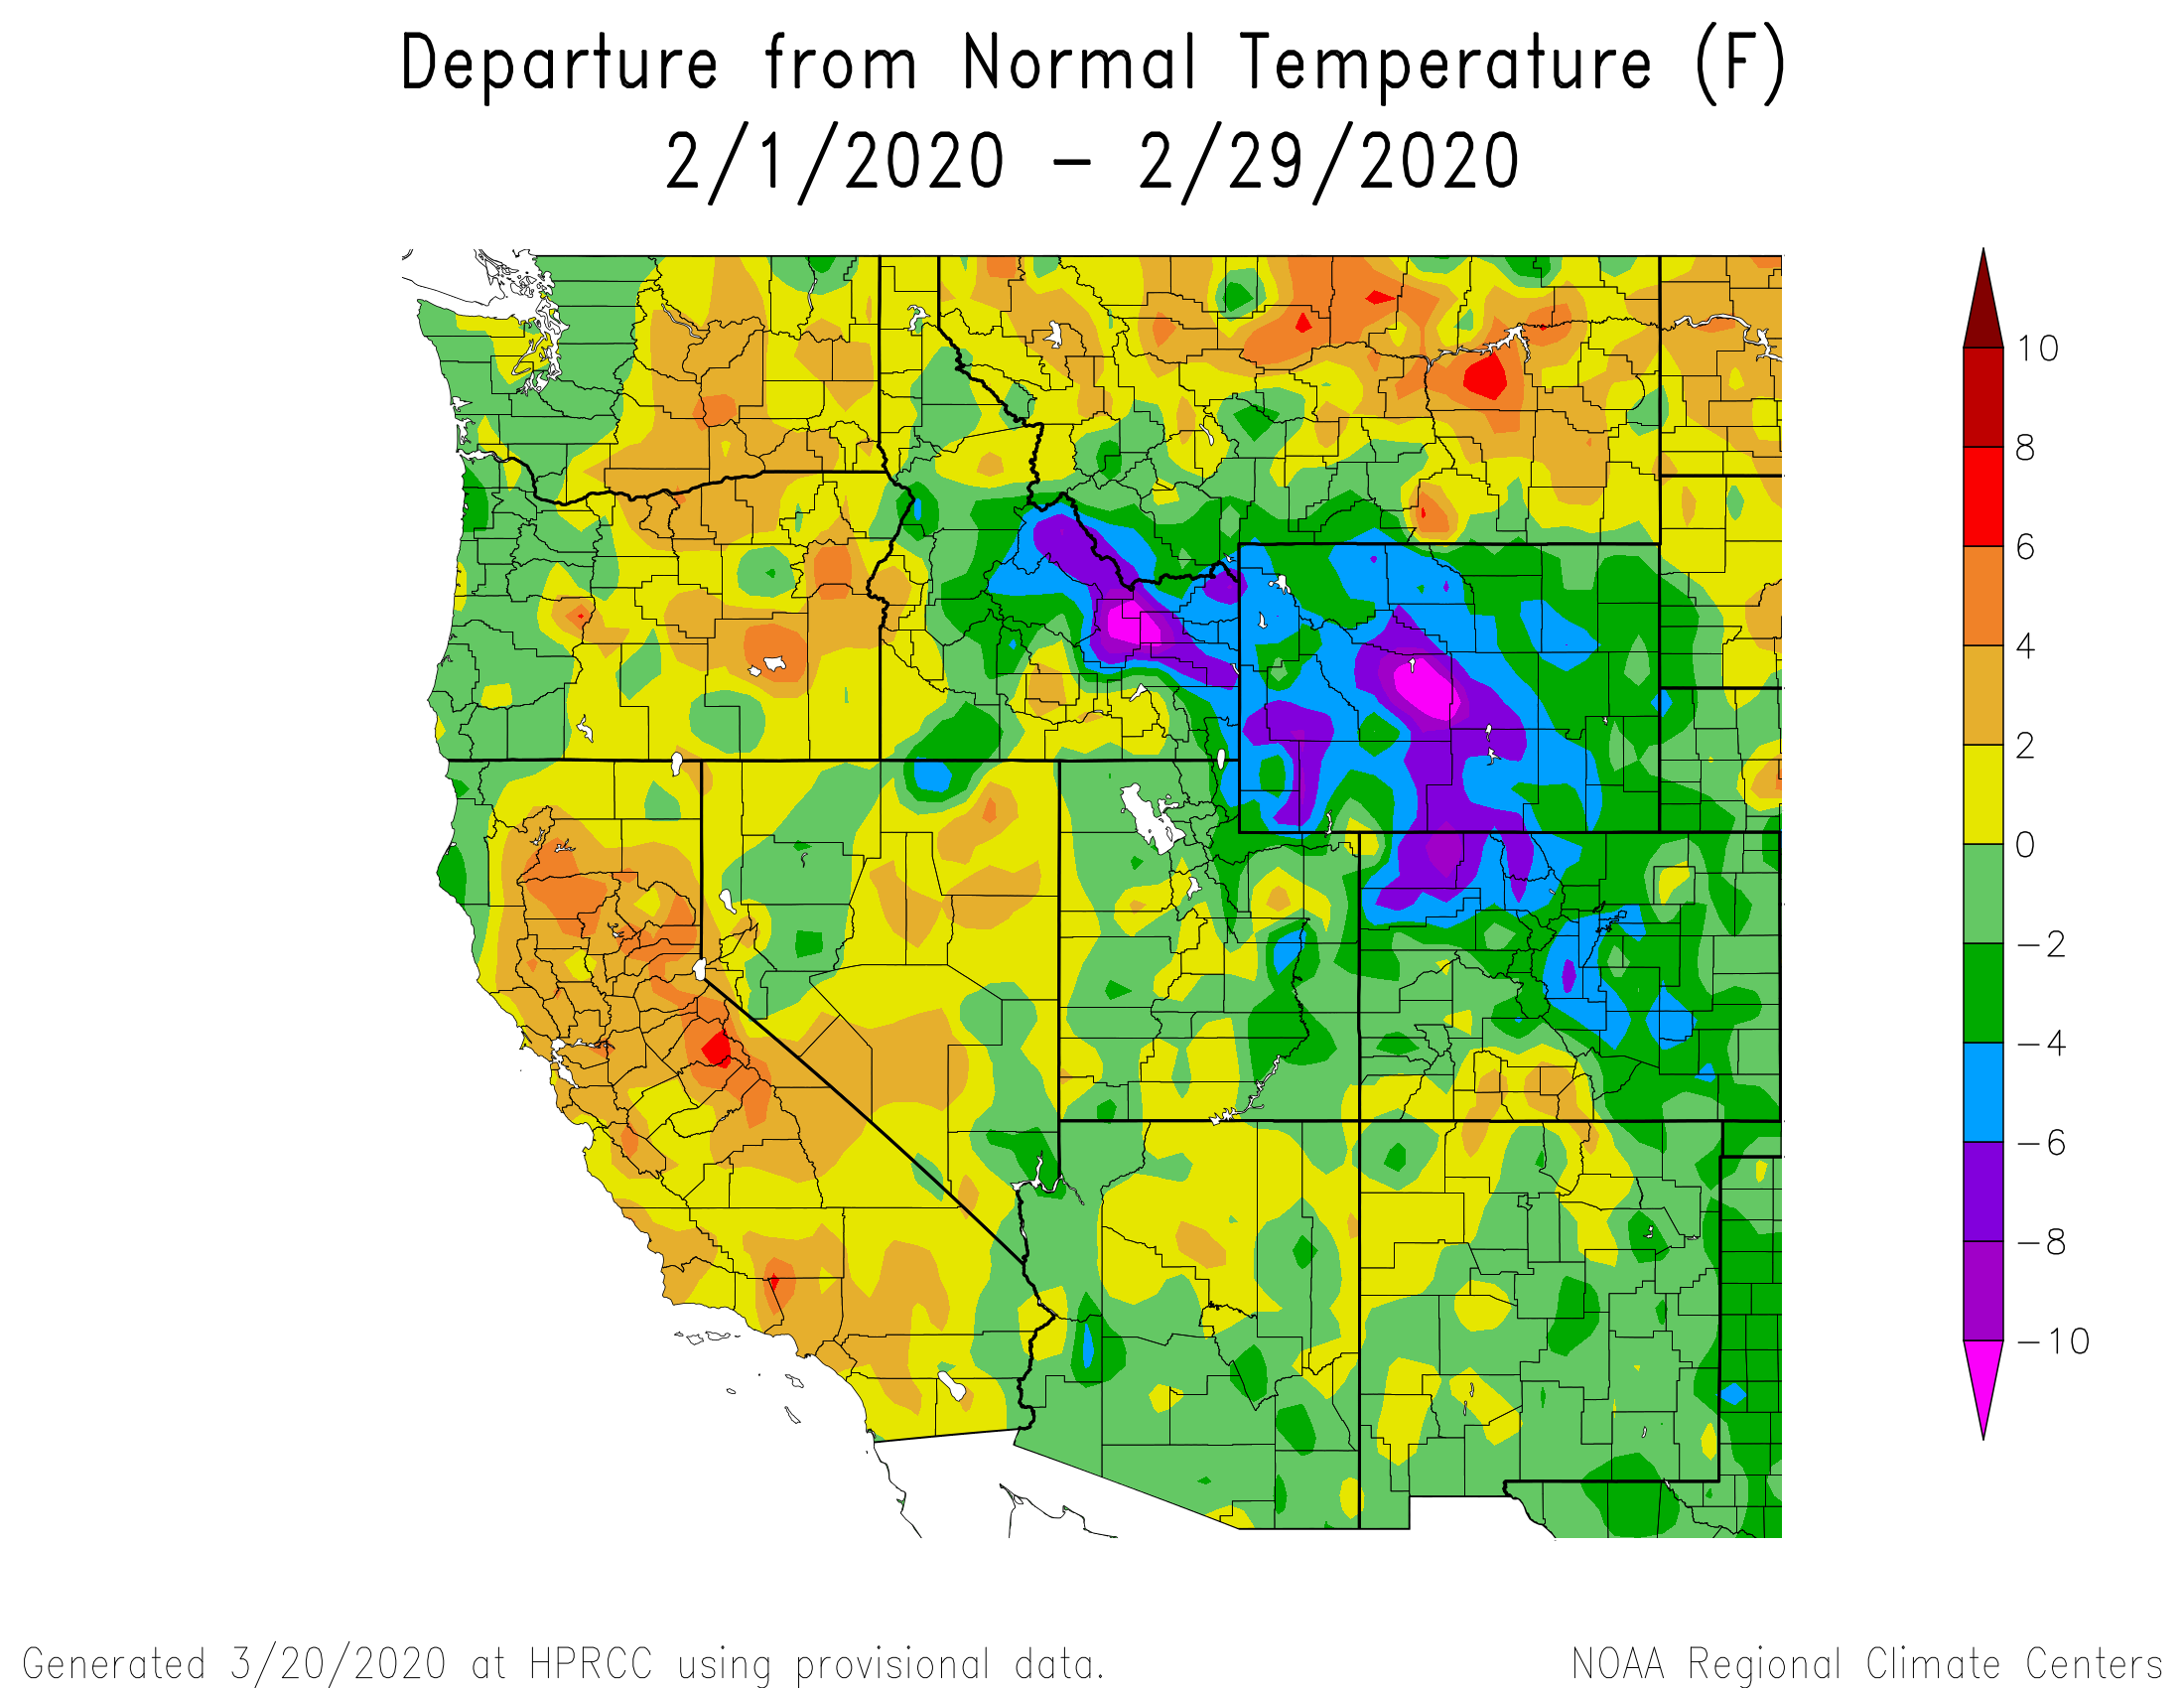
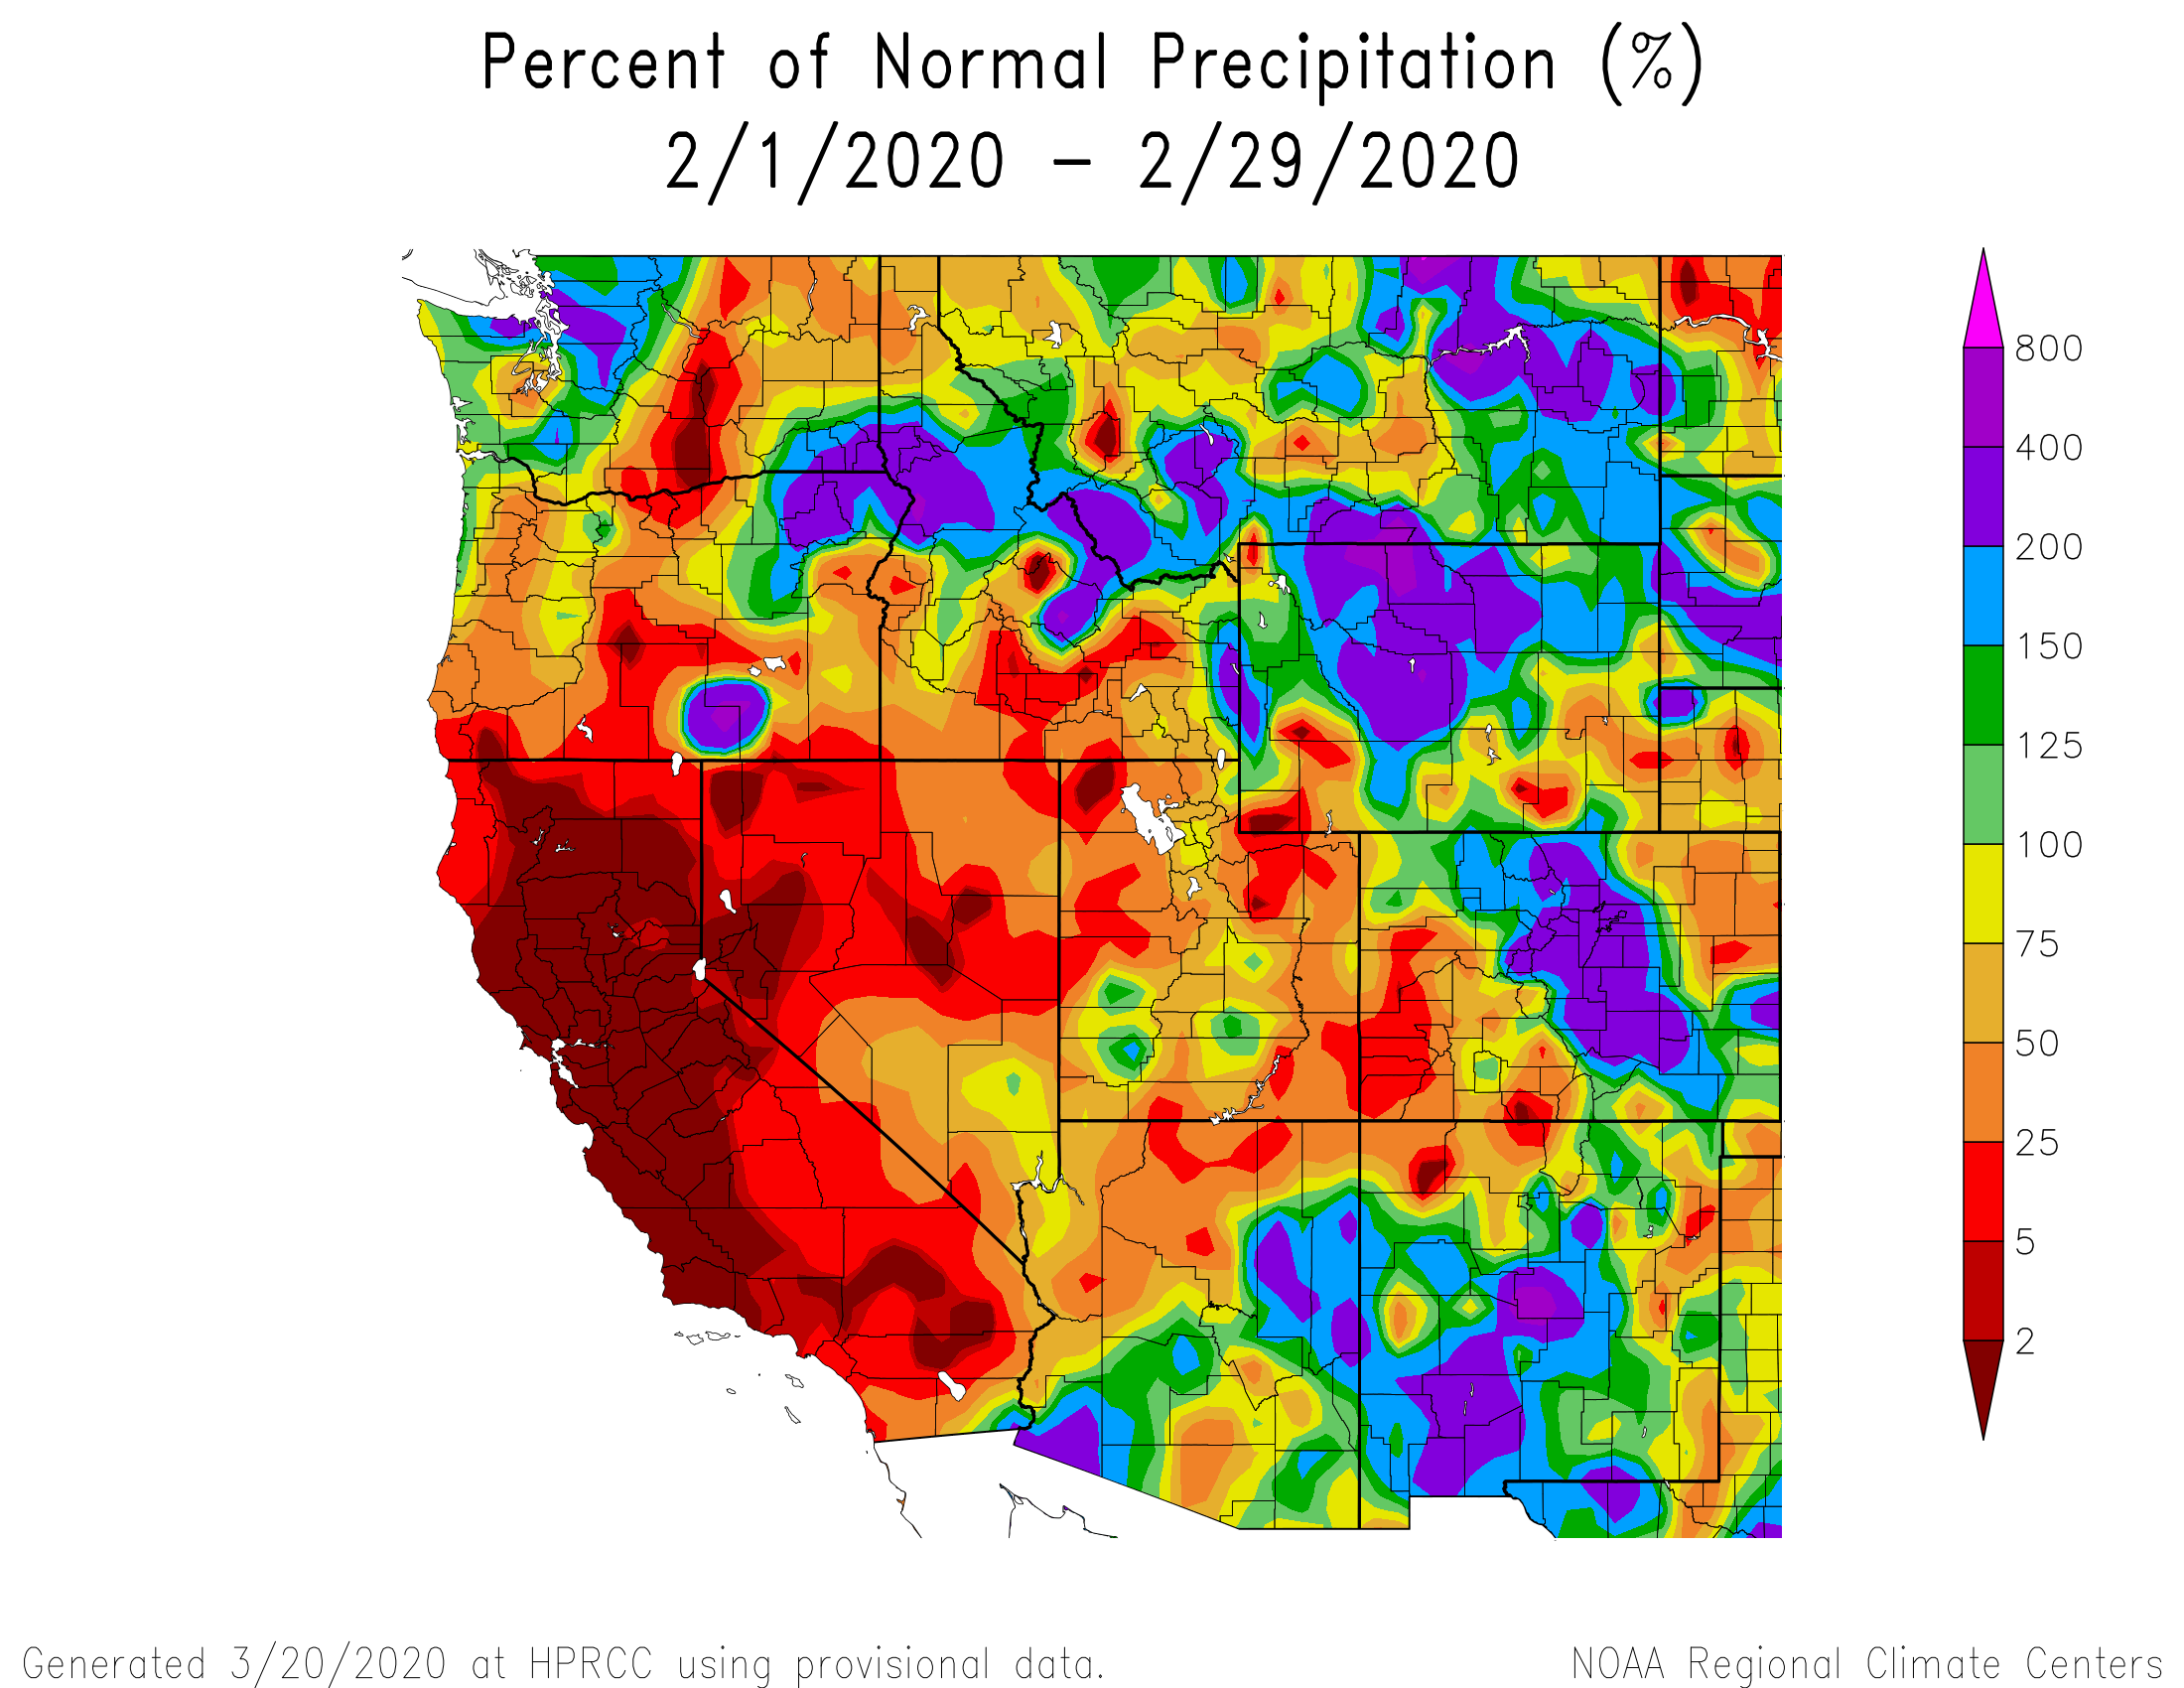
After a flat January, February started off with a climate outlook favoring above average precipitation with the support of an atmospheric river. This event settled in and precipitation began on February 6th. It delivered nicely for the Northern Mountains and Central Mountains, with the Columbine SNOTEL on Rabbit Ears Pass setting a 24-hour record of 2.9” of SWE. Independence Pass SNOTEL saw an impressive accumulation of 2.5” of SWE over 3-days. This Northwesterly event was not as productive in the San Juan Mountains with 1.8” of SWE observed at SASP for this Storm #13. The remainder of the month was mostly dry, with one more storm February 22 adding 15 mm (0.6”) of precipitation at SBB. Unfortunately, the flat January led to an even dryer February, with total precipitation in SBB at 96 mm (3.8”) down from the 114.4 mm (4.5”) average. Nonetheless, the atmospheric river was a huge benefit and the month ended with SWE slightly above average values in all river basins. The meteorological winter has played itself out. Overall it was not nearly as note worthy as WY2018 or WY2019 by being neither incredibly dry or incredibly stormy. The drought outlook supports persistence of drought conditions and the climate outlook shows below average precipitation with above average temperatures. March at SBB typically sees slightly less precipitation than other winter months and more dust events. Let’s hope for a change from normal.
March Weather Summary
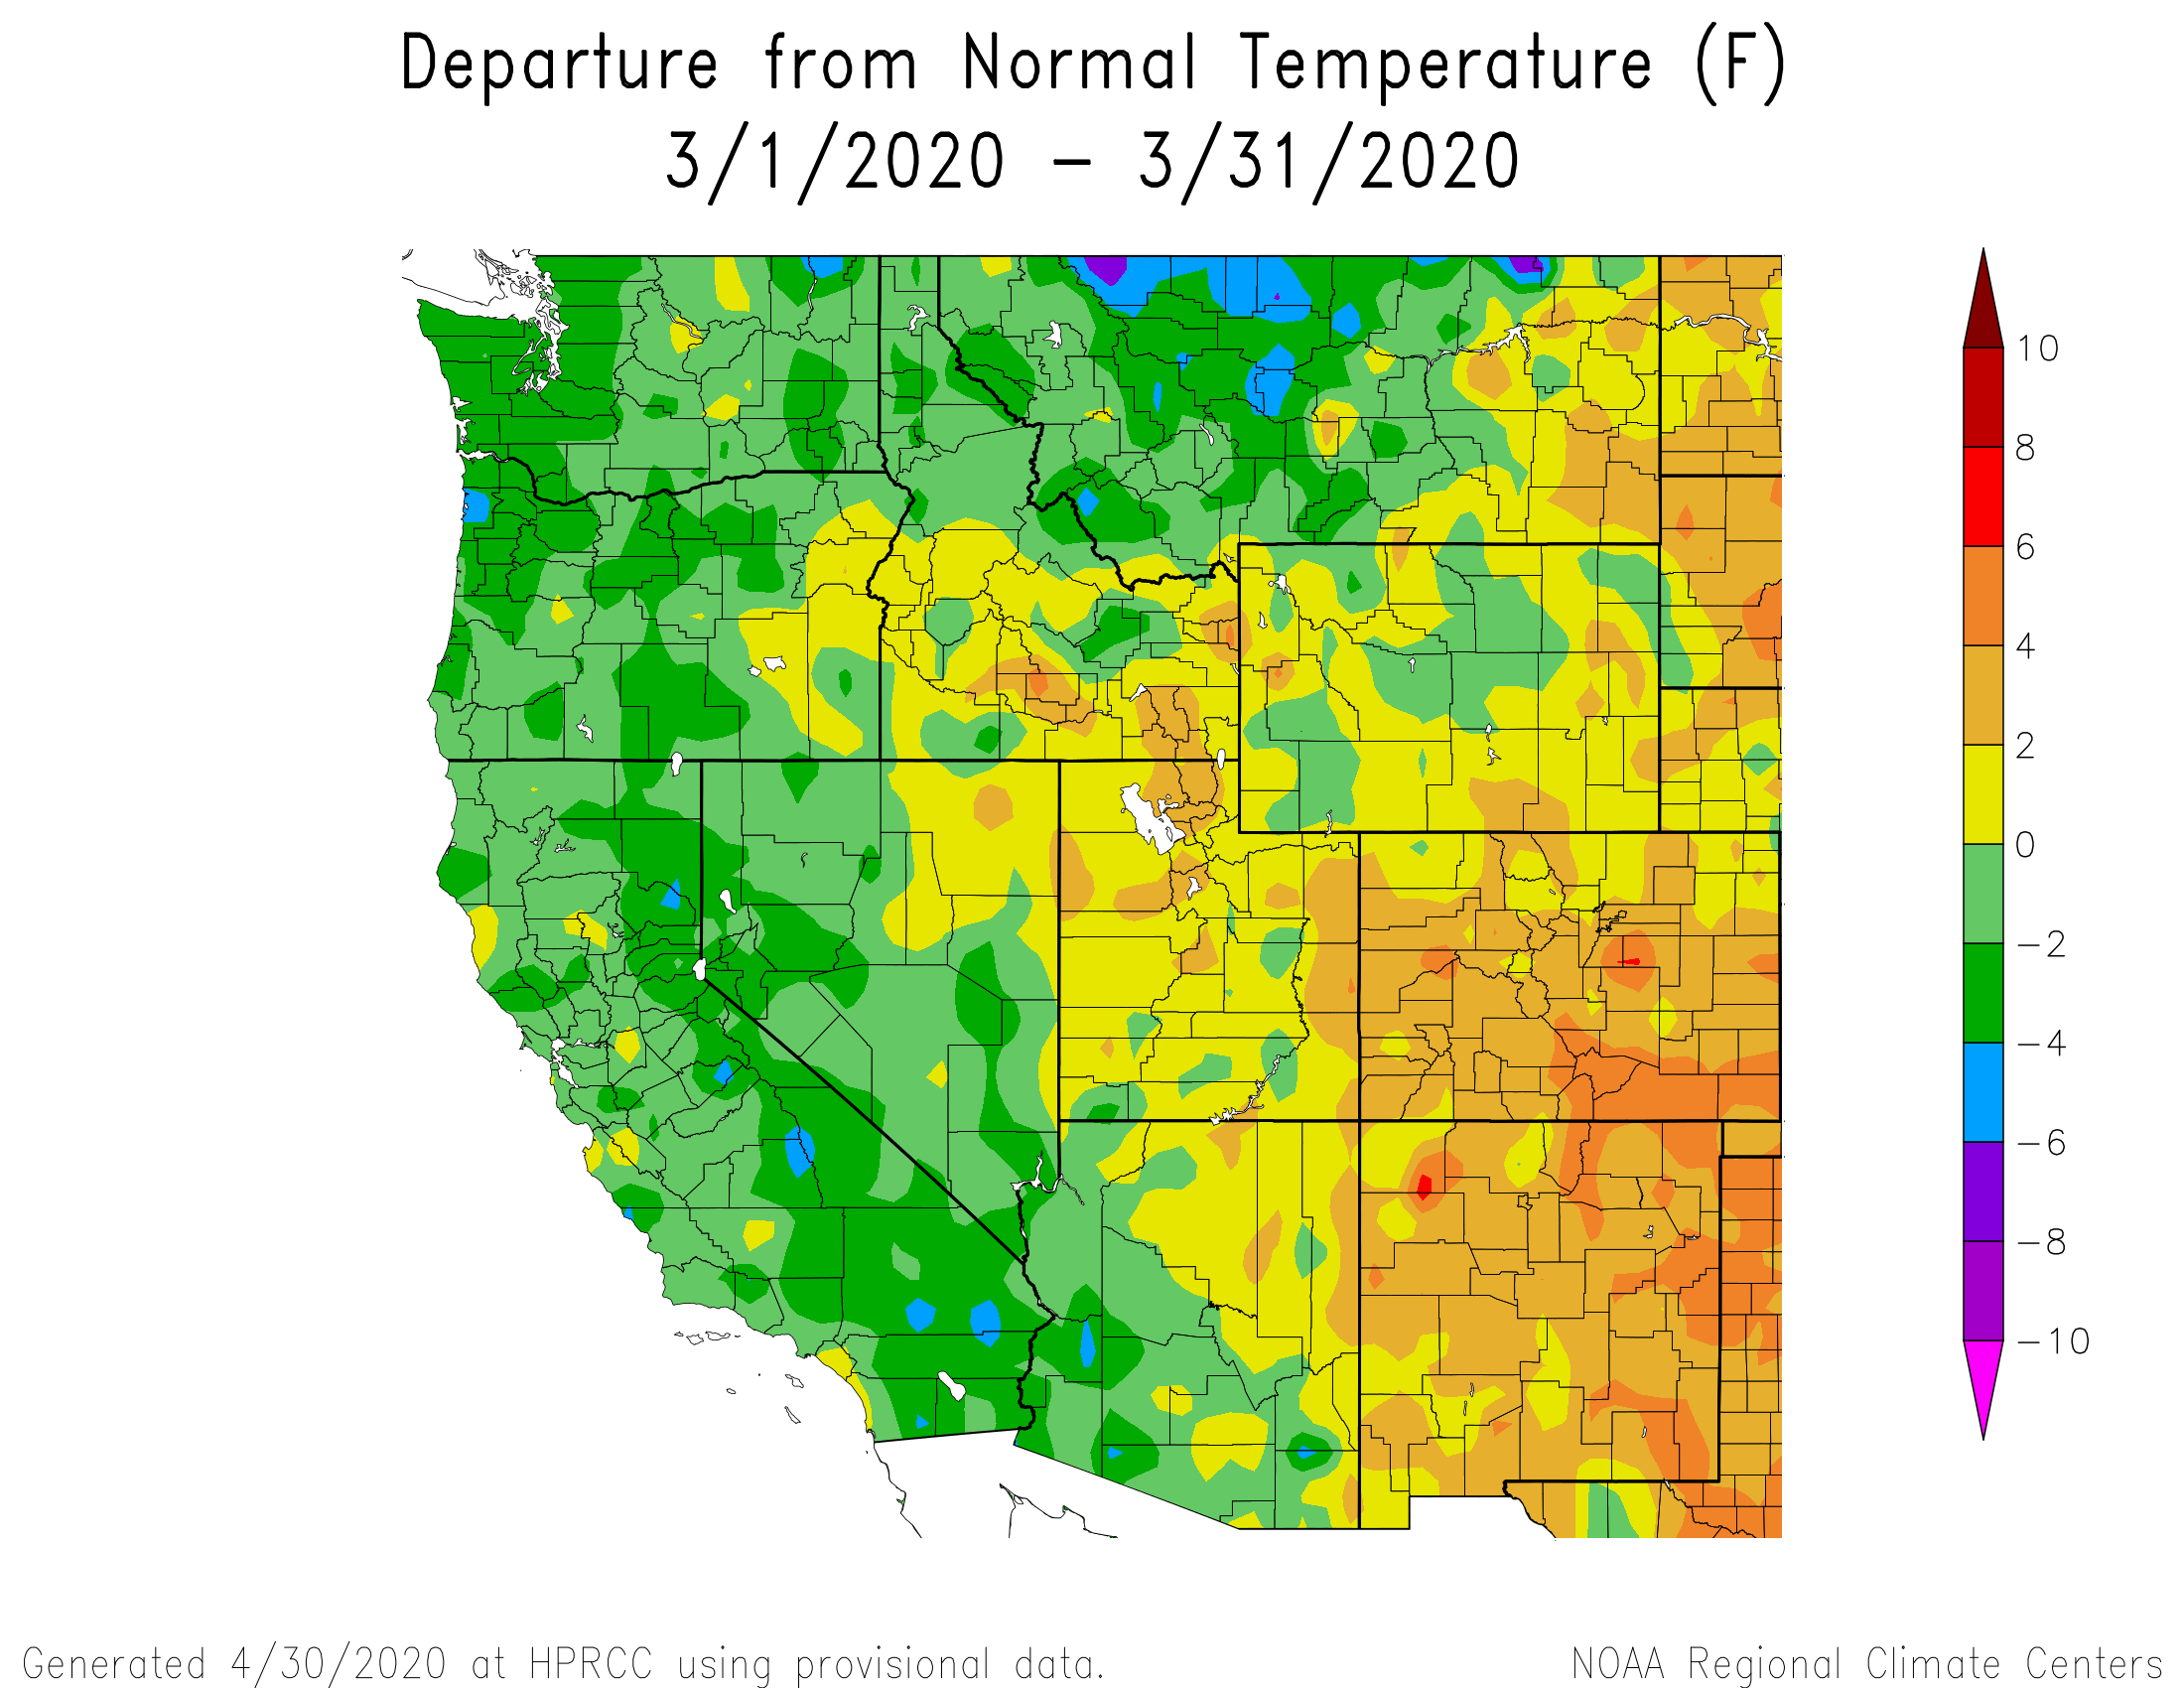
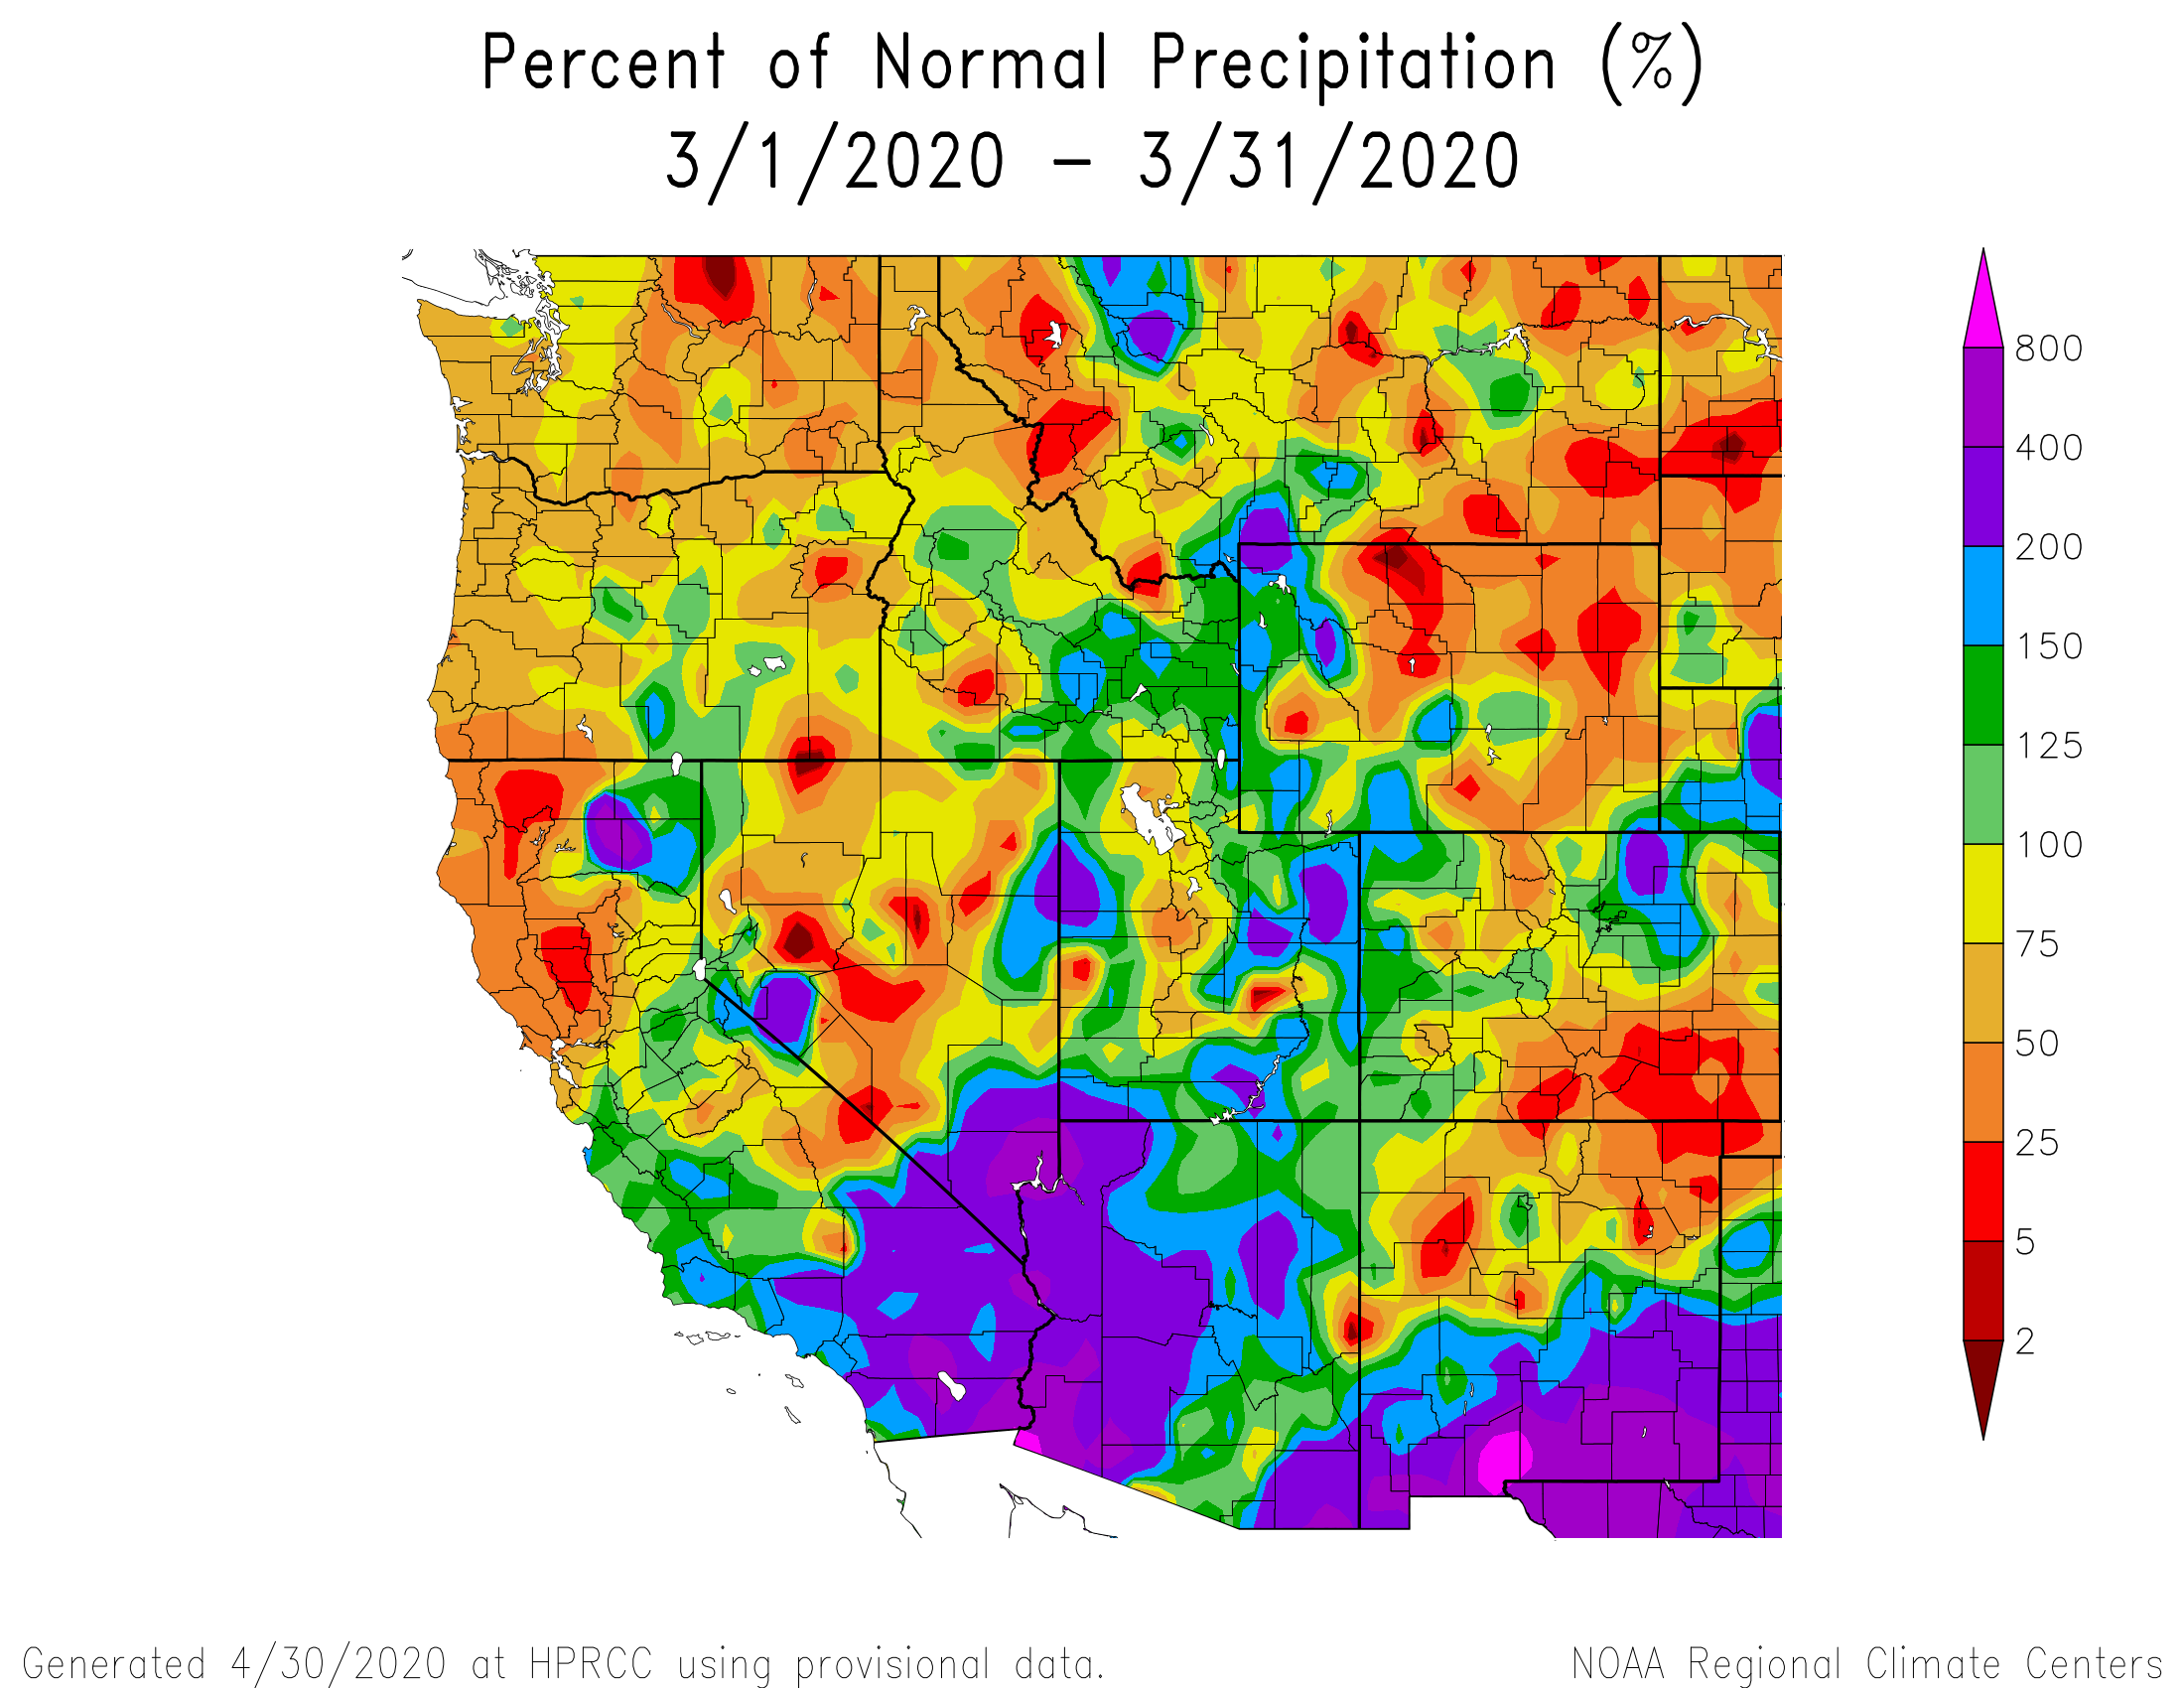
March was a good month for precipitation at SBB. We recorded 3 storms totaling 120 mm (4.7”) of precipitation. Storm count was slightly below normal (average is 3.3), but precipitation total was up (average 111.6 mm). The month of March saw one dust event (D2) on March 26. The storms came from March 13 through the end of the month with a notable snowfall event March 18-22 that left about 61 cm (24”) of accumulation on Wolf Creek pass as well as on the Uncompahgre Plateau. Overall temperatures were slightly above normal throughout Colorado, but a near normal month had left SWE totals near average or a good bit better statewide. It seems surprising to say normal after the exceptional winters of 2018 and 2019. Our Colorado Dust-on-Snow tour began this month. Overall, we observed more dust in the southern part of the state but not too bad in terms of severity. More information can be found here. The climate outlook is for a moist and cool April. The adequate snowpack combined with light dust thus far should enable our mountains to hit a normal peak SWE at a near average timeframs and hopefully we’ll see a typical ablation period.
April Weather Summary
April was dry with just one winter storm and a monthly total of 59 mm (2.3”) precipitation, as opposed to the average of 3.5 winter storms and 116.7 mm (4.6”) precipitation. Despite the below average precipitation the month did have 12 days with measurable precipitation; not too far behind SASP’s April average of 14.8 days with precipitation. In addition to the below average precipitation temperatures were above average for much of the Central/Southern Colorado Mountains and much of the Inner Mountain West. On a basin-wide scale across the state respective peak SWE was achieved at near normal amounts within several days of median. At SASP in SBB we observed peak SWE to be slightly later than normal occurring on April 13th and totaling 687 mm (27.4”) of SWE. In addition to peak accumulation and the beginning of melt season, we also observed dust event #3 in the mountains around Silverton in line with a storm on on April 2.
May Weather Summary
Another one storm month. May saw SBB’s final winter storm of WY2020 (once greater than 50% of snow cover is depleted we say winter is over for our record keeping). Storm #19 on May 11 produced 12 mm (0.5”) of precipitation as a dense 0.5” of snow. As can be expected the SBB precipitation statistics fell well below average in May, with total precipitation of 29 mm (1.1”) over a total of 5 days compared to the monthly average of 78.4 mm (3.1”) with typically 11.8 days with measurable precipitation. One variable was above average, 19 mm (0.75”) of precipitation fell as rain compared to a monthly average of 8.4 mm (0.33”). These trends at SBB were generally in line with what was typical statewide; above average temperatures and below average precipitation. In addition to the weather, we observed all dust layers merged at SASP on May 19. With warm temperatures and a bottomed-out albedo melt rates were about 1”/day for the second half of the month. With these melt rates winter left Senator Beck Basin, with snow all gone at SASP, on May 27.
June Weather Summary
Snow was gone at Senator Beck Study site (12,200’) on June 3, roughly 21 days earlier than normal. The month of June is by far the driest month of the year in our record books. This June was a bit wetter than the norm at SBB but that seems to be an outlier as most of the state, besides a few pockets, were considerably drier. At SASP, a couple days before June 0.6” precipitation fell as snow. From June 5-8 1” of rain was a welcome sight as was 0.83” precipitation as snow on June 9. June 13 saw 0.3” of rain and that was about it for the month. Total precipitation amounted to 60 mm (2.36”).
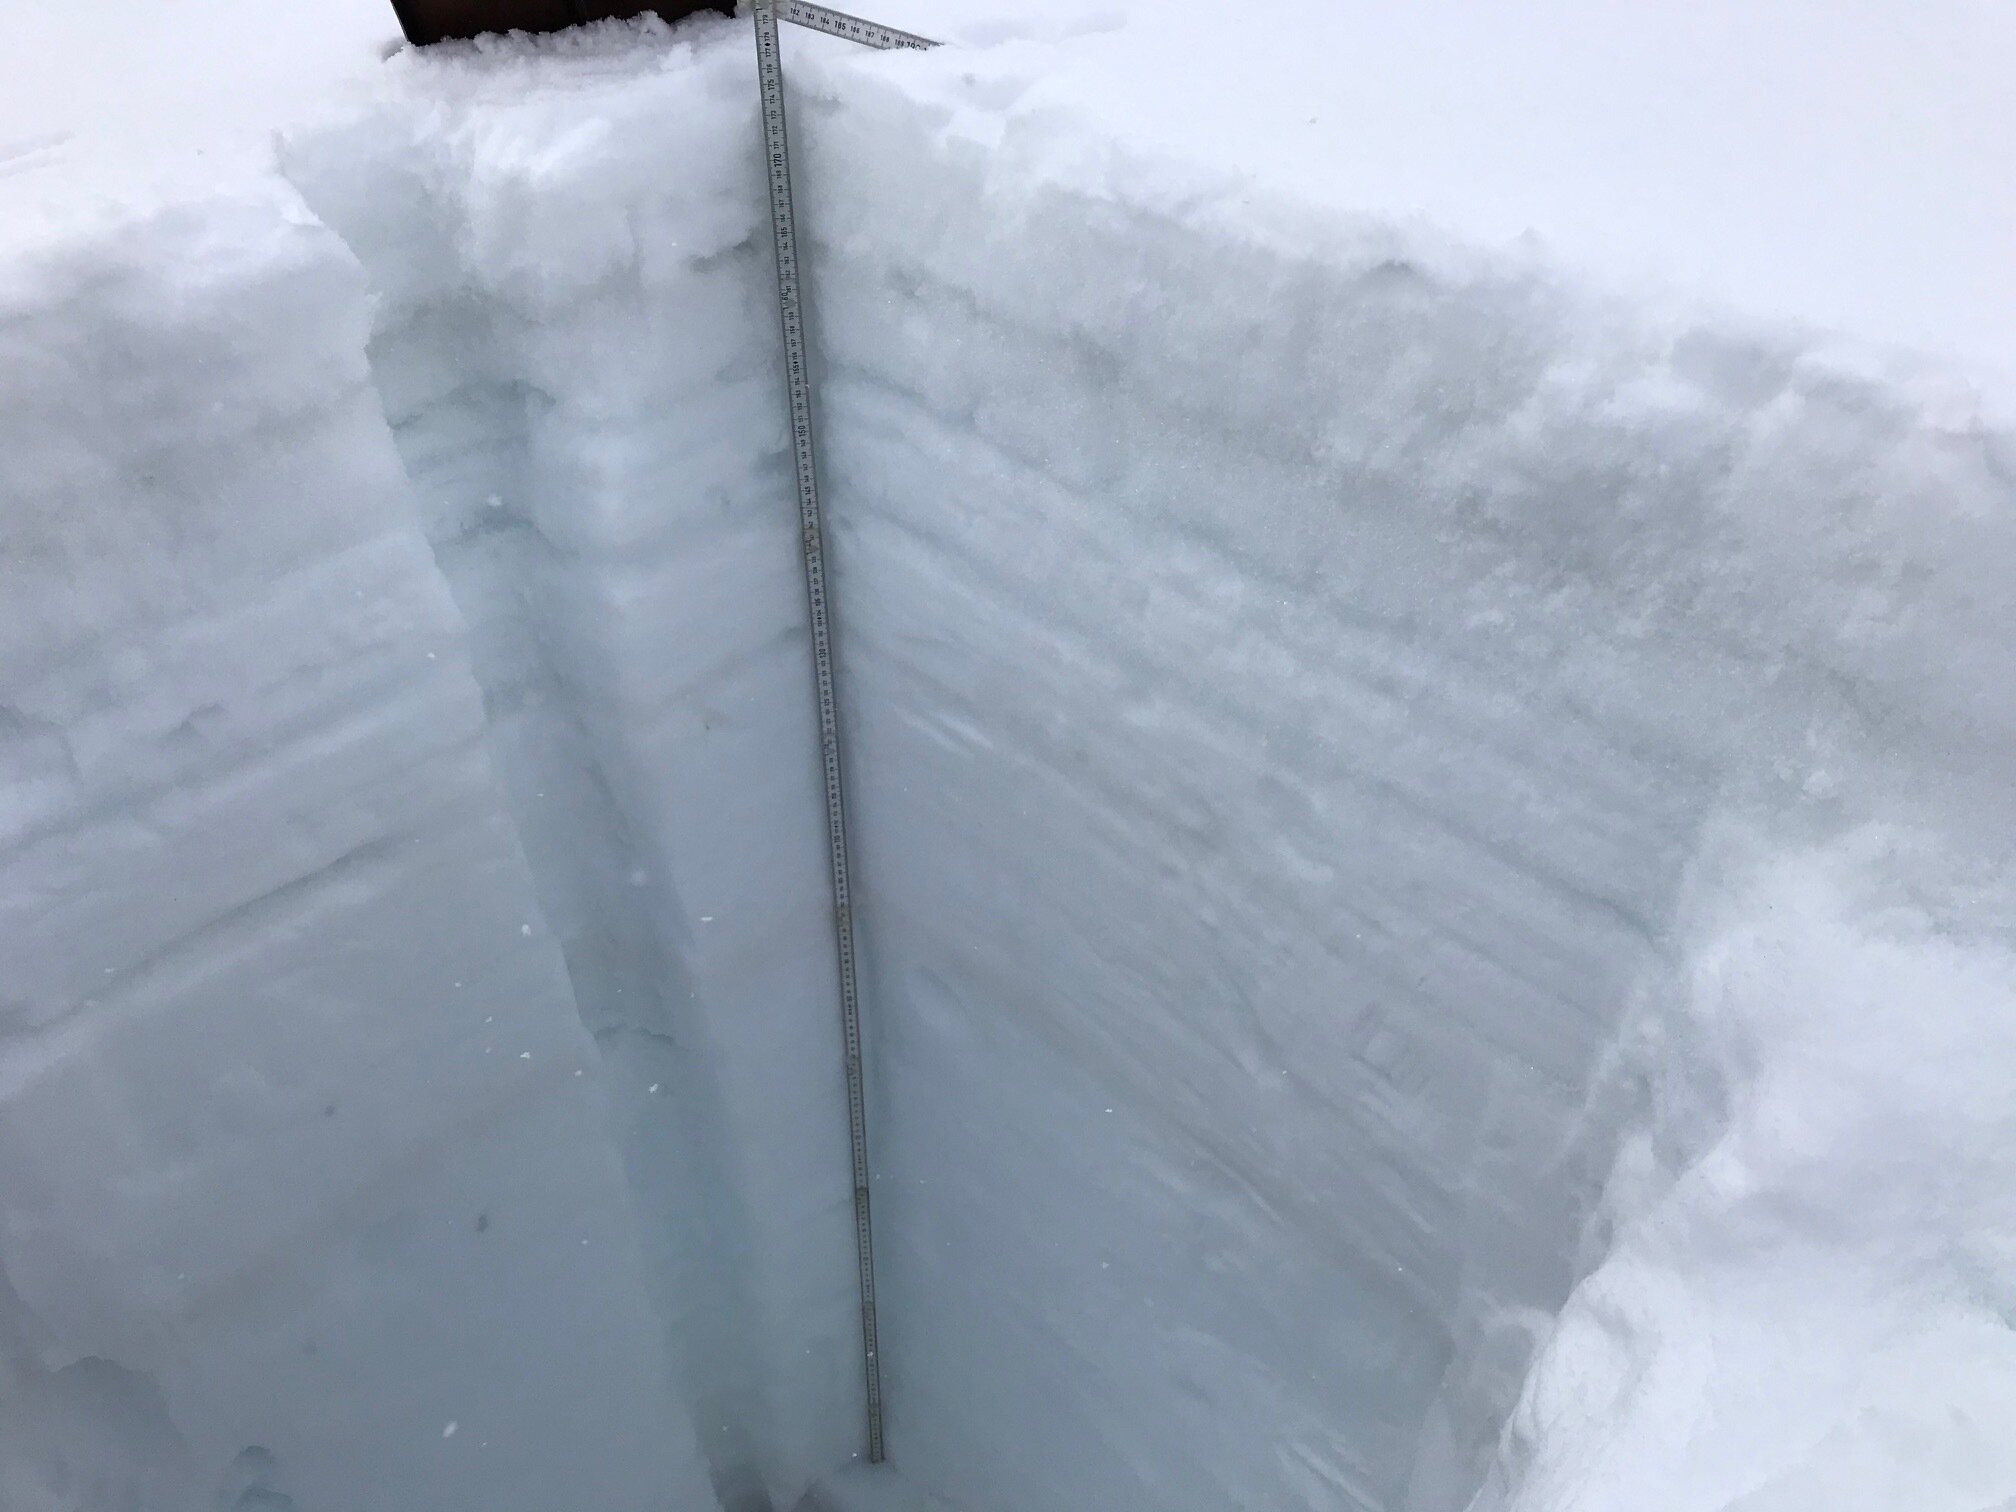
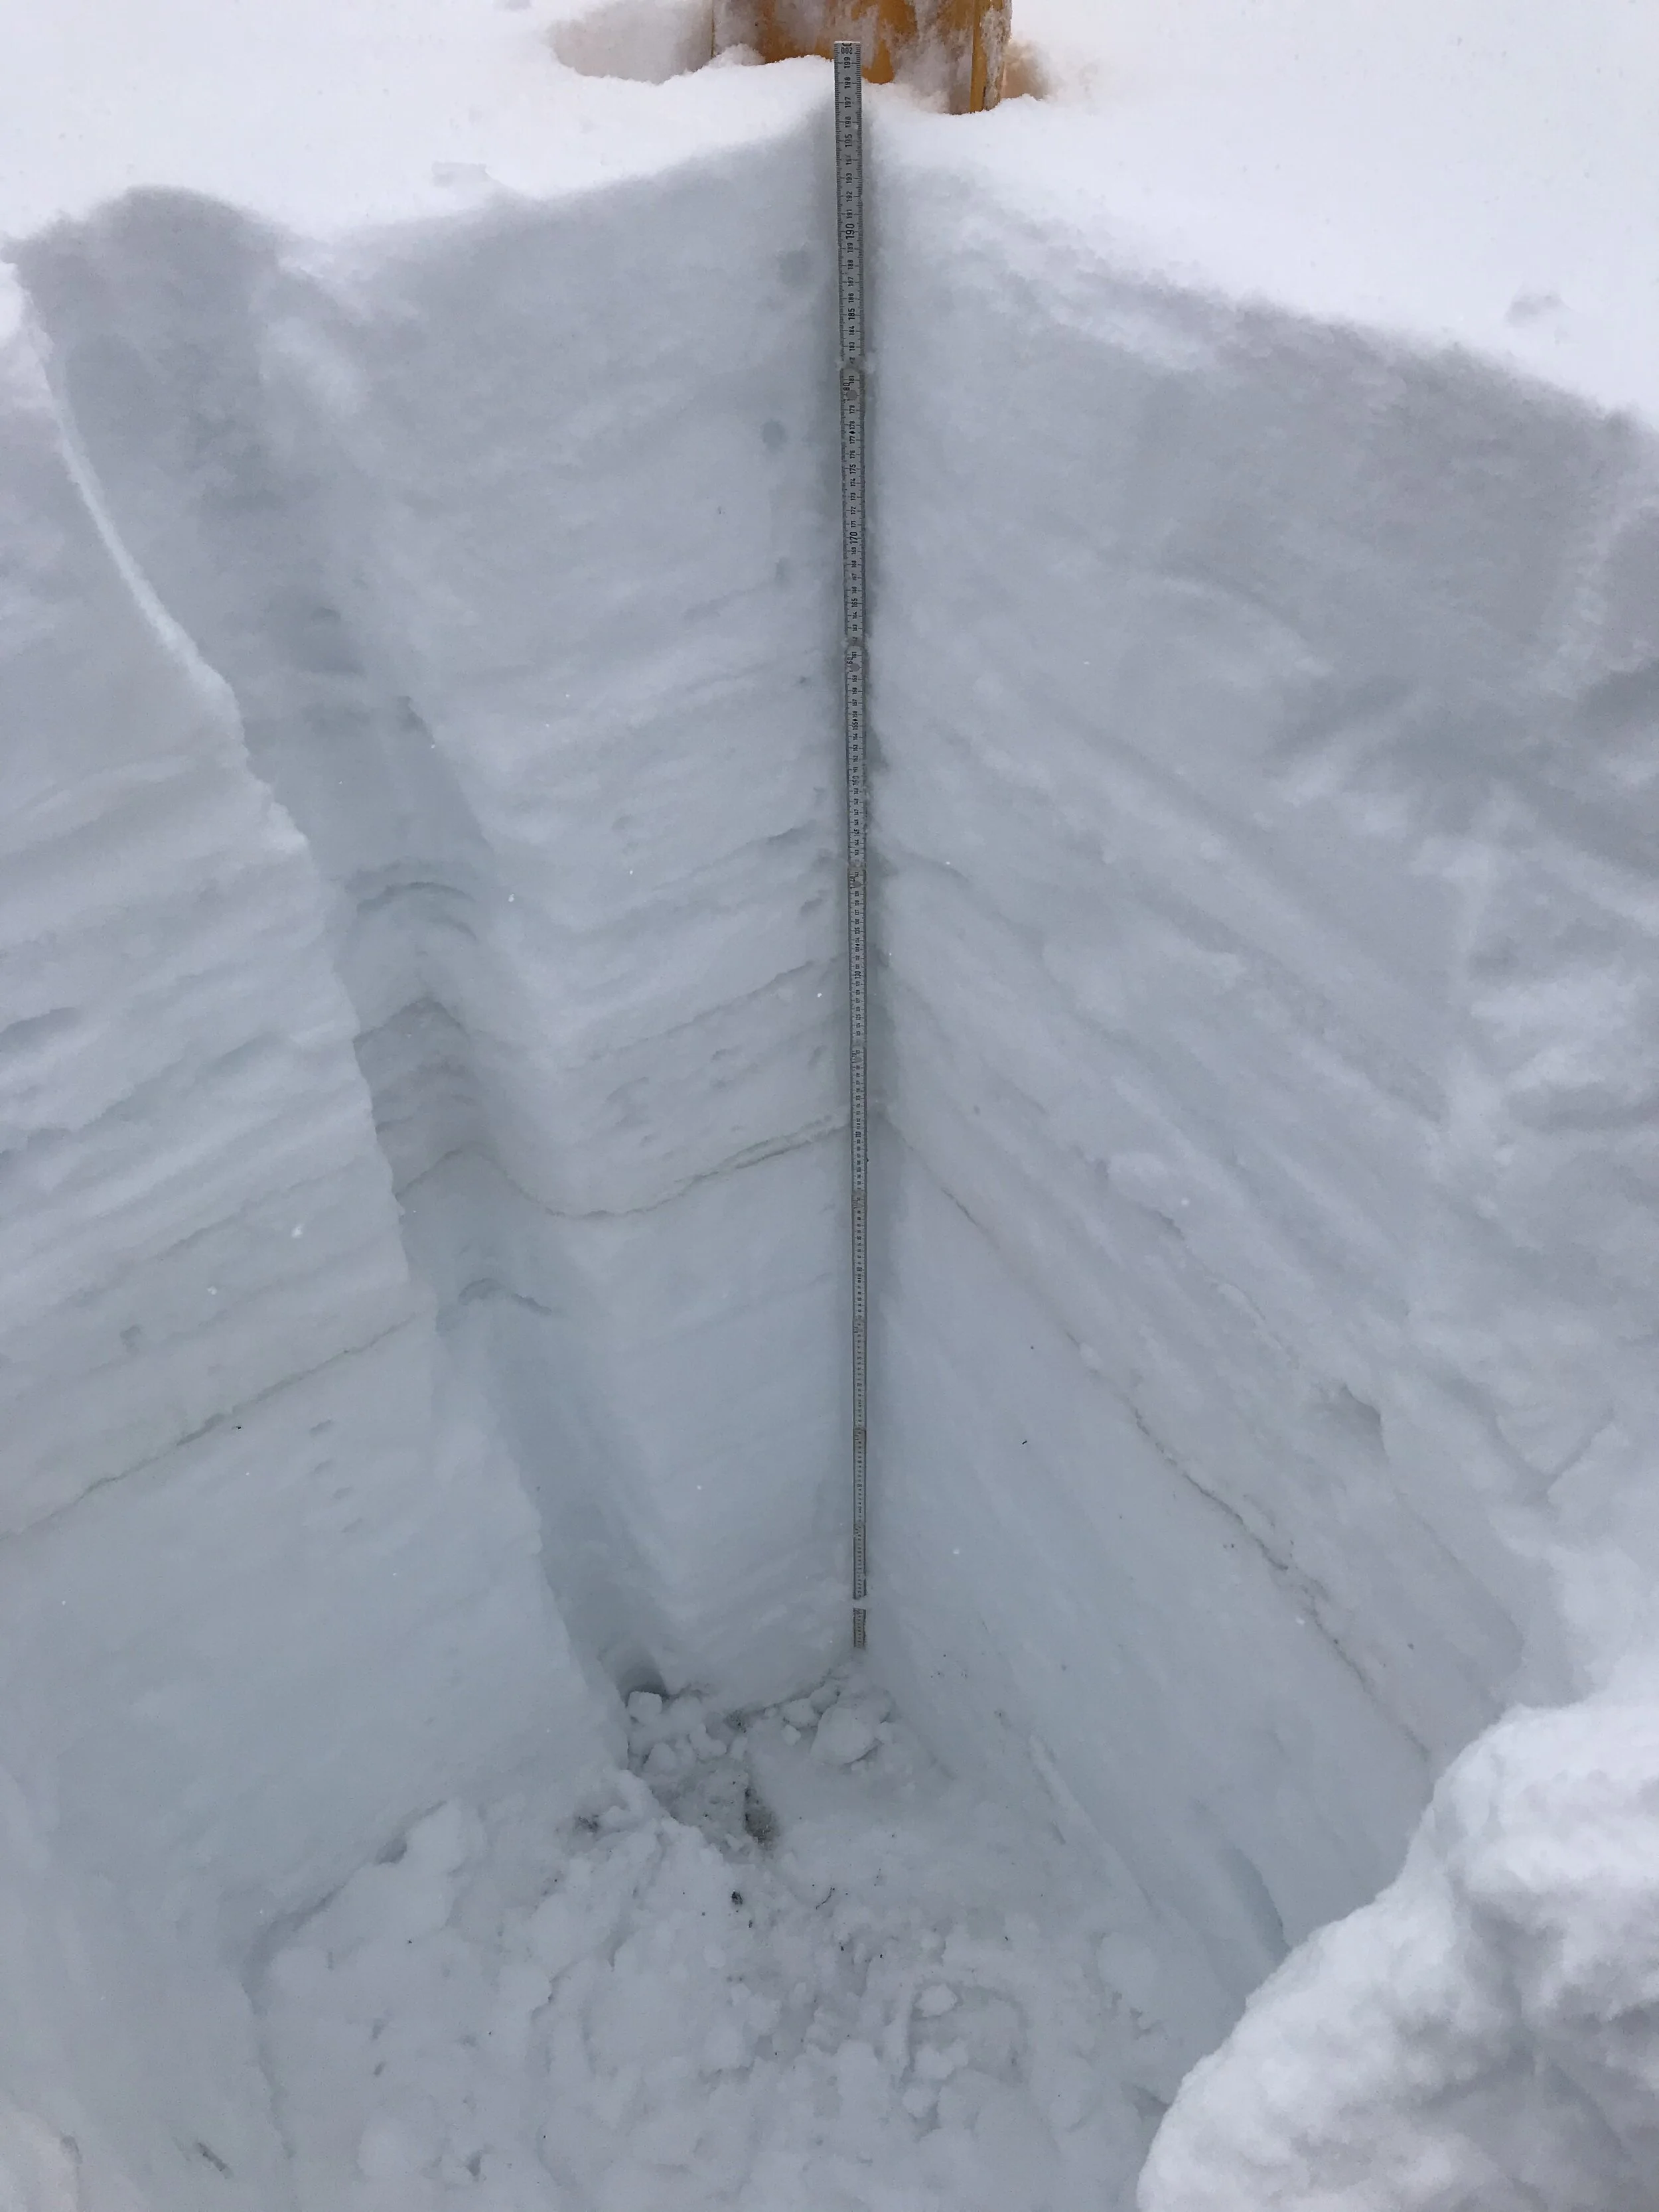
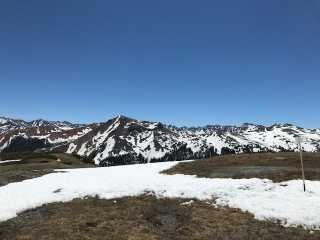
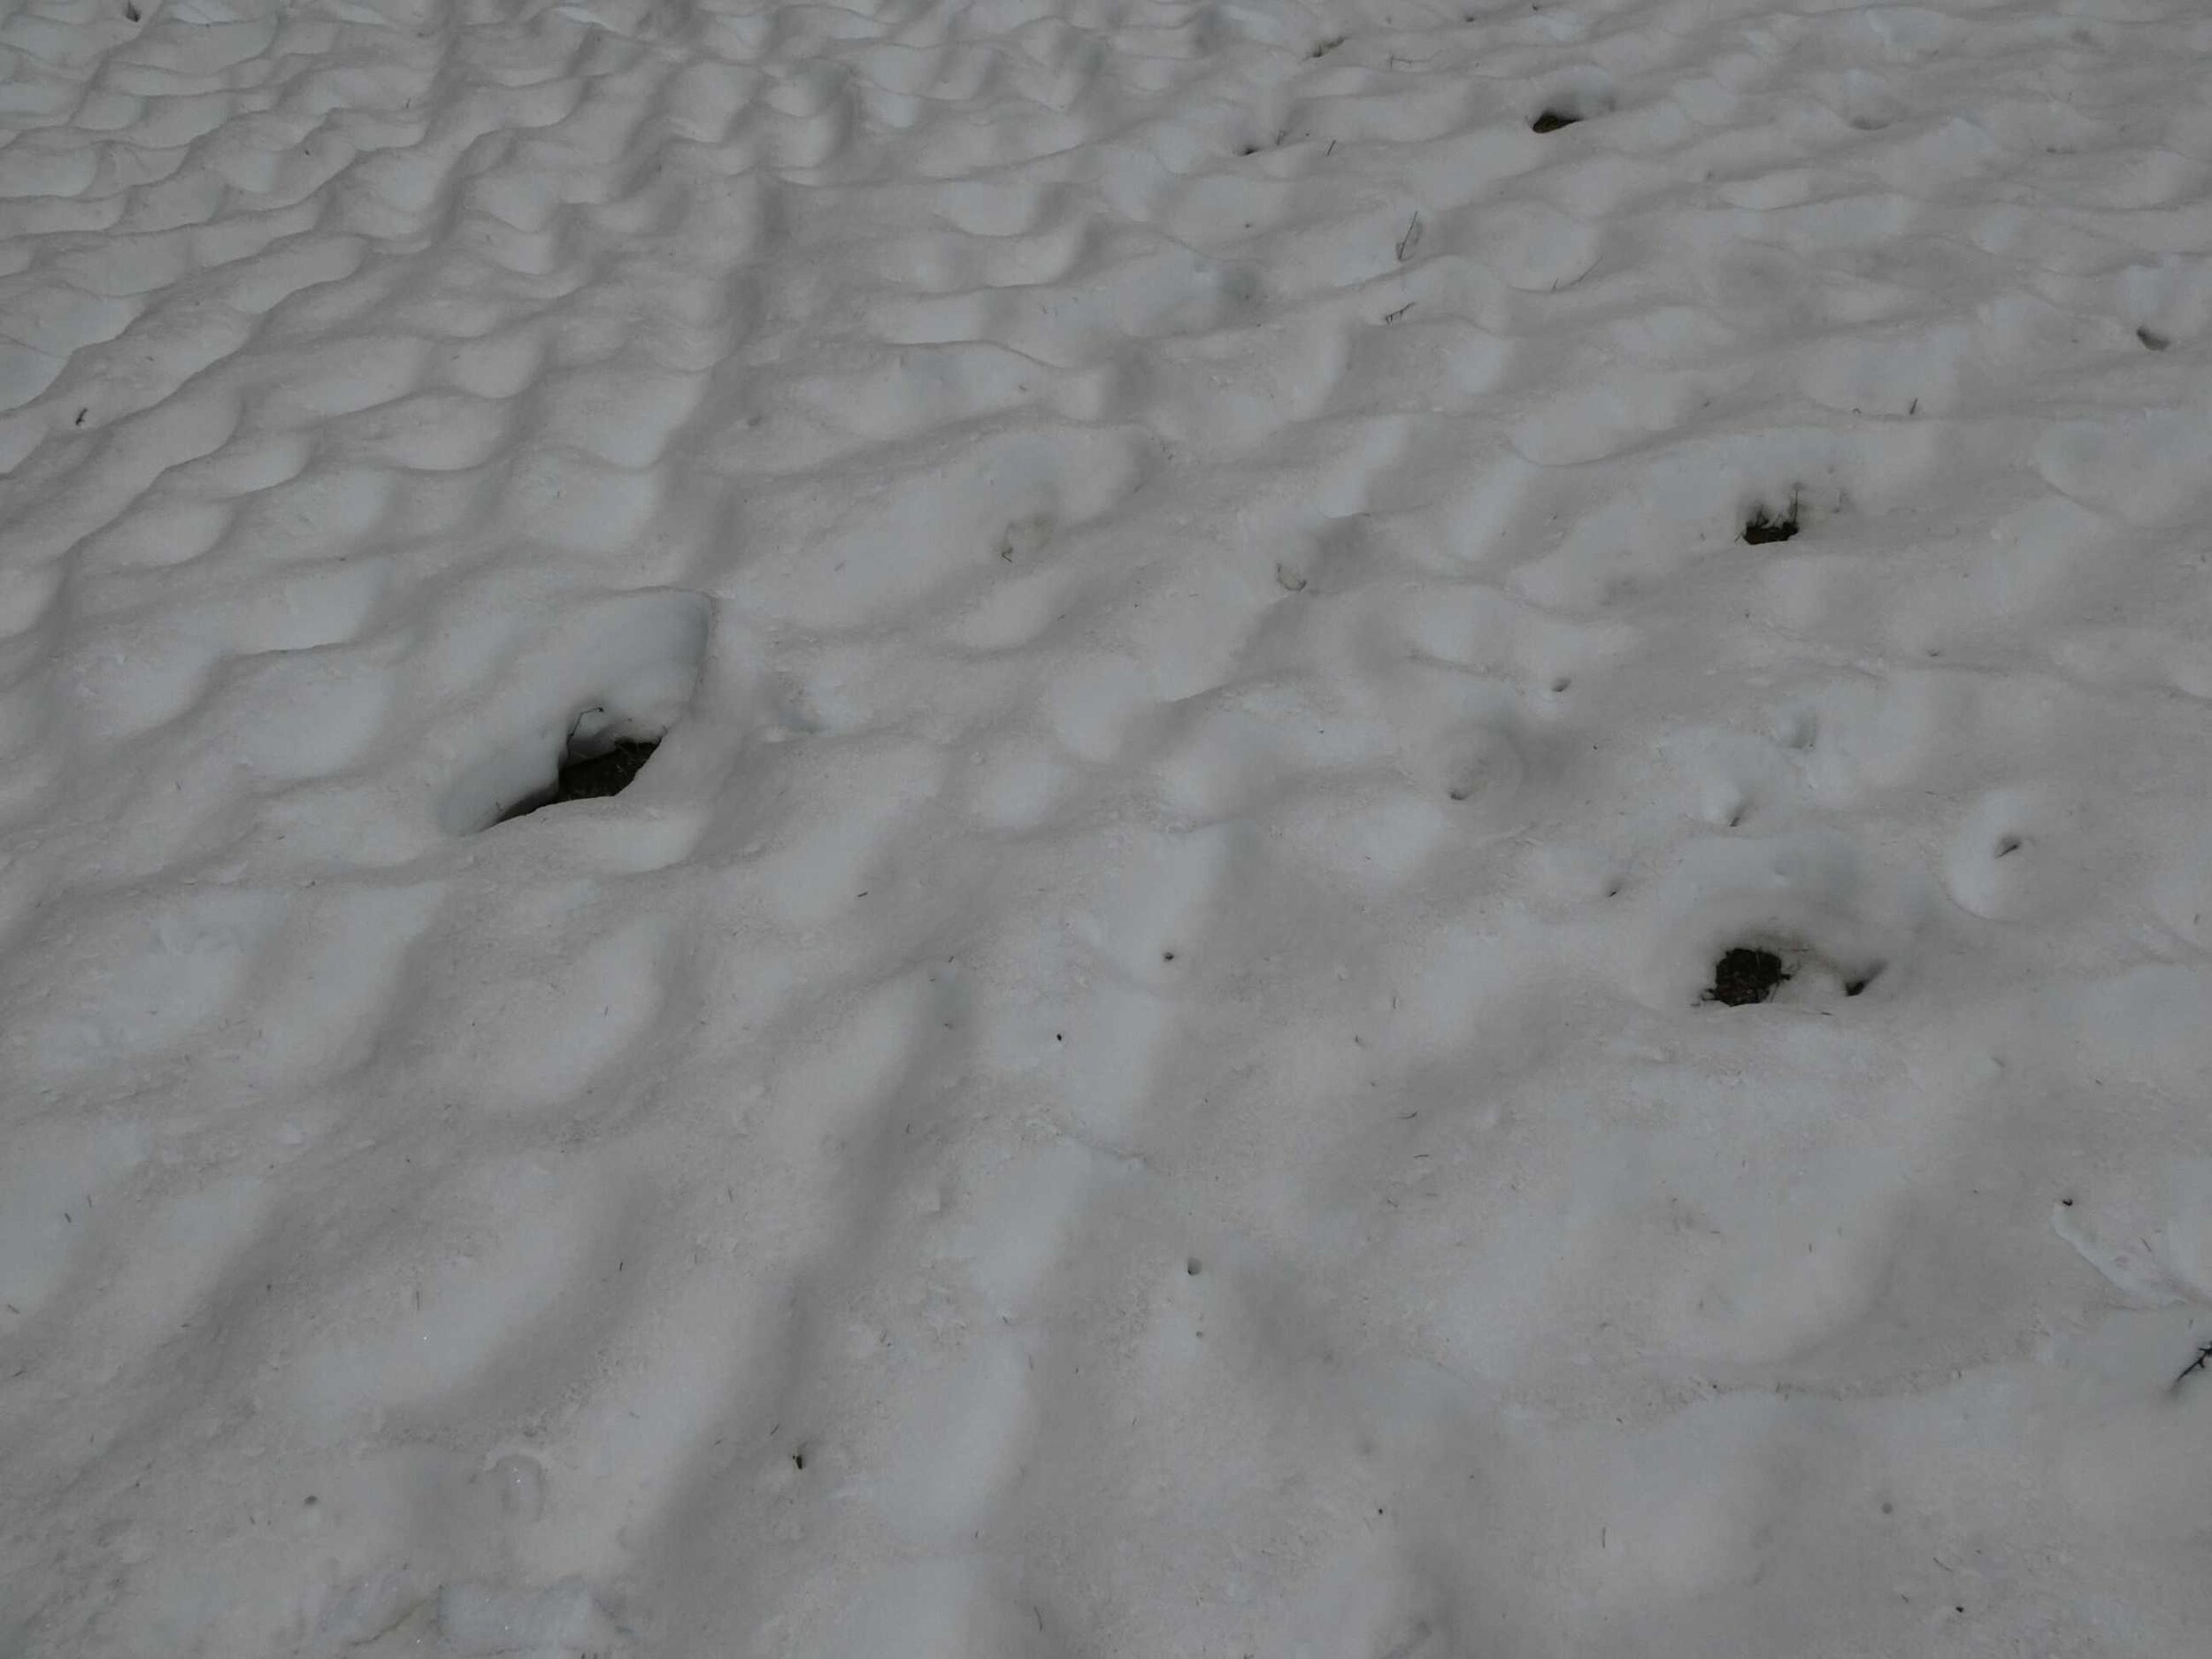
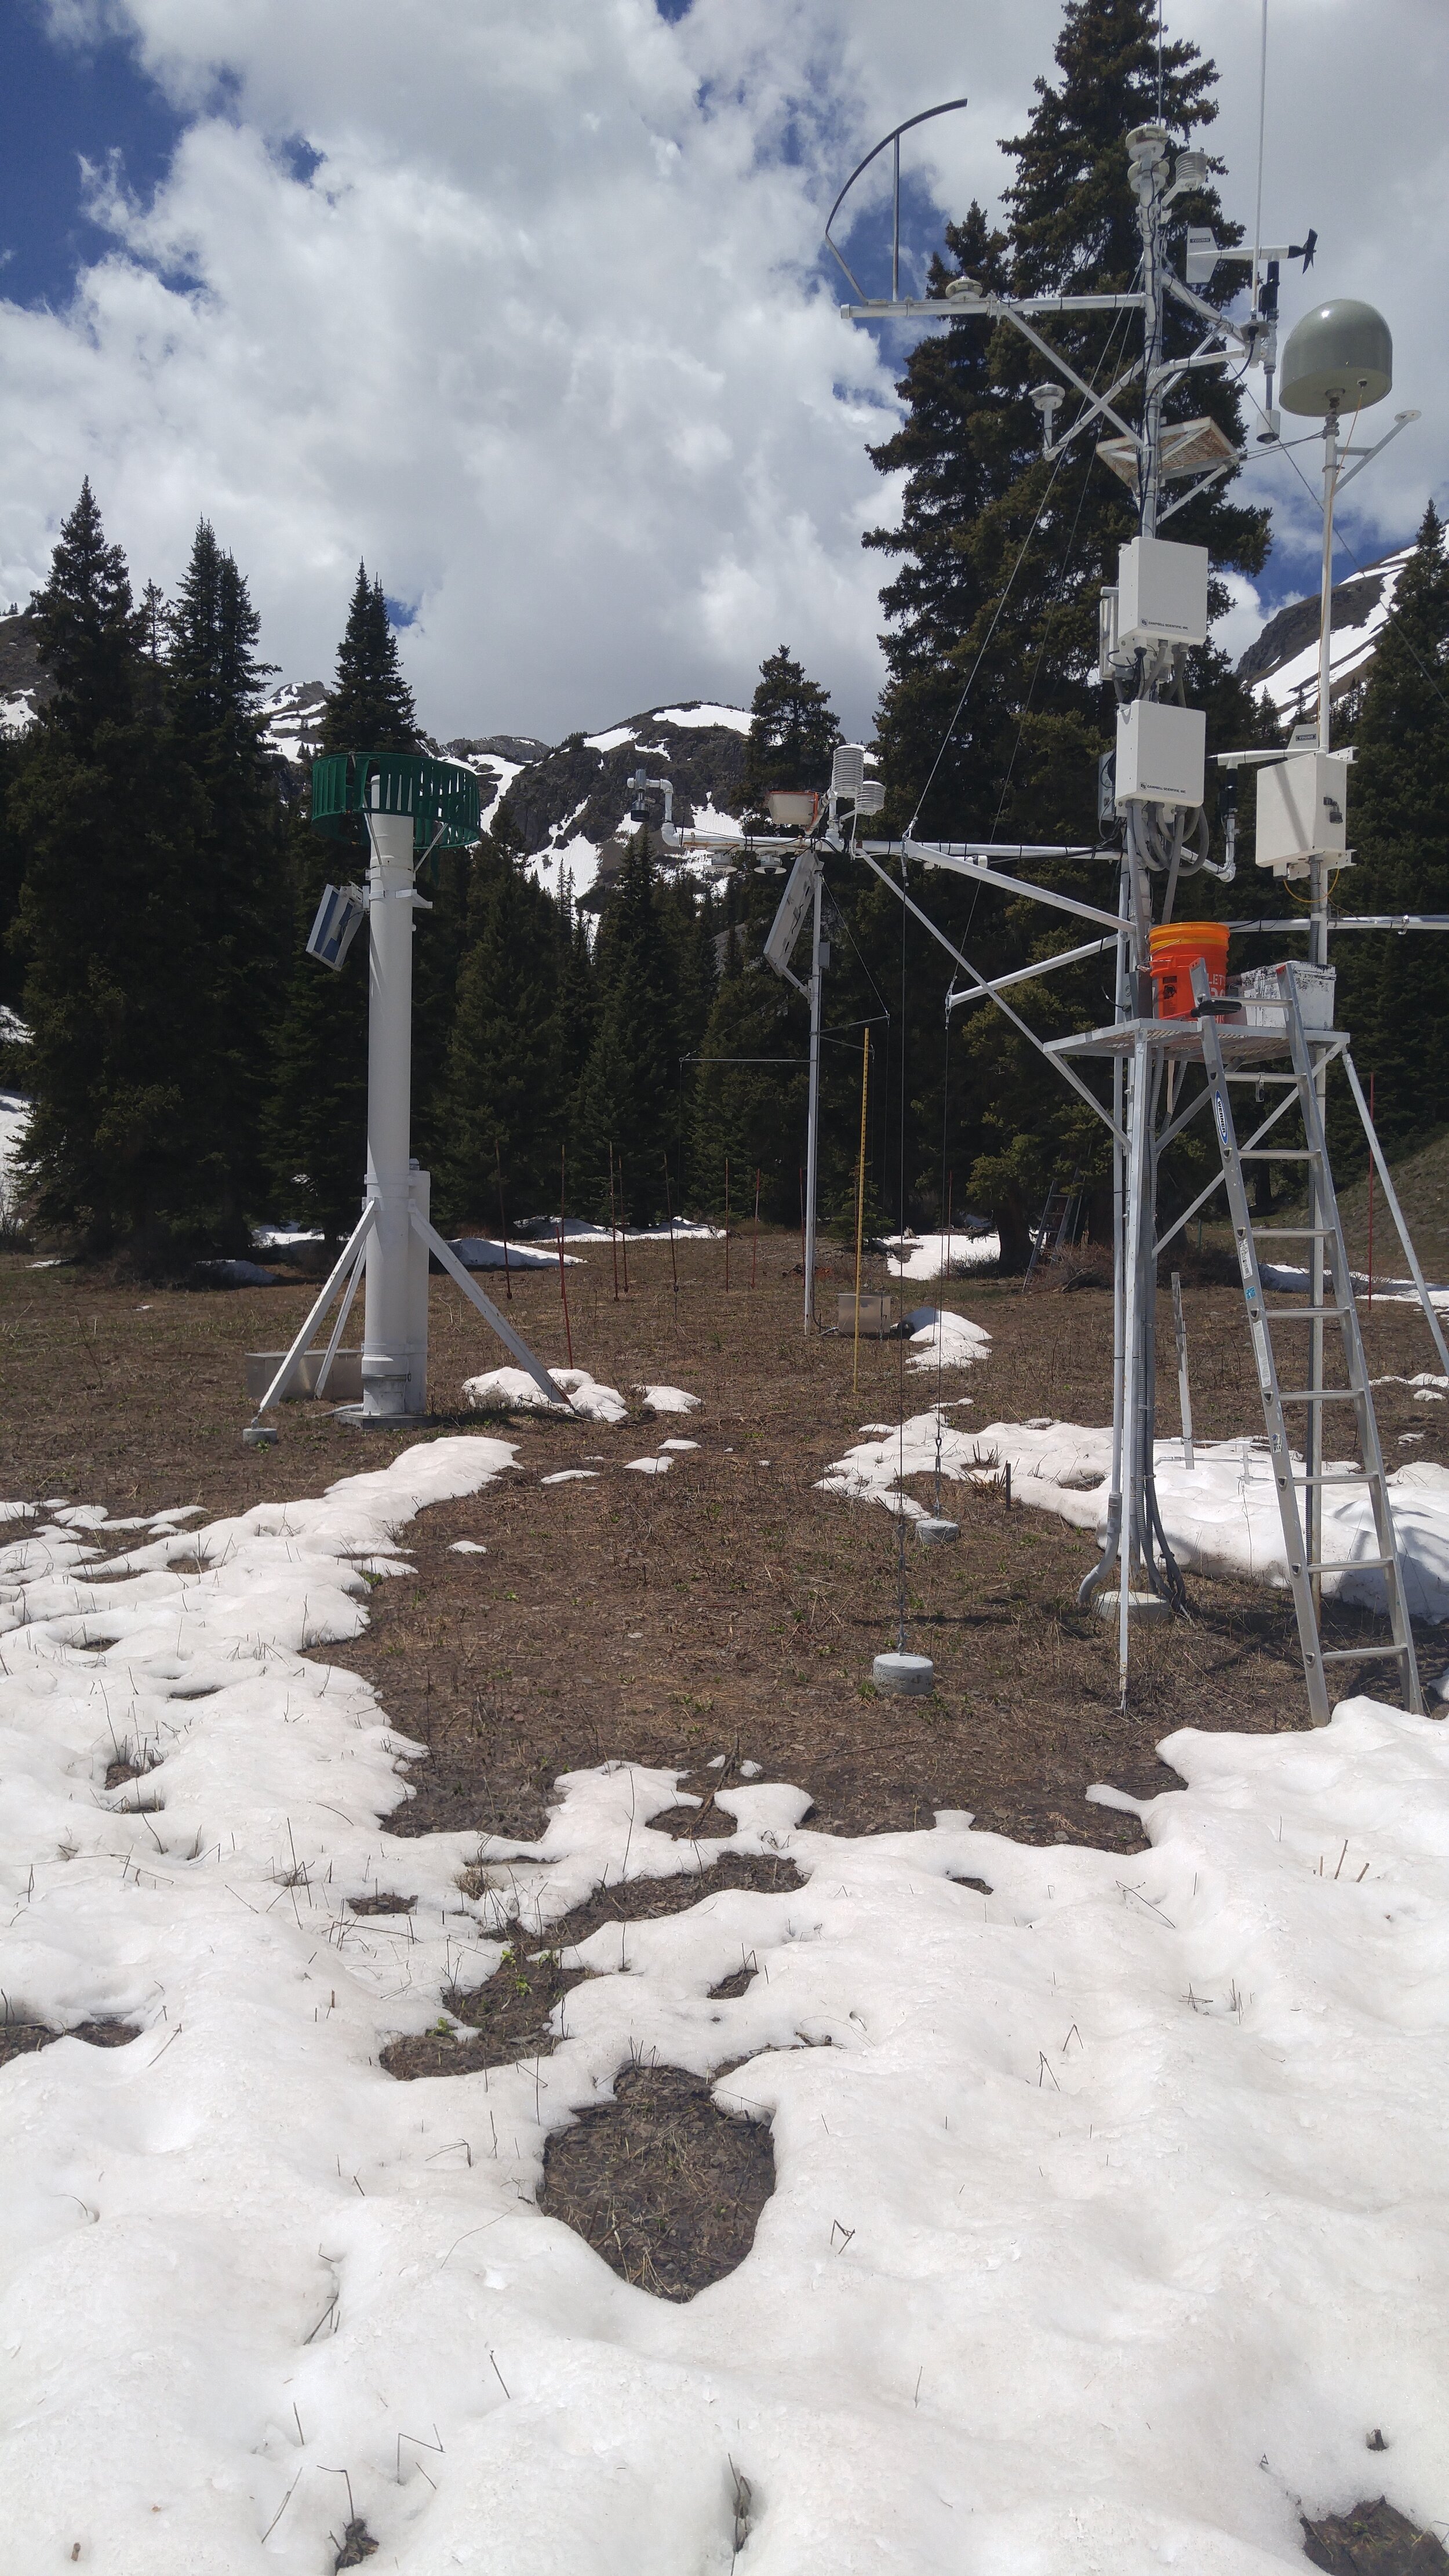
Above are selected photos of dust-on-snow and snowpack conditions for winter WY2020.
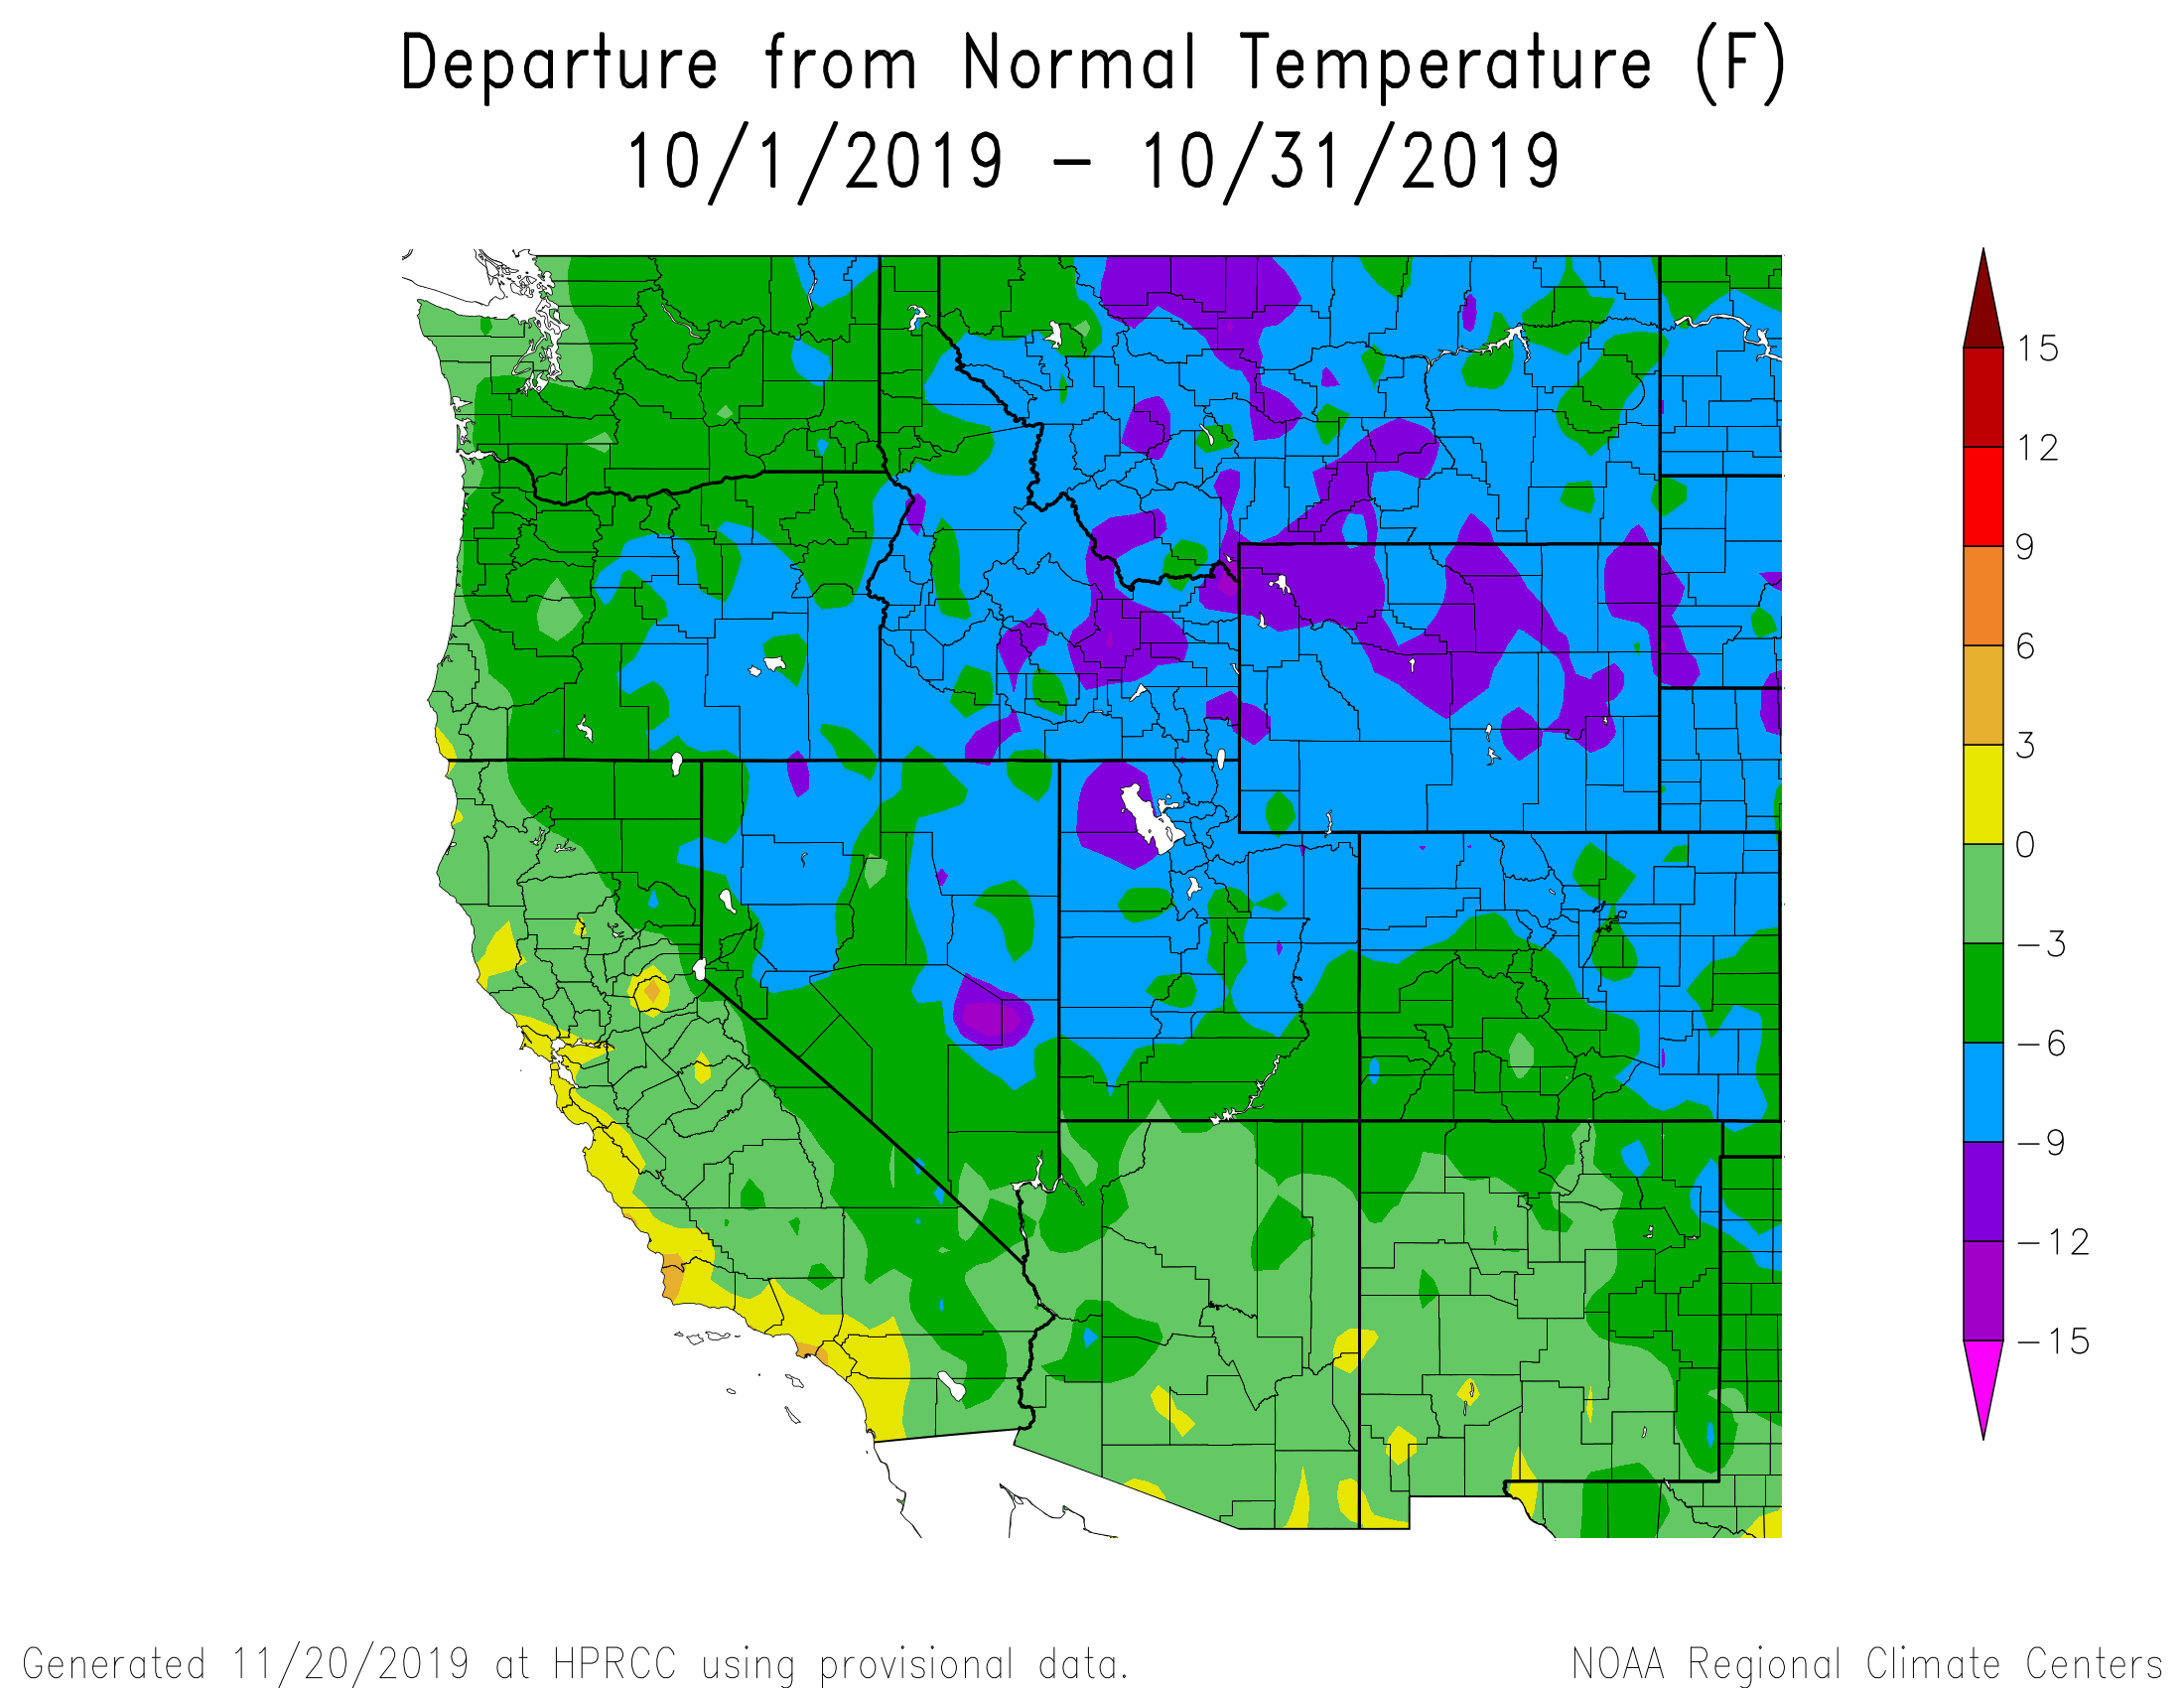
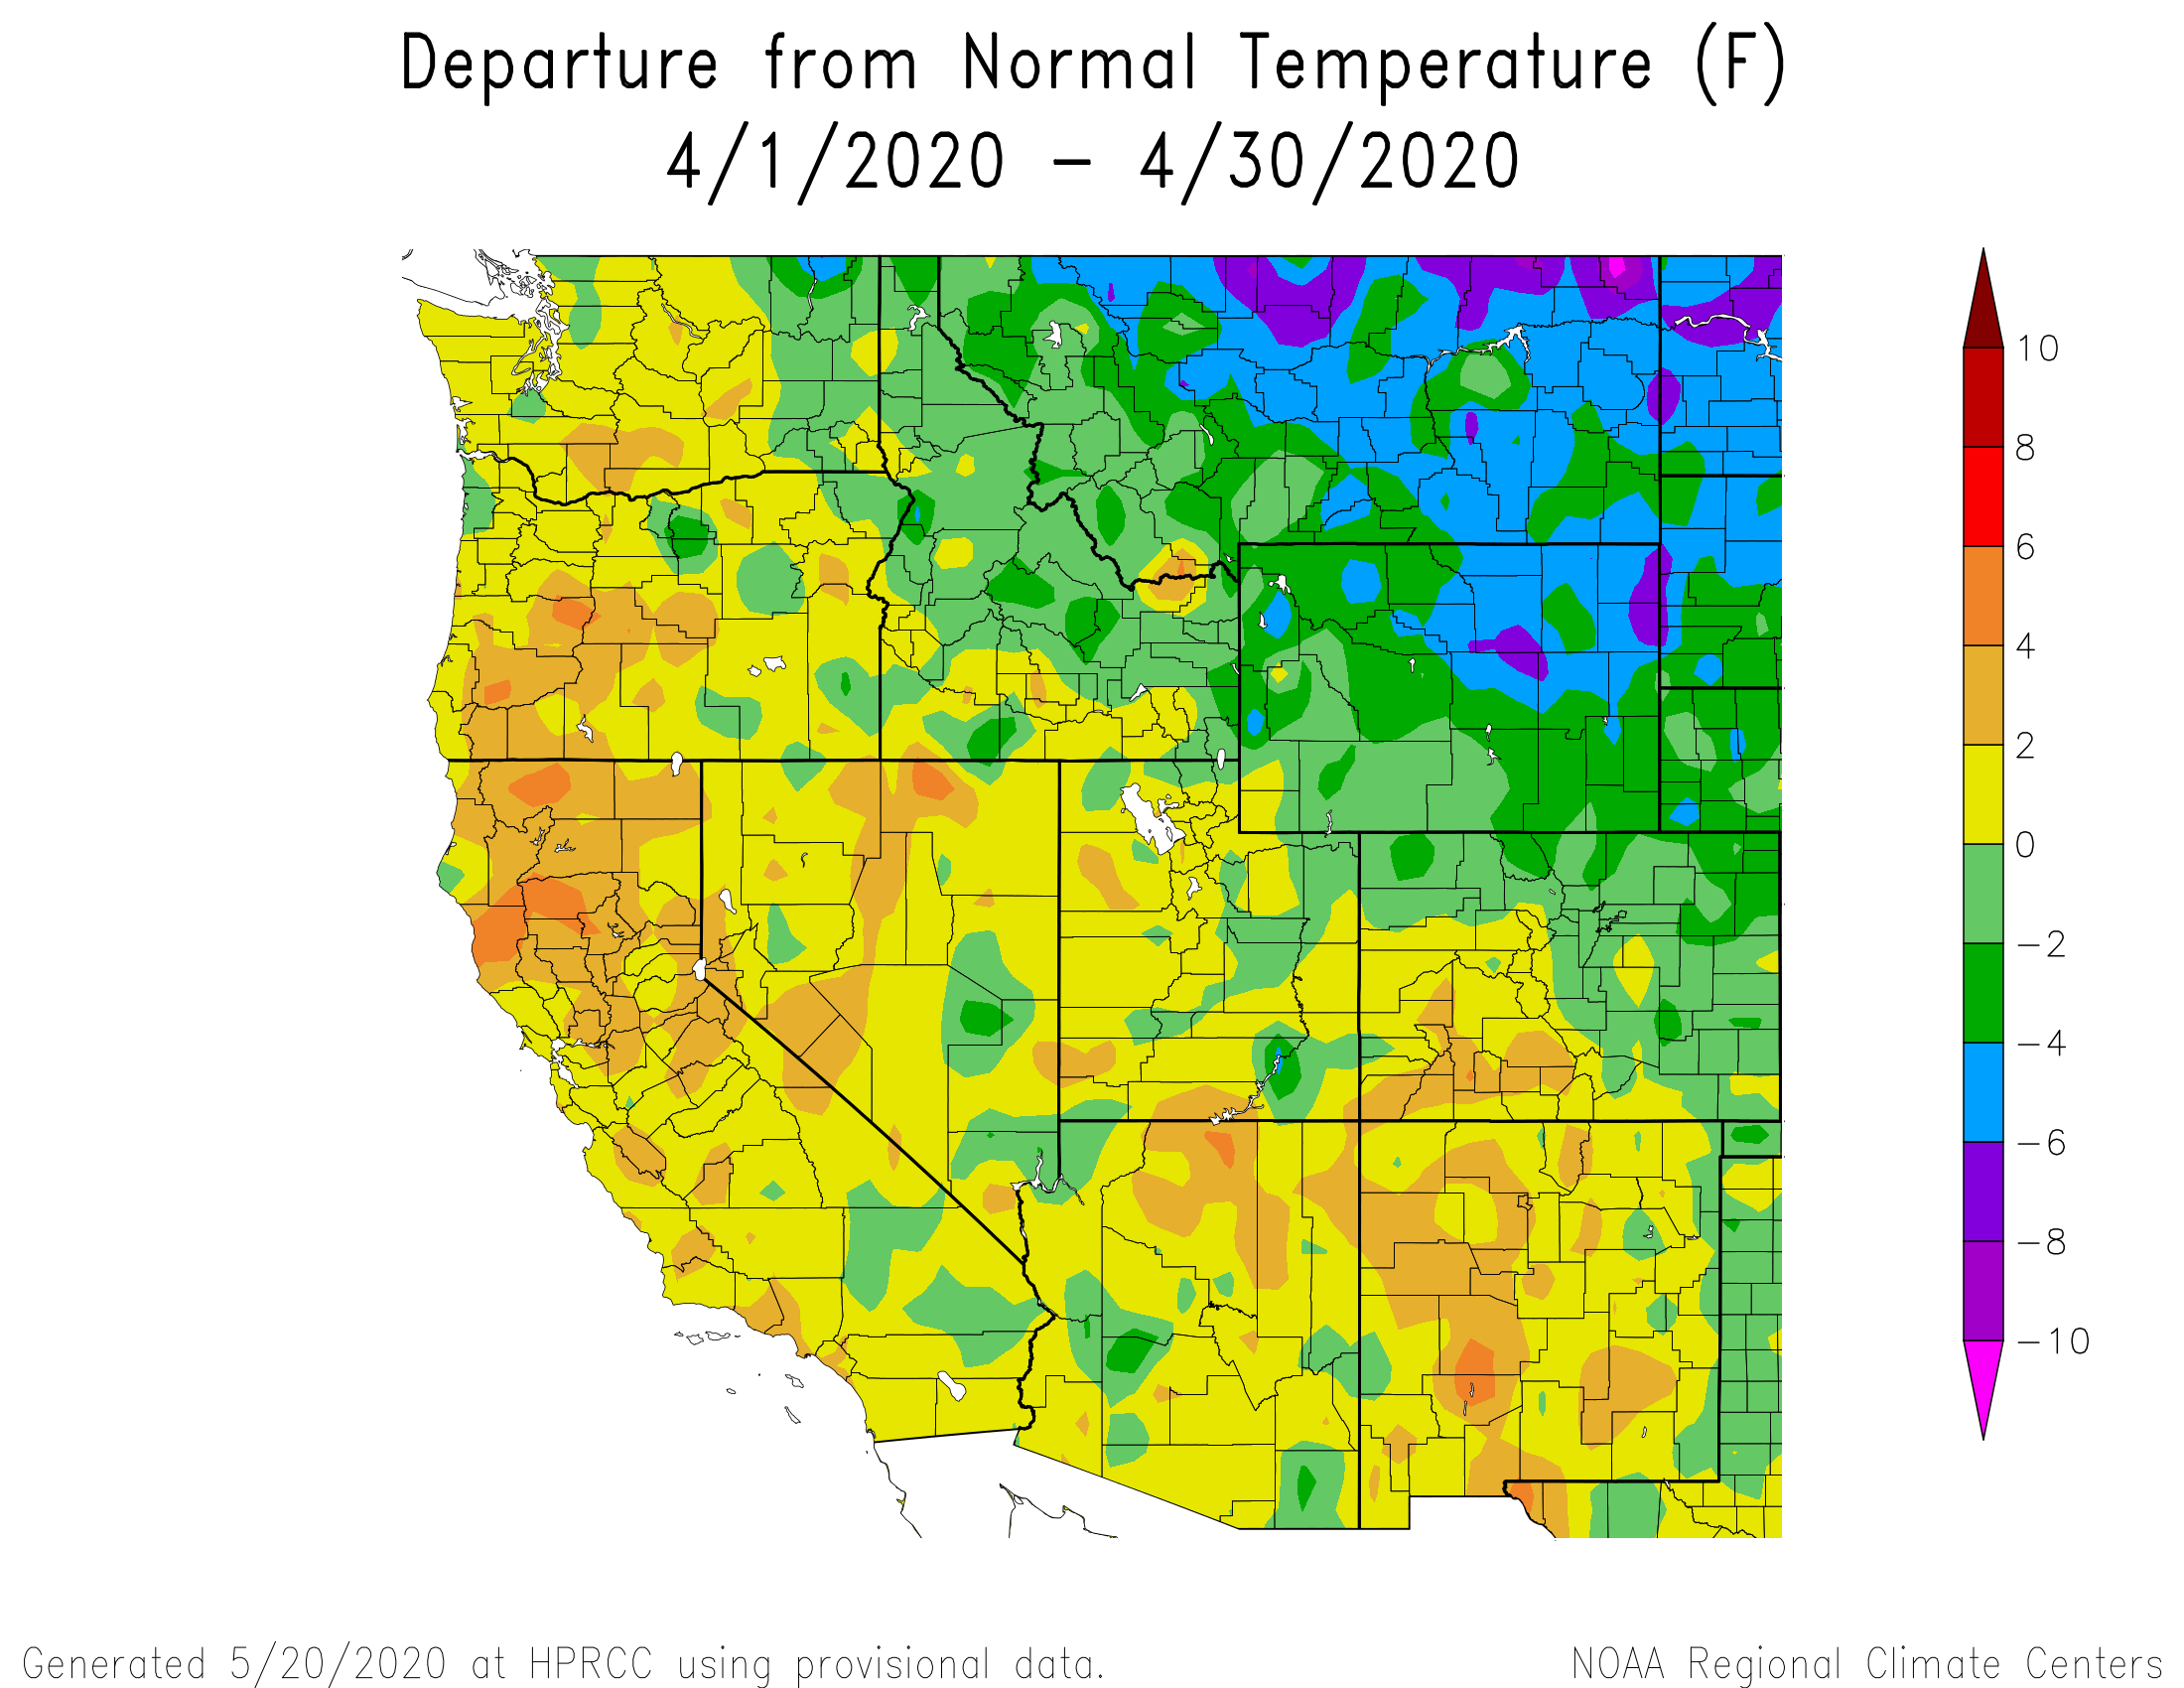
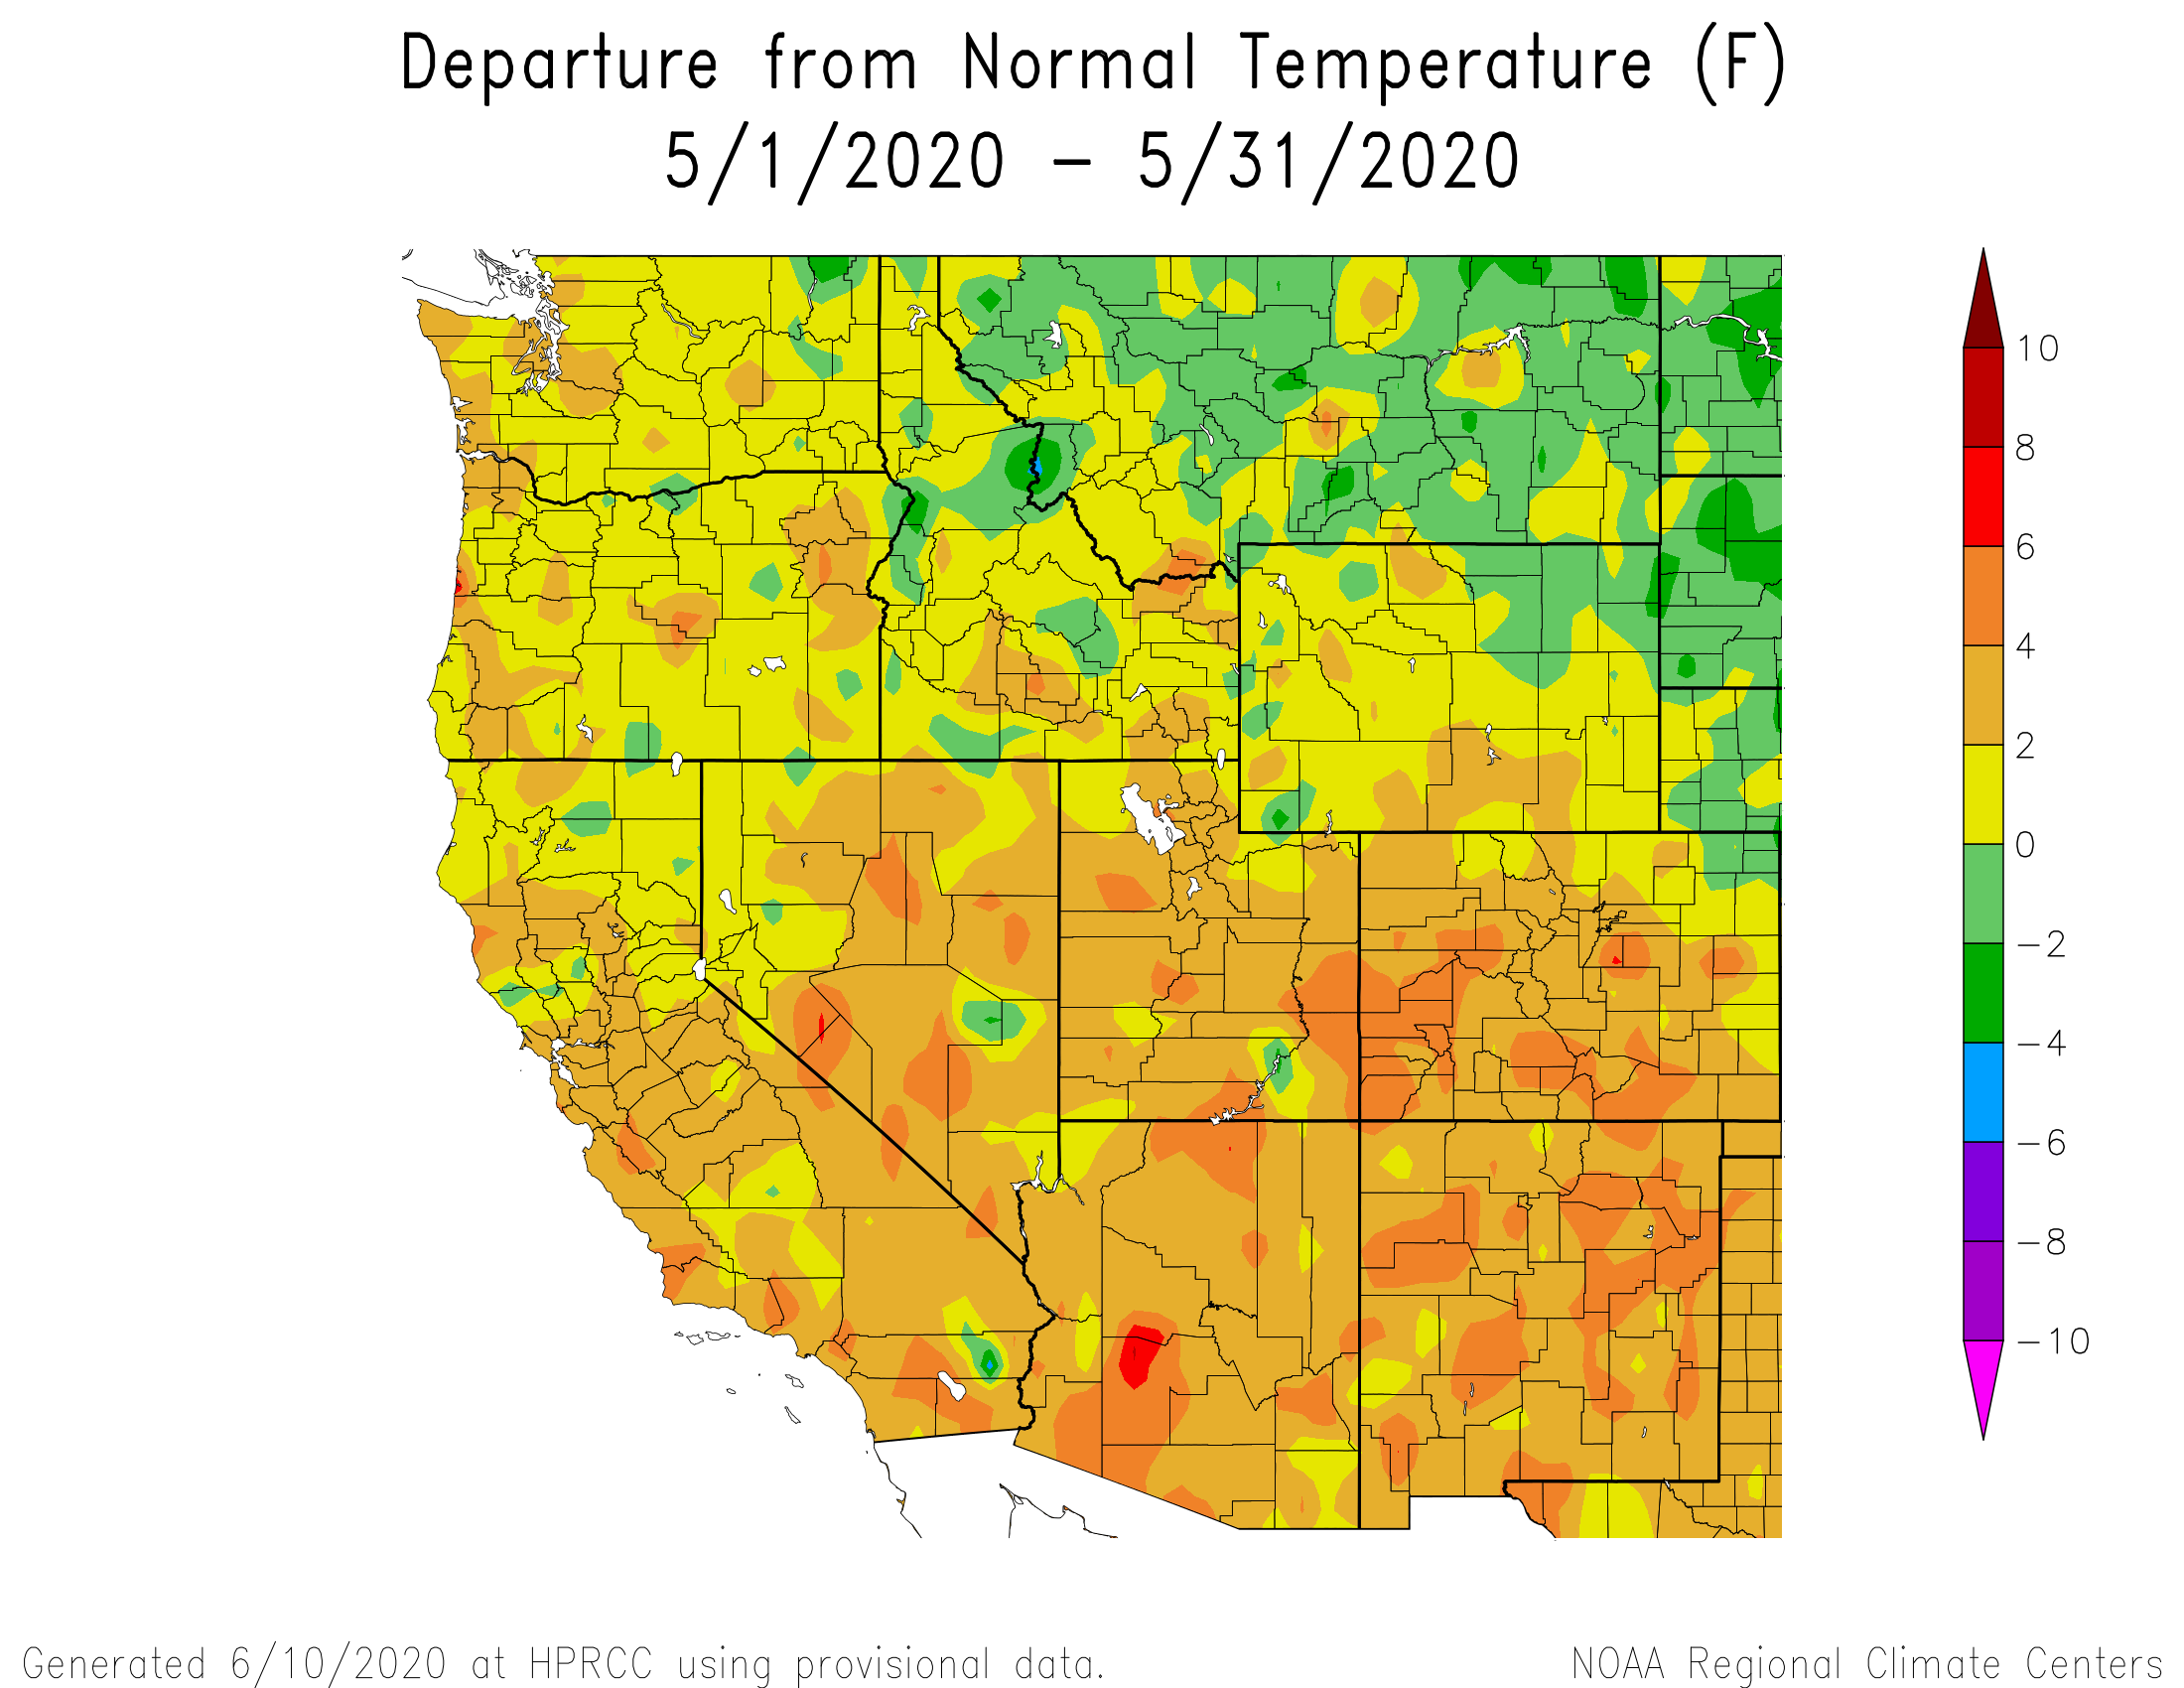

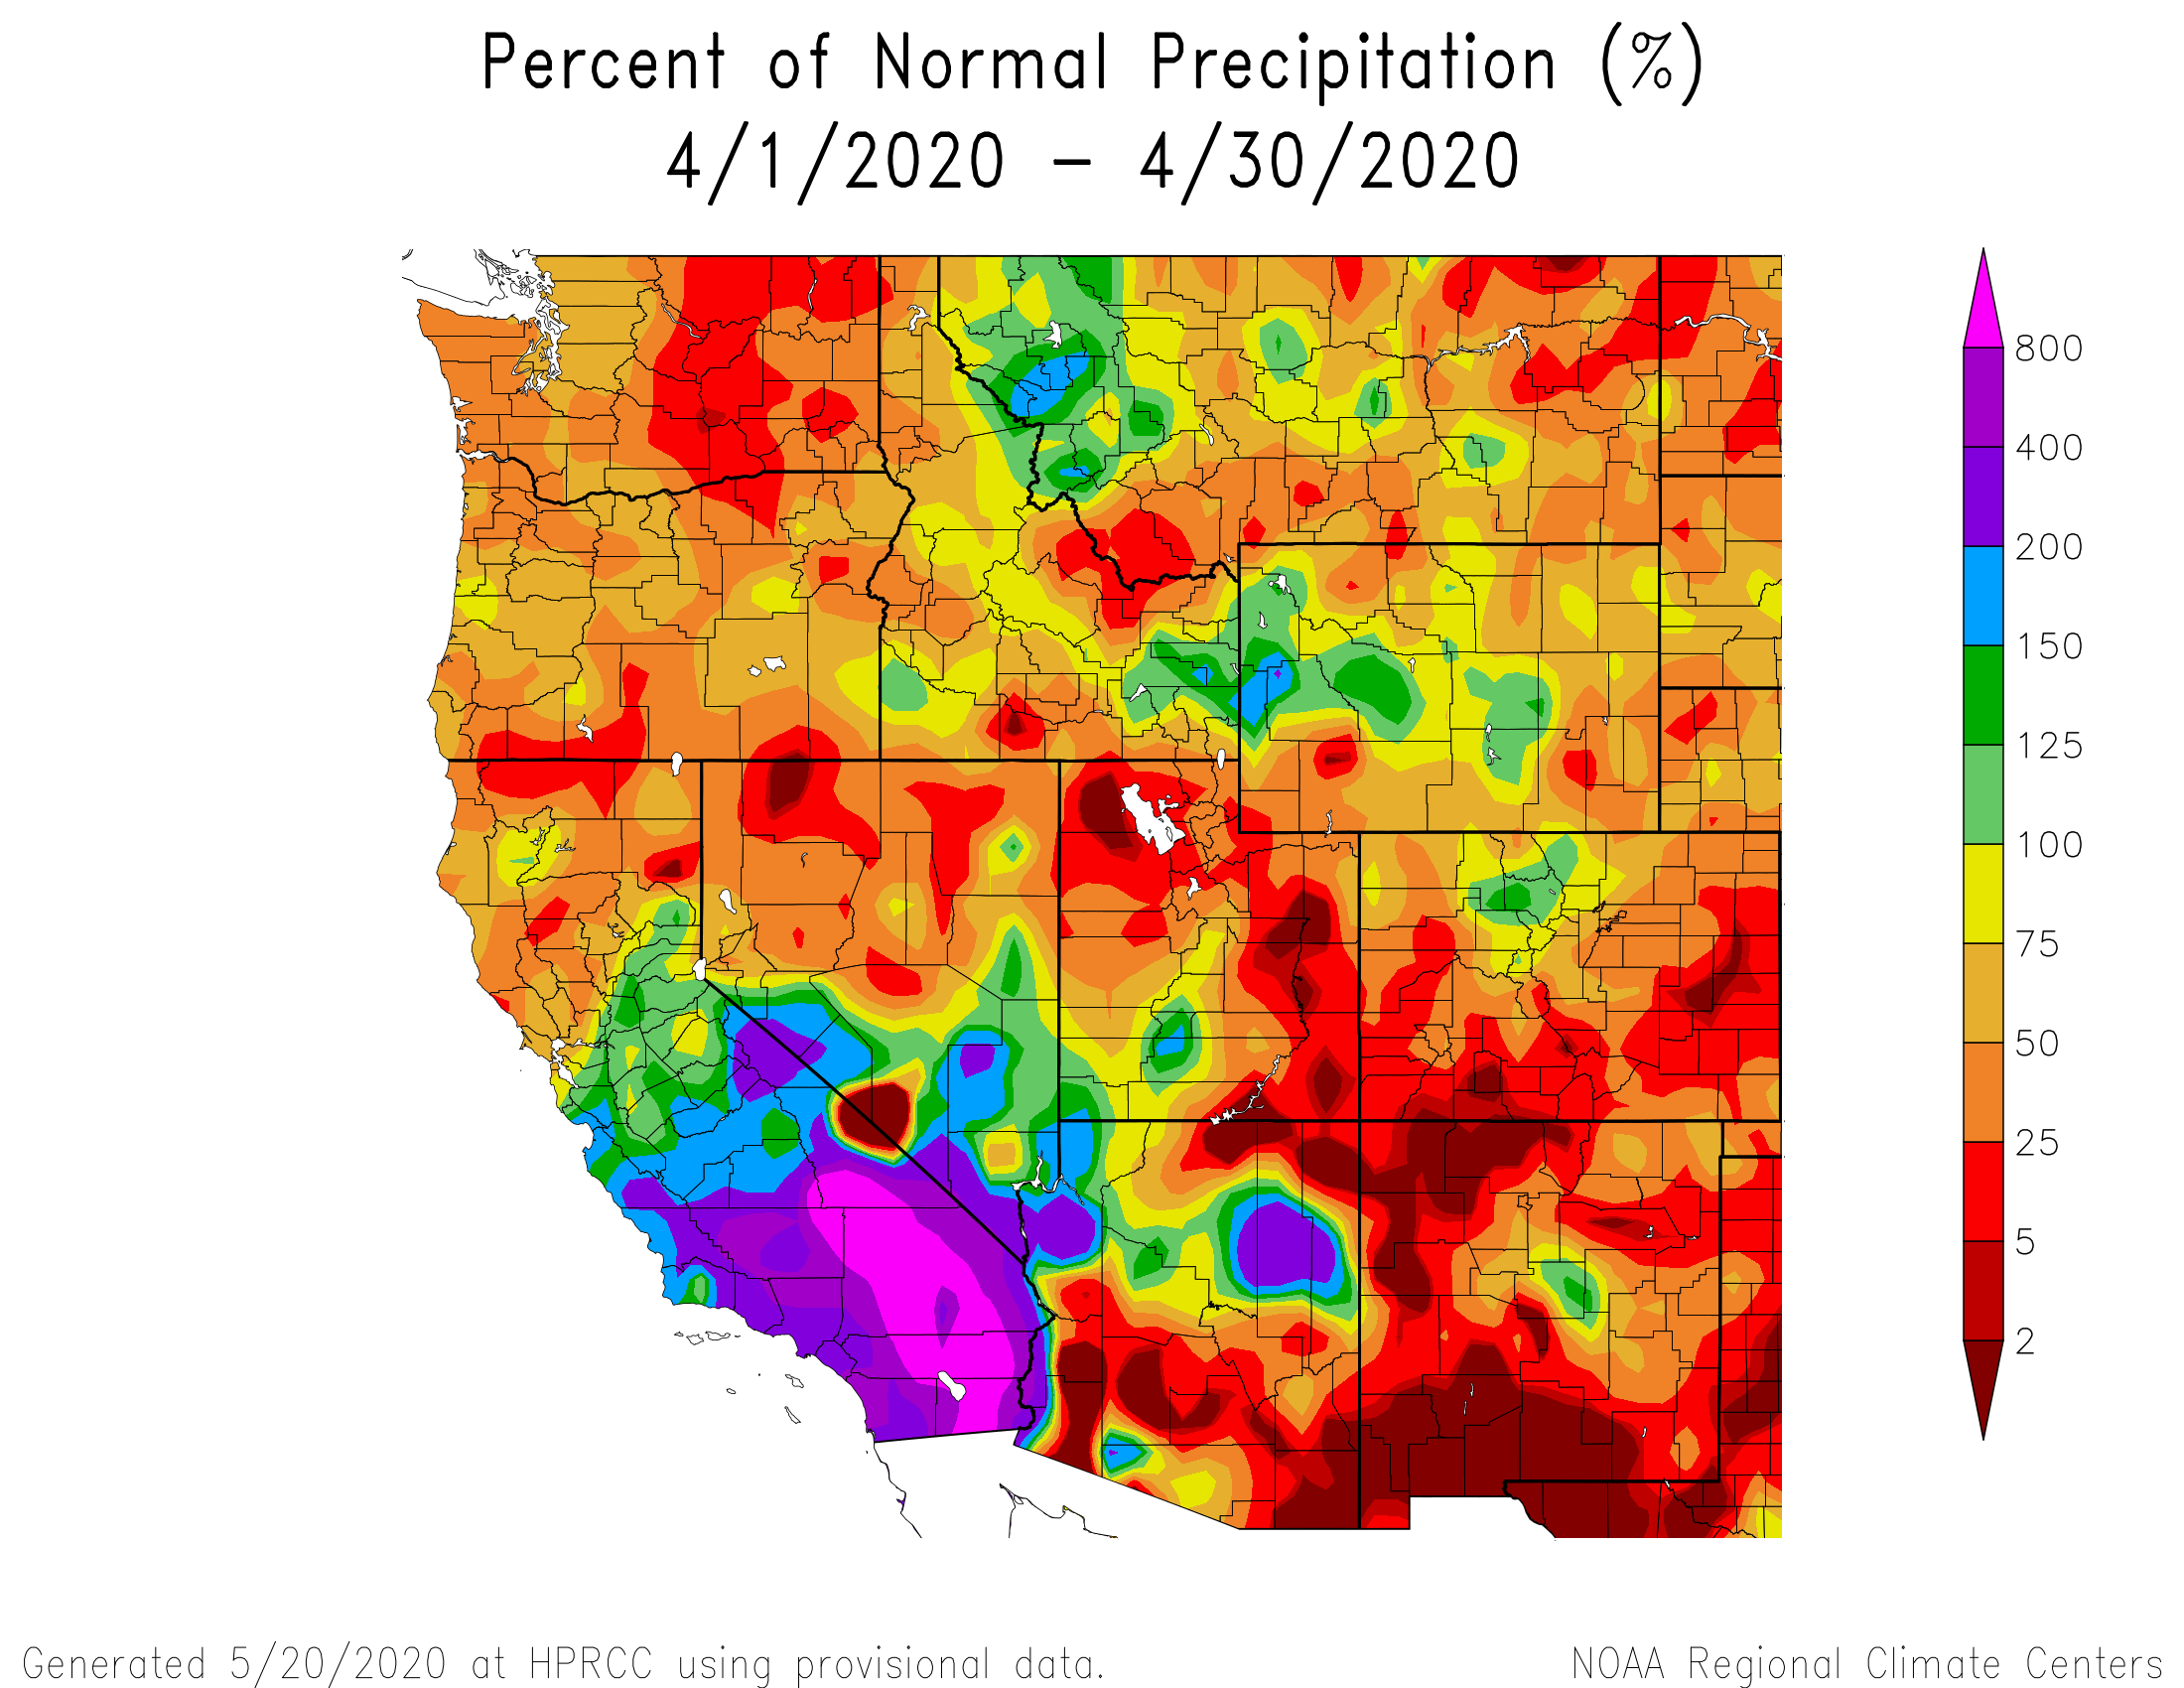
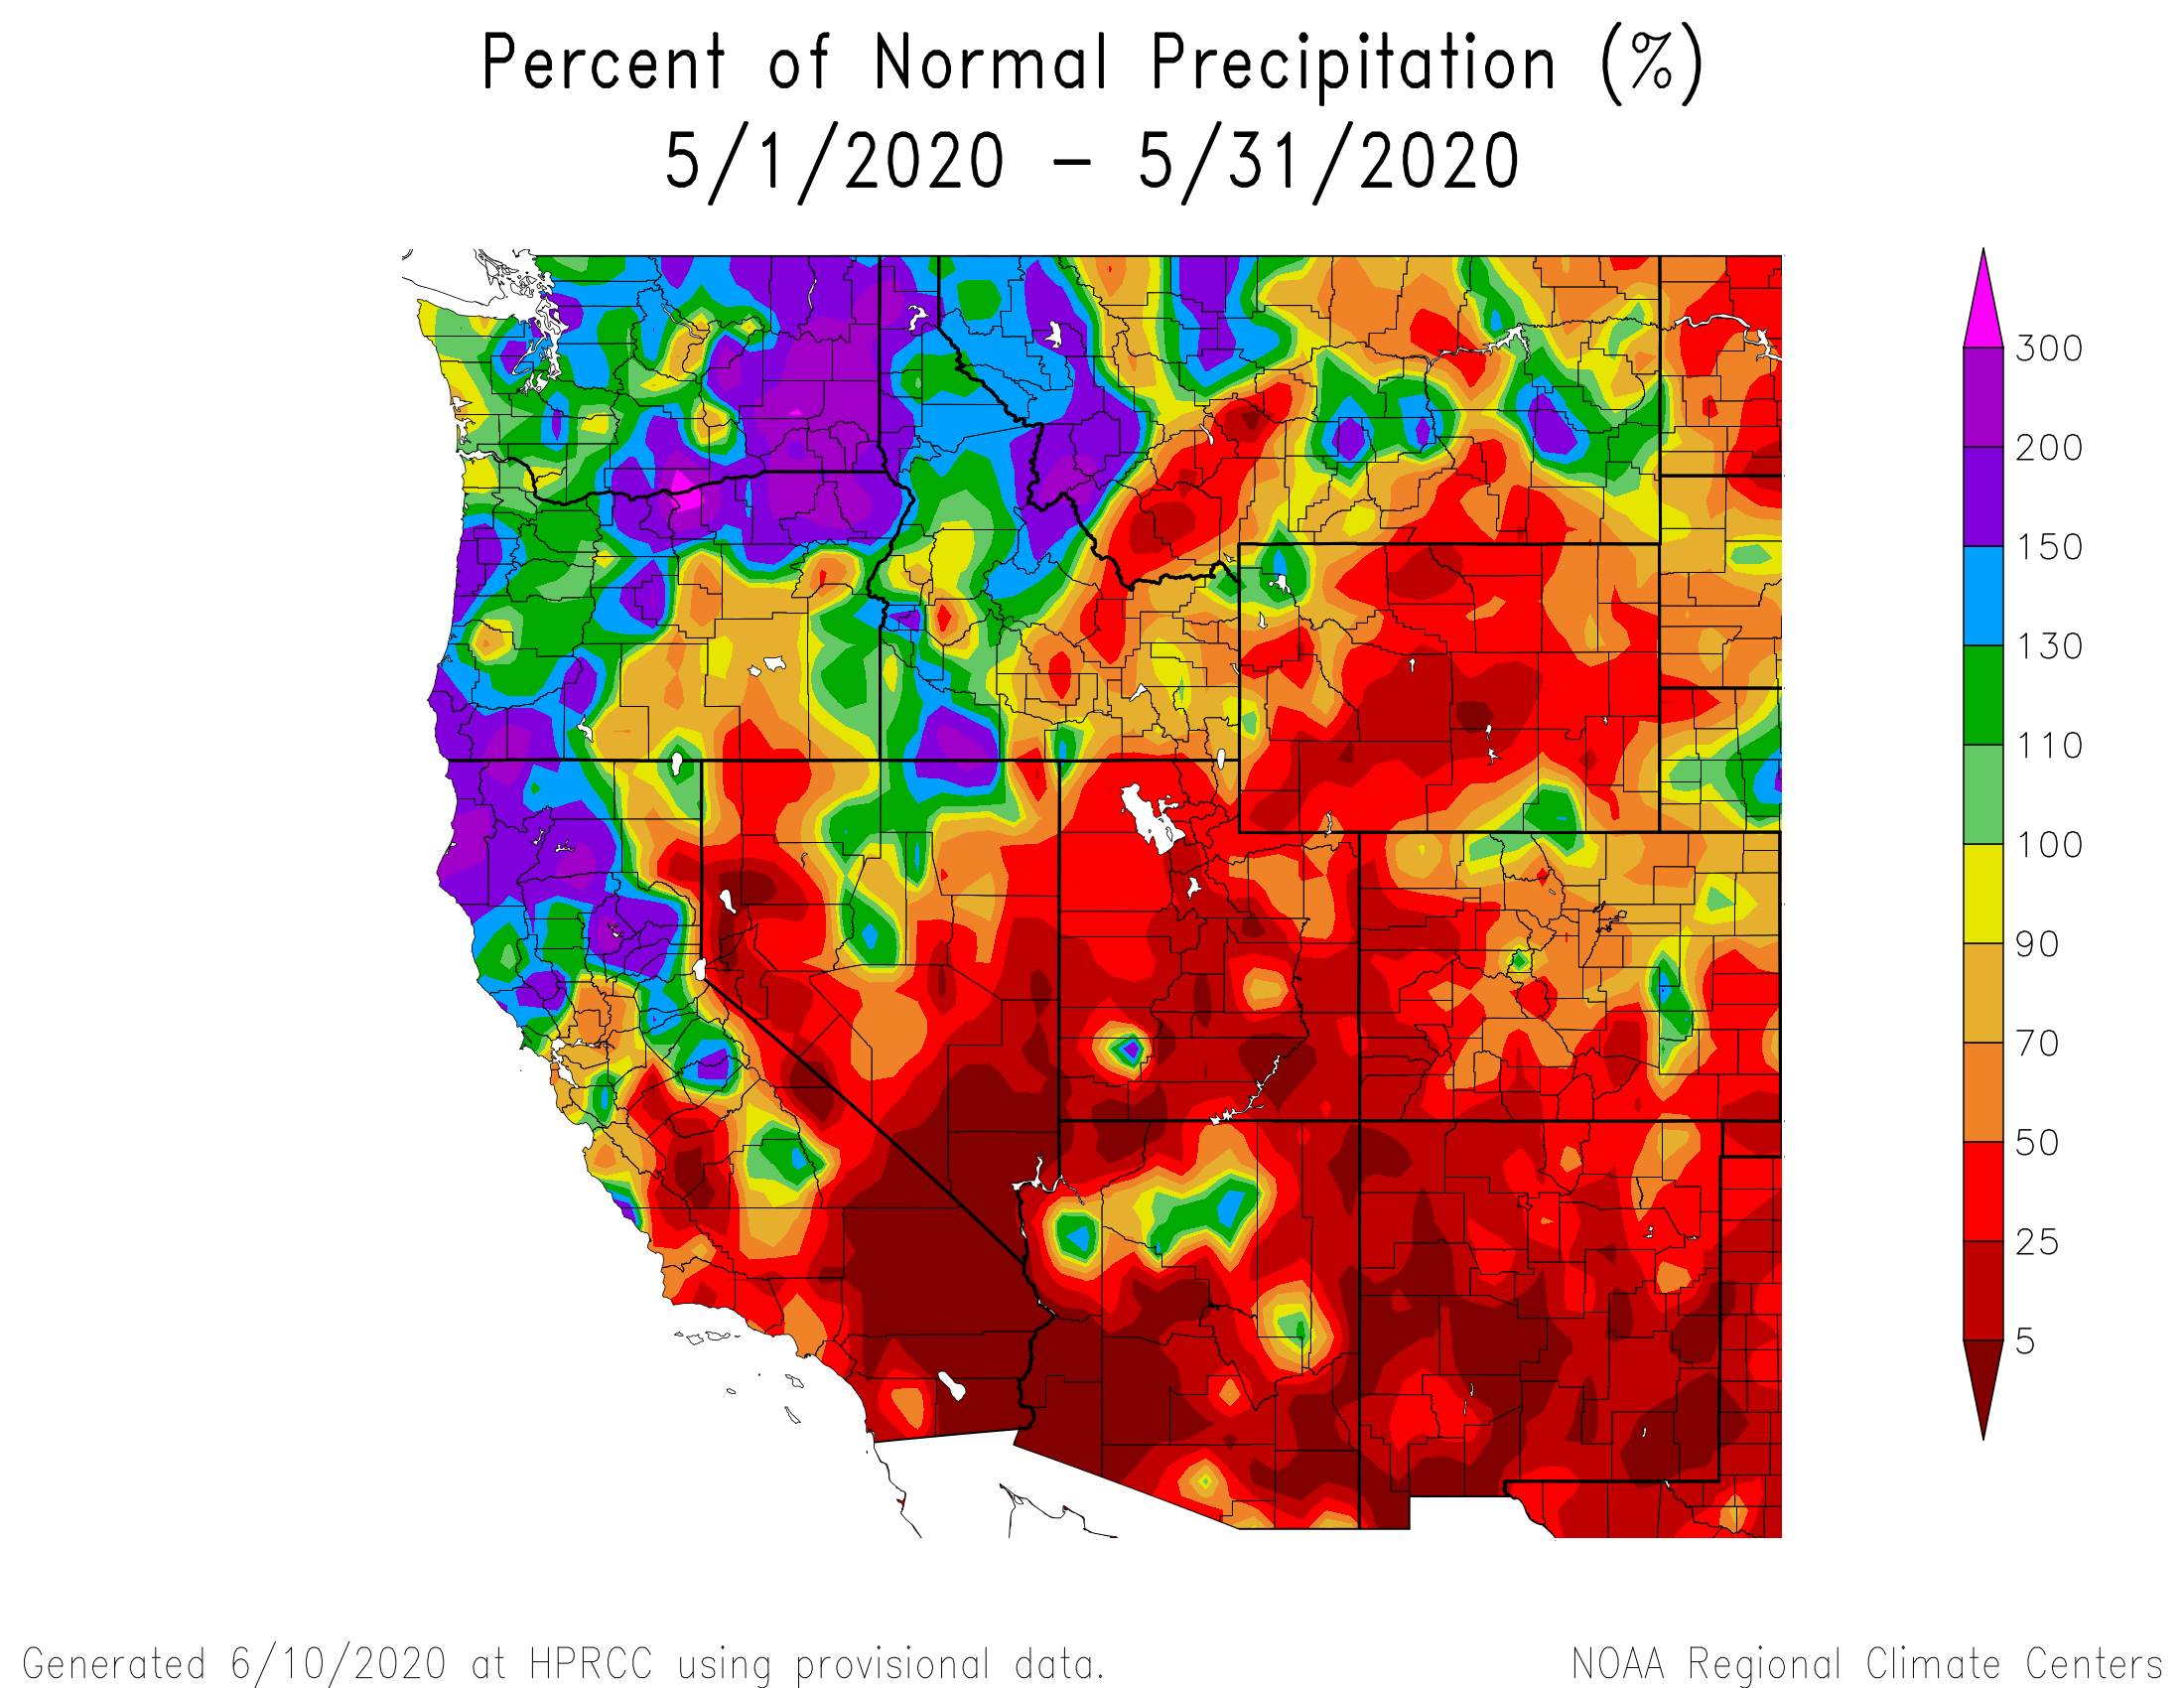
Above: April was very dry with many Central and Southern Colorado SNOTEL stations reporting this April as one their top five driest in their period of record. May was dismal as well with many stations towards Northern Colorado also feeling the dry conditions. Conditions were drier earlier for the Southern sites but all of Colorado felt the precipitation deficit starting April through June at the time of this writing.
SENATOR BECK STUDY BASIN DATA
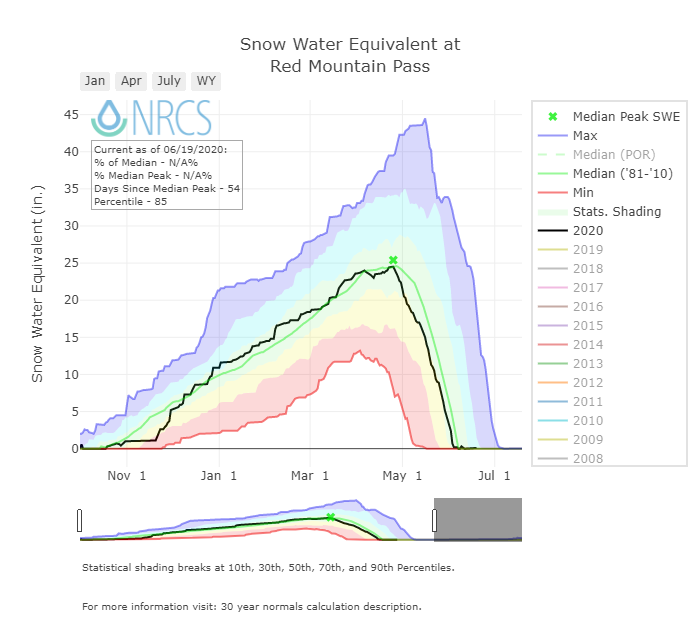
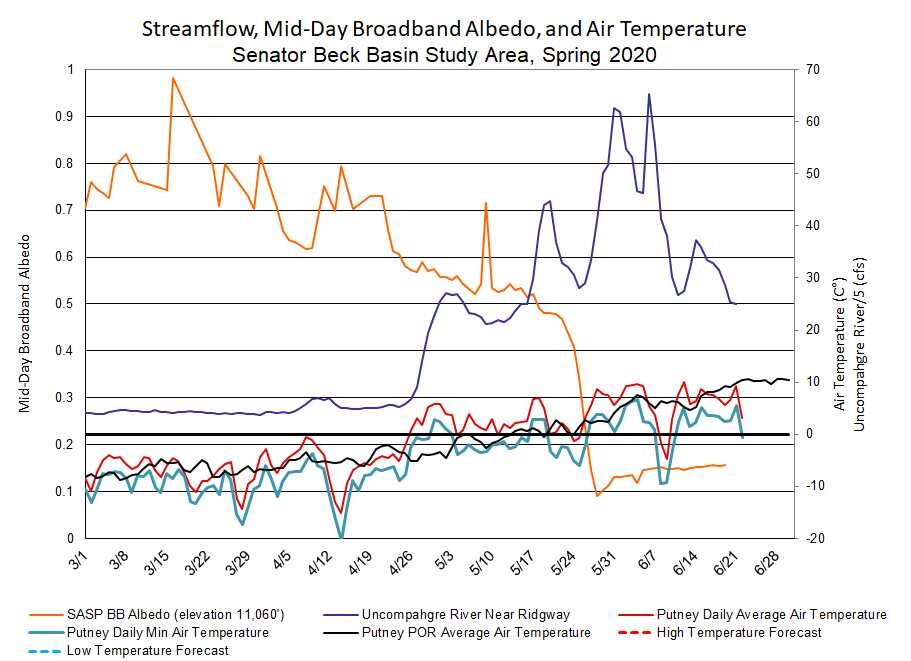
This section describes conditions and data collected by the Center for Snow and Avalanche Studies at our Senator Beck Basin Study Area (SBB) at Red Mountain Pass under our Mountain System Monitoring program, which includes the Colorado Dust-on-Snow Program (CODOS). At SBB, snowpack, weather, soils, and radiation conditions are monitored and measured at the well-sheltered subalpine Swamp Angel Study Plot (SASP, 11,060’) and at the more exposed, alpine Senator Beck Study Plot (SBSP, 12,180’). Nearby, wind speed, wind direction, air temperature, and humidity data are collected at the Putney Study Plot (PTSP, 12,323’), located to minimize the influence of local terrain on those measurements. Finally, SBB streamflow discharge is continuously measured at the SBB pour point at the Senator Beck Stream Gauge (SBSG, 11,030’), in a broad-crested, notched weir.

Winter started taking hold the latter half of October as precipitation began falling and staying on the ground as snow but really didn’t get any steam until latter November. The above storm count plot looks a lot like the cumulative precipitation plot below, as storms tapered off in spring so did any additional snow accumulation. All total we received 19 storms this winter, the average is around 24. A storm is defined as receiving 12 mm or more of precipitation with no break in precipitation greater than 12 hours. For the months of April and May we observed only 2 winter storms. This winter we had a total 4 more storms than we did in WY2018, a notoriously dry year. Winter storm reports can be viewed at the snowstudies.org website.

The above graph shows precipitation at SASP with snow depth at SASP and SBSP. After a fair amount of snow in latter October the first half of November was dry. We made steady progress most of winter but then the crucial spring season was dry and hot. Between April 27 - May 26 we received one minor storm on May 11.

Water Year 2020 cumulative precipitation, in April we received 2.3” precipitation and in May we received 1.1”. The average is closer to 4.6” and 3”, respectively.


Above: In WY2020 from October 1 - May 30, 152 days were above the mean and 116 days were below. The end of April and most of May was predominately warmer by near 1 standard deviation or greater.
SNOWPACK CONDITIONS
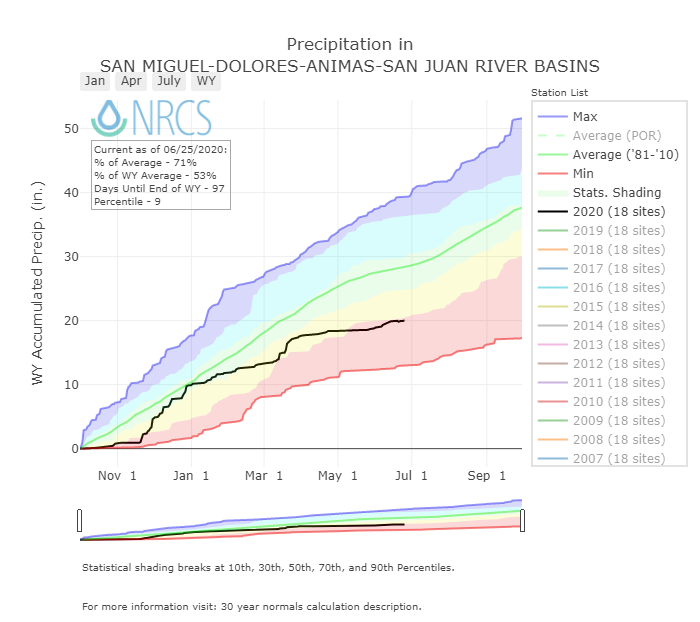
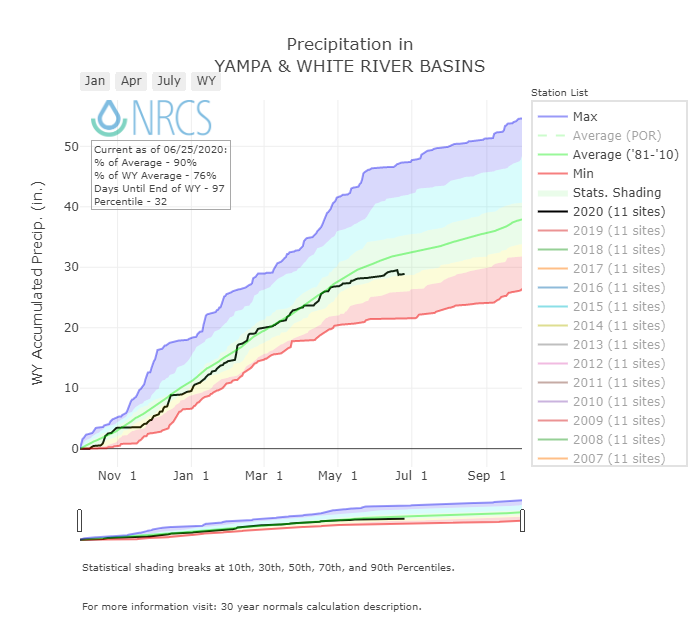
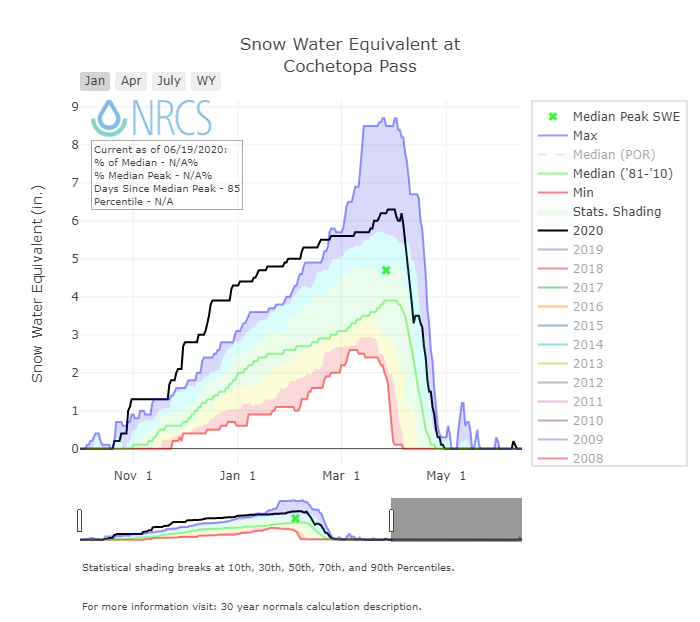
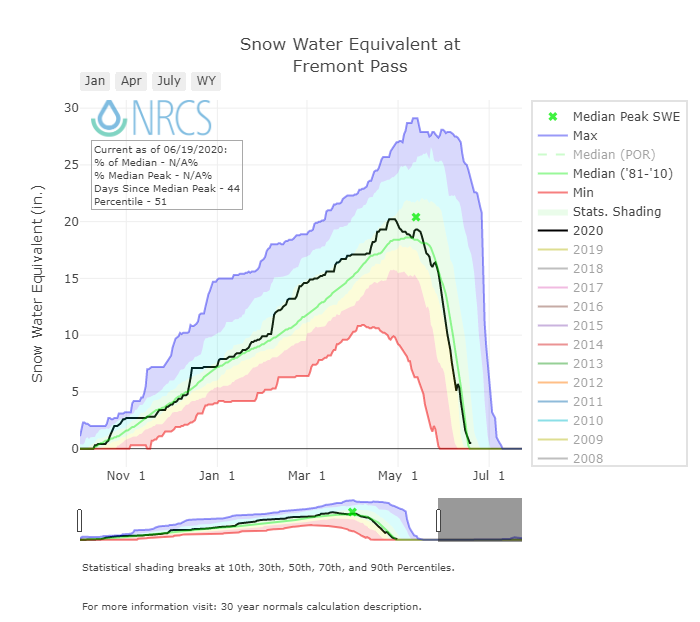
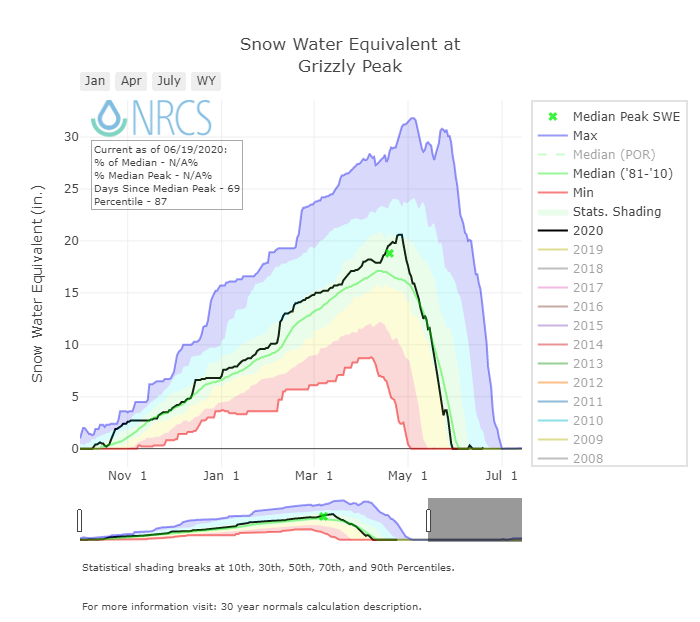
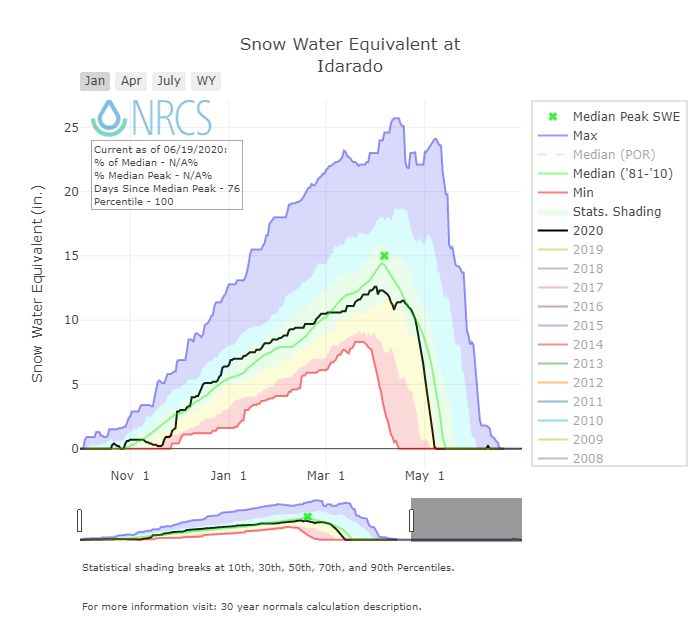
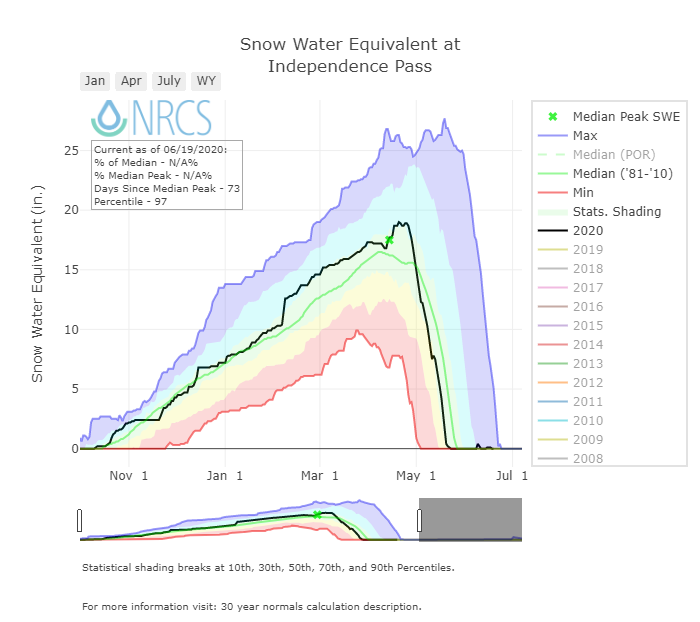
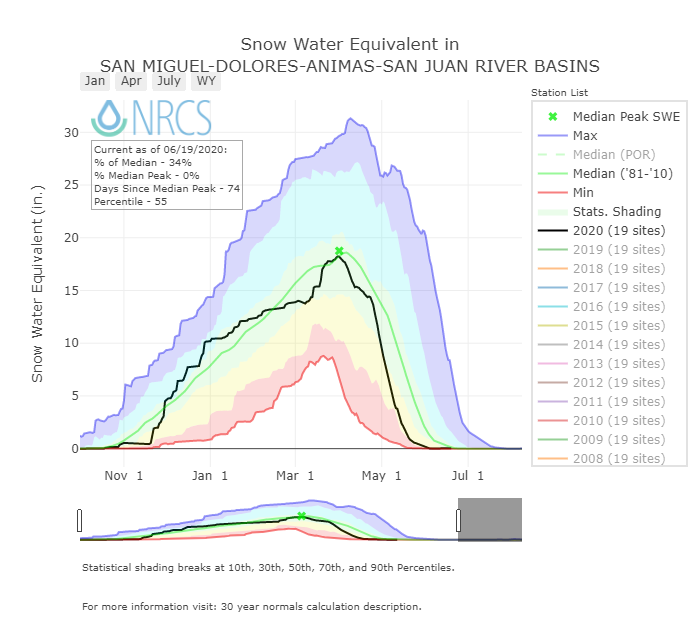
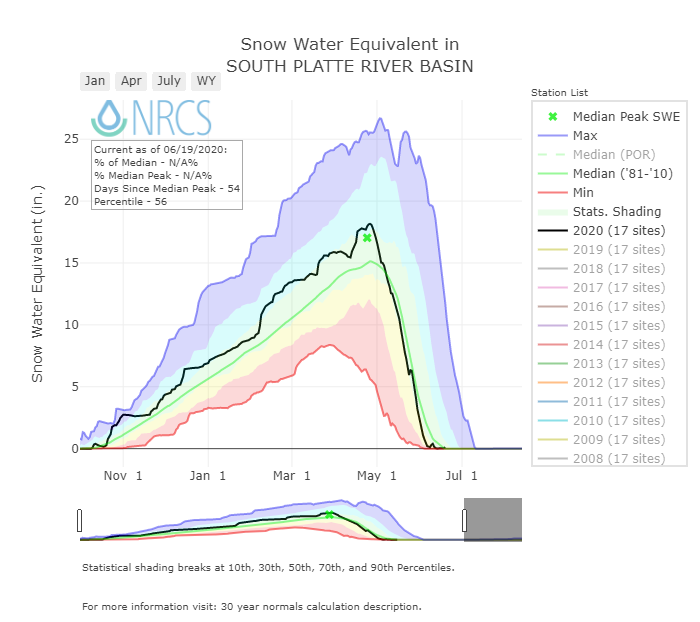
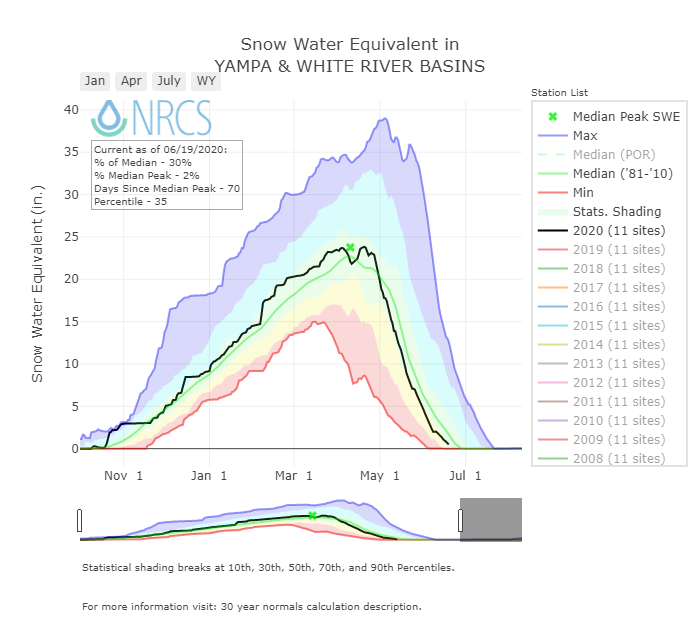
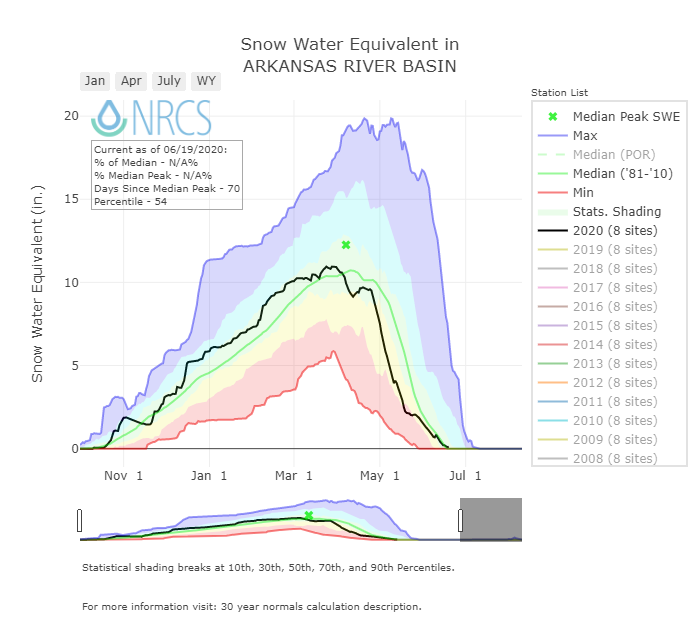
After a wet period the end of October the entire first half of November was dry but by mid-November winter got it’s legs and Colorado saw accumulation of the snowpack right near the median line starting in mid-November to mid-February. Then a bit of a split occurred, northern basins benefited from productive storm tracks out of the Pacific Northwest with southern basins missing out to a large degree. The Gunnison Basin was right in the middle, not seeing the large gains Yampa/South Platte/ North Platte Basins experienced but also not the deficits the Upper Rio Grande/San Miguel/Dolores/Animas/San Juan Basins were starting to experience. Things could have gotten really ugly for Southern Colorado but a series of storms starting mid-March put the Upper Rio Grande/San Miguel/Dolores/Animas/San Juan Basins to near normal peak SWE near the usual timeframe, and to the north a continuation of above median gains. Every snow season is a unique experience and starting in April Colorado began experiencing unique dry and hot conditions. In April and May in Southern Colorado we documented one storm April 12 and one storm May 11, and zero precipitation between April 27 and May 26 besides the minor storm (only 0.47”) on May 11. With the first two dust layers emerging to the surface during this time and the relentless sunny/warm weather the snow began ablating quickly. Northern Colorado started melting quickly as well but melt was delay from two beneficial late April storms. Starting just before May the snowpack across the entire state was undergoing rapid melt, and not just the Southern Basins where rapid melt began the first part of April. After the first week of May areas of Southern Colorado were back in extreme drought. Snow was gone at SASP (11,060’) on May 27 and gone from our Senator Beck Study Plot (12,200’) on June 3, five weeks earlier than in WY2019. As a whole the Upper Rio Grande SNOTEL stations melted out a month early (May 21 vs June 20 median). The San Miguel/Dolores/Animas/San Juan Basins SNOTELS’s melted 2-3 weeks early. The Northern Basins melted faster than normal as well but not the same degree with snow persisting longer.
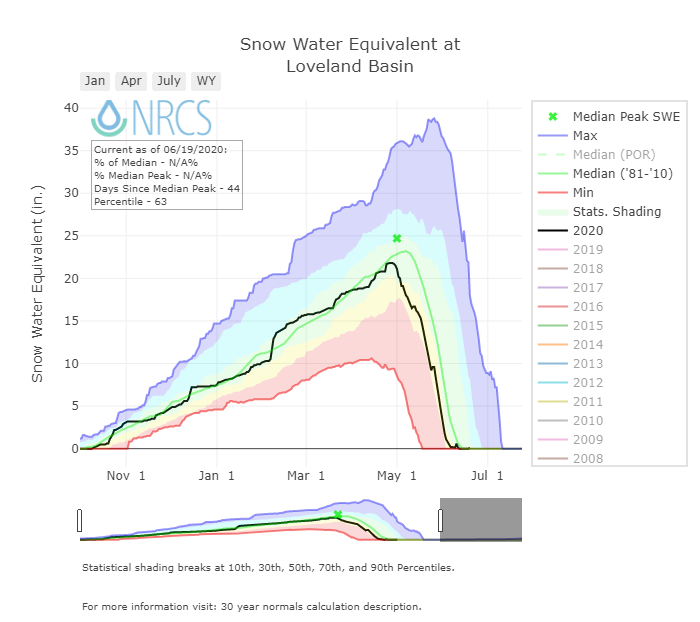
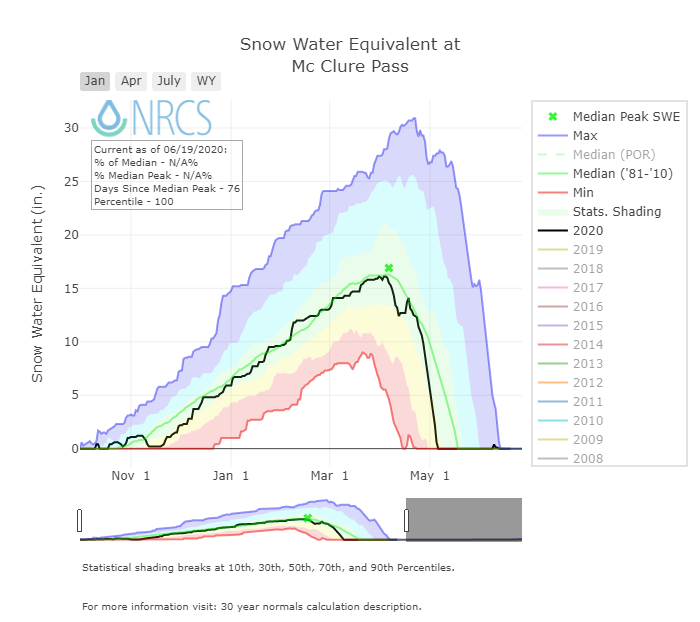
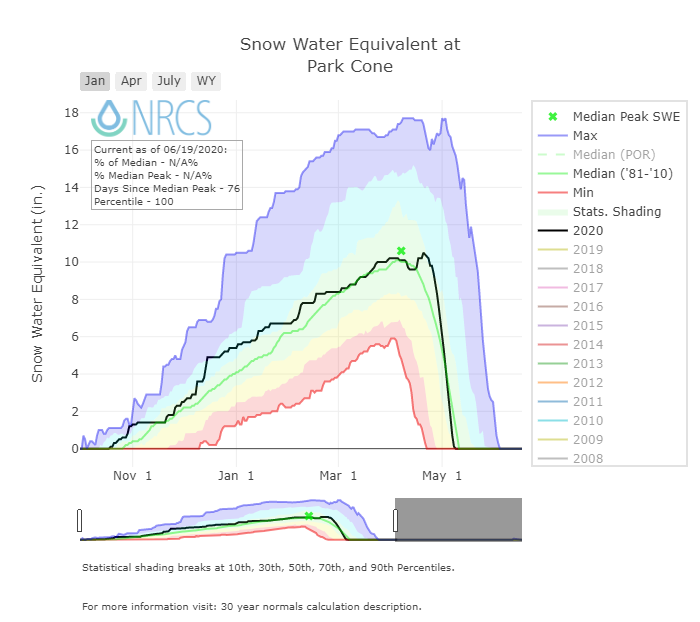
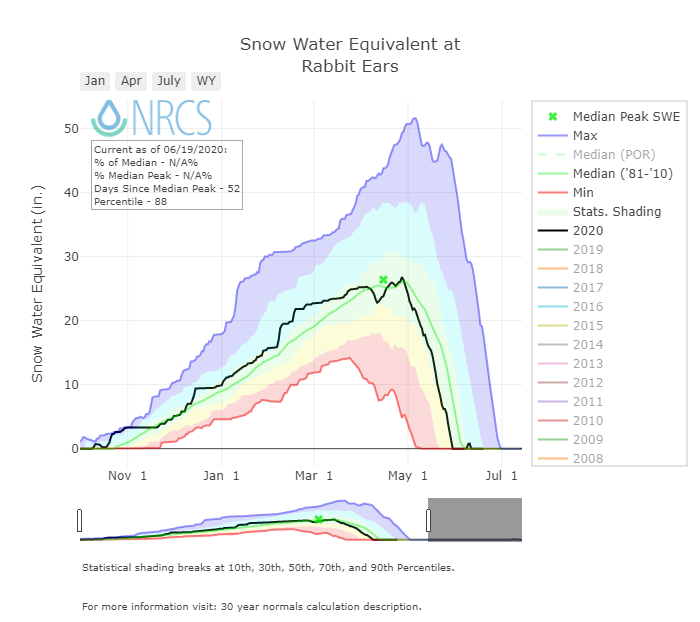
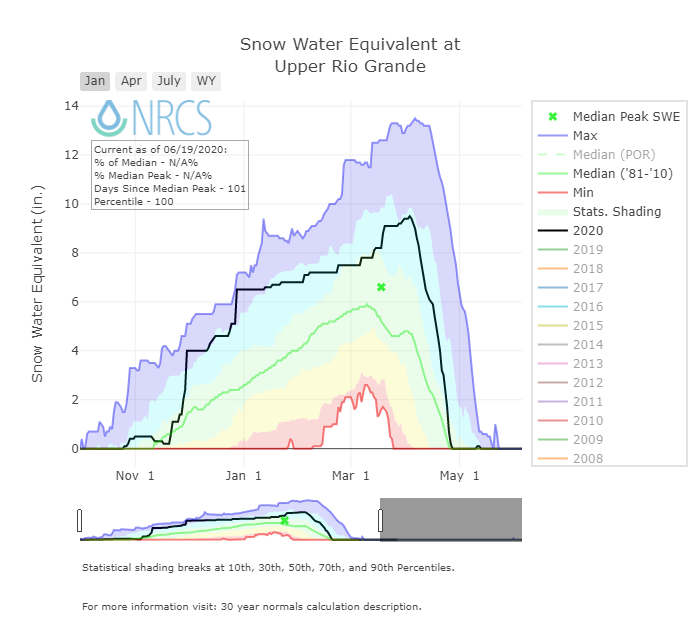

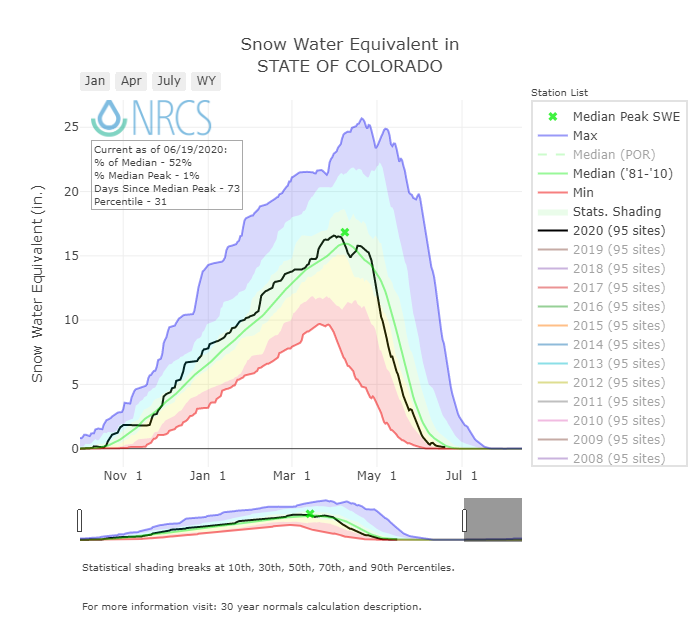
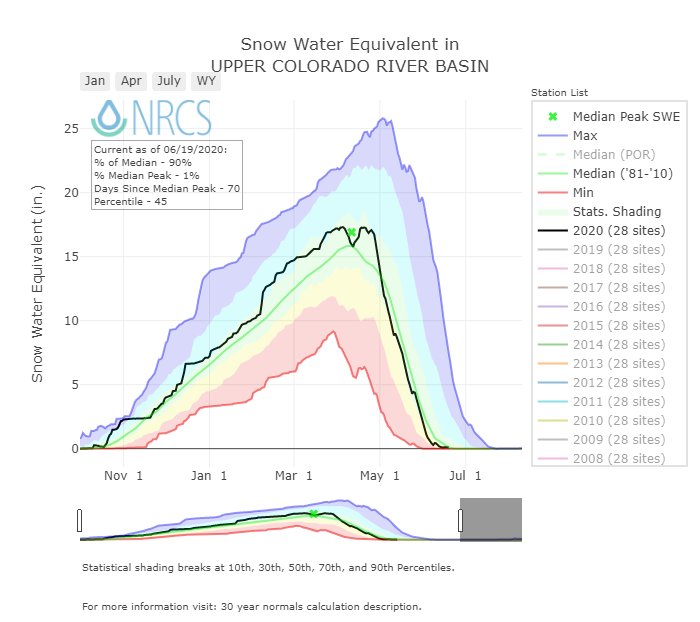
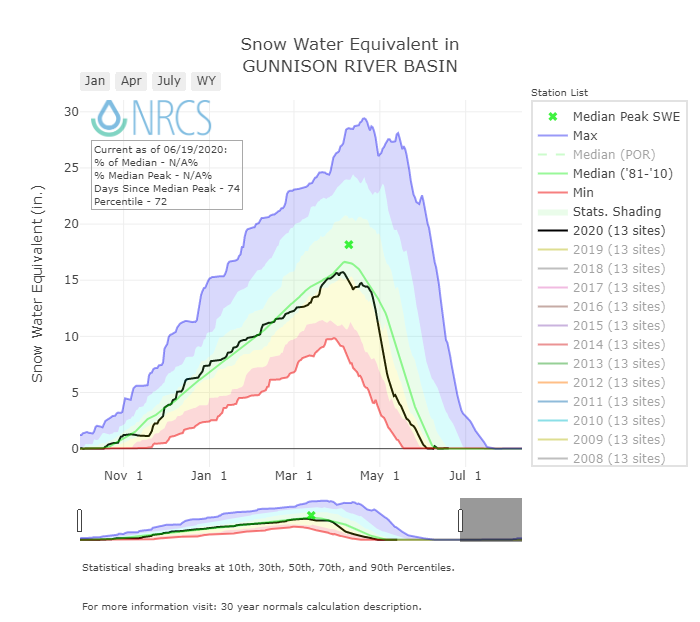
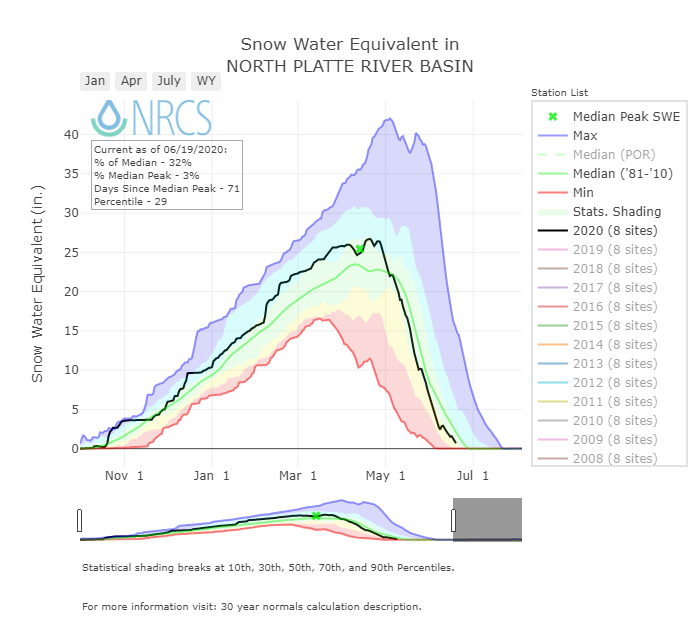
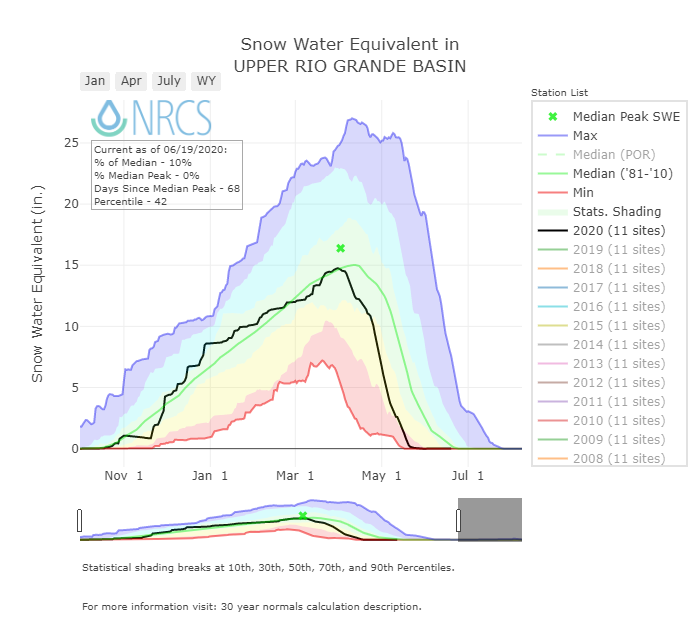
Around April 1st the snowpack was near normal for SNOTEL stations and peak SWE occurred near the normal timeframe. By the end of May however, two months later, SNOTEL’s in south and eastern Colorado were 70% or much worse than average snowpack. Northern Basins melted out quickly as well but snow persisted much longer. Majority of stations in Central/Northern Colorado were near normal or better in terms of percent snowpack.
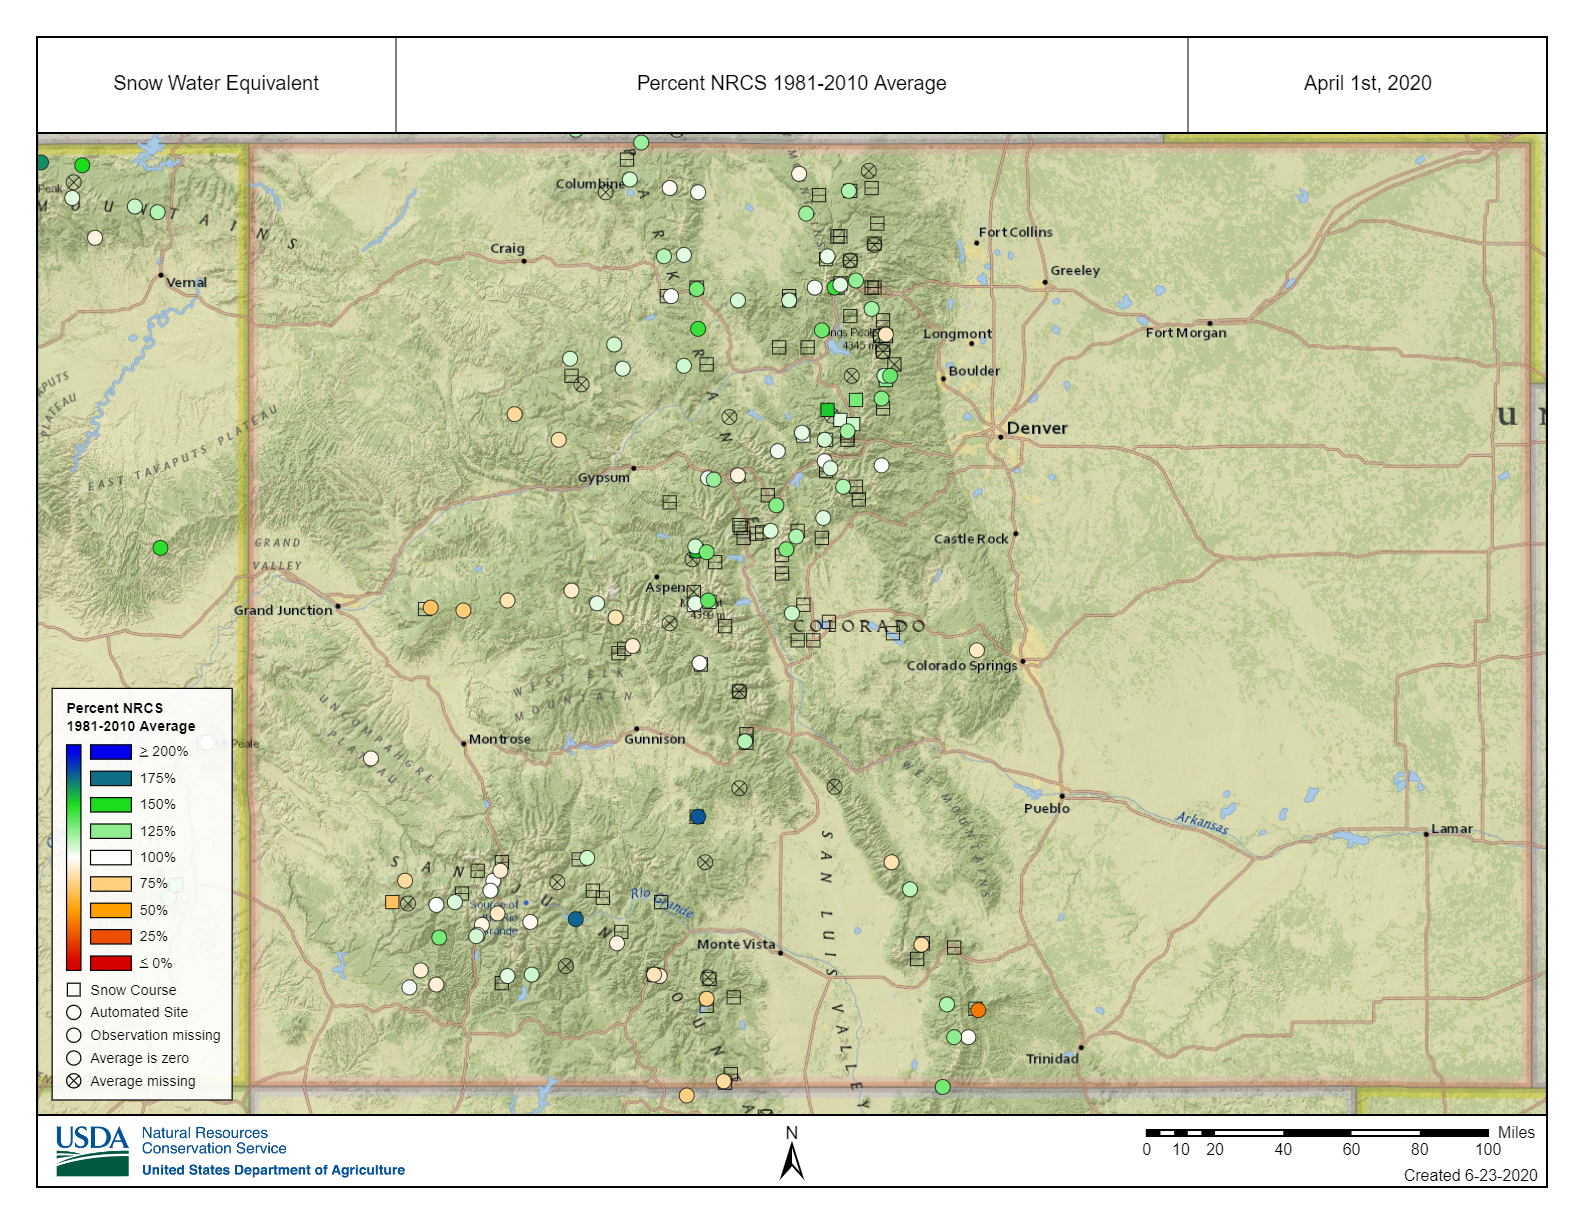
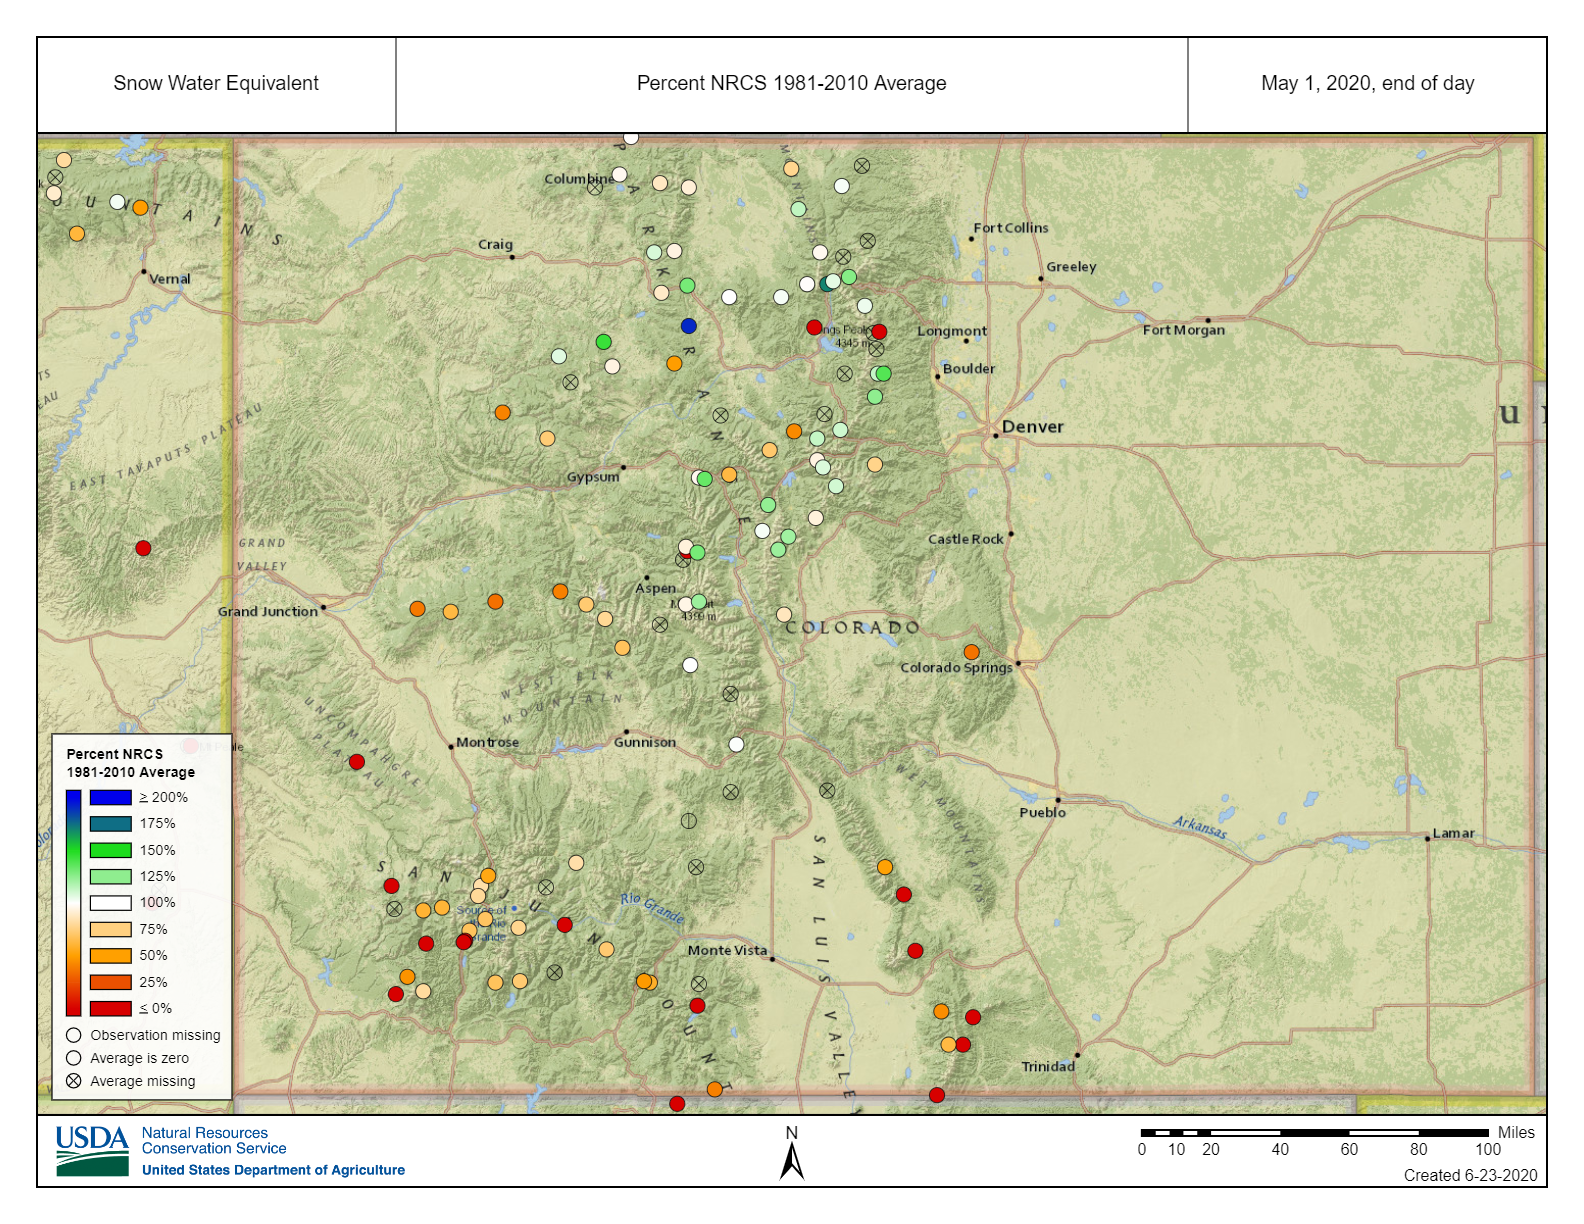
Above: SWE at SNOTEL sites on April 1 and May 1. Most stations were reporting near average SWE on April 1, by May 1 all stations in Southern Colorado and Grand Mesa area were as low as 25% of normal SWE.
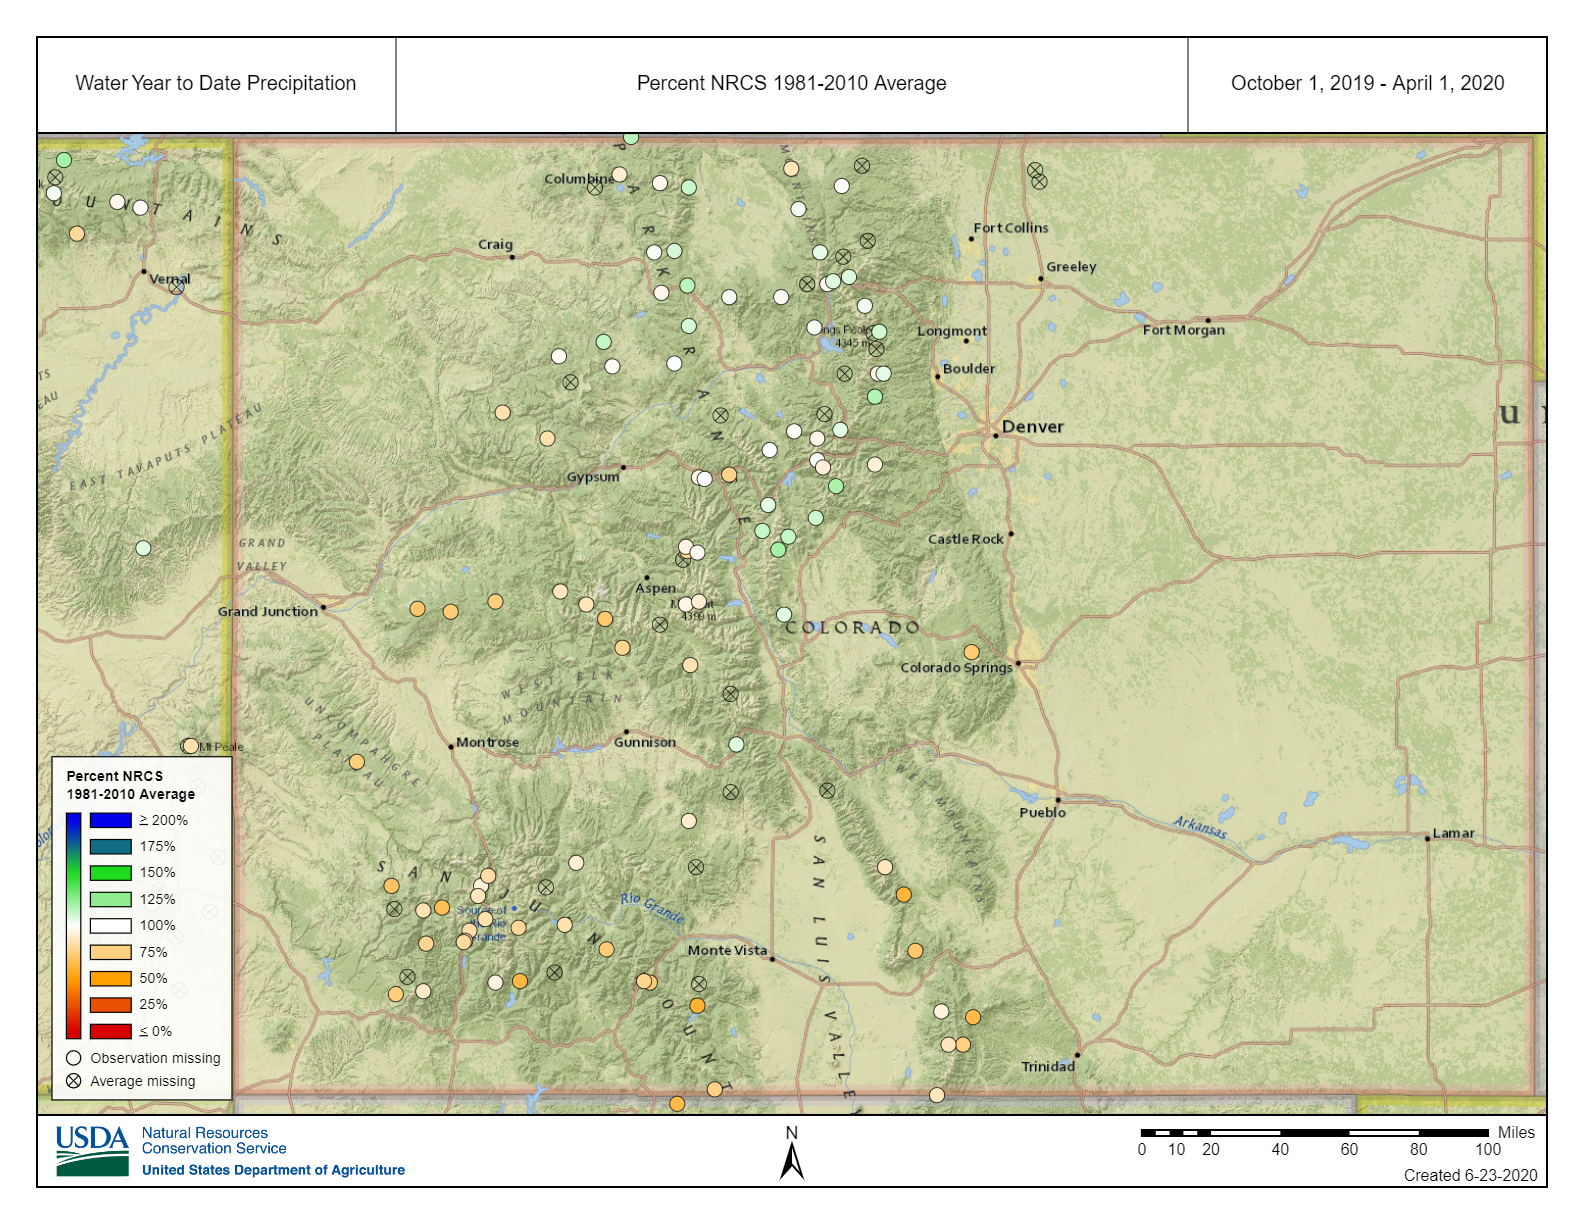
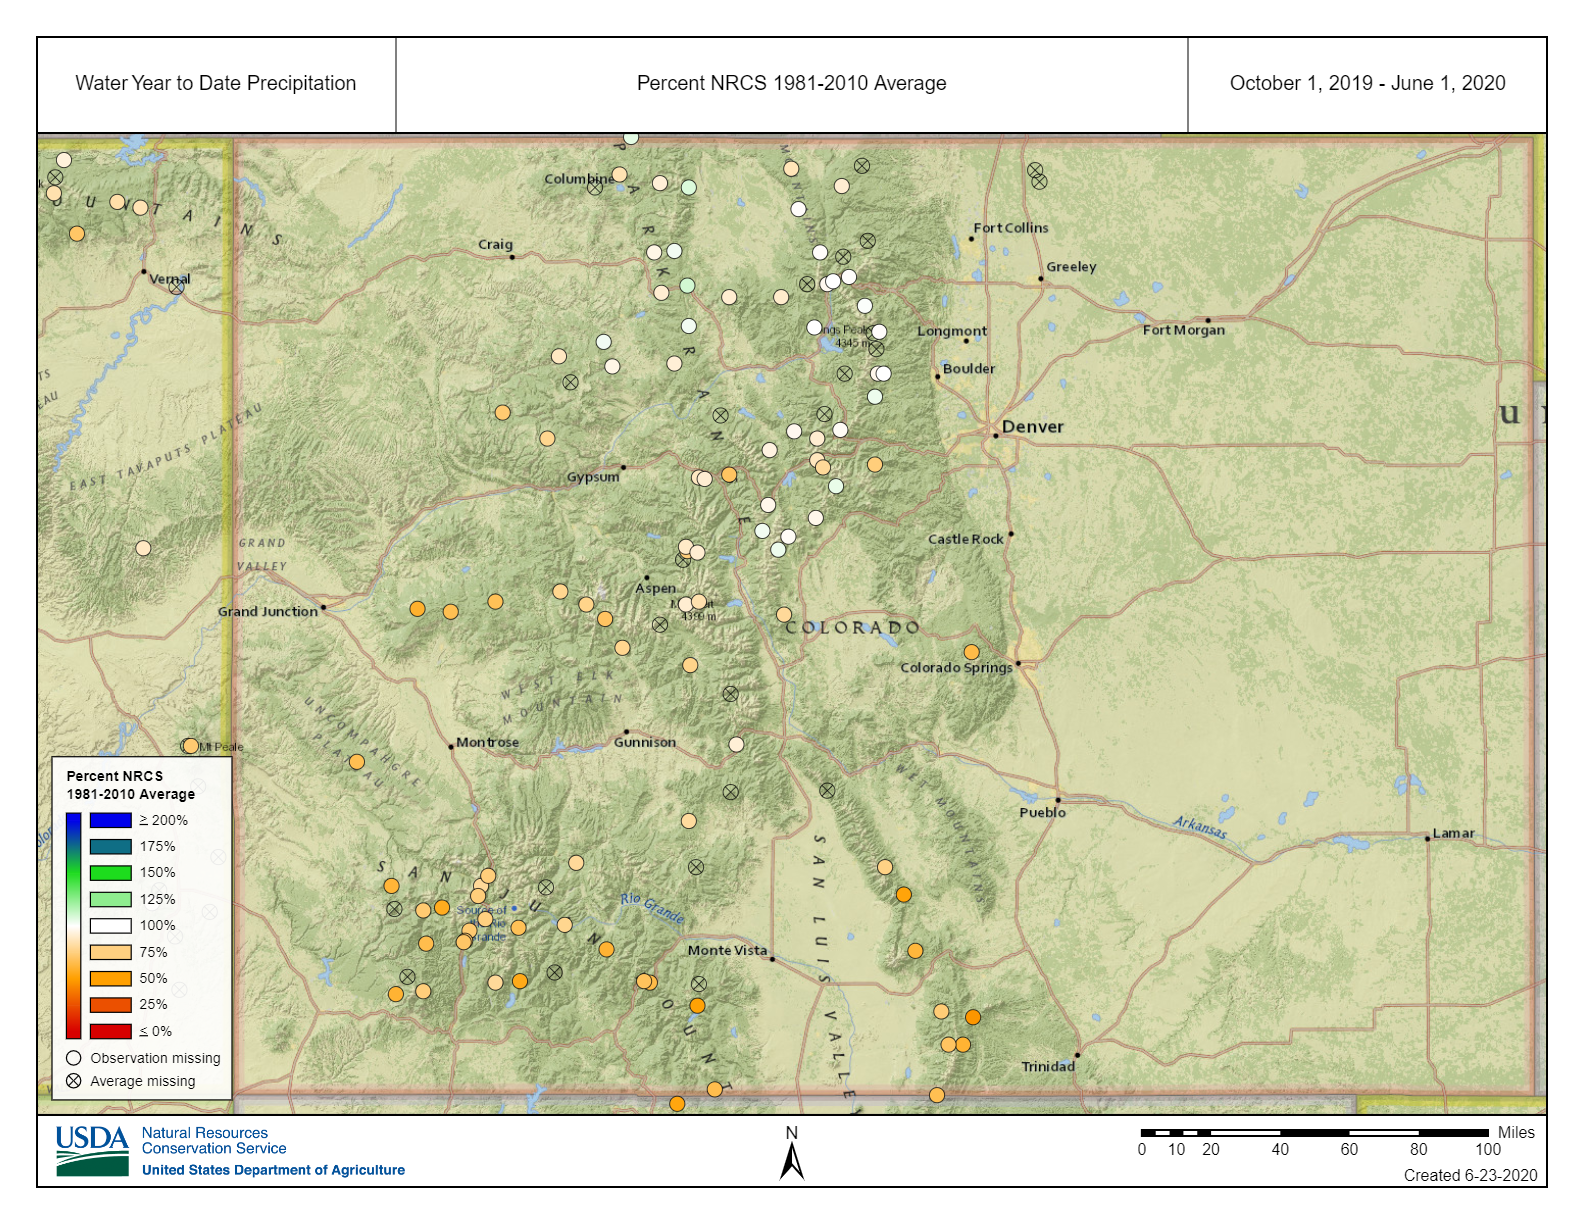
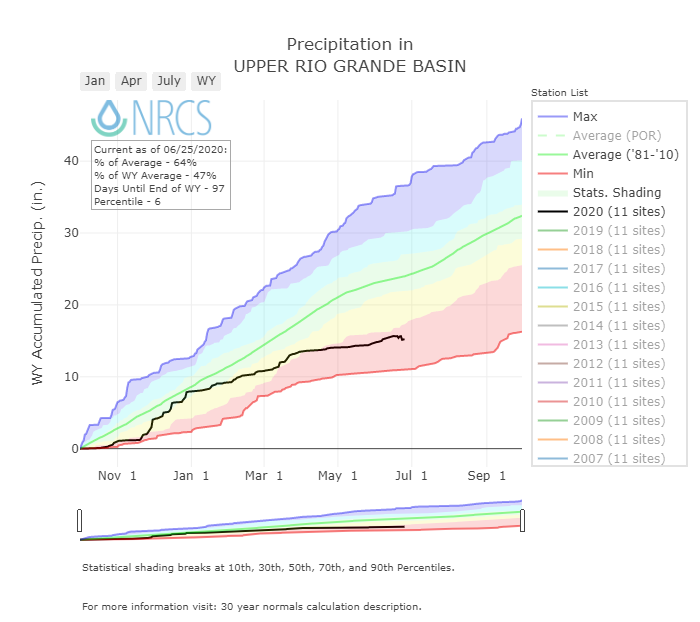
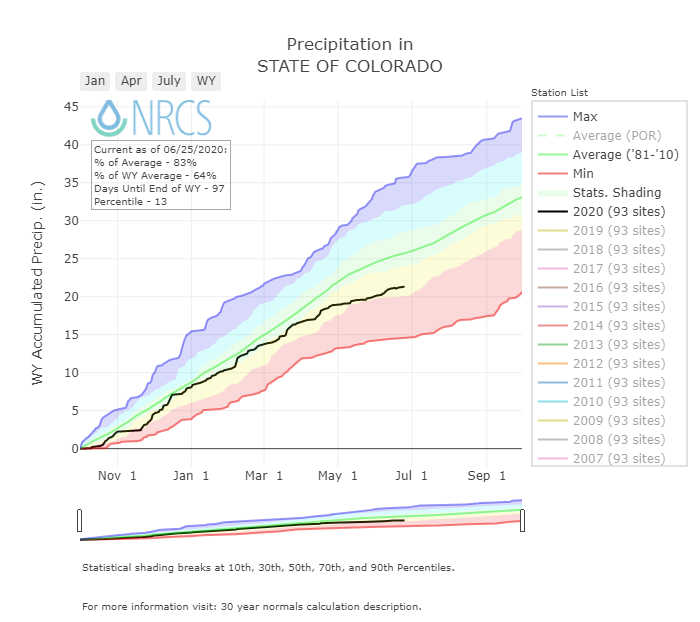
Above: Precipitation starting October 1. Shown to April 1 and into June to illustrate the precipitation deficit that worsened in late spring.
Below: Summary data for WY2020 at the 16 SNOTEL stations that CODOS monitors. The table shows peak SWE, and calculated from the day of peak SWE, melt rates, days to snow-all-gone, and mean temperature. Ten sites reached 100% of their median peak SWE or better. The sites that did not do as well were mainly Central and mainly Southern Colorado
Below. A summary of WY 2006-2020 snowmelt rates and associated conditions at the 16 SNOTEL stations that CODOS routinely monitors. Days to SAG refers to the time between peak SWE and “snow all gone” at the SNOTEL sites. Adjusted Daily Mean Loss calculates the rate of snowmelt following peak SWE, including all precipitation received after peak SWE (assumed to be snow). Melt rate tables are presented for each of the 11 CODOS monitoring sites on their webpages.
Some important points in the table below is WY2020 saw a rapid progression to snow all gone following peak SWE, three other years melted out faster than what we observed this season. And in only one other year did we receive the least snow after peak SWE occurred (WY2013). Mean air temperatures were the second hottest, post-peak SWE, in the record going back to WY2006. The dust severity in Southern Colorado was near average even though only three DOS events occurred, and towards Northern Colorado DOS conditions were light.

Snow depth at Swamp Angel Study Plot. Full snow ablation occurred around May 27.
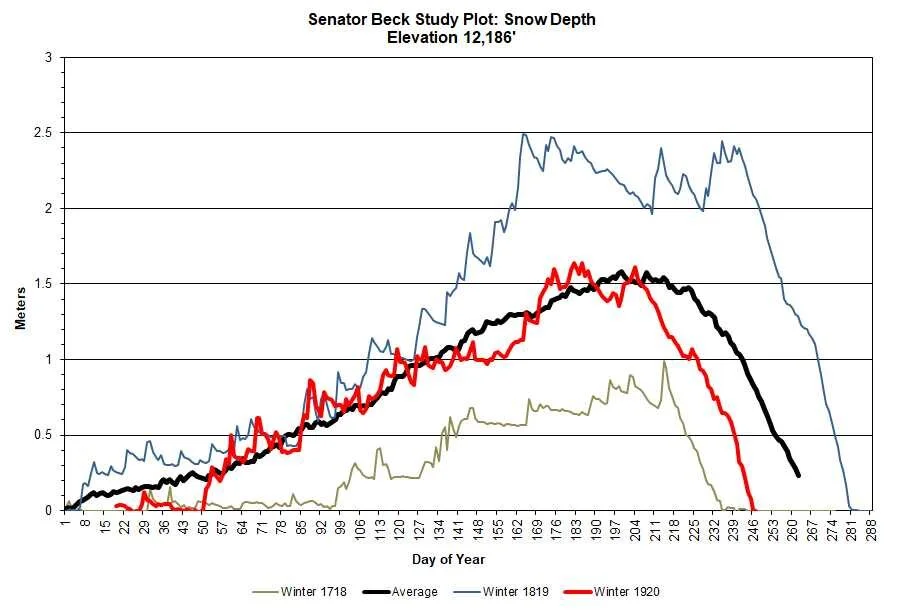
Snow depth at Senator Beck Study Plot. Full snow ablation occurred July 3 at SBSP.

Snow water equivalent at Swamp Angel. WY2020 full ablation was on May 27, compared to last year, peak SWE occurred on May 27.

Snow water equivalent at Senator Beck Study Plot. WY2020 full ablation was on June 3, compared to last year, peak SWE occurred on June 3
DUST-ON-SNOW CONDITIONS
DUST ENHANCED RUNOFF CLASSIFICATION:
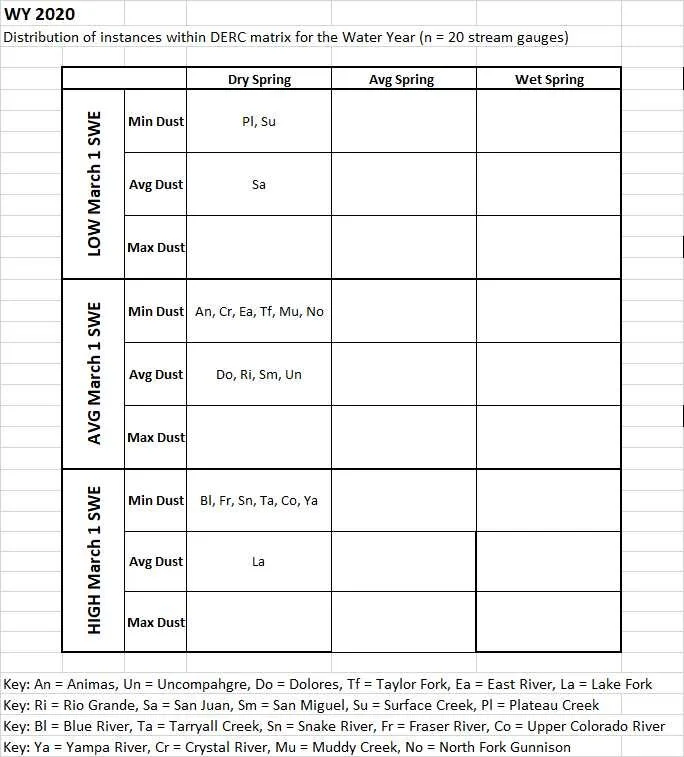
In Water Year 2015 CODOS introduced a Dust Enhanced Runoff Classification (DERC) approach to linking dust-on-snow, snowpack, and spring weather conditions to patterns in statewide hydrographs within a 3x3x3 Dust Enhanced Runoff Space. The below table presents the final DERC classification of WY2020 parameters at each of the 20 stream gauges monitored by CODOS. Water Years 2006-2020 classifications are contained in Excel workbook Runoff_Space_by_Region_and_WY.xlsx. Another workbook, Runoff_Space_by_Watershed.xlsx, contains individual DERC analyses for WY 2006-2020 for each of the 20 stream gauges.
A conceptual Dust Enhanced Snowmelt Runoff Space integrating the interactions of March 1 SWE, dust intensity, and spring precipitation.
Below: Based on the discussions describing the DERC approach in characterizing the watersheds that CODOS monitors, WY2020 snowmelt season conditions are summarized in the tables below. Essentially, Colorado WY2020 snowmelt runoff behaviors fell into general patterns of “Minimum” or “Average” dust severity, mostly “Average” or “High” March 1 SWE, and all sites had a “Dry” spring.
The Senator Beck Basin received 3 dust events this season, an event on January 16/17, March 26, and April 2. All three events were relatively light but significant enough to negatively affect the energy budget of the snowpack; increasing absorption of solar radiation resulting in faster snowmelt. And, particularly for a dry spring like we had this year was extra detrimental, as 2 of the dust events were deposited near the time of peak SWE hence sat on the snow surface the duration of snowmelt with only a limited few occasions that a precipitation event covered the dust, providing a temporary “albedo reset”. Since dust event #1 was the first dust event to occur in winter 19/20 it was the last to merge at the surface of the snowpack. It started to emerge around May 13 and was fully merged with dust #2 and #3 by May 19 at the latest.
At our Wolf Creek monitoring site observations showed D1/2/3 were slightly more severe than at Senator Beck on Red Mt. Pass. In addition the Southern San Juans received at least one extra dust event that was not observed elsewhere. When these layers merged at the surface it was a bit more”dirtier” than Senator Beck or any other place in Colorado.
Since the storm tracks that deposited the dust in the Colorado Mountains came out of the Desert Southwest, dust presence and severity diminished greatly as one traveled to Central and Northern Colorado. In Central Colorado the dust layers were noticeable but very light. In Northern and Eastern Mountain locations dust was not observable at all.
Above: Total dust-on-snow events by month. March begins the more intensive part of dust-on-snow season. In WY2020, only 1 event occurred in January, 1 event in March, 1 event in April.
Above: Total dust-on-snow events by year. All three dust events in 2019/2020 were “wet” events, accompanied with precipitation.
Above: Variance of combined March, April, and May precipitation for the SNOTEL stations adjacent to or near CODOS monitoring sites. This bar graph illustrates well why streamflows turned out the way they did. The 6 bars to the left are in the San Juan Mountains, on average, 45% decline in normal precipitation during March/April/May. The Central and Northern Colorado fared a little better with declines near 30%.
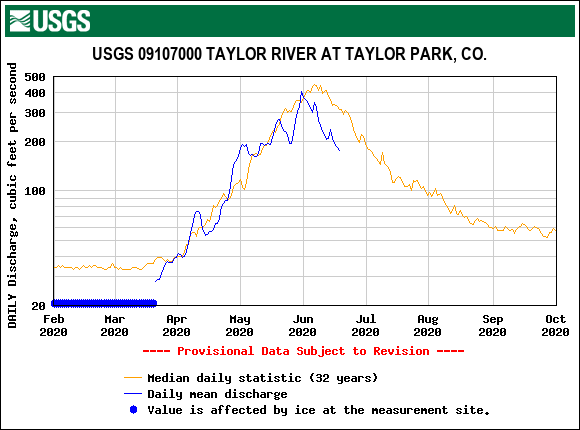
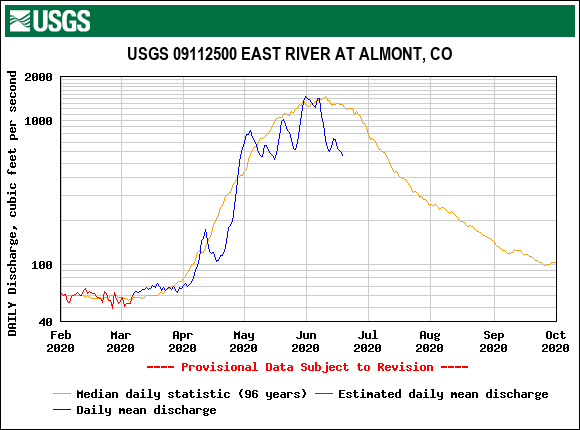
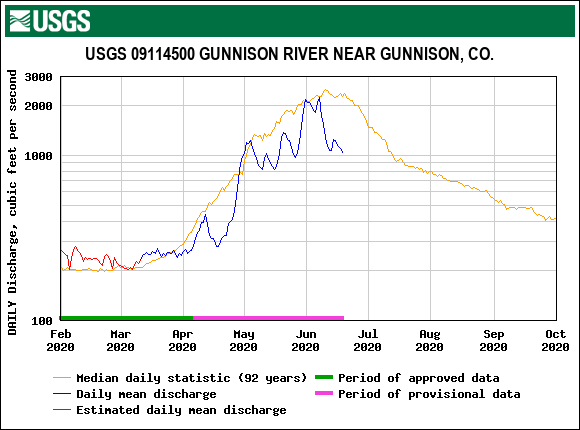
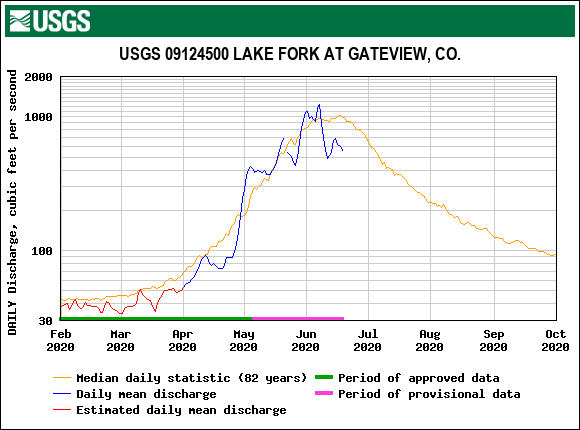
RUNOFF BEHAVIOR
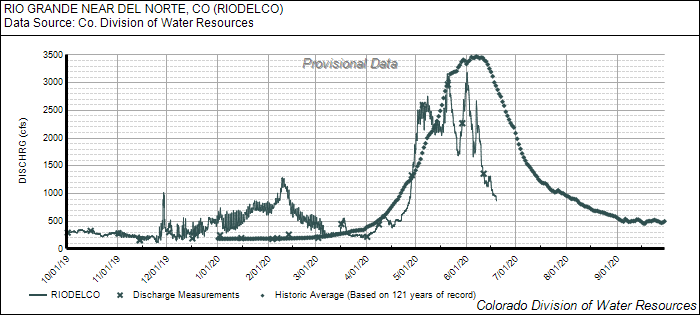
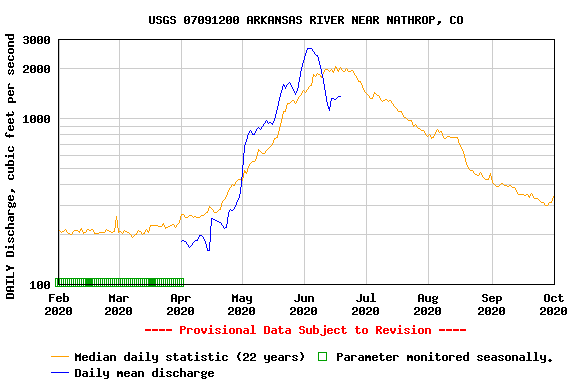
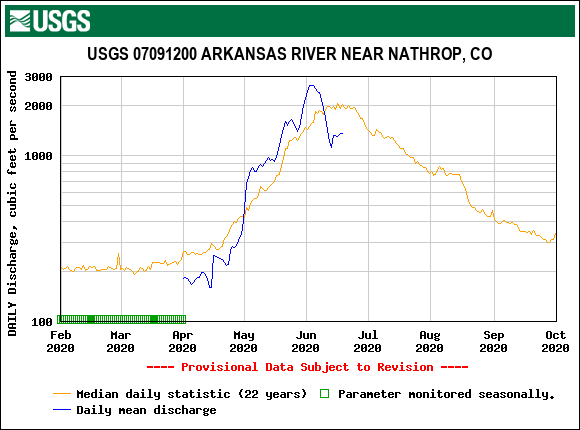
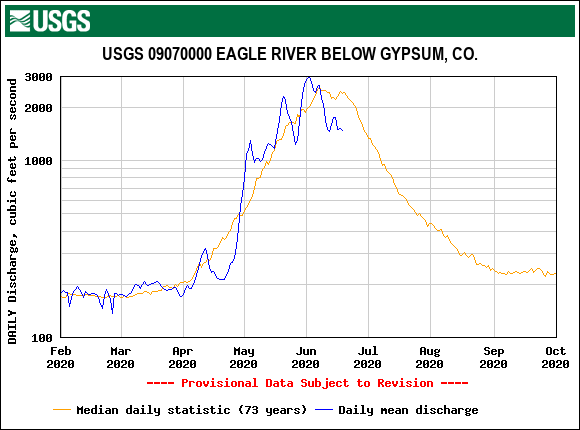
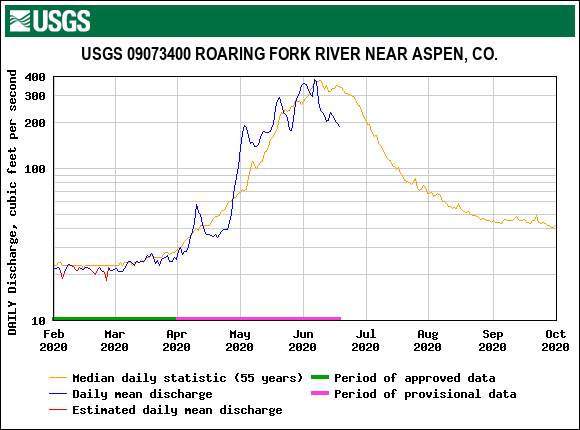
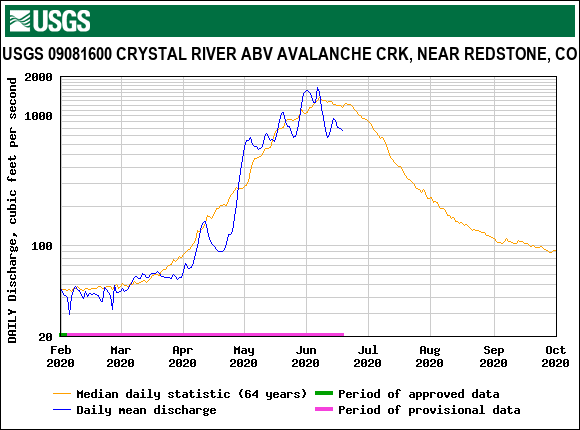
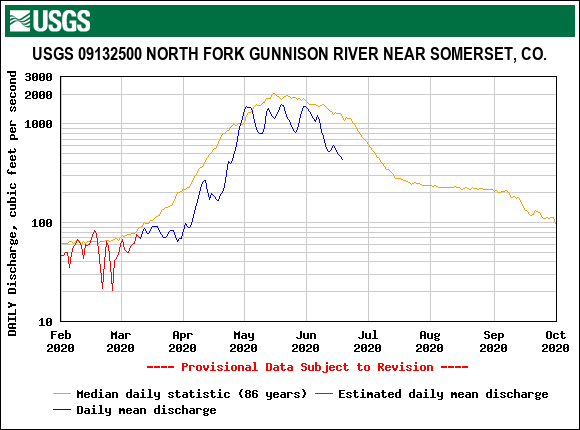
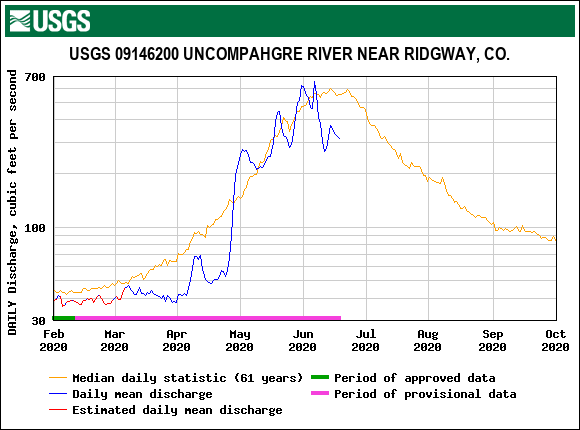
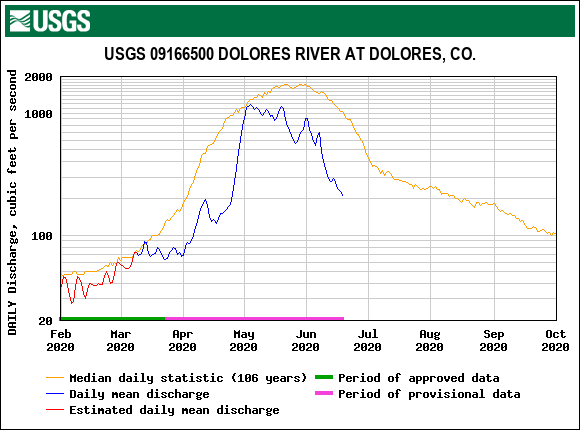
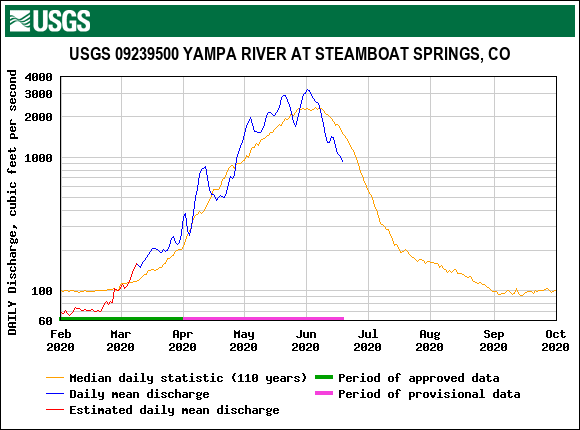
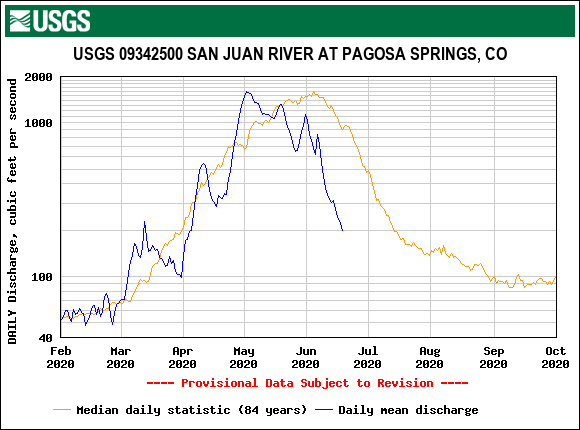
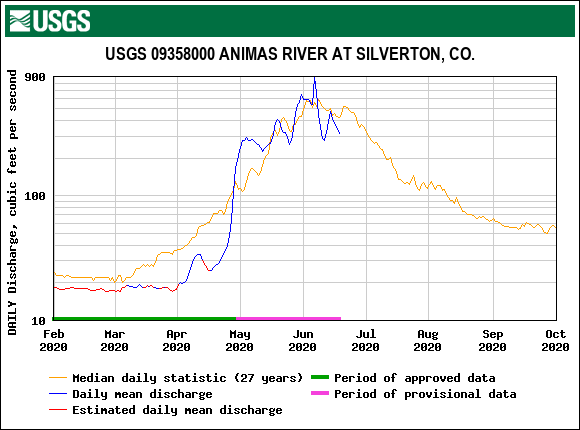
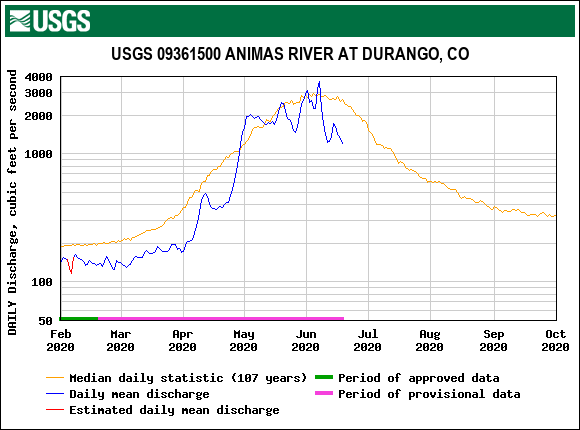
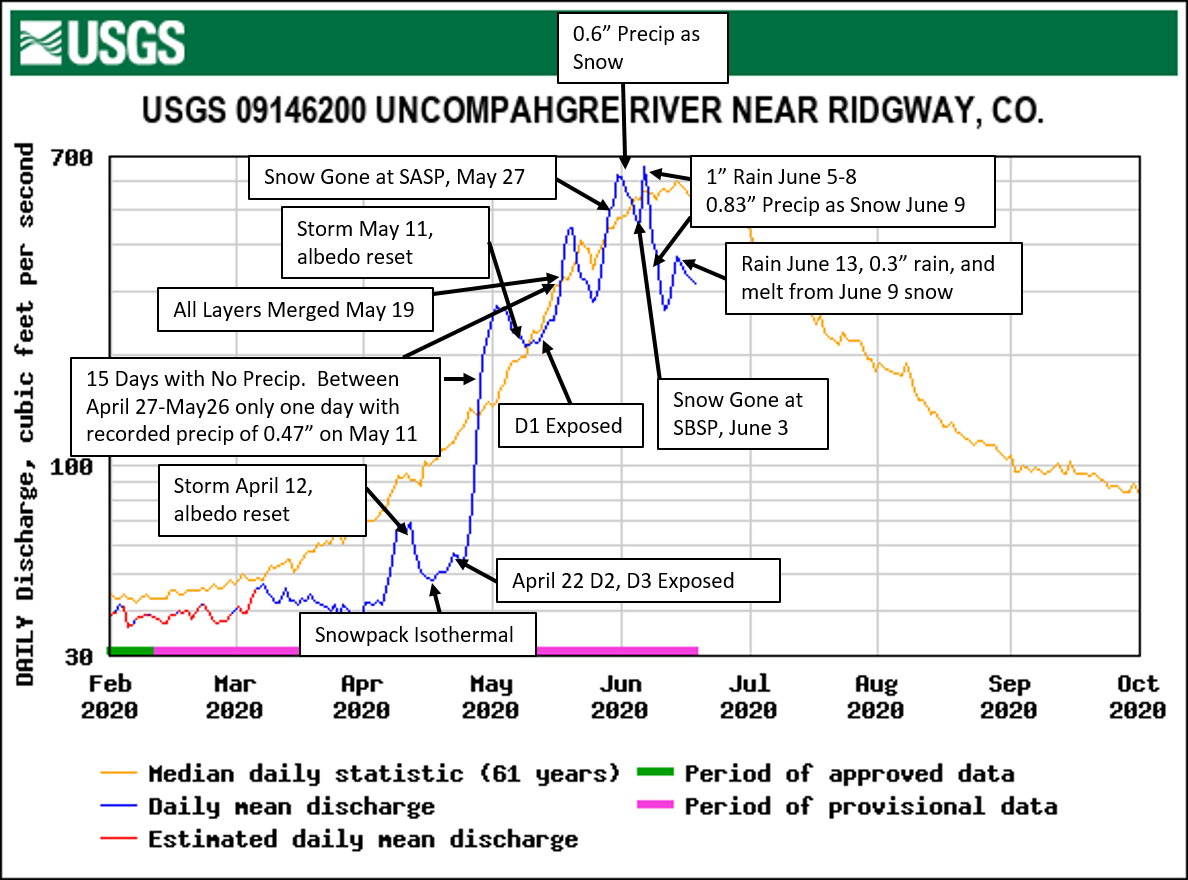
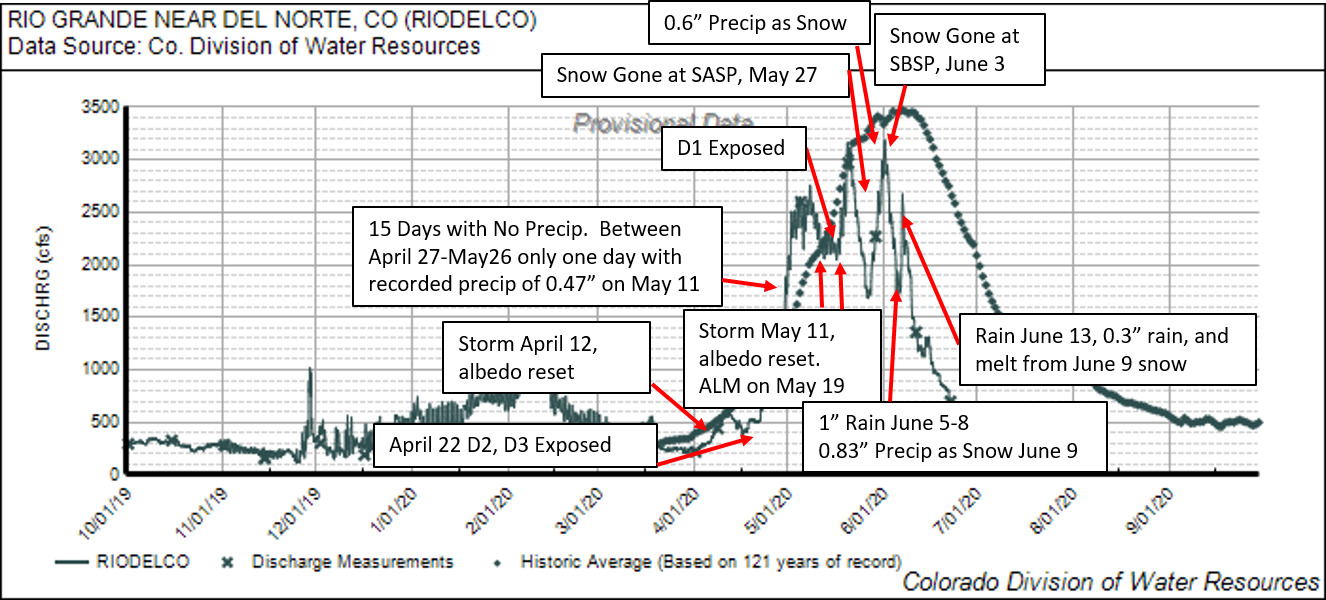
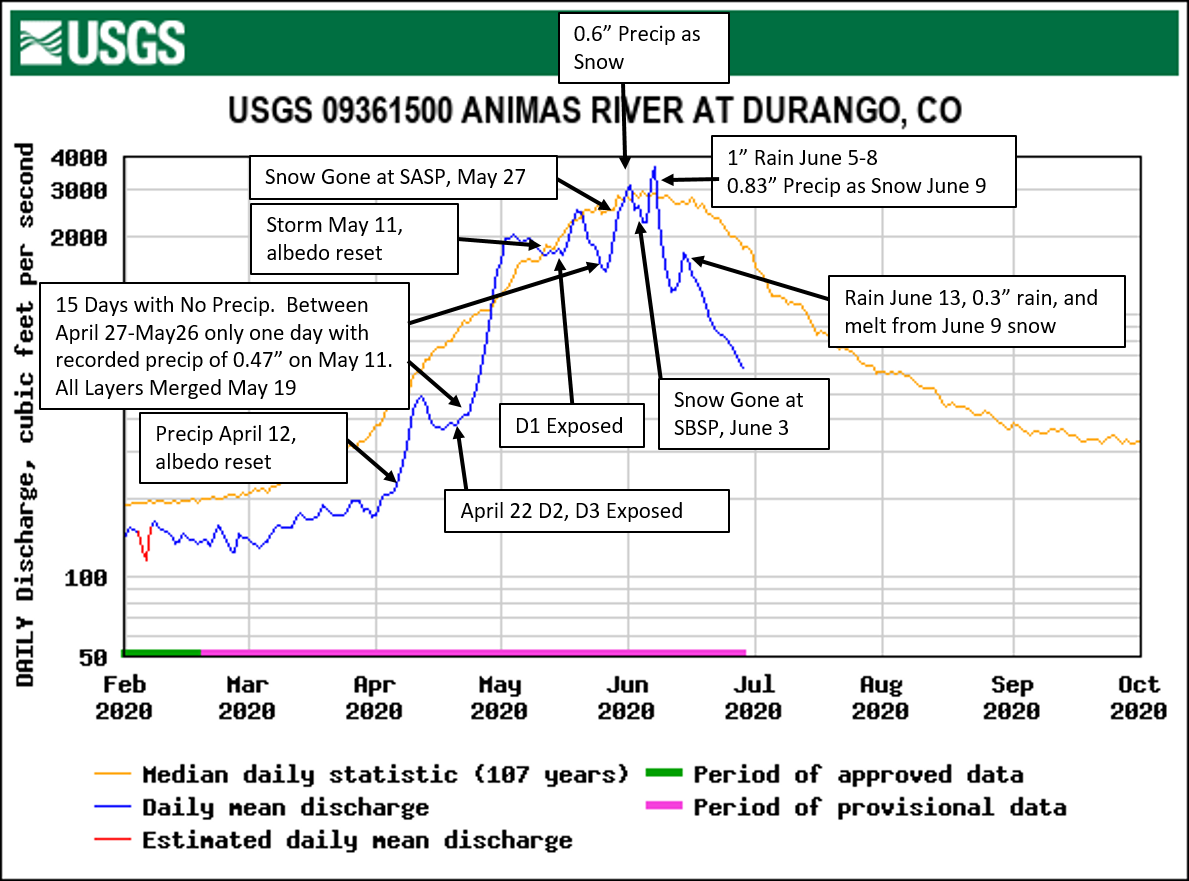
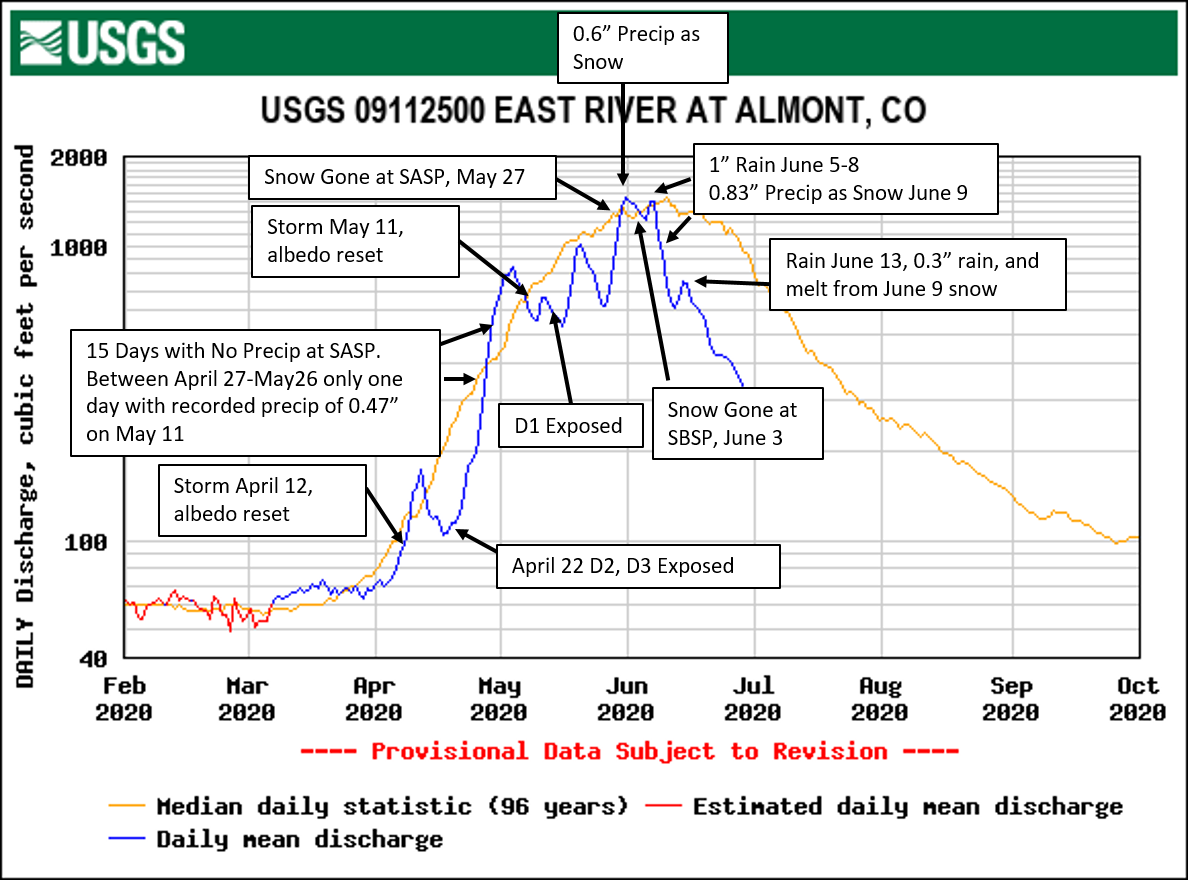
One of the biggest questions as the snowpack accumulated was, given the severe soil moisture deficit, just how much melt water would make it to the streams and how much would go towards replenishing the thirsty soils. Indeed, baseflows were extremely low going into the winter season and mostly continued being below normal through winter. Streamflow remained below median starting early spring continuing until end of April, only rising above normal streamflow because of the early and rapid melt of the snowpack. It is worth repeating that it was one of the worst springs for precipitation in the data record, SBB received one minor storm between April 27 - May 26 and it was the second hottest post-peak-SWE period going back to 2006. With the extreme dry soils in Southern Colorado (and improving northwards) and dry/warm weather and exposed dust-on-snow starting latter April, the snowmelt we might have expected in the streams in early spring, and might have expected in early summer looking at the data in April, was consumed by thirsty soils and increased evaporation/sublimation of the snow. Peak discharge occurred near the usual timeframe (Animas) or up to three weeks (Dolores) early depending on watershed but overall volumes were low and from the peak rapidly fell due to the lack of additional precipitation.
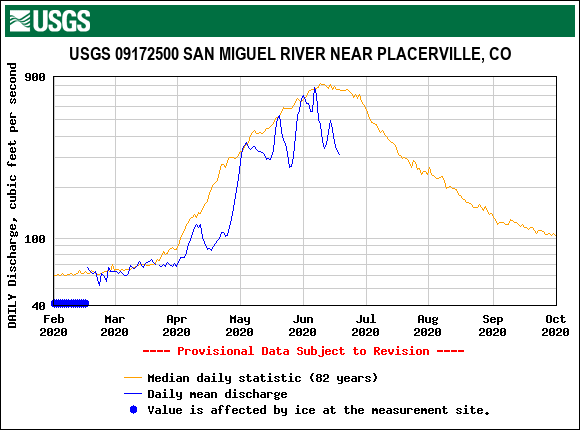
Swamp Angel (11,060') and Senator Beck (12,200') are good sites to gauge general snowmelt timing/rates/relative amounts at those general elevations throughout the San Juan region. When snow is gone at Swampy is when we typically see a spike in streamflows (the SBB stream gauge and gauges in adjacent gauges in surrounding watersheds mirror each other) and when the Senator Beck site is snow gone is when we see the second spike in the hydrograph. Which peak is bigger depends on season (WY2019 the second spike was bigger because of all the snow, in WY2018 the first spike was bigger because of the higher elevations got in the game early on). This year, snow was all gone at Swampy on May 27, a short time later, relatively, snow was gone at Senator Beck on June 3. This year would have likely seen the first peak being bigger - because Senator Beck was melting fast and early too - but, 1" rain fell June 5-8 right when Senator Beck had arrived at snow all gone. So that added a bump in streamflow not anticipated by snowmelt alone, resulting in an overall slightly greater peak June 6 that was assisted by the rain event.
Then, on June 9 it snowed a cold light density snow of ~5" in Silverton and the Northern San Juan Mountains, providing a bit of reflected radiation to the remaining snowpack along with a cooler weather system throughout the region. Combined with a 0.3” rain on June 13 resulted in the smaller peak we see in the hydrograph (see below). Without the additional rain and snow on June 5-8, June 9, and June 13 I would have expected the hydrograph to have spiked a bit after Senator Beck melted out, but not as much as when Swampy melted out, and then more or less steadily decrease in streamflow from there on out. These rains and the late snow occurred when the soils were wet from snowmelt making for a brief but more efficient runoff.
The early streamflow peaks and lack of snowmelt volume meant that many water reservoir managers had a hard time meeting water demands early on.

LOOKING AHEAD
Currently, stream gauges are well below median levels as the hangover from a dry April-June, and water year in general, continues.
El Niño Southern Oscilation (ENSO) is a periodic fluctuation in sea surface temperature and the air pressure of the overlying atmosphere across the equatorial Pacific Ocean. ENSO predictions and what it might mean for the 2020/21 snowpack are taking shape. In a nutshell, there is a ~60% chance of ENSO-neutral during Northern Hemisphere summer 2020, with roughly equal chances of La Niña or ENSO-neutral (~40-50%) during the autumn and winter 2020-21. With Colorado sitting in the transition zone, La Niña can generally mean wetter and cooler towards Northern Colorado and dryer and warmer towards Southern Colorado.
Current long-term outlooks are suggesting the remaining summer and fall will be warmer than average with a decreased chance of precipitation.