

SUMMARY
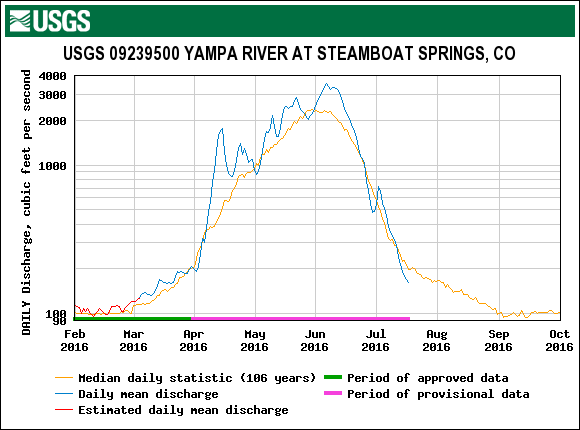
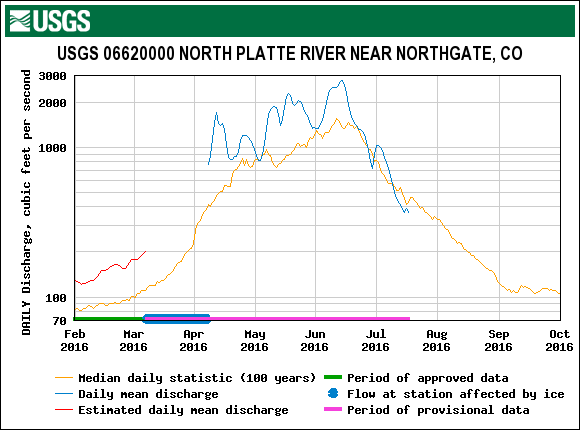
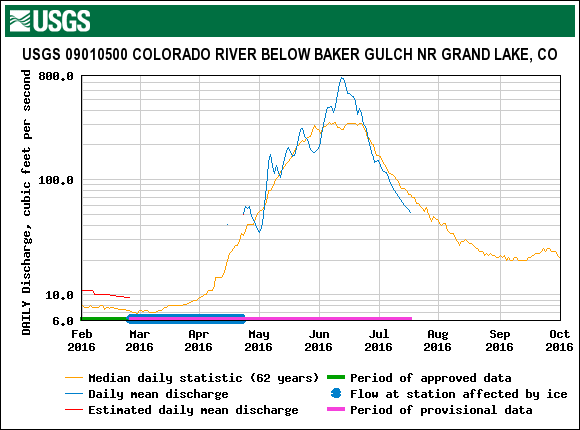
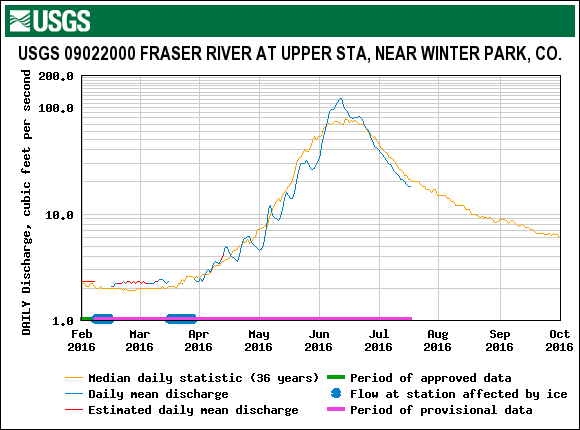
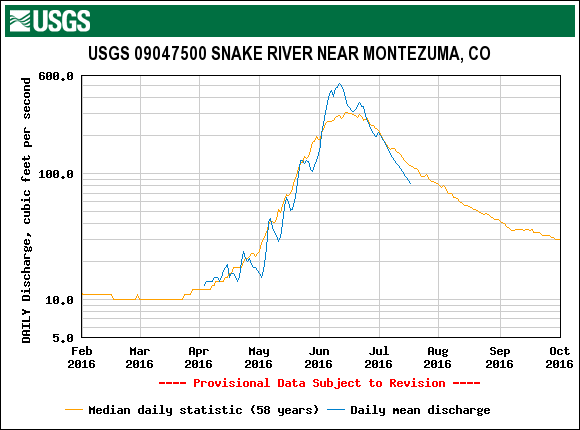
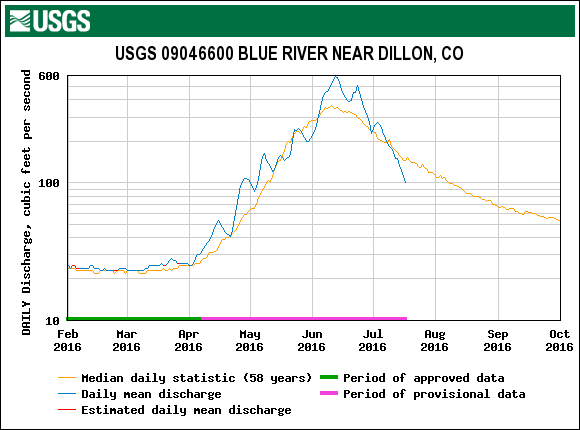
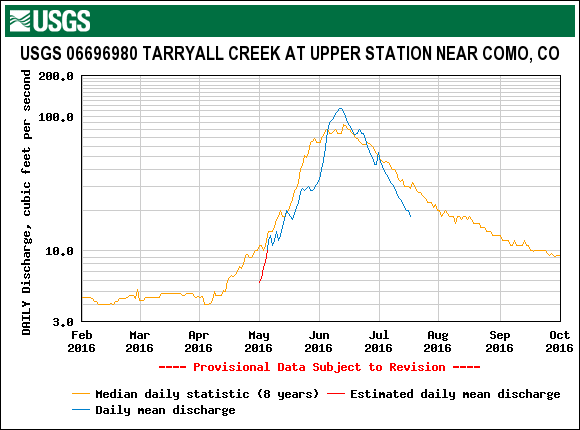
The result of a “Godzilla” El Nino year was basically an overall average statewide snowpack. The entire state started off WY2016 with a bang building the snowpack at a higher rate than average Oct/Nov/Dec/Jan. In February conditions took a turn for the worse with dry/warm weather lasting until mid-March for northern Colorado, and being much more severe and lasting until latter March for southern Colorado. Northern locales recovered nicely from this dry stretch but the Rio Grande, Gunnison, and Animas/Dolores struggled the remainder of the season. The month of May was generally overcast, cooler than average, and brought multiple precipitation events, putting a damper on snowmelt until conditions turned very warm the very end of May. Many streams in southern Colorado saw peak discharge, well above their median values, around the June 5-10 timeframe.
At the Center for Snow and Avalanche Studies’ (CSAS) Senator Beck Basin Study Area at Red Mountain Pass, the primary CODOS monitoring site, WY2016 produced a total of six separate dust-on-snow events, approximately an average dust loading season based on previous seasons going back to WY2005. Dust season began at Senator Beck in December with a single event – placing it low in the snowpack, effectively making it insignificant in its role on spring snowmelt. However more dust events followed with one event in February, two events in March and two events in April – with the end result making it an average year in terms of number of dust events, total mass loading of dust, as well as location (i.e. upper portion) of dust in the snowpack and its consequential role in snowmelt. Central and northern CODOS sites remained dust free the majority of the season, with the central sites receiving 1-2 dust mild events late in the season.
This Season Summary will often reference or link to snowpack, streamflow, weather, and climate products generated by the NRCS SNOTEL program, USGS National Water Information System, and NOAA National Weather Service and Climate Prediction Center respectively, as presented and archived on CODOS monitoring site webpages.
WEATHER CONDITIONS
There were high expectations the start of WY2016 with the hope that the “Godzilla El Nino” would deliver vast amounts of precipitation across the state of Colorado. In many ways the El Nino played out, generally, according to the typical ENSO seasonal signal of a wetter fall (September/October/November) and spring (March/April/May) but drier during mid-winter (December/January/February). Broken down more specifically by region, the north-central mountains generally see a wet fall, drier winter, with spring divided between dry/wet. Southwestern Colorado and Rio Grande Basin generally see a wet fall, winter divided between dry/wet, and spring typically wetter but not as strong a signal as in fall.
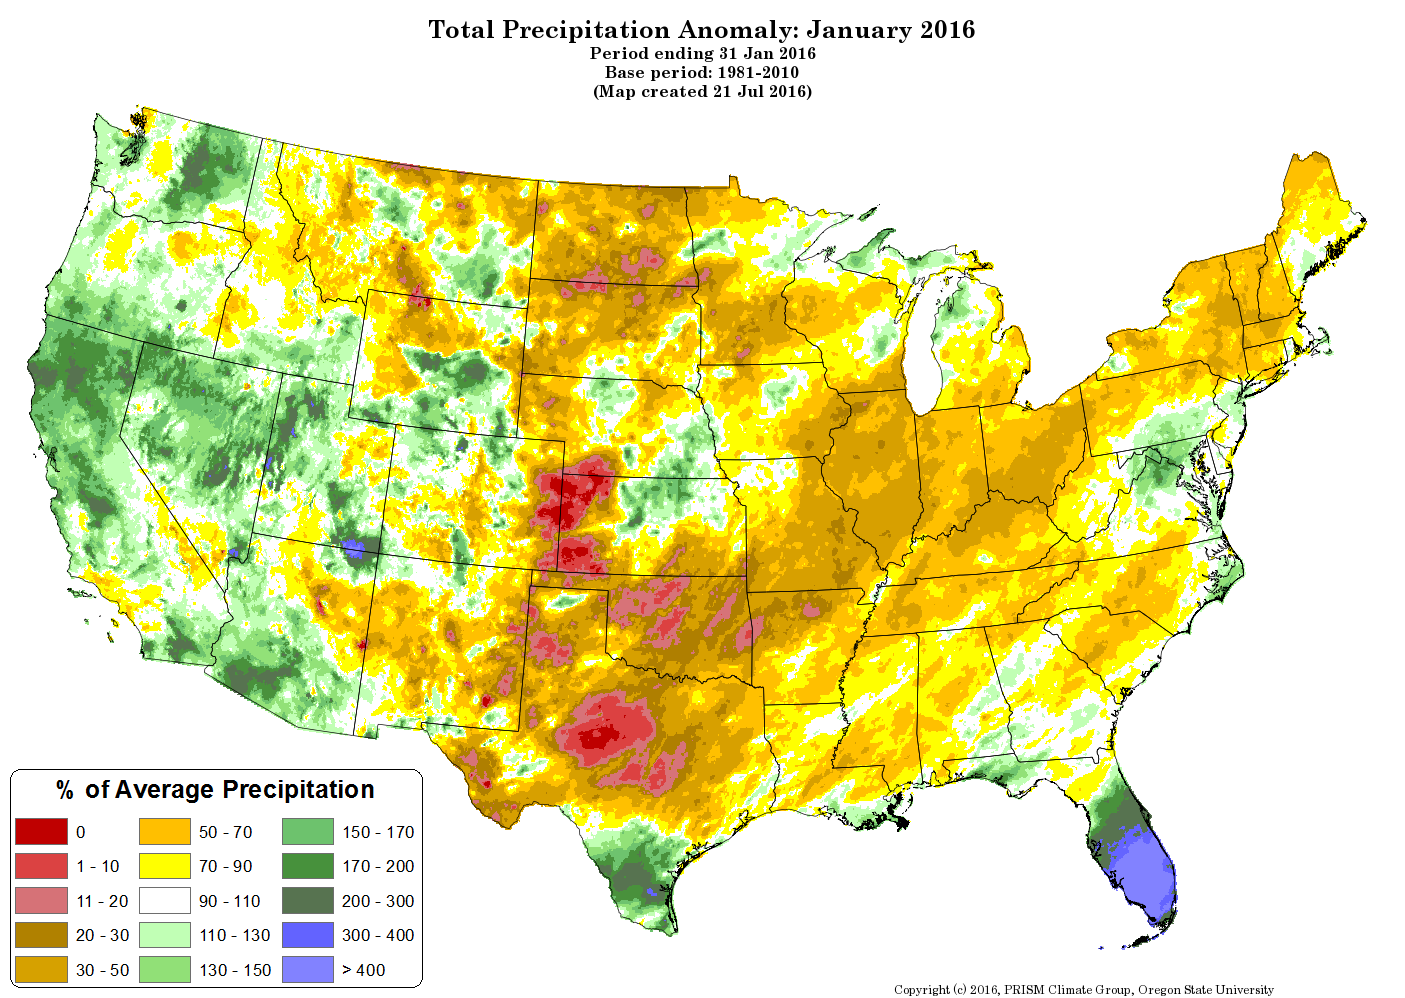
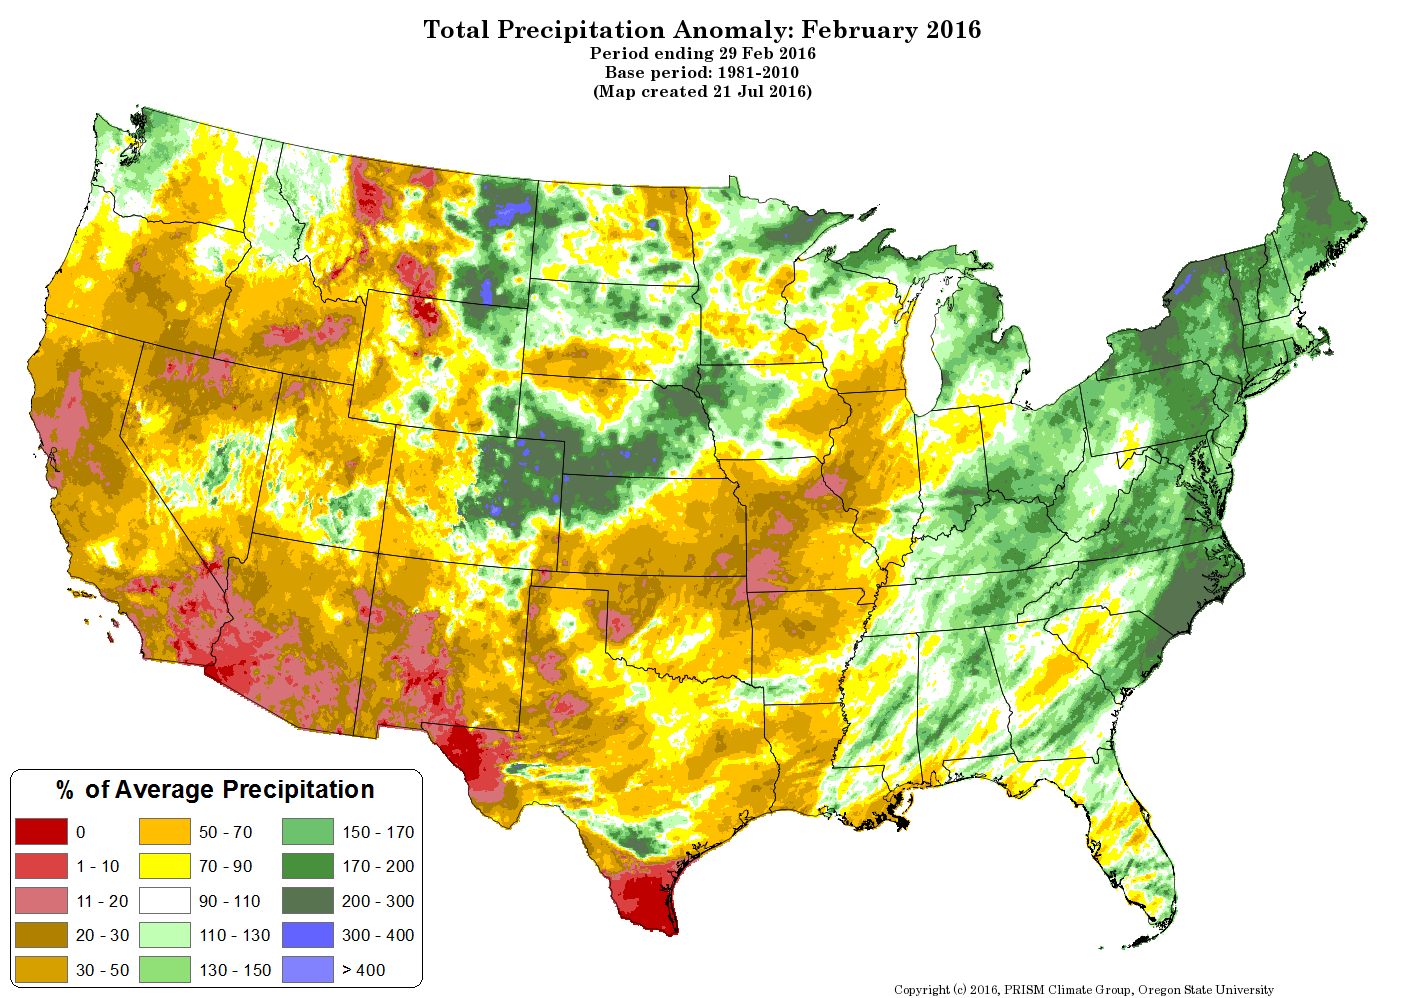
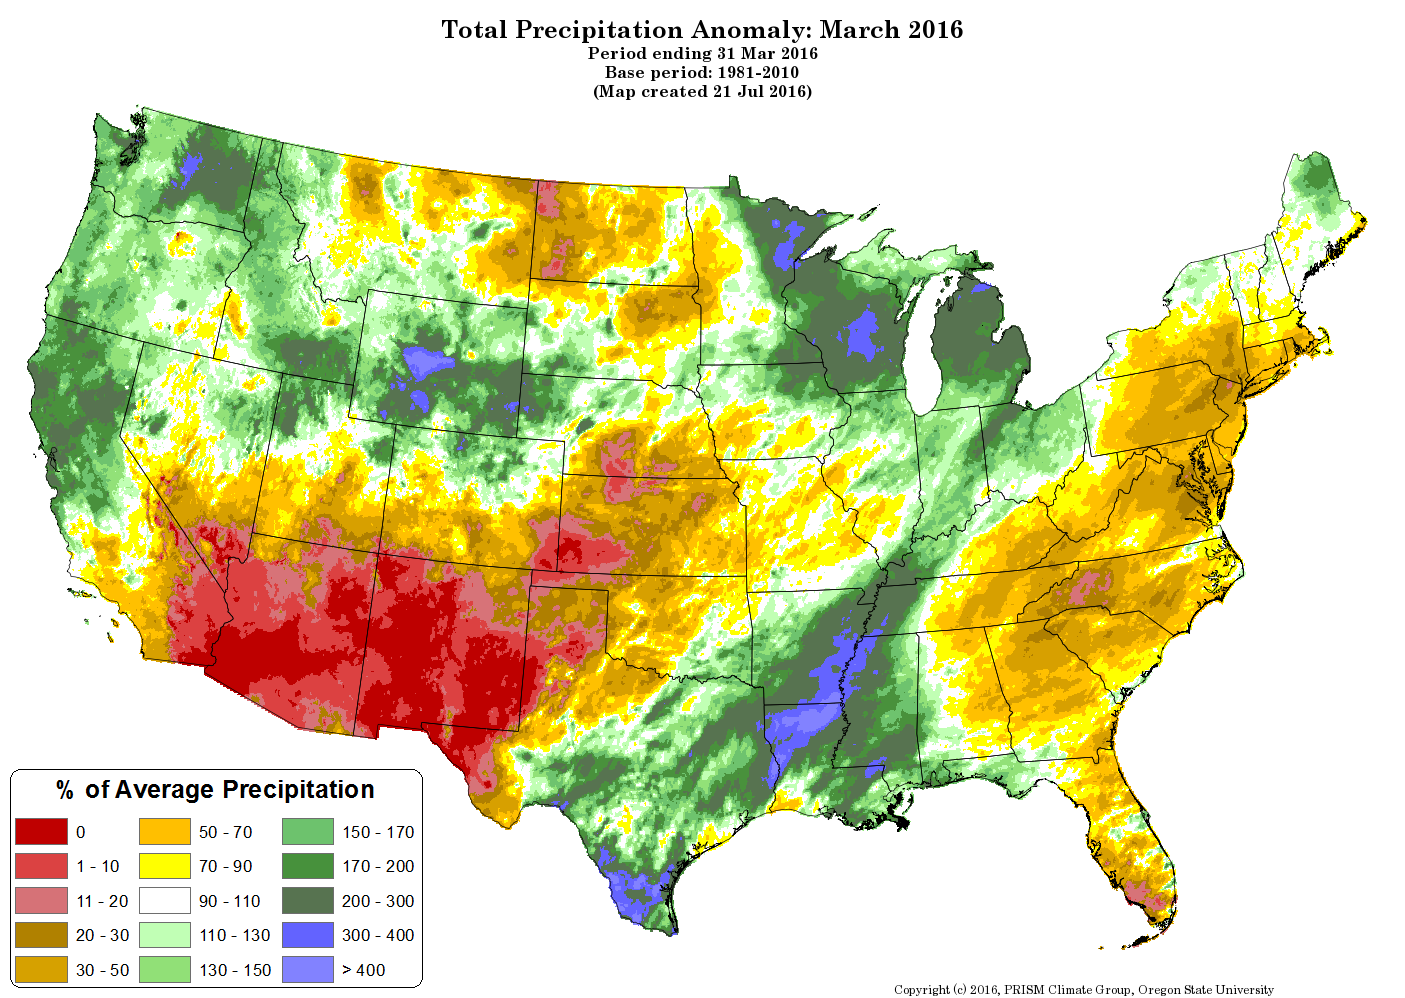
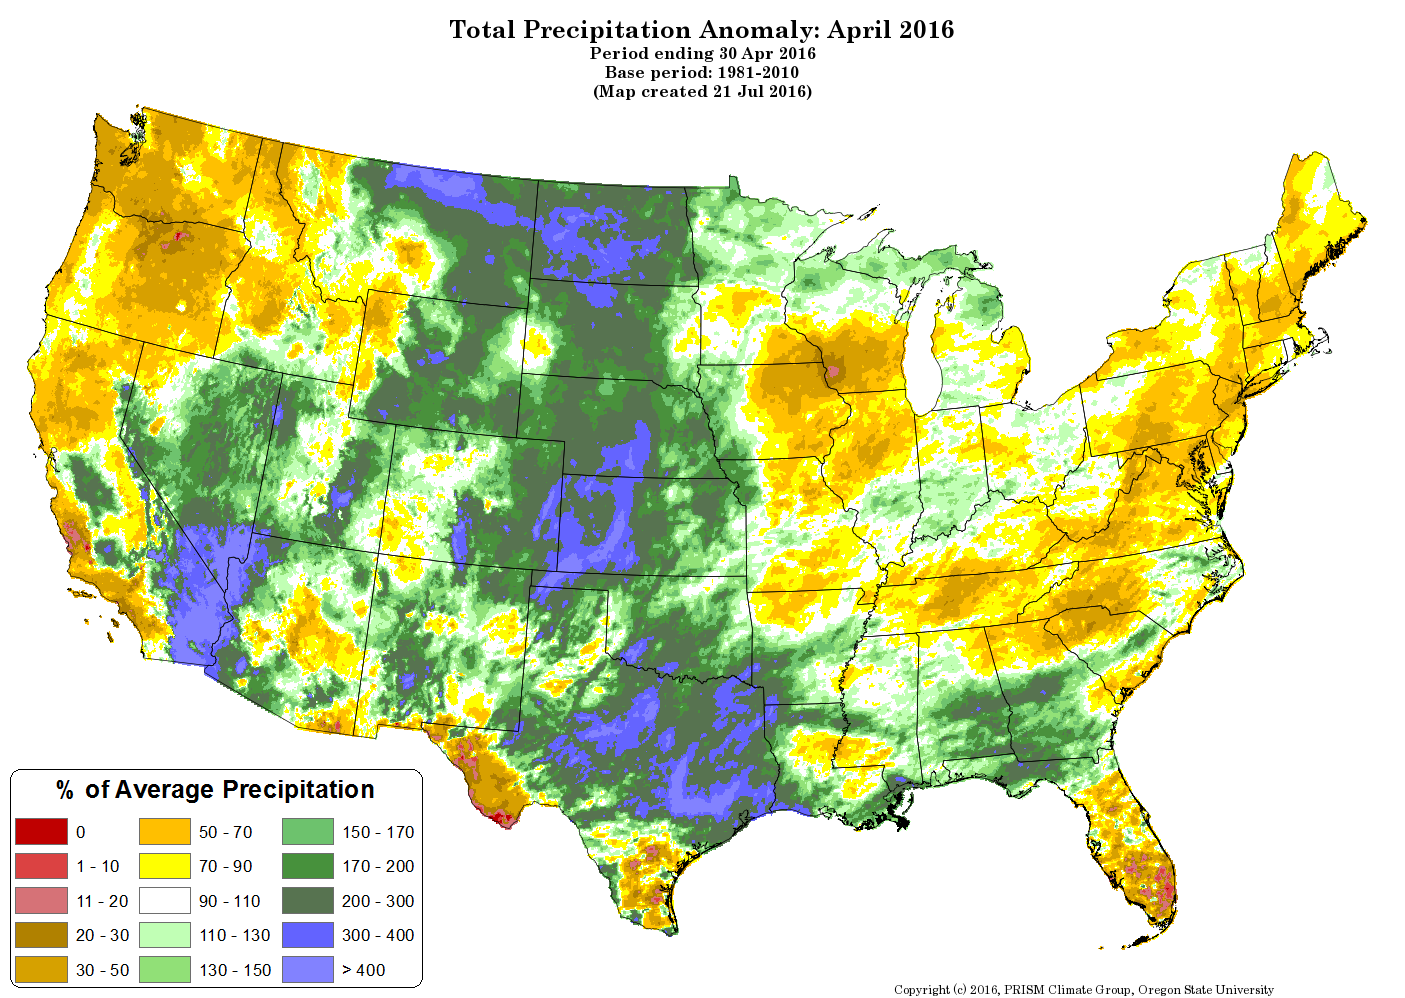
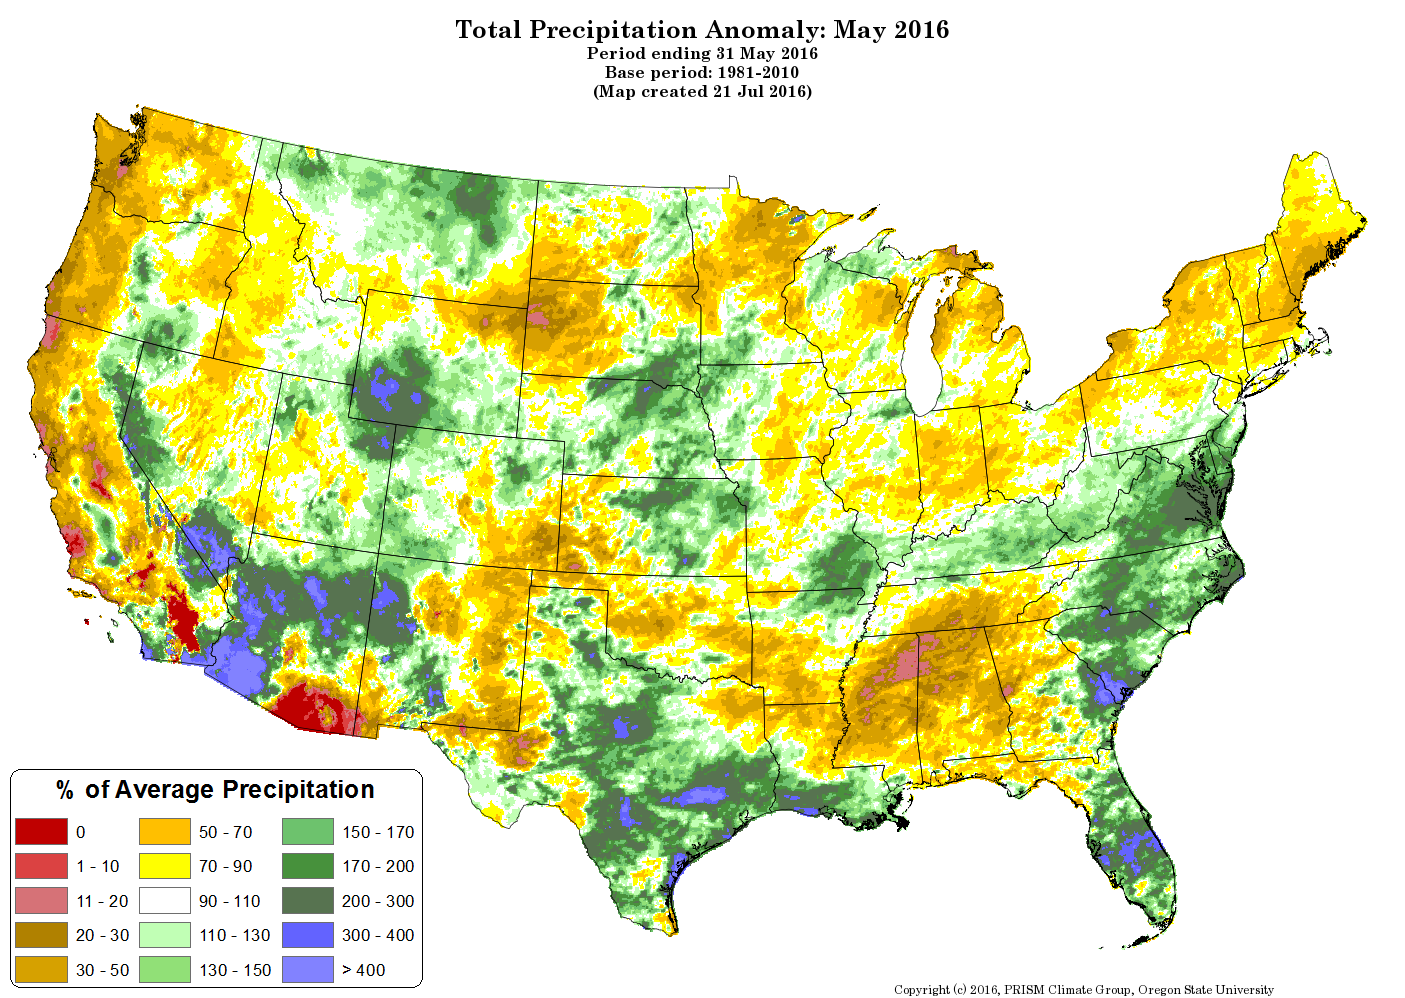
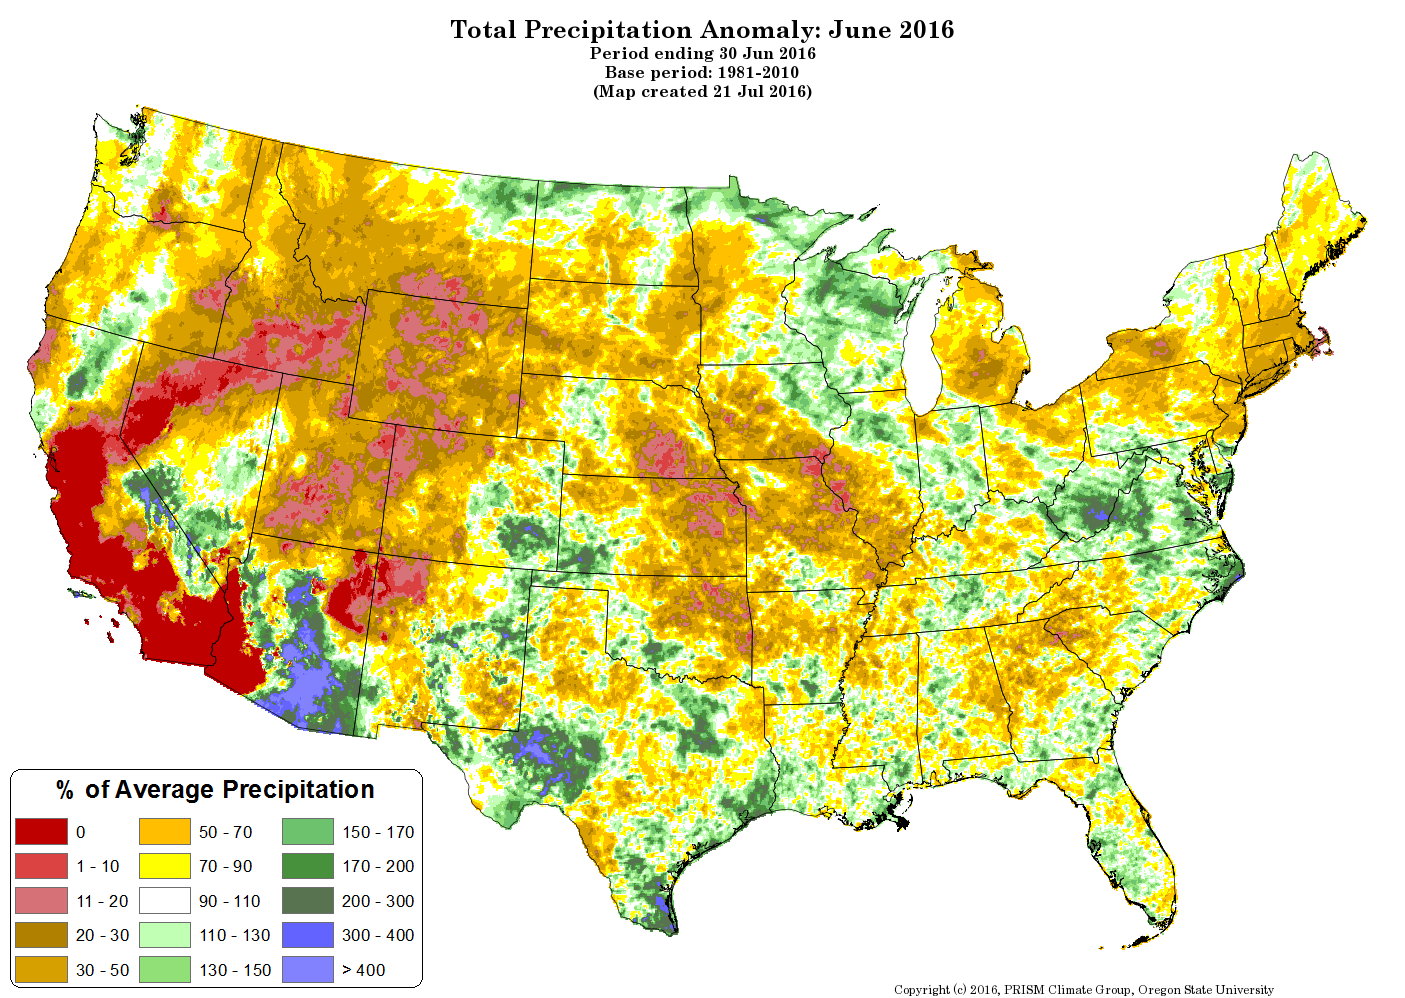
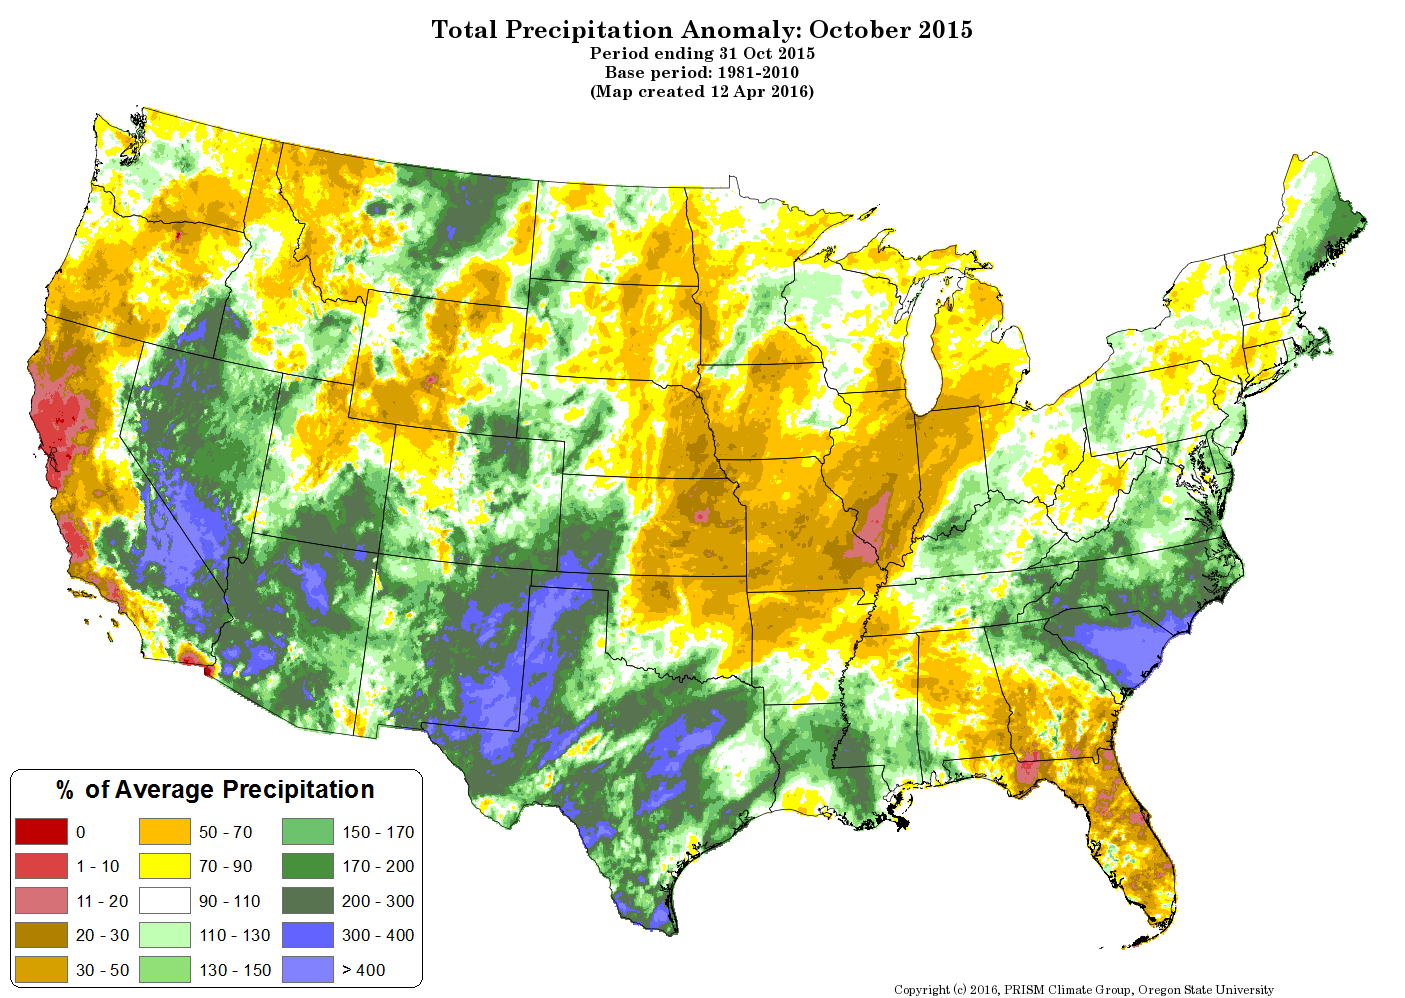
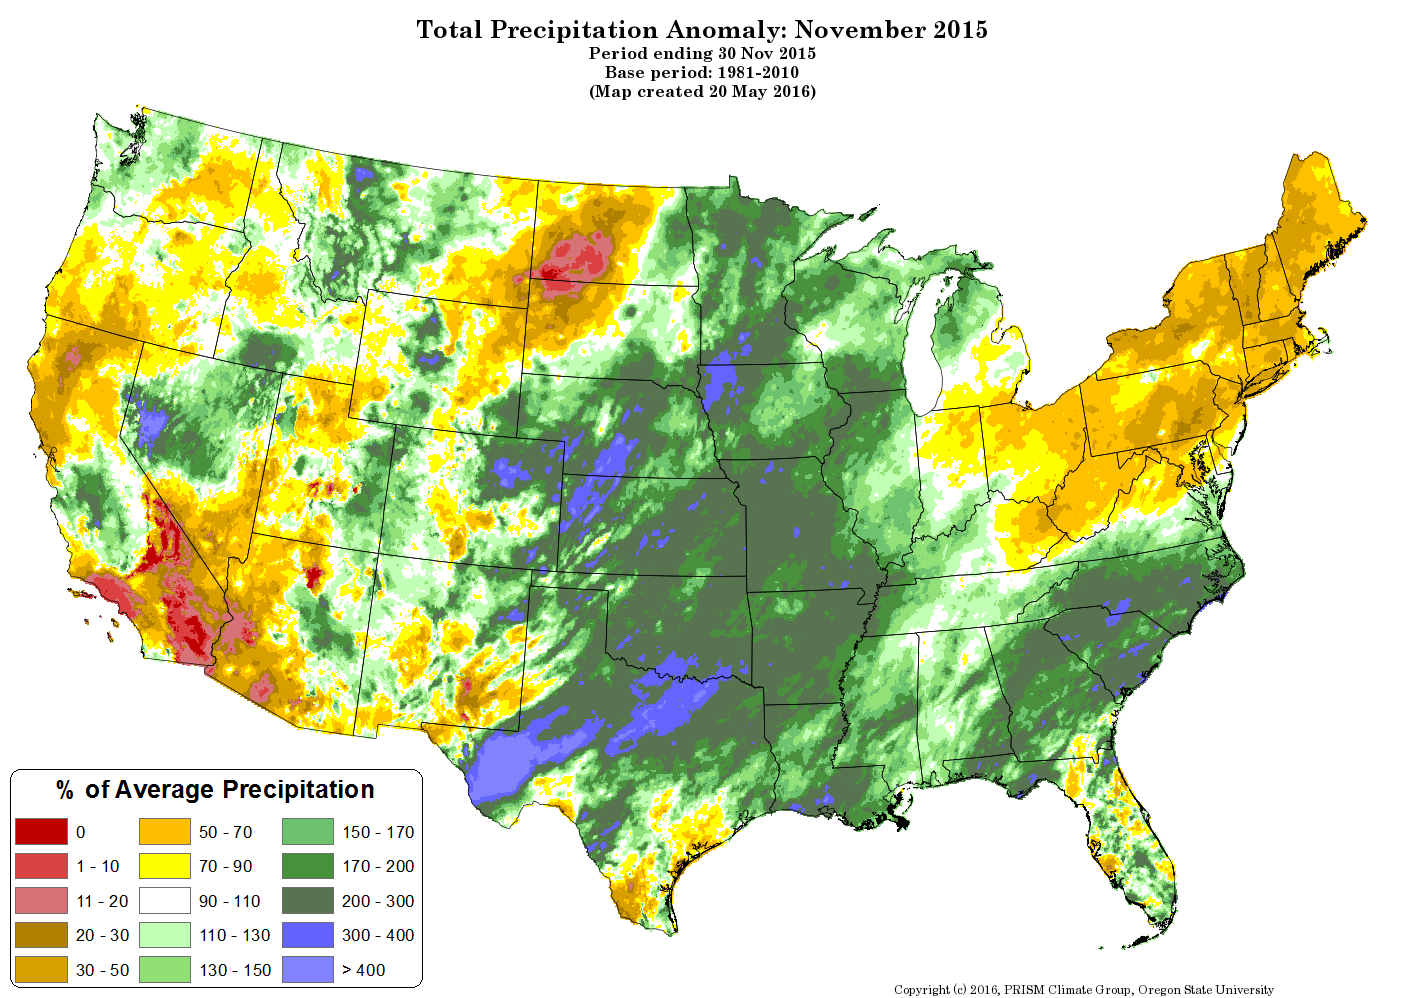
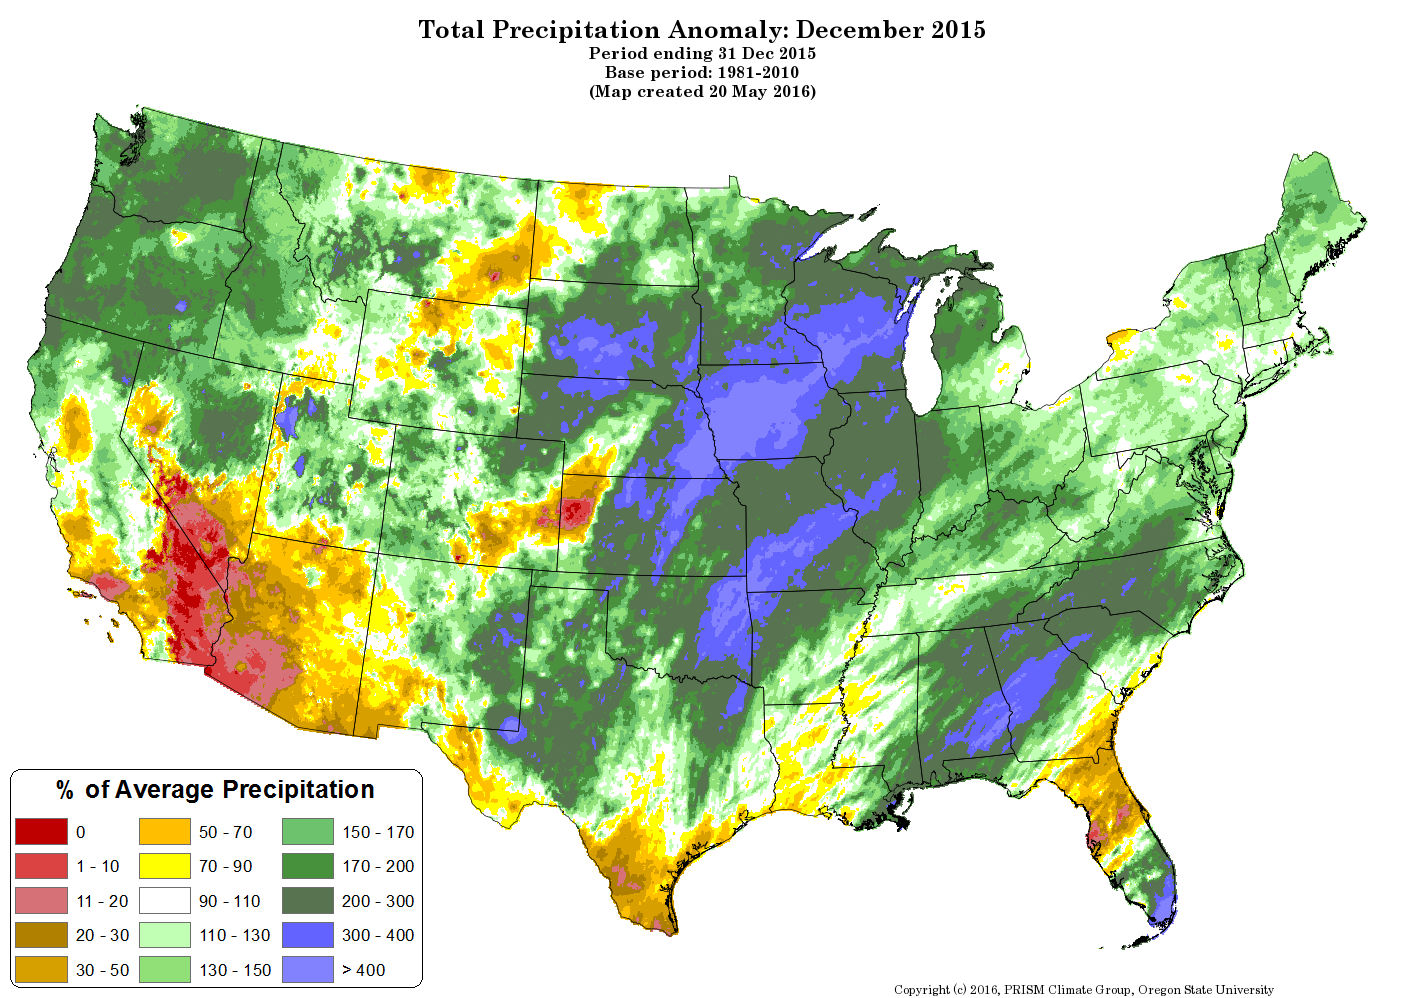
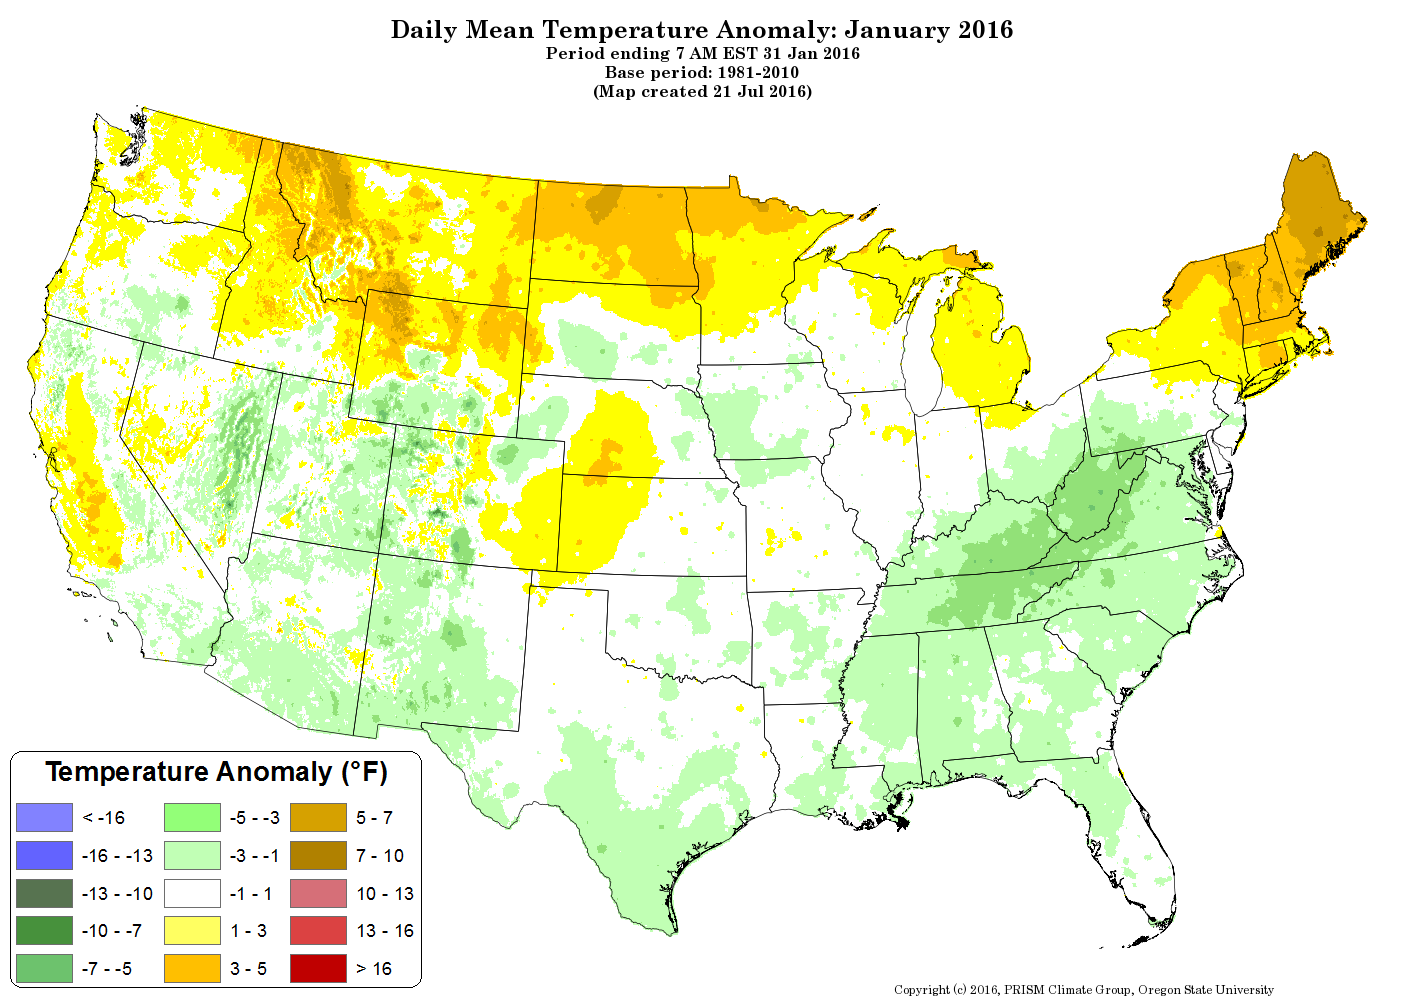
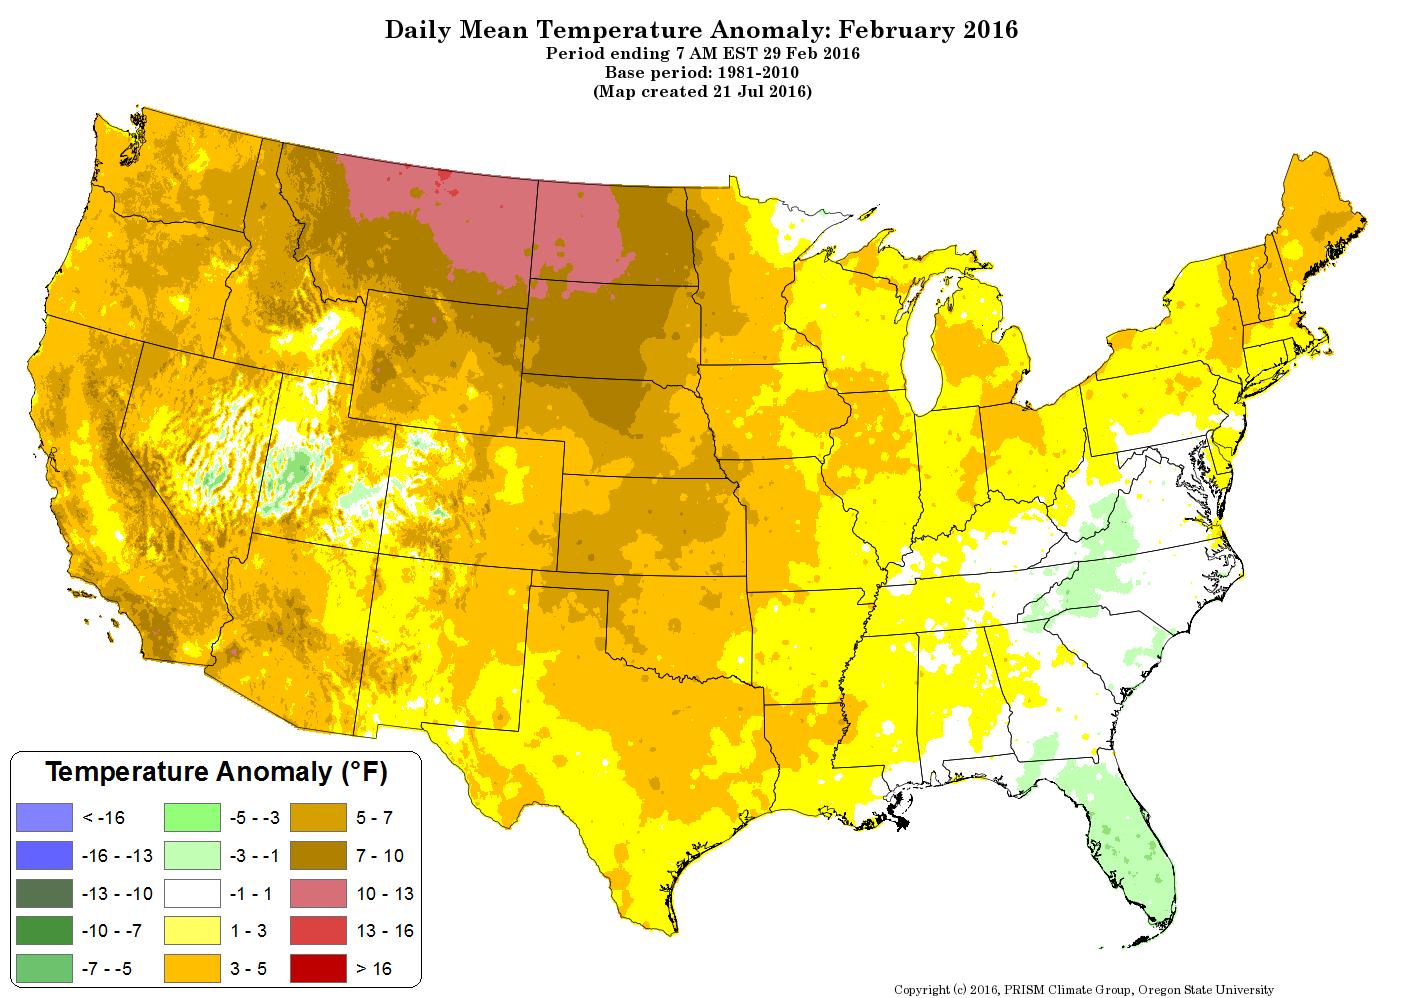
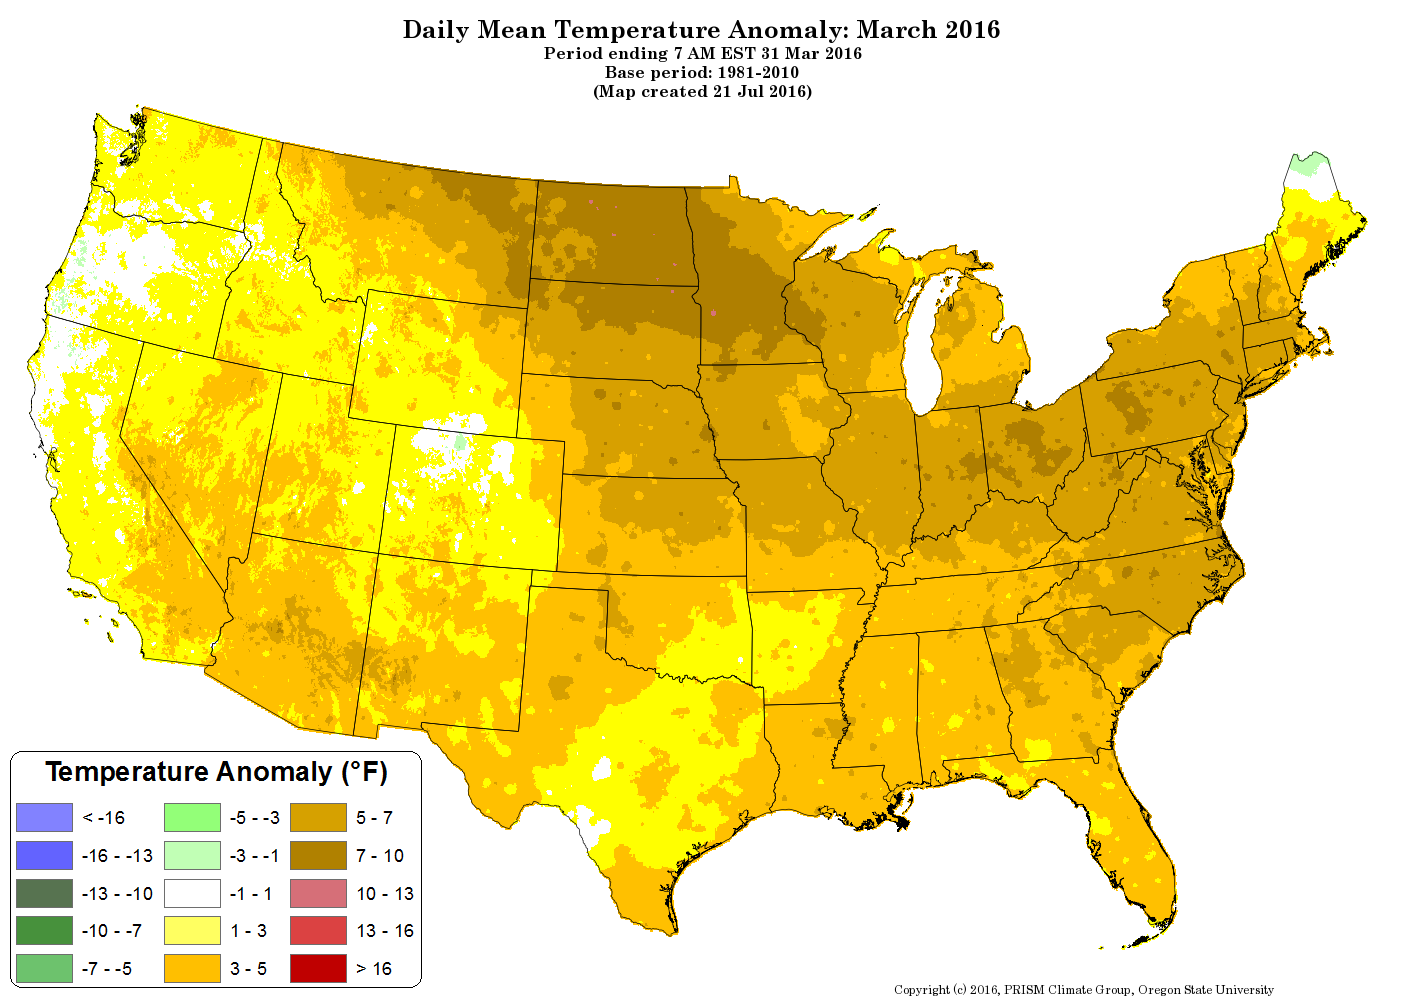
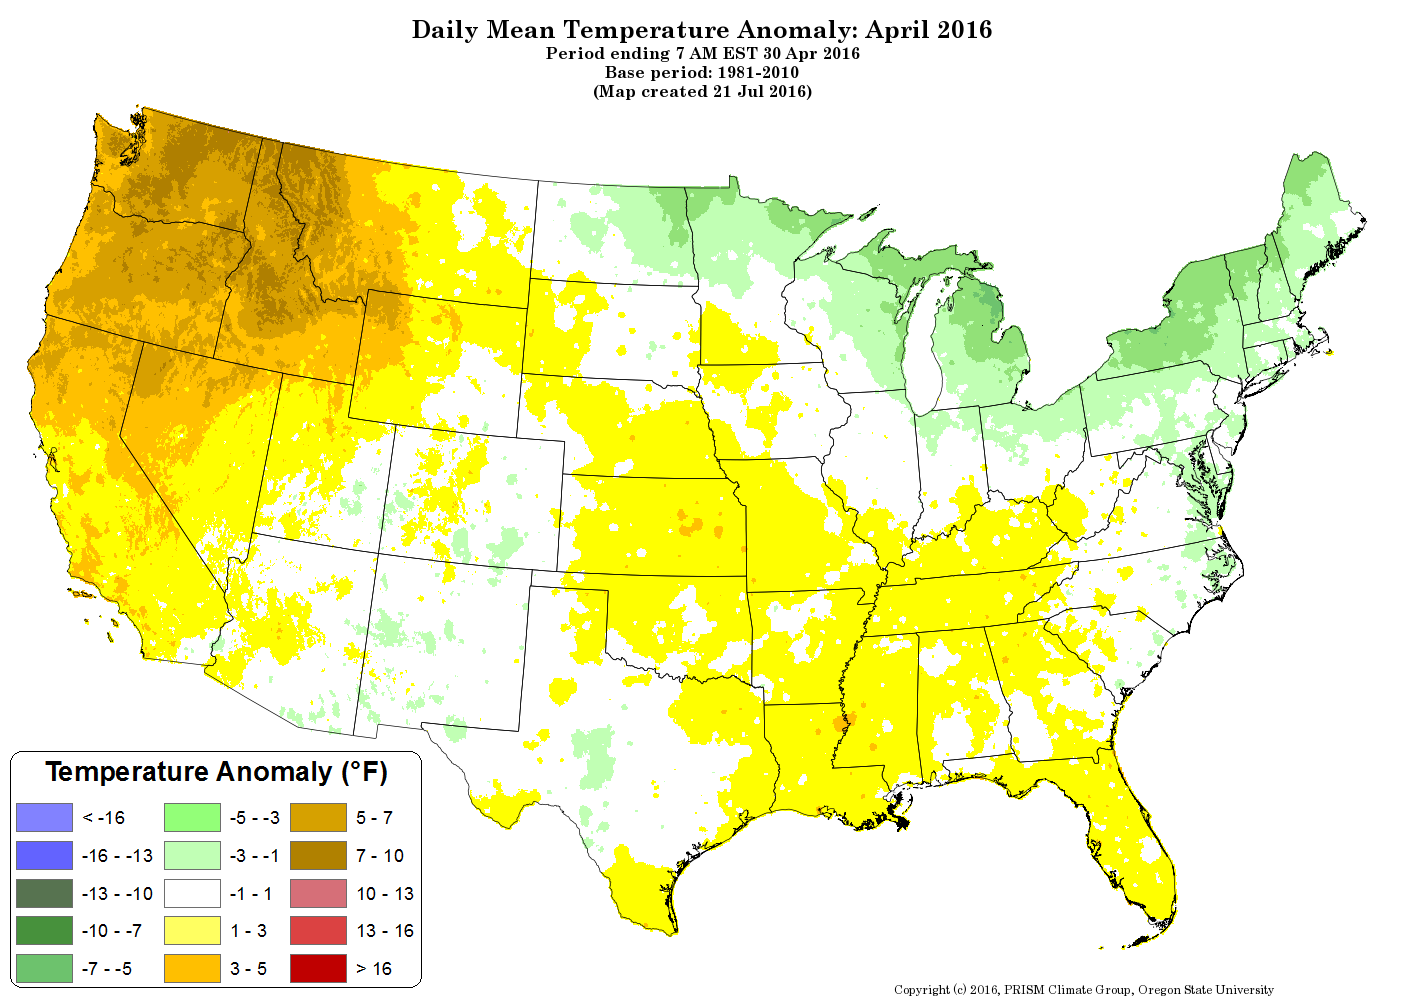
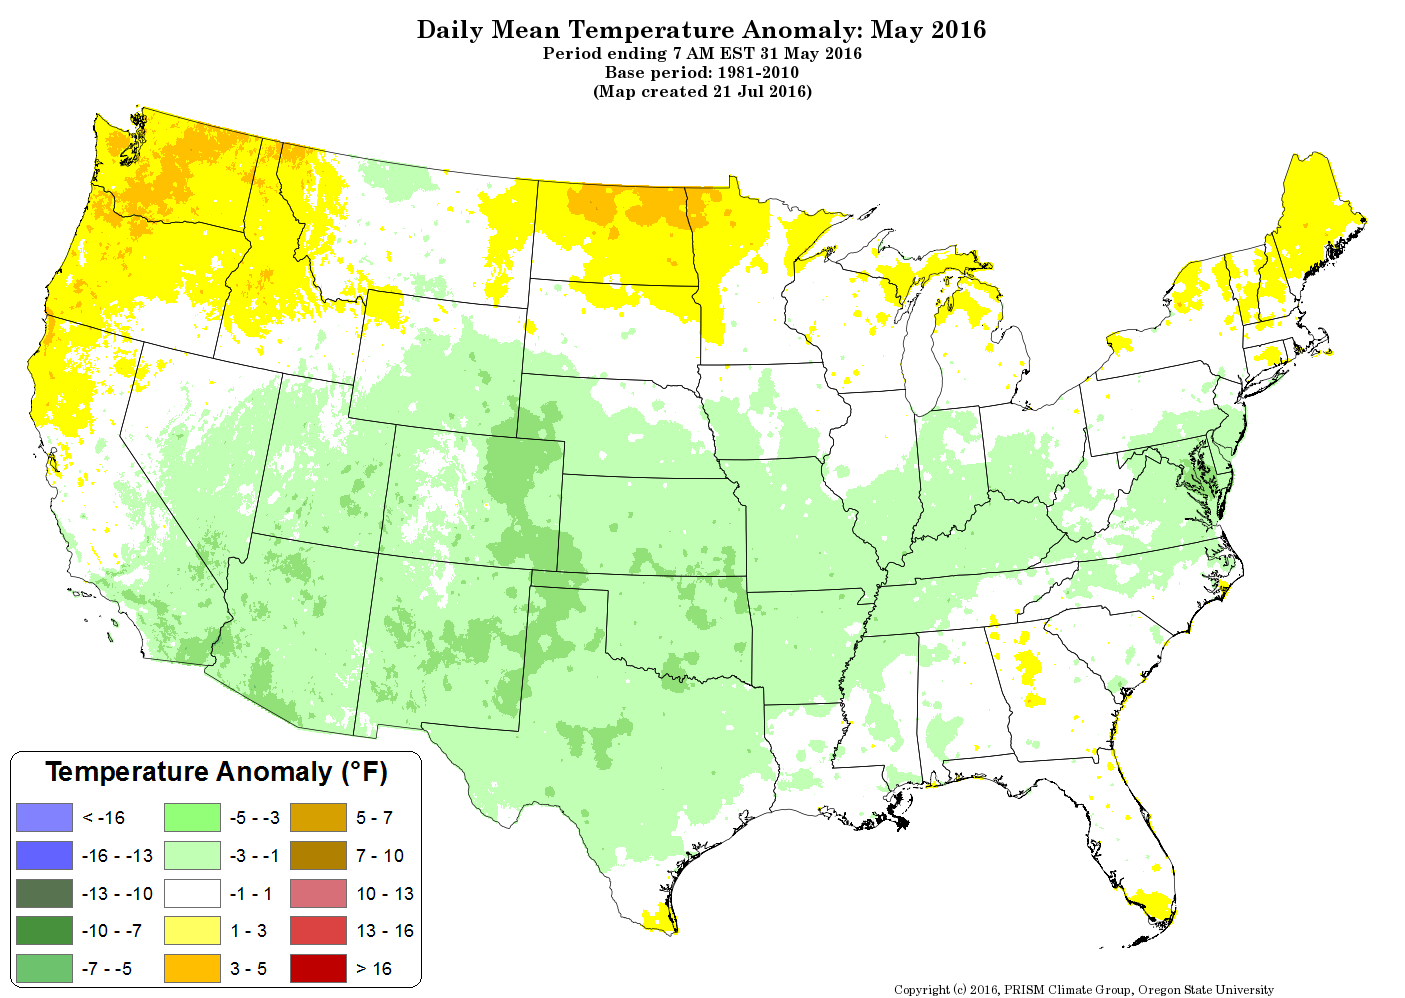
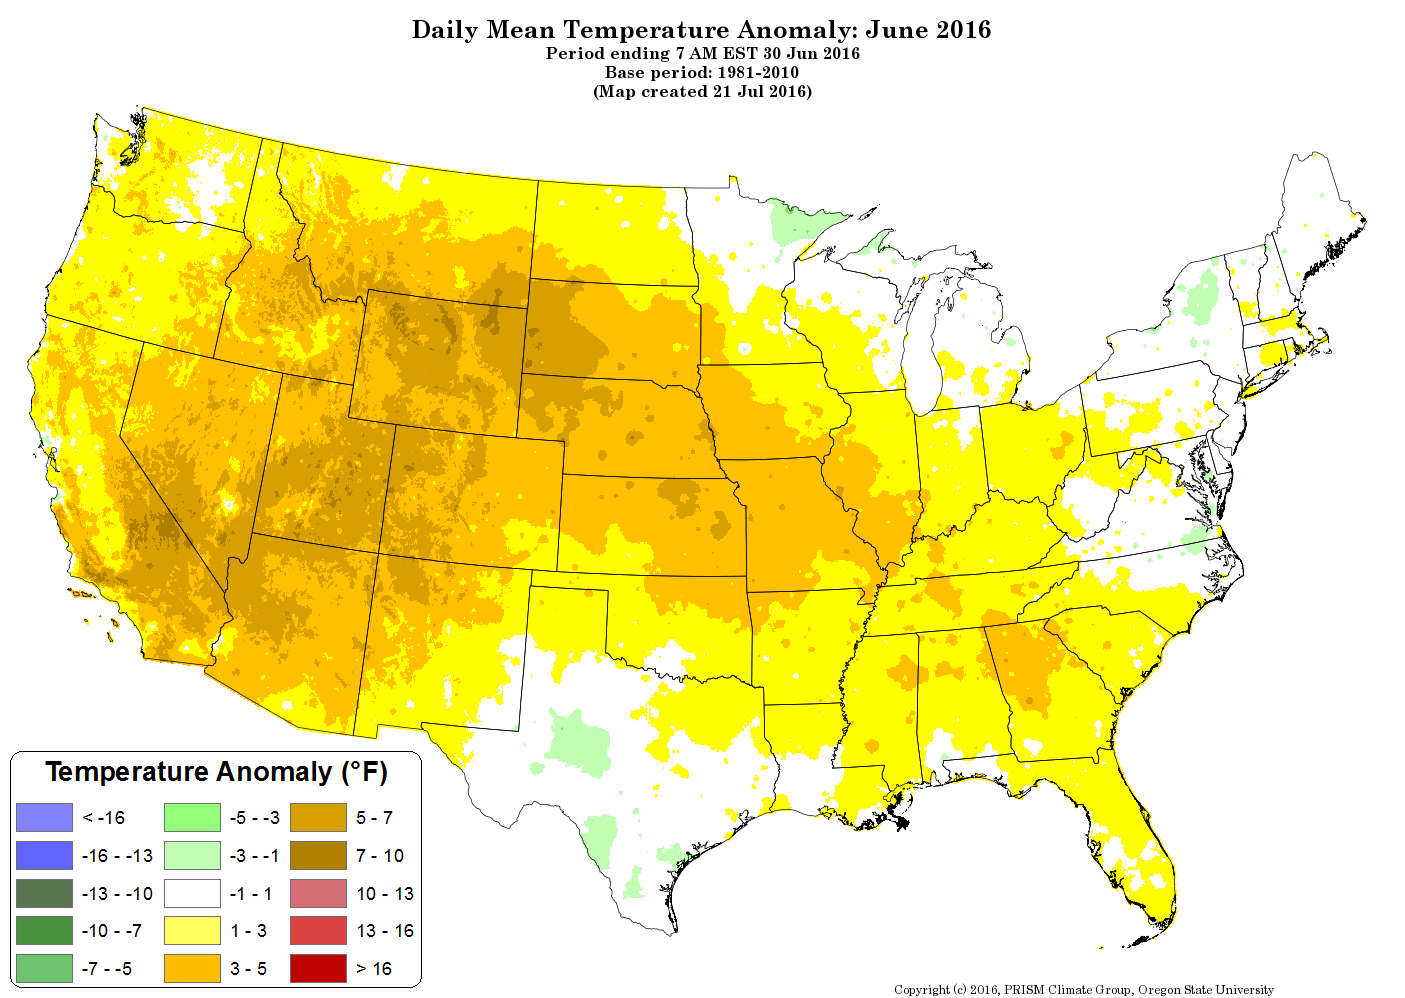
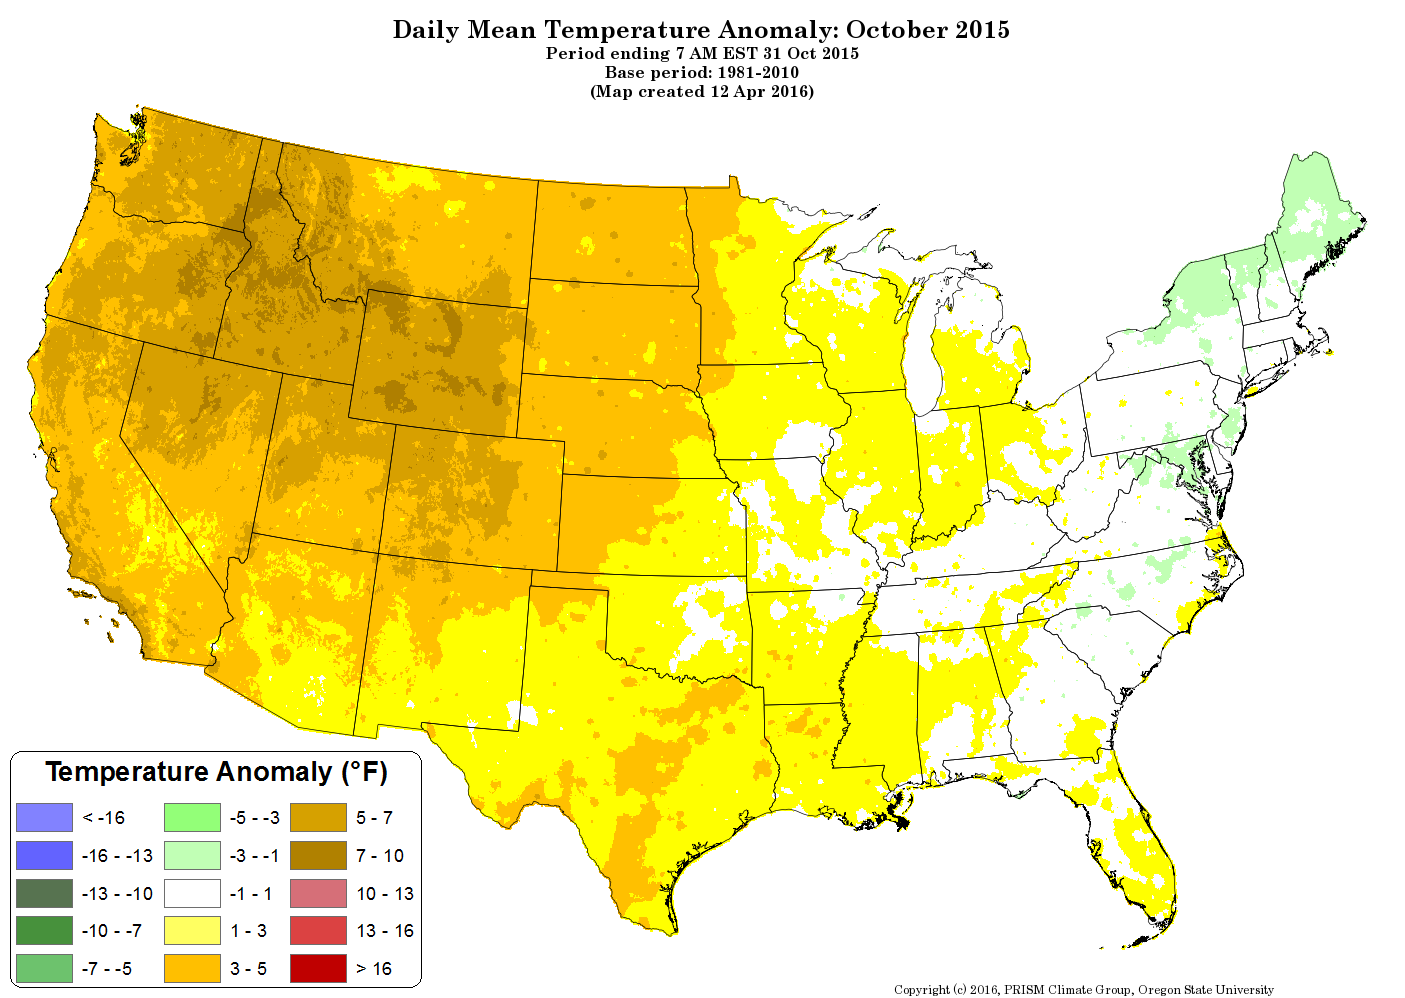
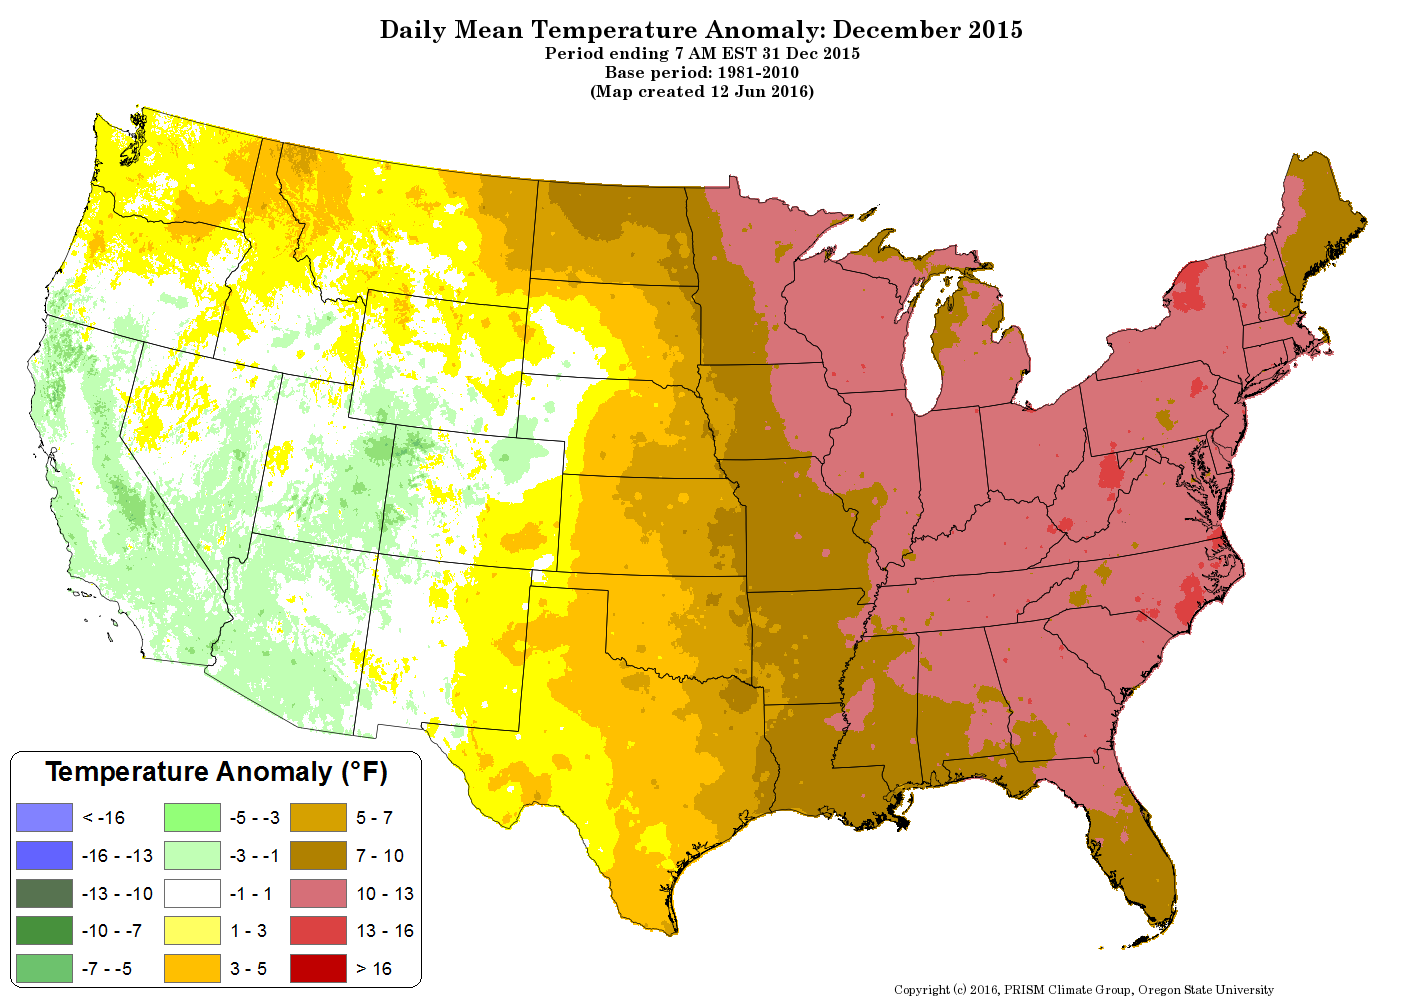
In actuality, precipitation for winter 15/16 was more along the lines of a normal/wet October except for below normal northwest Colorado, a normal/wet November (except for the below normal San Luis Valley). December held on to this trend and was normal/wet (except in the Southeast corner of the state). In January, the state started seeing less precipitation in the east, central, and southwest portions of the state. Temperatures for this time period were 3°-7°F above normal for October and then mostly normal in the mountain regions. One of the big stories of winter 15/16 is just how warm and dry the Colorado mountains were during February and continuing into mid/late March. Precipitation in February ranged from 30%-90% (mostly 50%-70%) of normal in the mountains with the northeastern/central eastern portion of the state being upwards to 200% of normal. In March there was a dividing line through the middle of the state, north of the line was normal or above normal precipitation and south was in the range of 1%-90% of normal, but mostly around 30%-70% of normal. To accompany these dry conditions, temperatures were mostly in the range of 3°-5° F above normal in February. March was normal in northern Colorado and around 3°F above normal in the central and southern half of the state. We will see the impacts of these two months in the snowpack discussion below. The month of April tended toward average temperatures and mostly average precipitation in the mountains, with wet conditions in the San Luis Valley and eastern third of the state. May also tended toward average precipitation in the mountains except with a drier southeast portion of the state. May was notable for the mostly below average temperatures across the state and overcast conditions in many locales. June arrived with above average temperatures and mostly below average precipitation in the mountains. See monthly precipitation and temperature maps below.
Southern, and many central areas of Colorado did not recover from the dry/warm February, and, in contrast to the wet and closer to normal temperatures in northern Colorado, the dry/warm March. March/April/May precipitation in the central/northern region continued at an impressive level while the southern part of the Colorado Mountains struggled with overall average or below average precipitation (see bar graph below).
Combined March, April, and May precipitation as of June 1, 2016, for the fifteen SNOTEL stations adjacent to or near CODOS monitoring sites.
March, April, and May precipitation in Colorado, as a percentage of station means, based on data from automated weather stations (not including SNOTEL) from the High Plains Regional Climate Center Web Page: http://www.hprcc.unl.edu.
Senator Beck Basin Weather Recap
This section describes conditions and data collected by the Center for Snow and Avalanche Studies at our Senator Beck Basin Study Area (SBB) at Red Mountain Pass under our Mountain System Monitoring program, which includes the CODOS program. At SBB, snowpack, weather, soils, and radiation conditions are monitored and measured at the well-sheltered subalpine Swamp Angel Study Plot (SASP, 11,060’) and at the more exposed, alpine Senator Beck Study Plot (SBSP, 12,180’). Nearby, wind speed, wind direction, air temperature, and humidity data are collected at the Putney Study Plot (PTSP, 12,323’), located to minimize the influence of local terrain on those measurements. Finally, SBB streamflow discharge is continuously measured at the SBB pour point at the Senator Beck Stream Gauge (SBSG, 11,030’), in a broad-crested, notched weir.
In SBB, WY2016 began in a precipitation deficit with August and September receiving 64% and 48%, respectively, of its period-of-record (POR) average. Soil moisture recovered in October to its normal level from a few rain and rain/snow events. CSAS documents soil moisture data at SASP and SBSP conditions as we entered the winter of 2015/2016. Beginning October 20th we received two back-to-back storms, recorded as CSAS Winter Storms #1 and #2 (Winter Storm defined as at least 12 mm of precipitation with no more than 12 hours without recorded precipitation), having produced enough snowcover to persist over at least 50% of SBB, signifying the start of the snow accumulation season. The precipitation deficit continued to turn around with precipitation in October, November, December, and January being on average 28% above the POR mean.

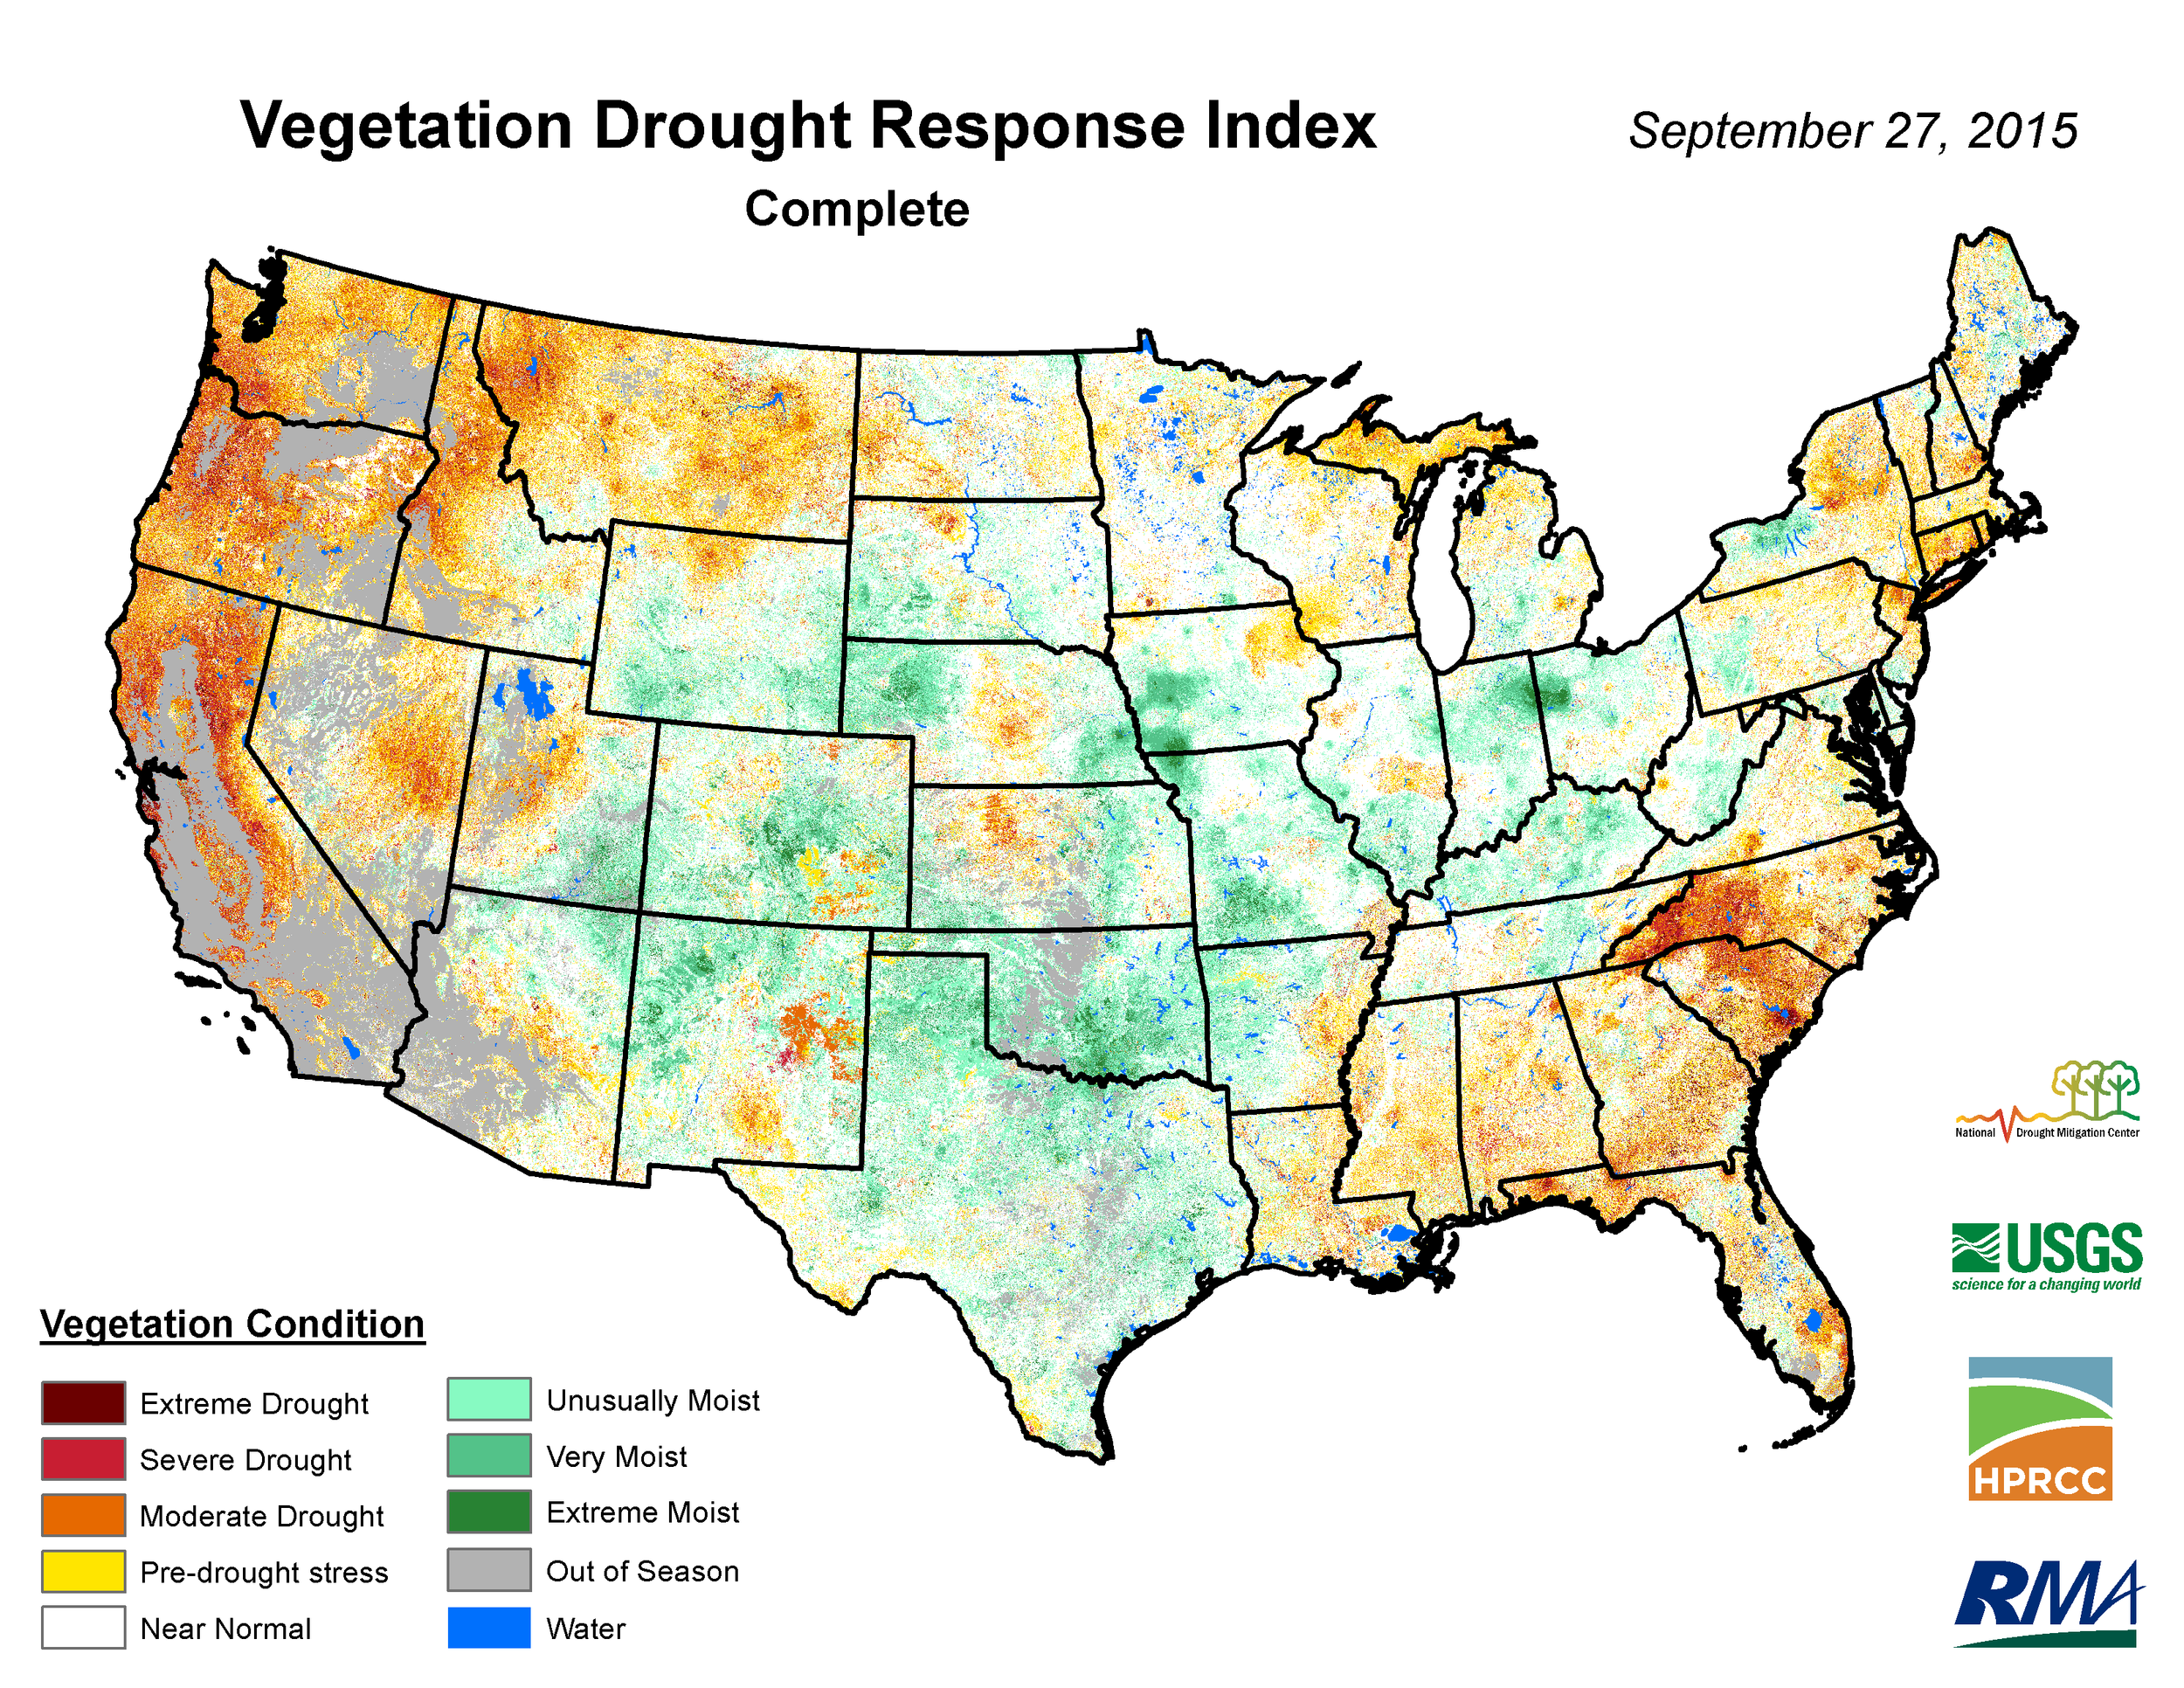
Soil moisture going into winter 15/16. Much of the West Slope was in the 50 percentile with a few areas – northern Colorado, Rio Grande, in the 10-30 percentile.
November was fairly unsettled with 3 notable storms. The storm from November 16-18th produced 2.1” of precipitation and brought SBB close to 1-meter of snow depth. We saw one week of sustained clear and mild weather in the third week of the month. Winds increased with each storm event and during the unsettled weather at the end of the month. We saw 24-hour averages in the mid 25° to 35° F for 4 consecutive days. There were about equal days in which the winds blew from the south and the north. Temperatures were mild in between storms and cooled down with each event.
The first 10 days of December was very warm and dry with 24 hour averages reaching as high as 30° F. Then on the 12th the pattern changed and colder temperatures and abundant snowfall dominated for the remainder of the month. A series of three powerful storms affected the region from the 19th to the 26th and brought considerable snowfall and very strong winds.
Air temperatures in January were overall right at average at 14.8°F with persistent northwest flow. In a departure from historically being the driest month of the year, January was snowier than typical with four storms occurring the latter half of the month bringing a nice bump in precipitation. Winds were fairly light until the middle of the month, when average wind speeds increased notably. The last spike of strong winds began with a large storm that arrived on the 31st and lasted through the first few days of February bringing 2.2” of precipitation. Following this significant storm seen to some degree at most SNOTEL stations across Colorado, the next 3 weeks were dominated by unseasonably mild and dry conditions, a stark contrast, with precipitation being 42% of normal, to the previous 4 months. February 22nd-23rd a fast-moving storm brought 0.7” of precipitation to SASP but scarcely noticeable in other locales. Adding to the warm and dry conditions, a notable wind event occurred Feb 18th stripped a significant amount of snow-cover from upper elevations. It was a disappointing month for snow after such a promising start to the season.
March began quietly with only one storm during the first half of the month. By mid-March a change in the weather pattern ushered in stormy weather that lasted up to the end of the month. During this period there were three storms that brought 2.8” of precipitation favoring Red Mountain Pass, areas south of Silverton saw half as much accumulation. Typical of March, these systems were accompanied by strong southerly winds. Temperatures seesawed strongly from unseasonably warm between storm events to frigid following trough passage.
Besides the final storm of March ending on April 1st, the first half of April was generally mild with warm days and freezing night time temperatures. The exceptions were a couple of very small storm events that brought insignificant snowfall to SBB. By mid-April a closed low over the Four-Corners region, and with blocking systems to our east, kept this moist storm over Colorado and brought a prolonged stretch of snowy weather to the entire state. We received four days of significant snowfall with 1.5” precipitation. Following a lull for a few days unsettled weather returned and persisted through the end of the month, with two storms totaling 1.6” of precipitation.
The month of May was cooler on average by 1.5° F with 3 storms and 12 days with recorded precipitation. Precipitation for the month was right at average. In addition, we had a number of days of overcast conditions, keeping a damper on snowmelt until kicking into gear in June. The month of June was 1.2° F warmer than average and started out melting the snow in earnest with no winter storms recorded the remainder of the season. SBB was classified as snow-all-gone on June 21st. The SBB stream gauge recorded a new peak discharge on June 5 of 20.1cfs.
WY 2016 in progress (data span October 1, 2015 through June 30, 2016) showing SBB daily precipitation, measured at SASP in mm of water equivalent, and daily snowpack depths, measured at SASP and SBSP in meters. The start of a storm event is marked with an orange vertical line. A storm is defined as at least 12 mm of precipitation with no more than 12 hours without recorded precipitation.
24-Hour mean air temperature for WY 2007 – WY 2016, with WY 2016 in progress.
Cumulative precipitation for WY 2005 – WY 2016, with WY 2016 in progress.
Snow depth at SBSP (12,180’). The beginning of February (day 32) ushered in dry and warm period lasting until the latter part of March (day 84). Nonetheless, snow depth stayed above average until the final days of snow melt.
Snow depth at SASP (elevation 11,060’). This site hovered around average depth the duration of the season. Like SBSP, the final days of snow melt was faster and earlier than average.
SNOWPACK CONDITIONS
Precipitation does not necessarily translate to snow-on-the-ground come Spring, due to factors such as redistribution, evaporation, and sublimation of the snowpack. Taking into account the additions and subtractions from the snowpack, runoff is a product of the accumulated snow water equivalent (SWE) available for melt. At the state-wide level, generally, what could be said about the resultant snowpack in the Colorado Mountains could be described as close to average. Looking deeper into that generalization, there is a clear distinction of areas that were average/above average and areas below average. As frequently presented in CODOS Updates, basin-scale plots of aggregated SNOTEL data provide a useful overview of SWE conditions throughout the Colorado Mountains. The consistent stream of storms (see precipitation maps above) received prior to February dissipated well into March for the northern watersheds and late march for the southern watersheds. As mentioned in the March 1st CODOS Update, all of the major Basins were reporting average snowpack conditions. Then, with dry conditions taking it’s toll, the March 27th Update reported SNOTEL stations throughout Colorado were beginning to show an overall split; Basins located in southern Colorado (Gunnison, Arkansas, Rio Grande, and San Miguel/Dolores/Animas/San Juan River Basins) had undergone a reduction in percent median SWE values, while Basins in northern Colorado (Upper Colorado, Yampa, South and North Platte River Basins) had seen an increase in percent of Basin median values (see table below).
Fortunately, March/April/May precipitation totals were at least closer to average, helping the snowpack recover in southern part of the state (particularly the Rio Grande Basin), and the cooler than normal conditions combined with increased cloud cover in May delay – or slowed – snowmelt.
March 1 SWE conditions at the 15 SNOTEL stations monitored by CODOS. The DERC definition of “Average March 1 SWE” is March 1 median SWE +/- 10%. As of March 1st only four stations reported low SWE.
After a very dry and warm February for the entire state and mostly dry and warm March (for the southern half of the state), Basin-scale March 1 SWE conditions depleted by March 25 in the Arkansas, Upper Rio Grande, and San Miguel/Dolores/Animas/San Juan River Basins to “low” SWE conditions. Decreased slightly in the Gunnison Basin. And increased 5%-17% in the Upper Colorado, South Platte, Laramie/North Platte, Yampa/White Basins.
Late-winter and spring snowfalls are critical to Colorado water supplies. Most watersheds experience their highest measured (Peak) SWE values at SNOTEL sites sometime in April but snowfalls after those respective Peak SWE dates have always contributed an important fraction of final snowmelt runoff yields. Further, spring snowfalls play a key role in determining the timing and duration of dust-induced reductions in snow albedo when desert dust layers emerge at or are deposited to the snowcover.
A summary of WY 2006-2016 snowmelt rates and associated conditions at the 15 Snotel stations that CODOS routinely monitors, statewide. Days to SAG refers to the time between Peak SWE and “snow all gone” at the Snotel sites. Adjusted Daily Mean Loss calculates the rate of snowmelt following Peak SWE, including all precipitation received after Peak SWE (assumed to be snow). Melt rate tables are presented for each of the 11 CODOS monitoring sites on their webpages.
WY2016 snowmelt rates at the 15 SNOTEL stations that CODOS monitors are summarized in the table above. Nine SNOTELS reached Peak SWE in May, 6 in April, and 1 in March.
DUST-ON-SNOW CONDITIONS
The CODOS program rigorously monitors and documents dust-on-snow events at SBB since winter 2004/2005 (WY2005). A total of 100 events have been logged, ranging in mass from barely perceptible events of 0.15 gm/m2 to extremely heavy events of up to 47 gm/m2. Winter 2015/2016 saw a total of 6 dust events (we receive on average 8 events a winter season), which were deposited ‘wet’, with associated snowfall. Besides one very faint event, and one event characterized as heavy, all other events were of moderate dust intensity. Estimated total mass of all dust layers dust is 11.17 gm/m2, which is less than the 18 gm/m2 on average received in our period of record, but still very substantial (see: http://www.codos.org/#mass-loading-data). Defining what constitutes “Average” dust intensity within the 3-tier scheme of the DERC model can be difficult. But given the range of data collected over the years, WY2016 dust intensity at SBB best falls within the “Average” category.
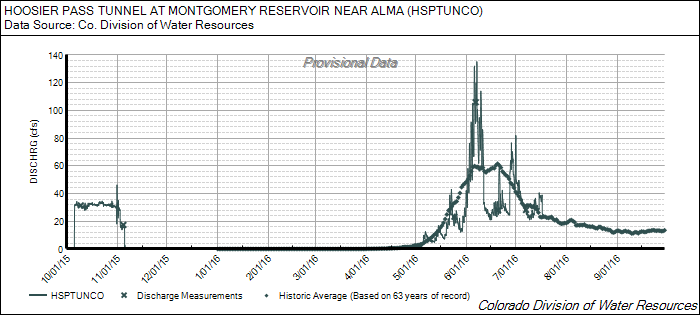
The spatial distribution of dust across the state varied in an opposite manner as the snow accumulation totals. The far northern CODOS sample sites, Rabbit Ears and Willow Creek remained dust free, the central sites, Berthoud, Grizzly, and Hoosier, received 1-2 dust events, while the southern portion of the state, McClure, Grande Mesa, Park Cone, Spring Creek, Wolf Creek, received the brunt of all, or most, of the 6 dust events. The result being that the southern part of the state not only received less snow accumulation, but the snowpack was under greater dust-enhanced snowmelt conditions. The full set of observations and DERC classifications can be found on each CODOS sample webpage: http://www.codos.org/#codos.
Snowpack conditions on March 1st represent a benchmark, as the “dust-on-snow season” begins in earnest. WY2016, four of the six dust events occurred after March 1st, placing those dust layers within the upper portion of the snowpack. Fortunately, beginning the middle of April, precipitation (aka “albedo reset”), or at least overcast conditions were common through the majority of May, slowing snowmelt. CODOS field observations on May 22nd found D5/D6 merged at the surface of the snowpack and on May 31st found layers D2-D6 had all merged and created large reductions in snow albedo. Beginning the first of June, with clear, warmer weather, snowmelt began in earnest. Average station data in the major basins indicated “snow-all-gone” very near their long-term POR median due to bumps in precipitation (albedo reset) and overcast/cooler conditions in May.
Total dust-on-snow events by year. All dust events in 2015/2016 were “wet” events, accompanied with precipitation
A view of SASP on May 27, after receiving 0.9” precipitation. After this event, albedo declined rapidly and streamflow surged in SBB and most watersheds in Colorado.
A view of SASP on June 9, four days after seeing a record peak discharge of 20.07 cfs on June 5.
RUNOFF BEHAVIOR
DUST ENHANCED RUNOFF CLASSIFICATION
Last year CODOS introduced a Dust Enhanced Runoff Classification (DERC) approach to linking dust-on-snow, snowpack, and spring weather conditions to patterns in statewide hydrographs from the 2006-2016 period within a 3x3x3 Dust Enhanced Runoff Space (see also the January 22 CODOS Update). The below table presents the final DERC classification of WY 2016 parameters at each of the 19 stream gauges monitored by CODOS. Water Years 2006-2015 classifications are contained in Excel workbook Runoff_Space_by_Region_and_WY.xlsx along with three regional analyses. Another workbook, Runoff_Space_by_Watershed.xlsx, contains individual DERC analyses for WY 2006-2016 for each of the 19 stream gauges.
A conceptual Dust Enhanced Snowmelt Runoff Space integrating the interactions of March 1 SWE, dust intensity, and spring precipitation.
Based on the discussions describing the DERC approach in characterizing the watersheds that CODOS monitors, WY 2016 snowmelt season conditions are summarized in the table below. In broad terms, with local variations, Colorado WY 2016 snowmelt runoff behaviors fell into general patterns of “Average Dust” or “Min Dust”, mostly “Low” or “Average” March 1st SWE, and mostly “Average” to “Wet” spring.
WY 2016 DERC matrix classification of factors influencing snowmelt runoff behavior at 19 stream gauges located in watersheds monitored by CODOS.
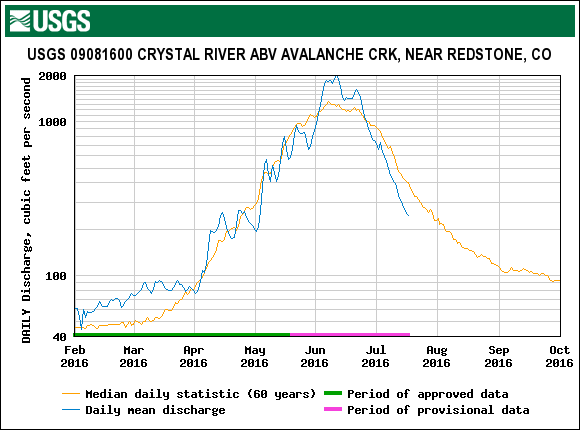
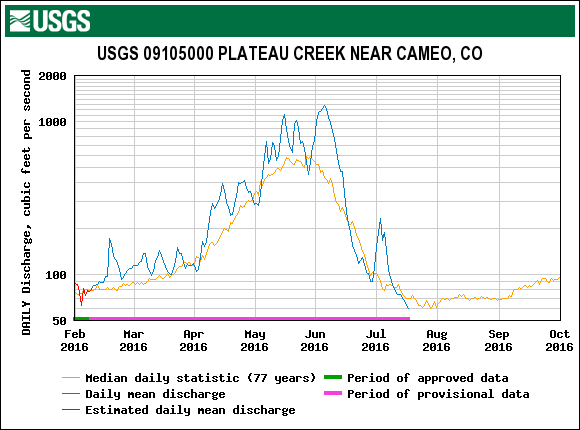
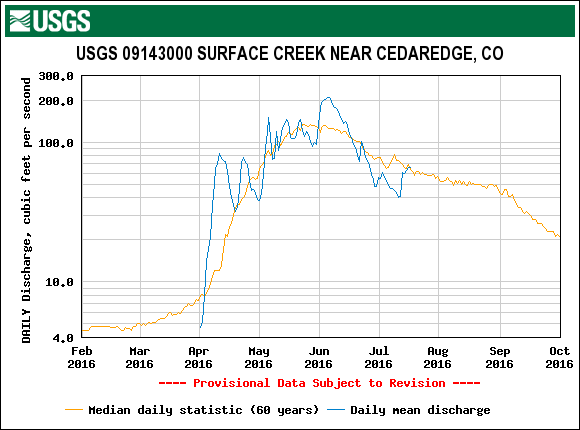
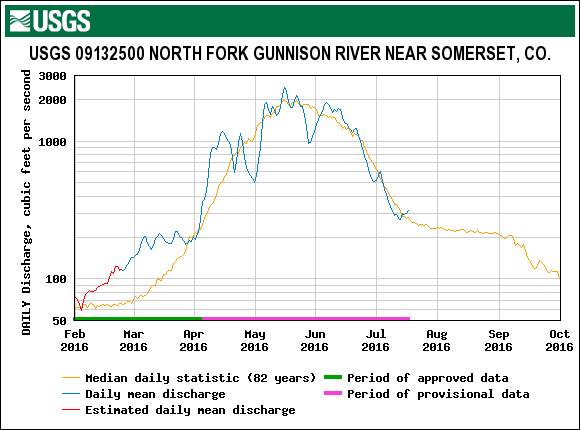
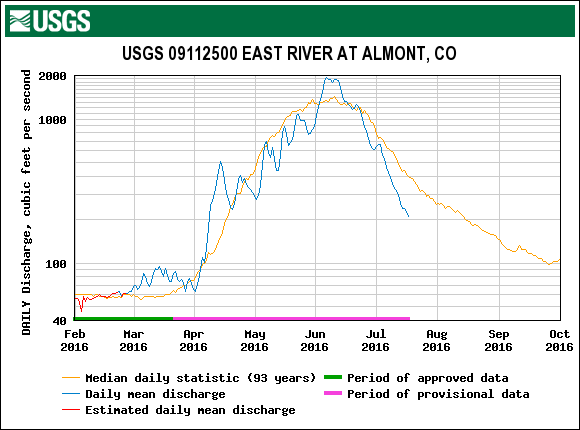
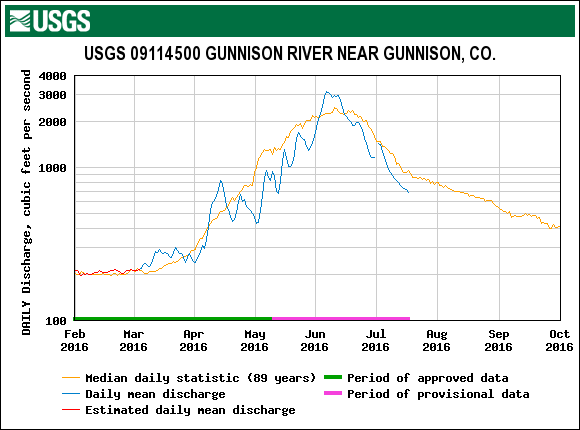
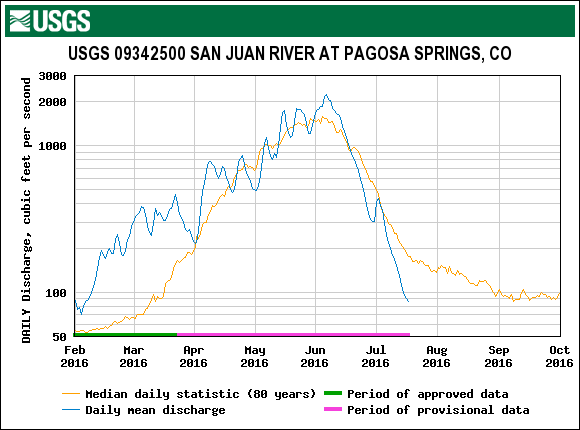
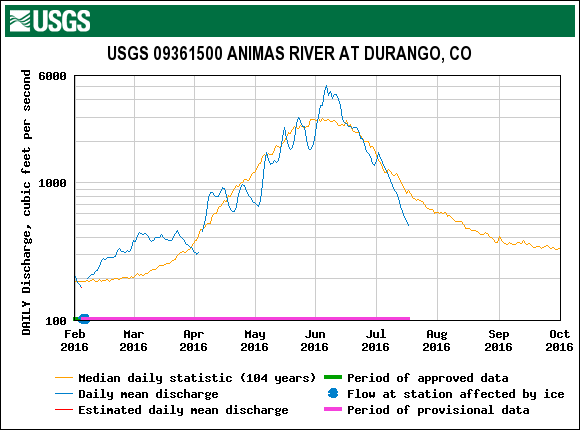
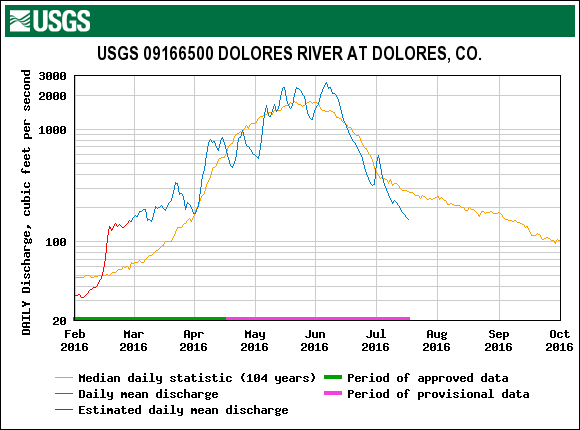
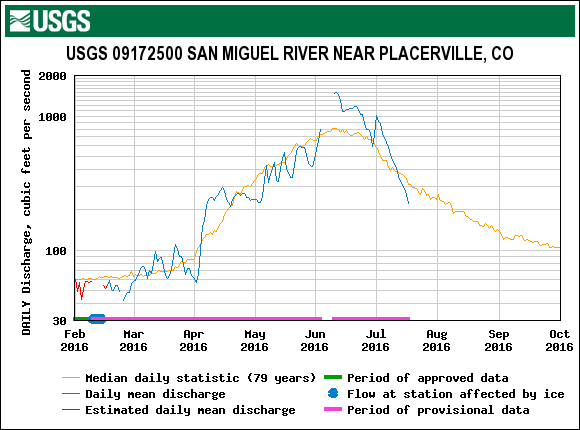
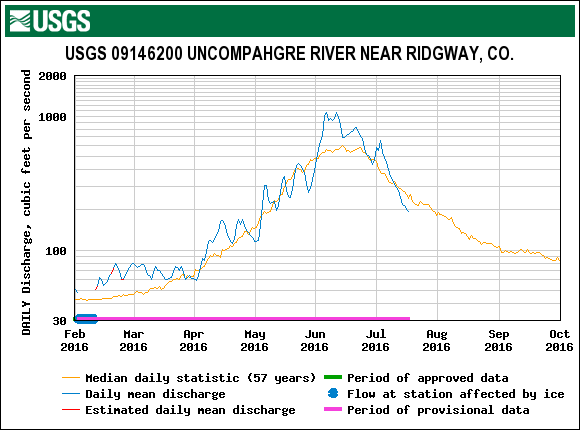
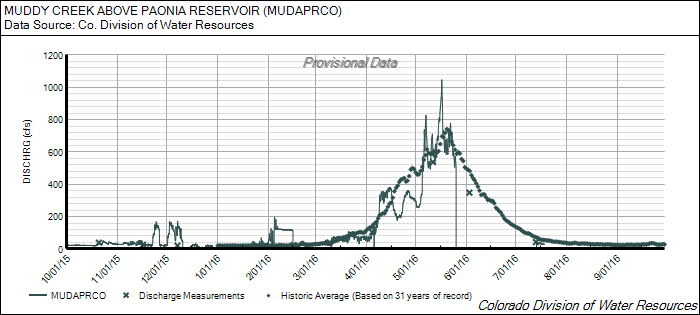
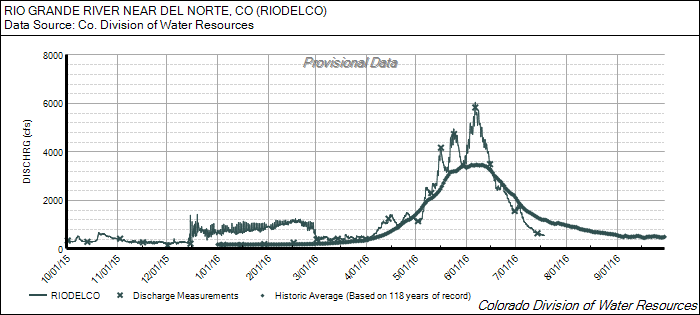
The below plot shows albedo values at SBSP and SASP with streamflow at the outlet of SBB. May was characterized by periods of albedo “resets” with the effect of slowing snowmelt and reducing runoff, followed by periods of lower albedo and increasing streamflow. Starting around May 28, within a day that dust events D2-D6 were reported emerged at the surface of the snowpack, along with a good stretch of clear, warm days, did snow melt, and corresponding streamflow, rapidly accelerate. We logged a record peak discharge at SBB of 20.07 cfs on June 5th. Other stations saw peak discharge, well above their median peak, very near this same date as well, particularly stations in southern Colorado; East River at Almont, Gunnison River near Gunnison, San Juan River at Pagosa, Animas River at Durango, Dolores River at Dolores, Rio Grande River near Del Norte. Interestingly, many stations show the signal of a quick weather system that came through Colorado June 5th that brought increased cloud cover, a rapid drop in temperatures for a brief period of time, and a dusting of snow at higher elevations, with the effect of slowing snowmelt and decreasing or plateauing discharge for a very brief period. Many stream gauges in northern Colorado recorded the June 5th timeframe as a temporary plateau where discharge remained flat before surging to their peak discharge, well above their median peak, toward the middle of June.
SBB stream discharge as it relates to albedo (or reflectance) of the snowpack. A series of albedo “resets” occurred throughout May due to precipitation (snow) temporarily covering dust layers, decreasing absorption of solar radiation and slowing snowmelt. When all dust layers were reported merged at the surface of the snowpack the end of May, along with a stretch of very warm and clear days, snowmelt kicked into full gear and streamflow rapidly spiked.
LOOKING AHEAD
Looking toward next winter, as of this writing in early August, the National Weather Service’s Climate Prediction Center currently sees the overall combined ocean and atmosphere system reflective of ENSO-neutral. La Niña is slightly favored to develop during August - October 2016, with about a 55-60% chance of La Niña during the fall and winter 2016-17. Come October forecasts will be better dialed in for the coming winter season. For the remainder of the summer and fall, even though some parts of Colorado are currently considered abnormally dry, the seasonal drought outlook is calling for no drought development likely.