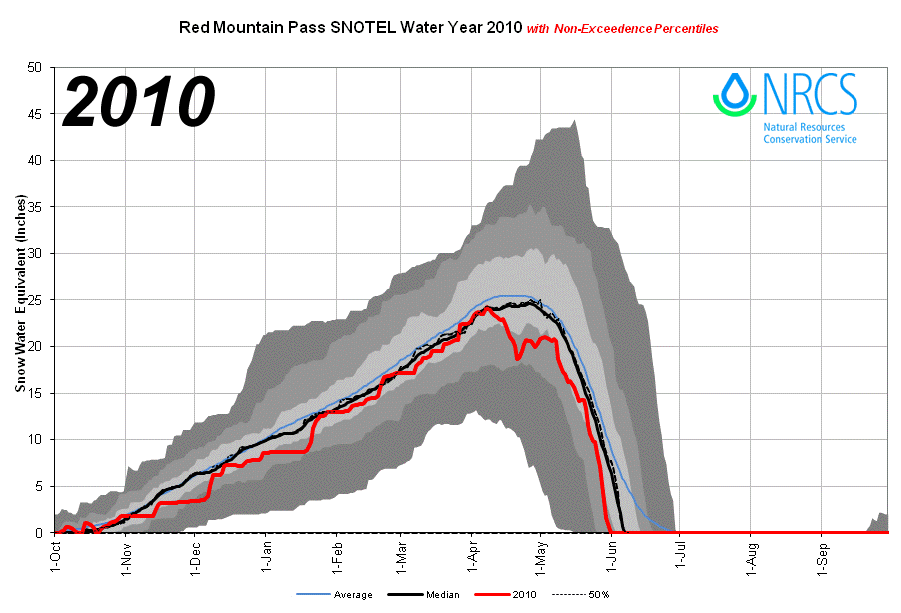
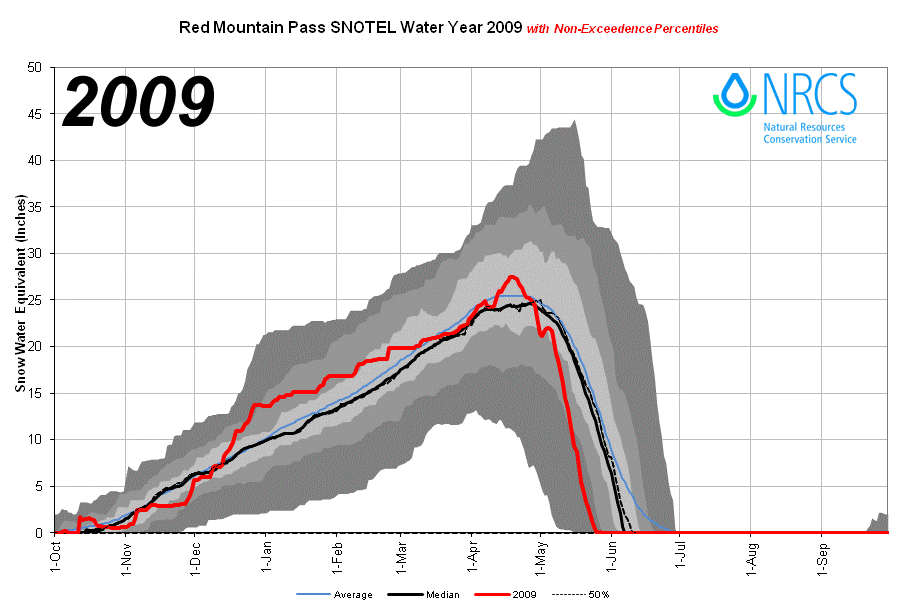
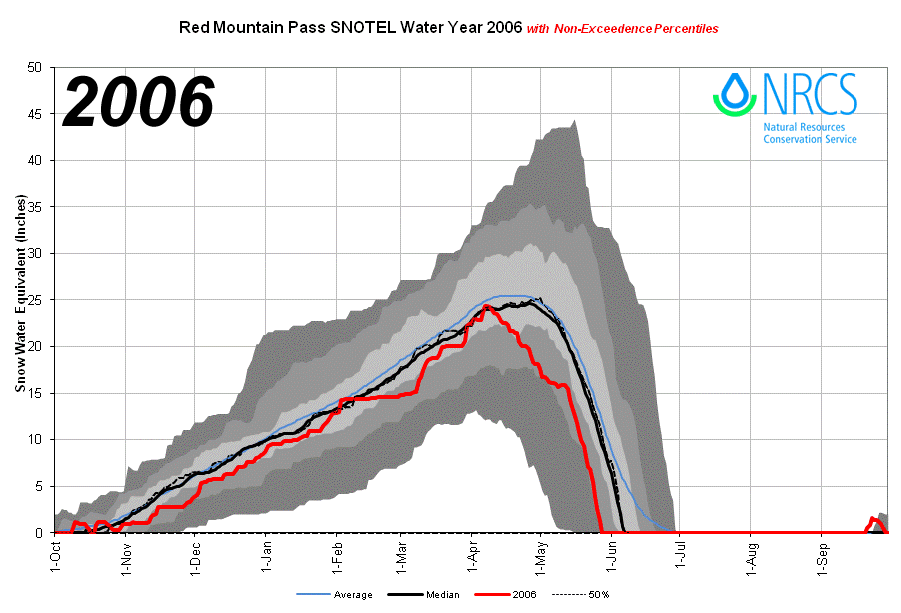
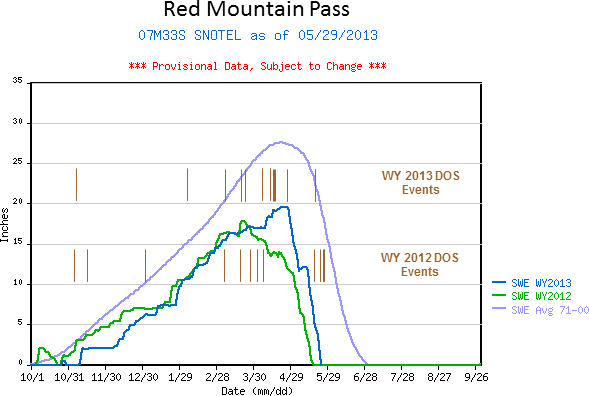
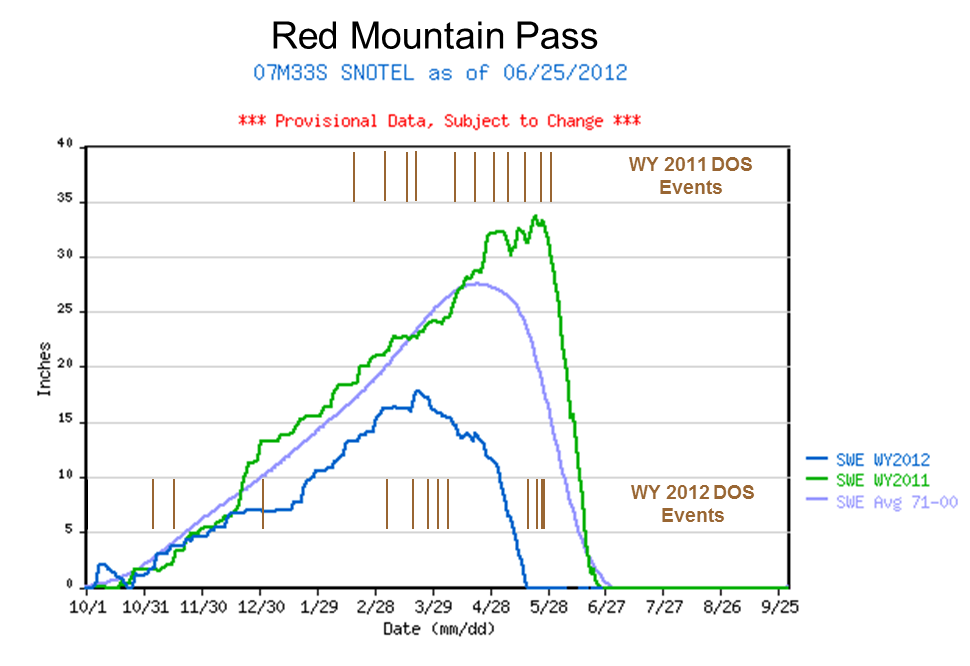
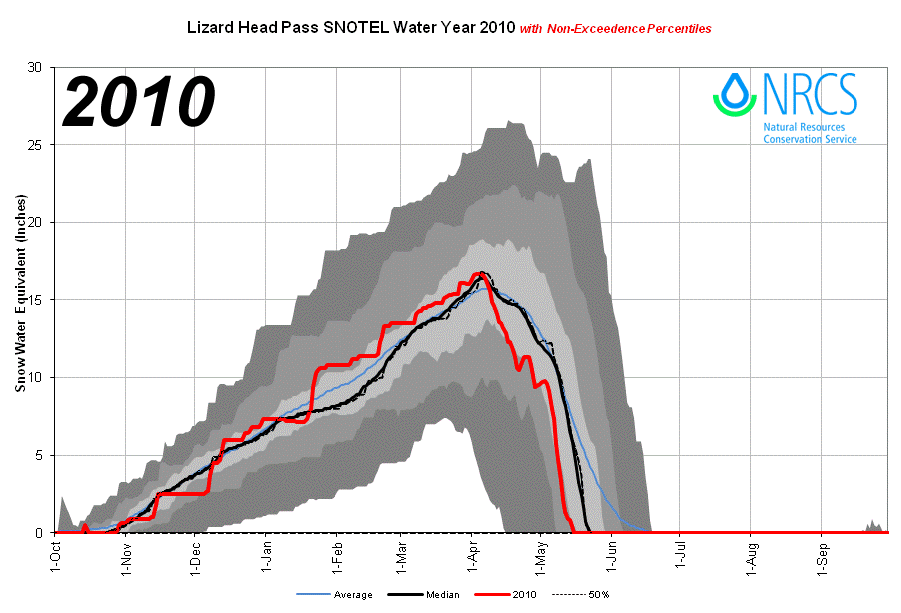
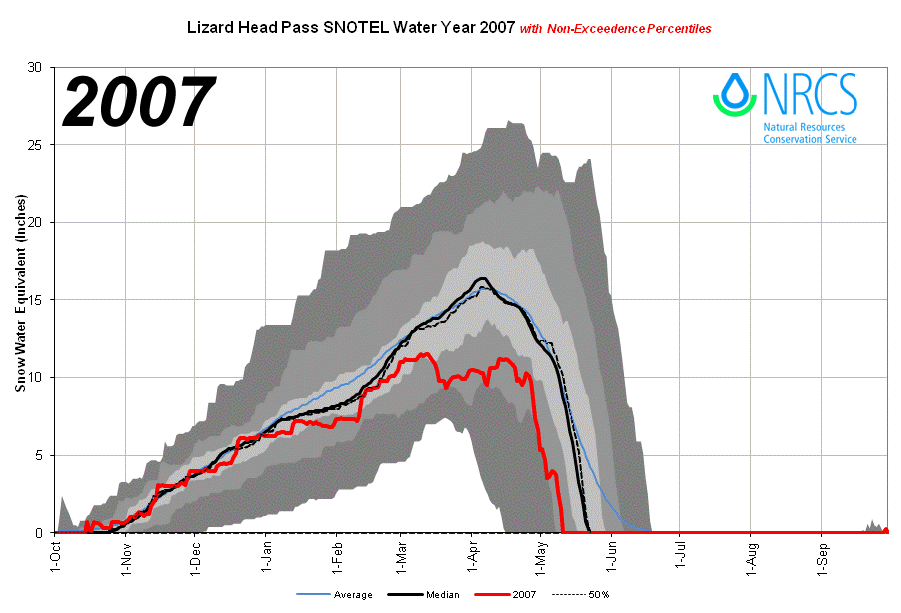
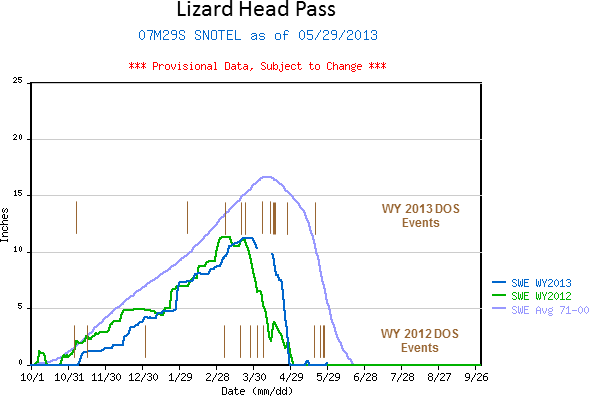
For each Snotel site below, the first nine plots show a single Water Year's SWE relative to the site's historical record (1971 - current). The last two plots compare SWE and Dust on Snow events for two consecutive years. The shaded bands represent non-exceedence percentiles in the following order (from the bottom up):
Minimum - 10th percentile (dark gray)
10th - 30th percentiles (medium gray)
30th - 70th percentiles (light gray) with 50% trace in the middle
70th - 90th percentiles (medium gray)
90th - maximum (dark gray)
For a more detailed explanation, see http://www.wrcc.dri.edu/spi/explanation.html