
CODOS UPDATE January 26, 2024: waiting for the next Storm, Predicting Seasonal Dust-on-Snow Severity?
Greetings from Silverton,
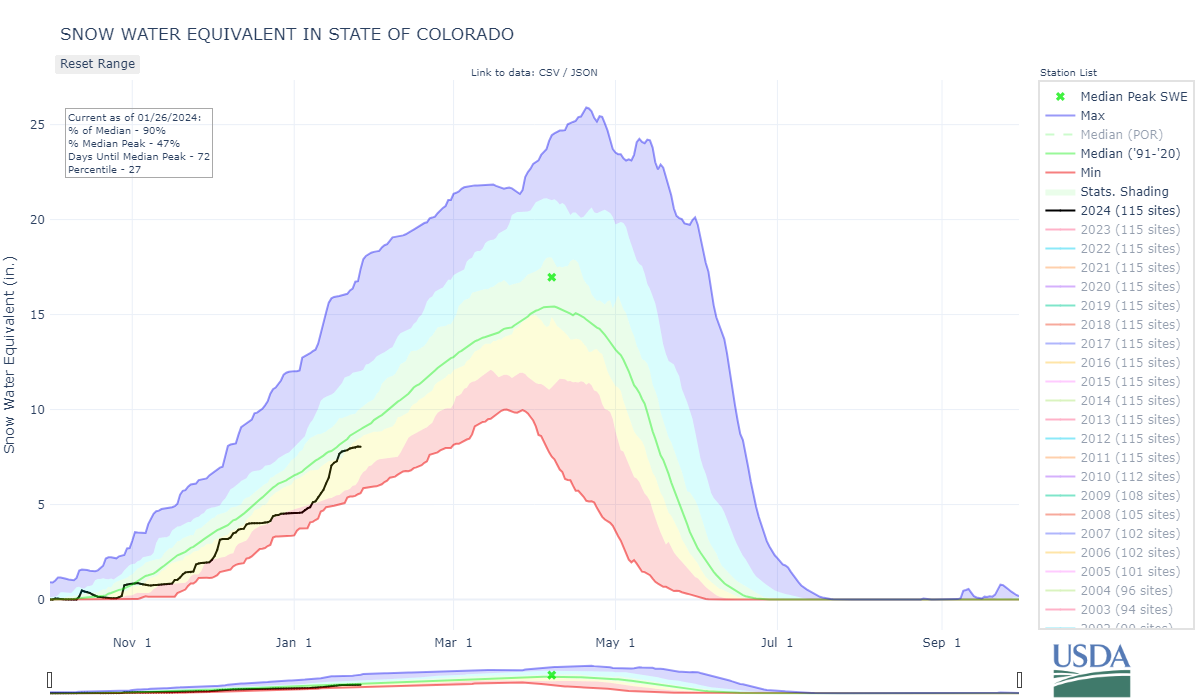
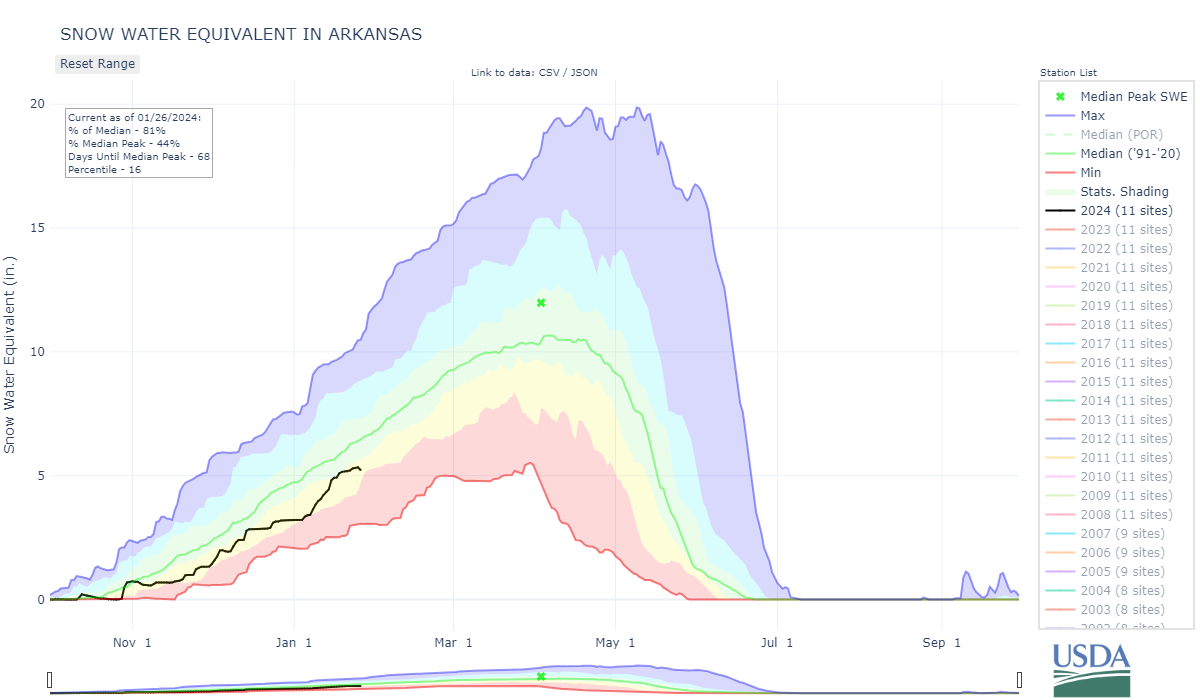
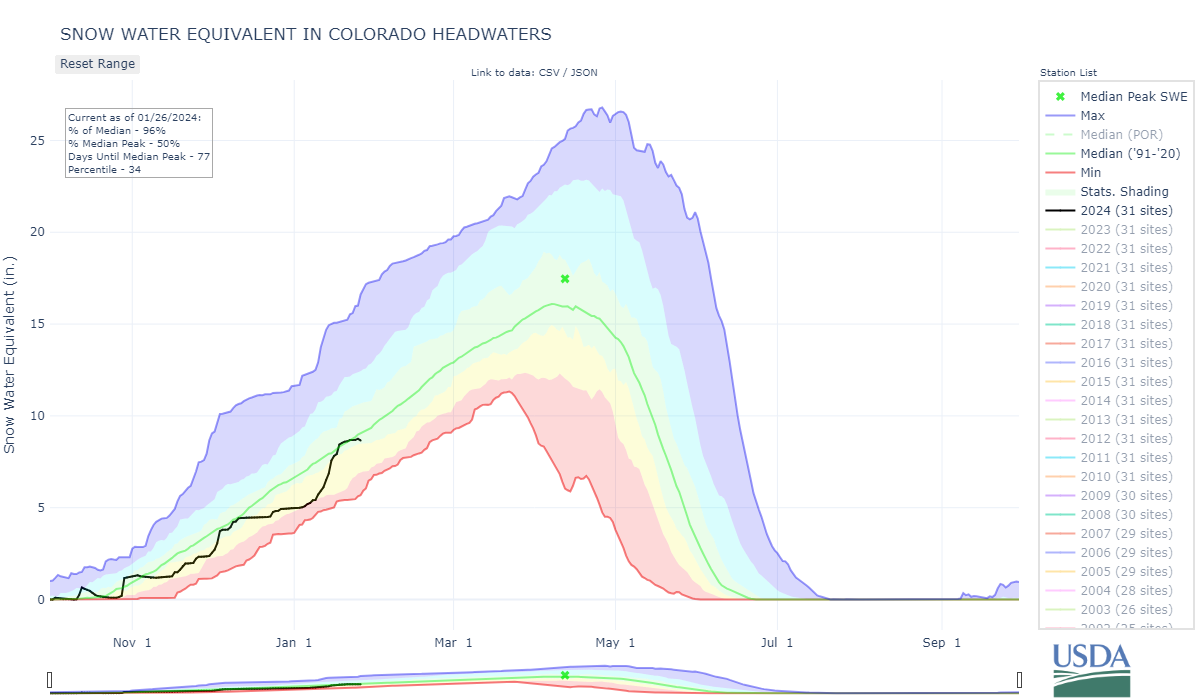
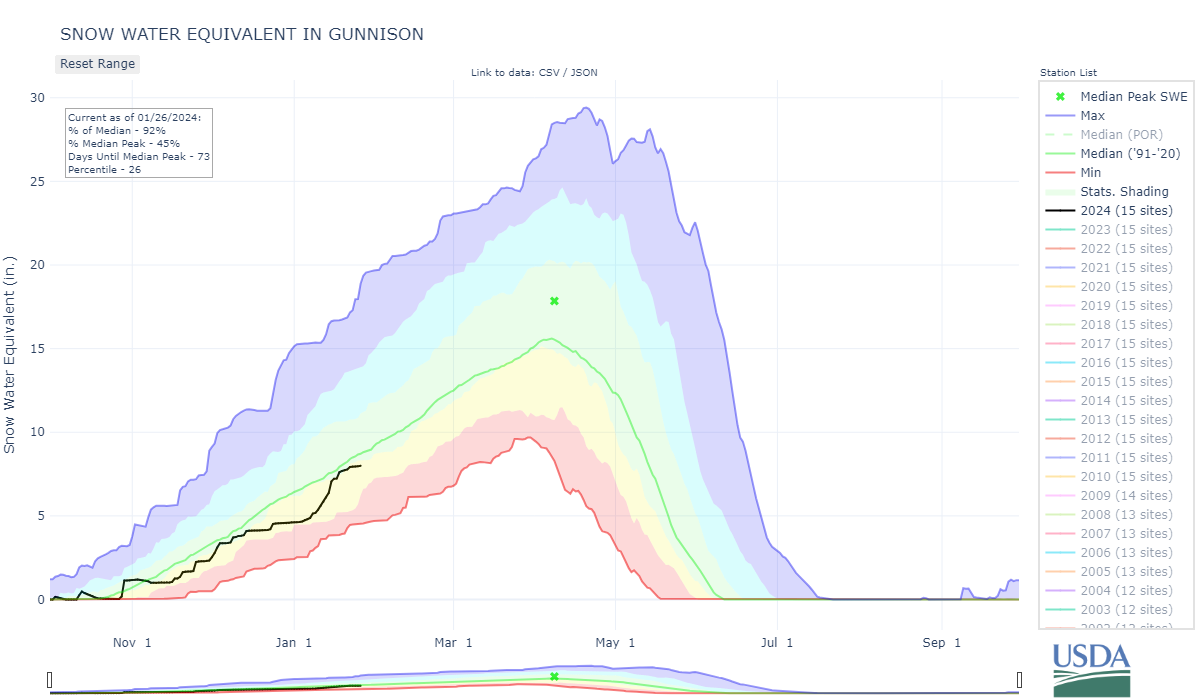
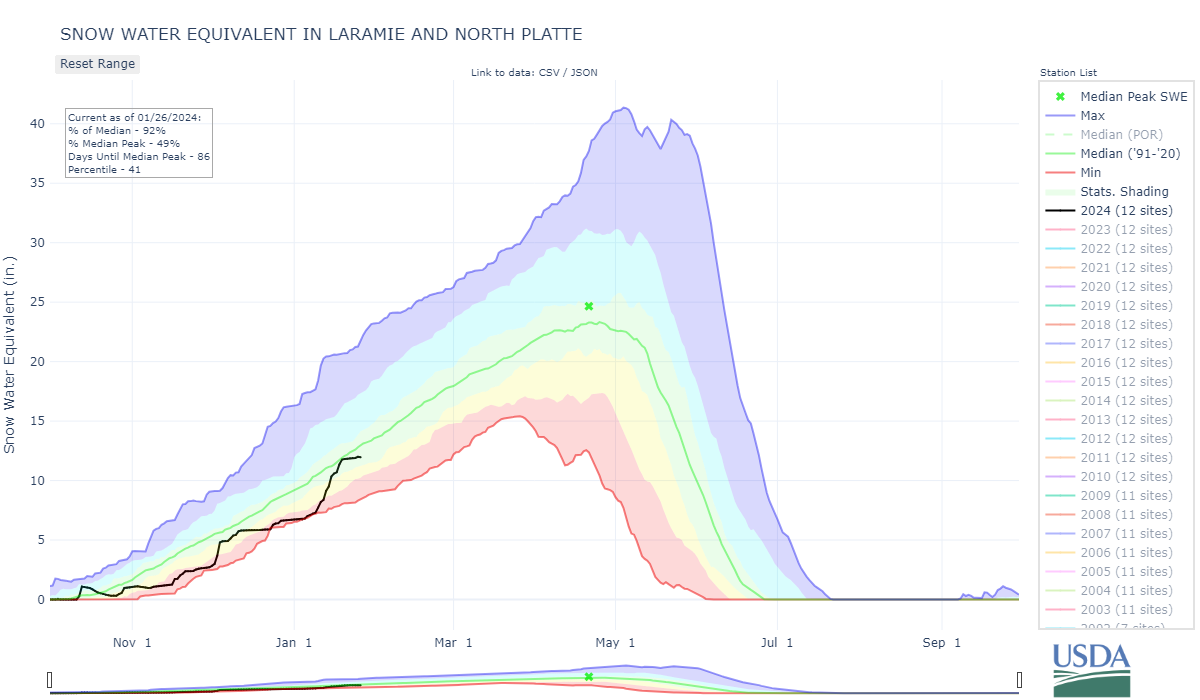
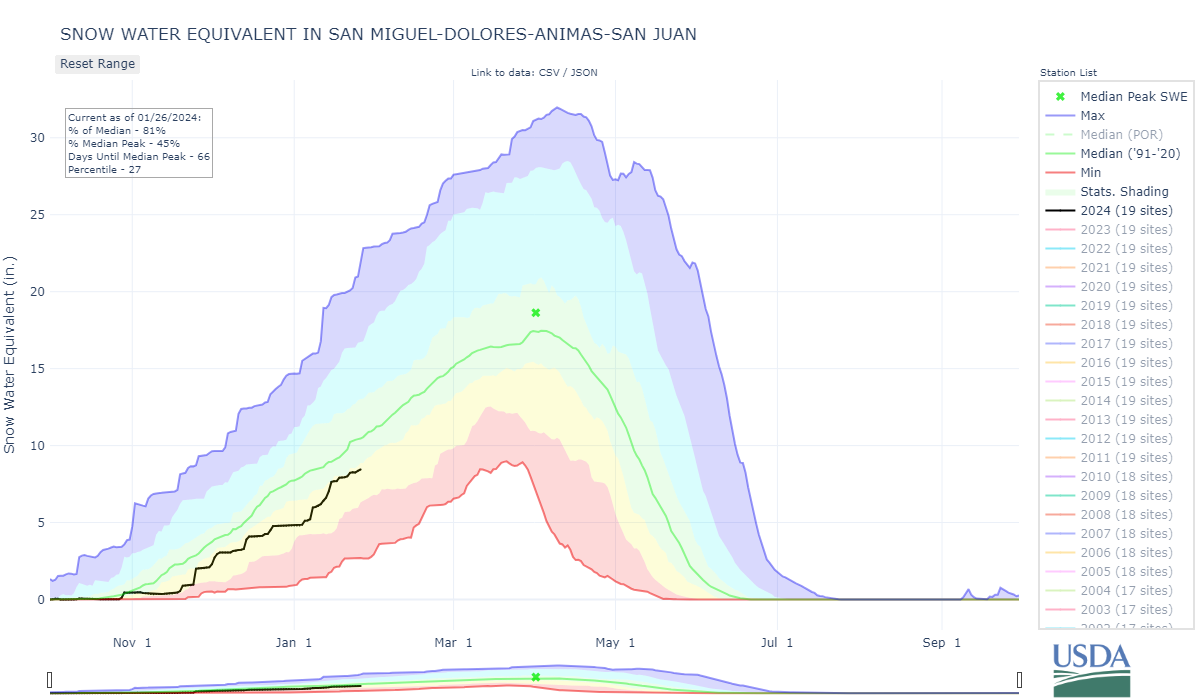
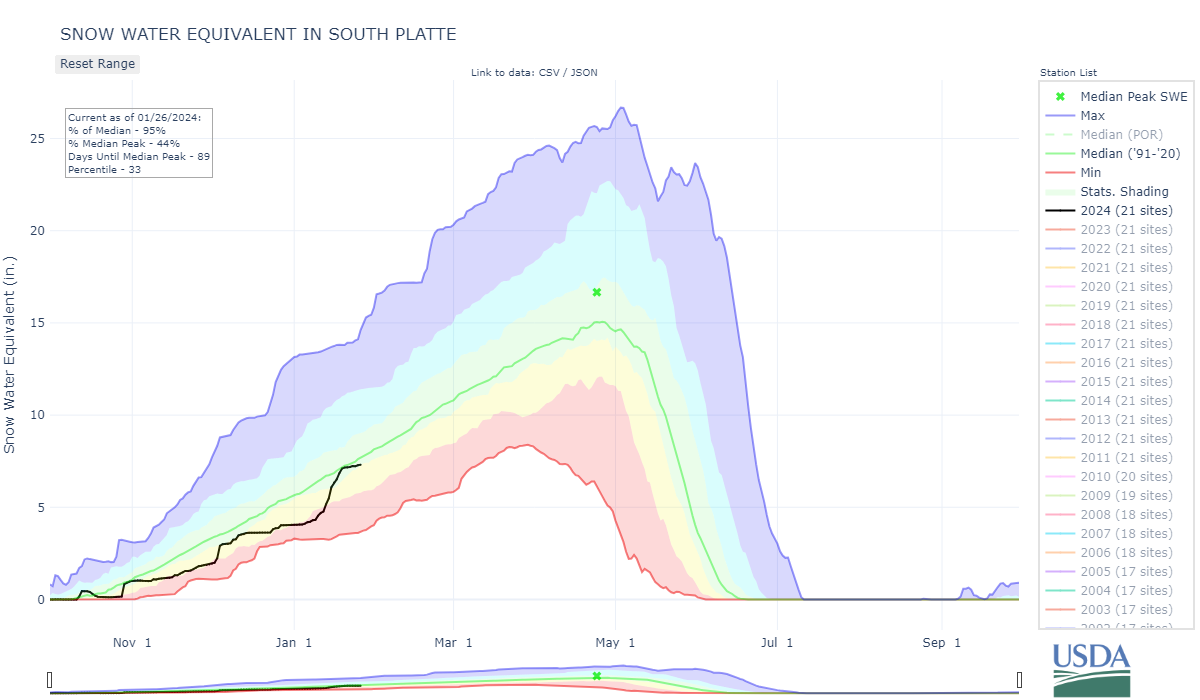
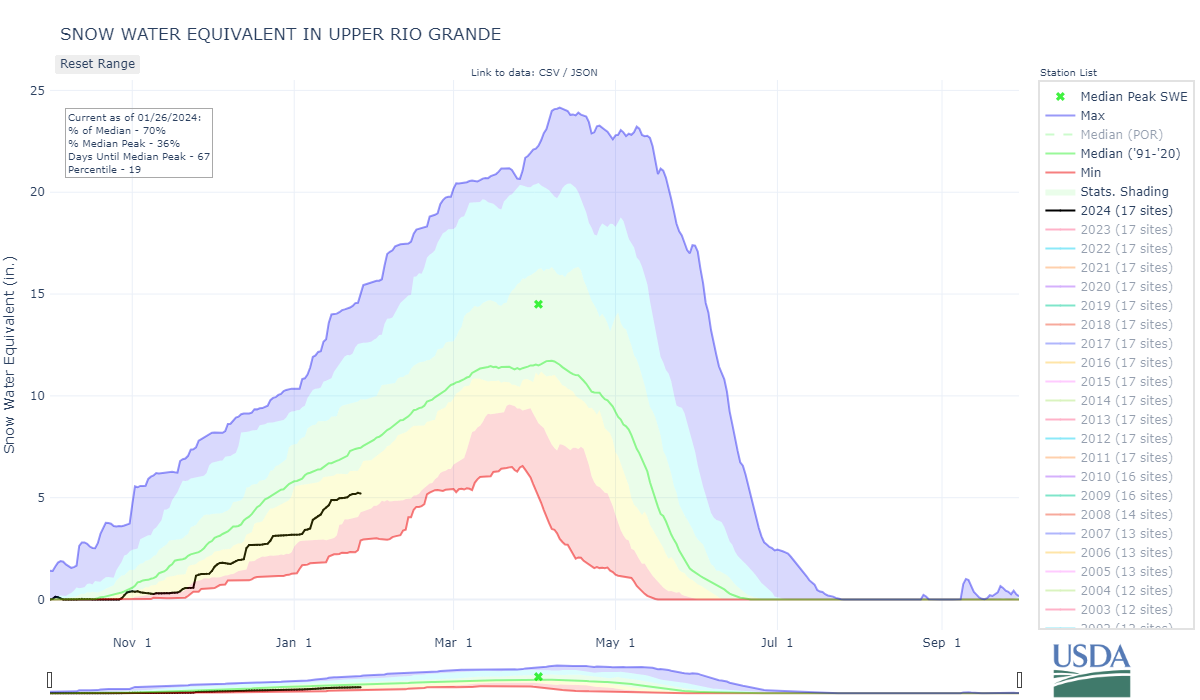
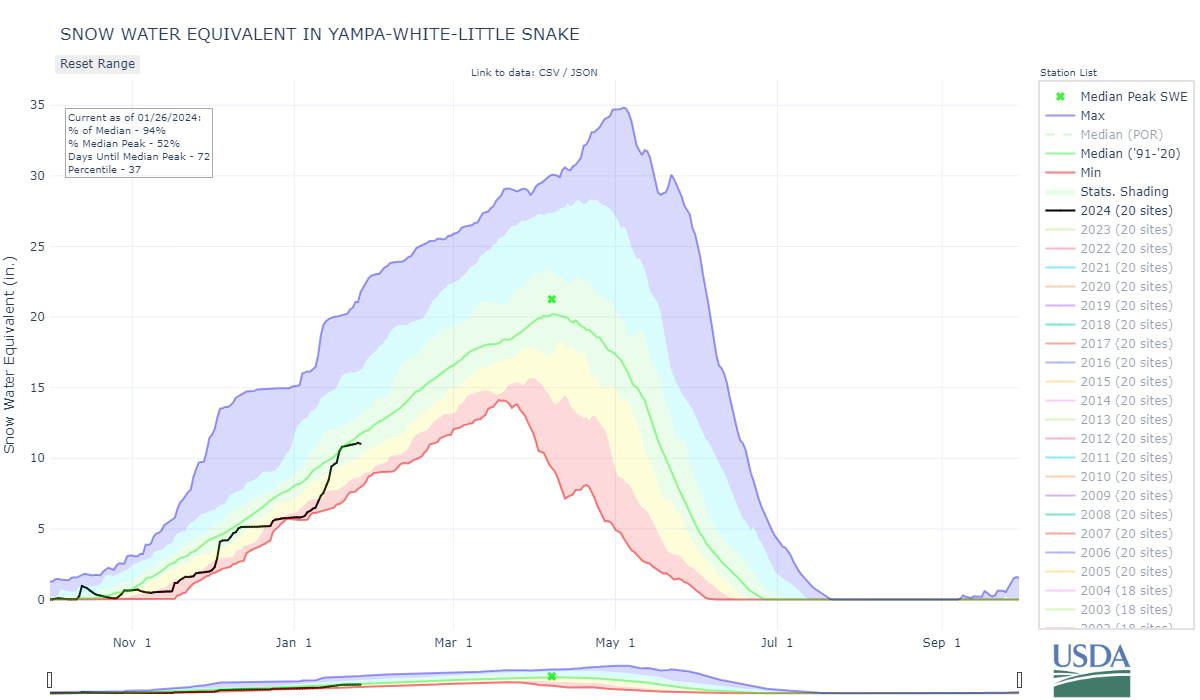
Storms have been coming through the San Juan’s' pretty regularly the last few weeks and most of them not packing much of a punch. Fortunately one of the storms delivered a lot snow (winter storm #7 starting January 11), surging some major basin’s snowpack percentages by 10%. We have been doing a pretty good job staying current on storm reports which can be found here. Currently the snowpack in the major basins ranges between 70-99% of normal (based on 1991-2020 normal). The Southern Basins are the locations struggling most (70-81% of normal). The next 7 days or so is supposed to be pretty quiet then the next round of unsettled conditions will arrive the first of February.
Neat Websites
The folks who maintain the Colorado River Science Wiki made more updates recently. This wiki is a great resource for everything Colorado River and even the West. Also, the Colorado Climate Center started a blog webpage. Sign up to get fun weather/climate updates.
Can Severe Dust-on-Snow Seasons be Predicted?
Along with the attempt to predict the snow season using ENSO and other indices, often the question comes up whether the winter dust-on-snow season can be predicted to any degree. We know that Colorado receives more dust events in spring (April/March/May) as storm tracks out of the Southwest are more numerous, and desert soils are typically well dried out by spring (WY2017 is a good example). But are there any predictive means going into winter? A few years ago our field assistant was investigating this question in his thesis work. Looking at years 2002-2017 he found a correlation between the number of dust events and ENSO and PDO conditions in the year leading up to the season in question. A positive ENSO implies few dust events and negative PDO suggests the opposite. Check out the plots below.

Distribution of DOS event average track direction. The majority of Dust storms originate travel from a bearing of between 200 and 250 degrees before reaching the SBB. This is true for both wet and dry events

The number of dust events per water year based on the average SST departure in the Niño 4 region for the prior January through September. Line of best fit is derived from a generalized linear model with a Poisson distribution.

The number of dust events per water year based on the average SST departure in the Niño 4 region for the prior calendar year. Line of best fit is derived from a generalized linear model with a Poisson distribution

The number of dust events per water year based on the average SST departure in the Northern Pacific region for the prior calendar year. Line of best fit is derived from a generalized linear model with a Poisson distribution

The number of dust events per water year based on the sum average SST departure in the Niño 4 region summed with the adjusted SST departure in the Northern Pacific region for the prior calendar year. Line of best fit is derived from a generalized linear model with a Poisson distribution.
Straub, P. (2016). Examining Meteorological Influences on Dust-on-Snow Event Character Using the Hysplit Model [Unpublished masters dissertation]. Alaska Pacific University