
April 6, 2019: Live Graphics Page, DERC and Radiation Plots
Greetings from Silverton,
After many months of work we have finally made our data graphics page live at snowstudies.org. The page can be found here: https://snowstudies.org/live-plot/. As you may know, you can already see our hourly data in tabular form on snowstudies.org: https://snowstudies.org/current-conditions/. And, we also feed data to CAIC on an hourly basis, which can be viewed here: https://avalanche.state.co.us/observations/weather-stations/
This newly created webpage is considered “experimental”, meaning some of the plots are a bit rough and need to be cleaned up, and also don’t be surprised to see a few data update hiccups on the page over the next few months. But regardless, as we are going into snowmelt and peak streamflow season I thought this graphics page could be useful for many people in understanding what is going on in the high mountains. If you have a certain plot you would like to see please let me know.
Active weather patterns have kept things interesting, we have been seeing a variety of conditions since our last storm March 21-23 (we have received 1.1” of precipitation since then as well). We are heading into the time of year when we regularly show radiation and streamflow plots, taken with the current dust conditions and weather forecast, assist in determining how snowmelt and streamflow will unfold. A warm up is expected Sunday thru Tuesday then a good chance of precipitation Tuesday night thru Wednesday night.

April 1 snow course data for 2019 shows one of the best years in a long time. Still, going back to the 1950’s the trend is less and less snow.
With a warm next couple days expect snowpack warming and lower elevation melt. Forecast calls for cooler temperatures Wednesday and Thursday and a good chance of precipitation.

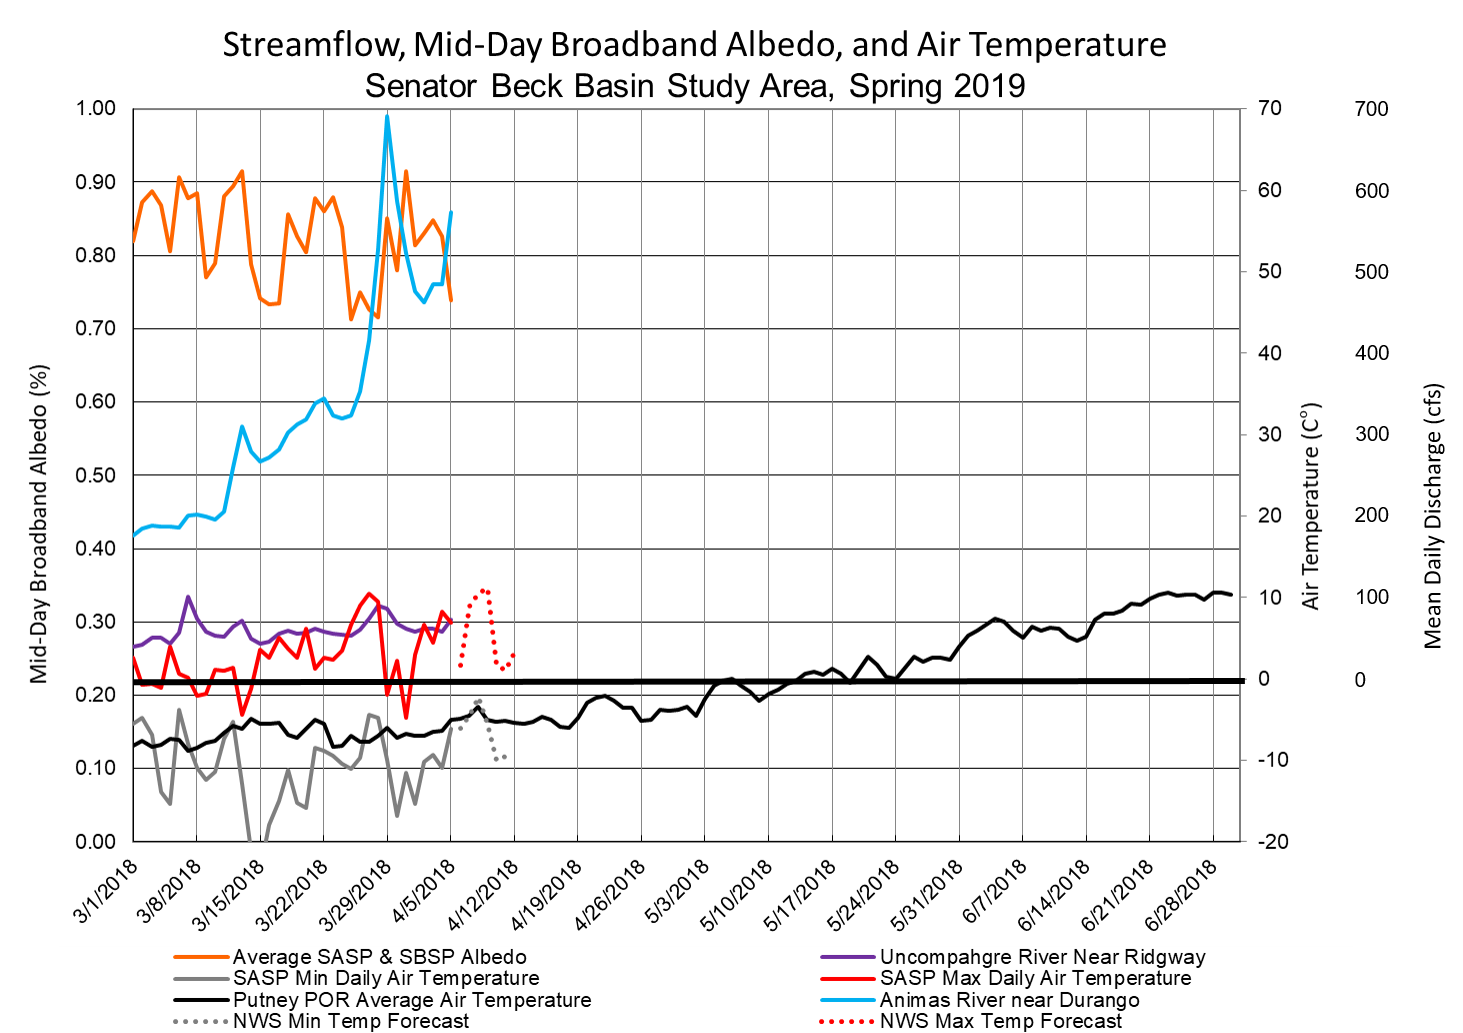
Dust Enhanced Runoff Classification Plots
On March 1 we published an update containing pdf’s that classified March 1 SWE conditions and current dust conditions with different dust and spring weather scenarios for different watersheds in Colorado. That update is located here: http://www.codos.org/codosupdates/mar12019. In these pdf’s are a table that categorizes previous years based on mentioned criteria. Recently I was made aware of a neat NRCS plotting tool that plots SWE with streamflow for select watersheds. This makes it possible to show multiple years in our DERC classification on one plot. Below are a few examples based on WY2019 March 1 conditions with other years in our dust-on-snow record that may be a guide going into spring melt. Many different entities do their own in-house modeling, but it might be informative to consider previous years based on dust conditions and spring conditions.
It is particularly informative to reference the pdf’s in the March 1 update and compare previous years with WY2019 on an individual basis. The link to play with this graphing tool is located here: https://www.wcc.nrcs.usda.gov/ftpref/states/ut/iCharts/dev/SWE_Q/CO/

Animas River at Durango: 2009 which was a dry spring and HIGH dust year saw a very early peak (May 13), snow melted early. 2008 was average dust and a dry spring and peaked around May 20. 2011 was a wet spring with average dust, the snow stuck around late for the amount that was on ground. 2017 was dry spring and average dust and fell in the middle of the group

Gunnison River near Gunnison: 2008 and 2011 were both a wet spring and average dust. 2017 was dry spring and average dust. 2008 saw an early peak on May 22 and a second on June 4. 2011 did not have an exceptional peak and stuck around well into summer. 2017 peaked near June 10 and a second near June 20.

Dolores River at Dolores: 2008 was a dry spring with average dust, peaked May 21 with second peak around June 4. 2009 was dry spring and max dust, result was early peak on May 9. 2017 was dry spring with average dust, showed some early peaks as well but not any one exceptional peak.


Rio Grande near Del Norte: 2008 is most comparable, it was dry spring and average dust – peaked May 21 and a second June 3. 2011 was wet spring and average dust. 2011 largely stayed near median besides some dips and spikes. Like the others 2009 was max dust and peaked early. 2010 fared well for being max dust and dry spring (not shown).

Blue River near Dillon: 2007, 2008, 2009 was min, average, max dust, respectively. All were an average spring. Snow stuck around until mid-June for all three years. 2009 had an early, high peak. 2007 a peak in mid-June. 2011 a wet spring with average dust, river peaked near mid-July.

Yampa River near Steamboat: 2016 was a wet spring with min dust, the peak was June 6. March 1 SWE was high in 2006, it was a dry spring and max dust. An early peak occurred April 16, then the main peak was May 23.

Uncompahgre River at Ridgway: 2008 was a dry spring with average dust. The river did not peak until June 23 and July 4. Flows were high all of spring. 2011 was wet spring and average dust, the river peaked July 9. 2017 was dry spring and average dust, peak was near median and at almost double the discharge.