SUMMARY
Looking back at this past snow season the word that pops into our head is “uneventful”. In southern Colorado we received few storms and none of those storms delivered a real punch, just blah. Most northern basins fared much better, holding on to a mostly normal snowpack until spring. Uneventful as well in terms of dust-on-snow events. We only observed three events total and they were all mild to average in severity. Lack of storms translates into lack of snow and, this year anyway, lack of dust. Partly, the lack of dust events stem from most of the early season storms largely came down from the north, missing the major dust source region of the Southwest. This may have been because it was almost a La Nina year which usually shifts the storm tracks northward. Disappointing too was another dry spring, where some areas were as low as 25% of normal for the months of March/April/May, every region in Colorado took a hit. Please see all the details in the below summary. More details about individual storms this past season can be viewed in our storm reports summary document.
MONTHLY WEATHER CONDITIONS
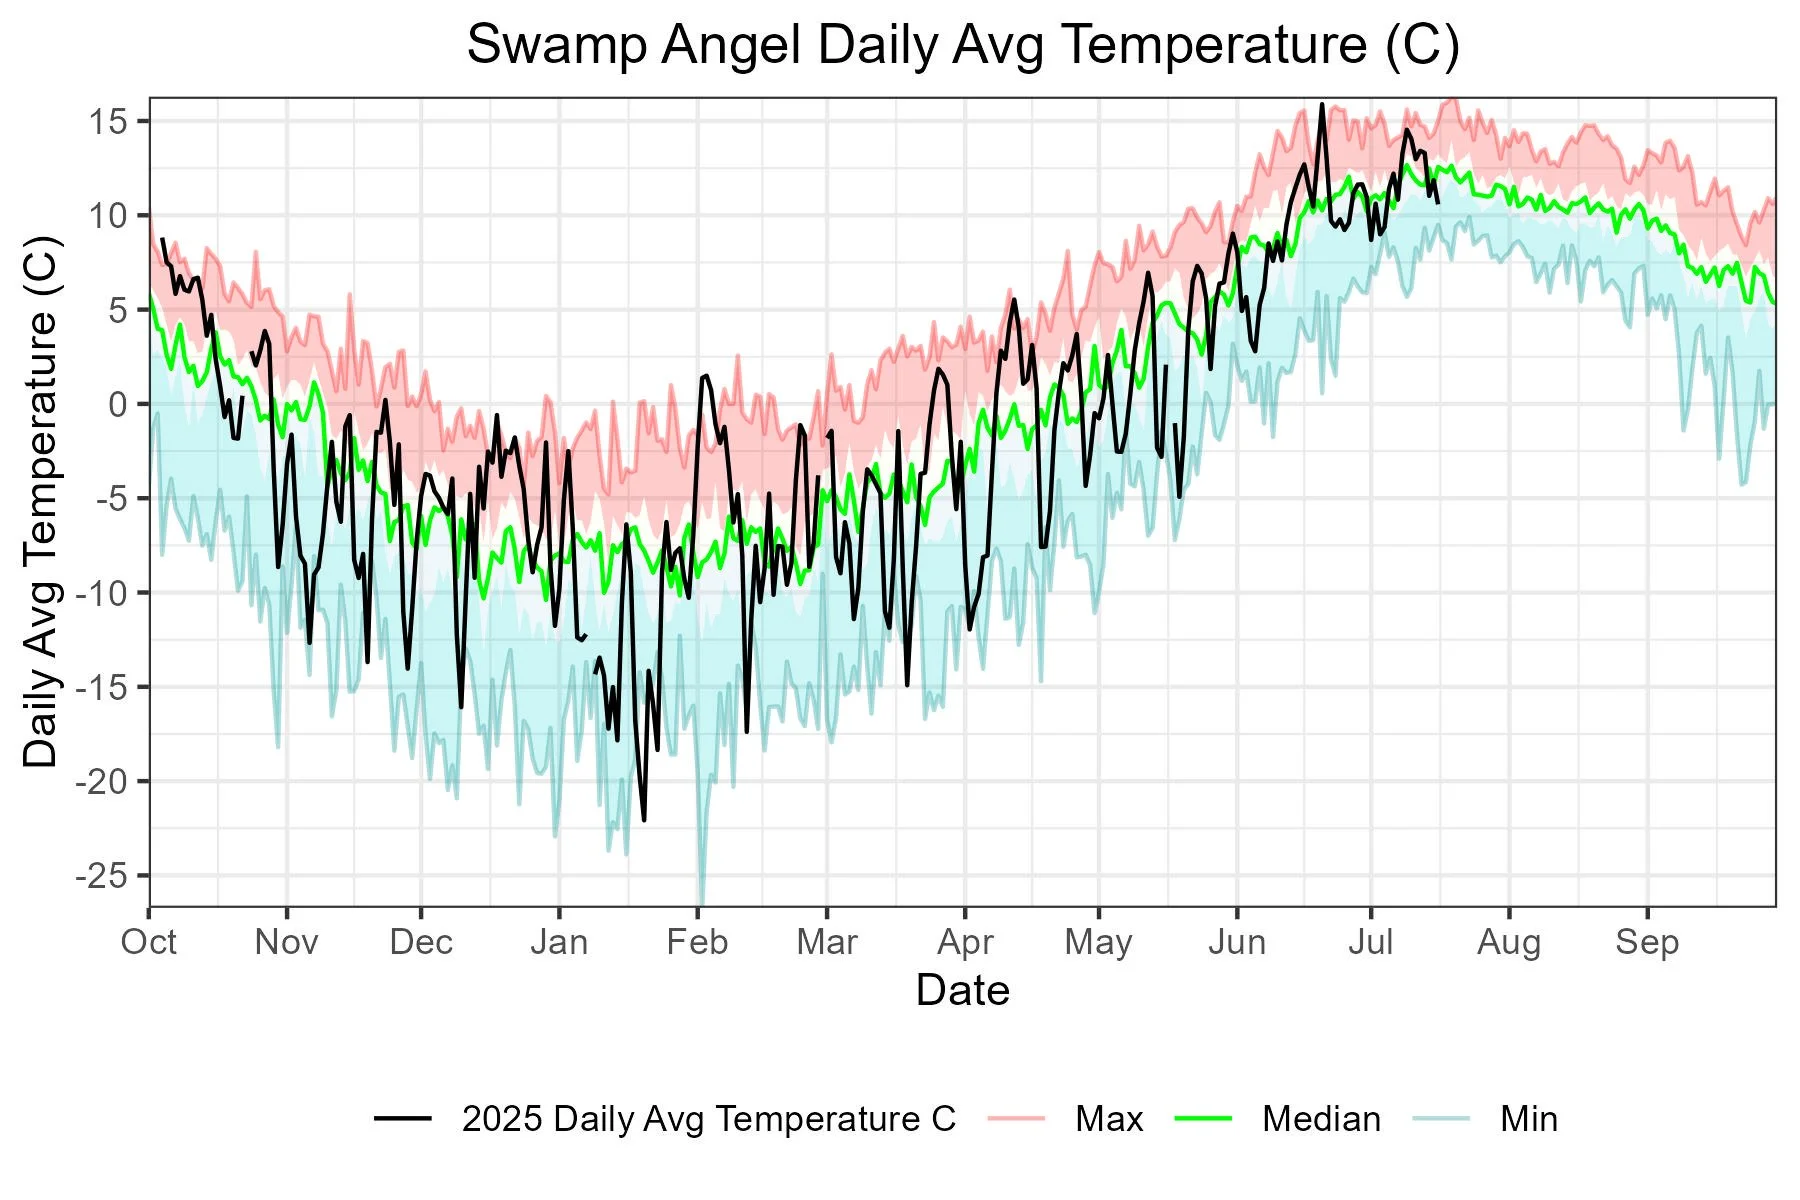
October Weather Summary: The southern parts of Colorado fared well the second half of October; southern basins found themselves with upwards of 200% of normal precipitation. It was extremely warm across Colorado; it was, in fact, Colorado’s second warmest October on record. And yet, we also had some cold snaps, such as 2° F record October 31 on Red Mountain Pass (Swamp Angel minimum temperature that day was 6° F). ENSO neutral conditions prevailed with a chance of La Nina developing by early winter.
Swamp Angel Study Plot recorded two decent winter storms in the second half of October. It precipitated eight days out of the month. Our monthly total was 5.4” (137 mm) of precipitation (3.5” (88 mm) is the 2004-2023 average) which was 156% of normal. Our monthly average temperature (average of the daily average) was 36.8° F (2.7 Celsius).
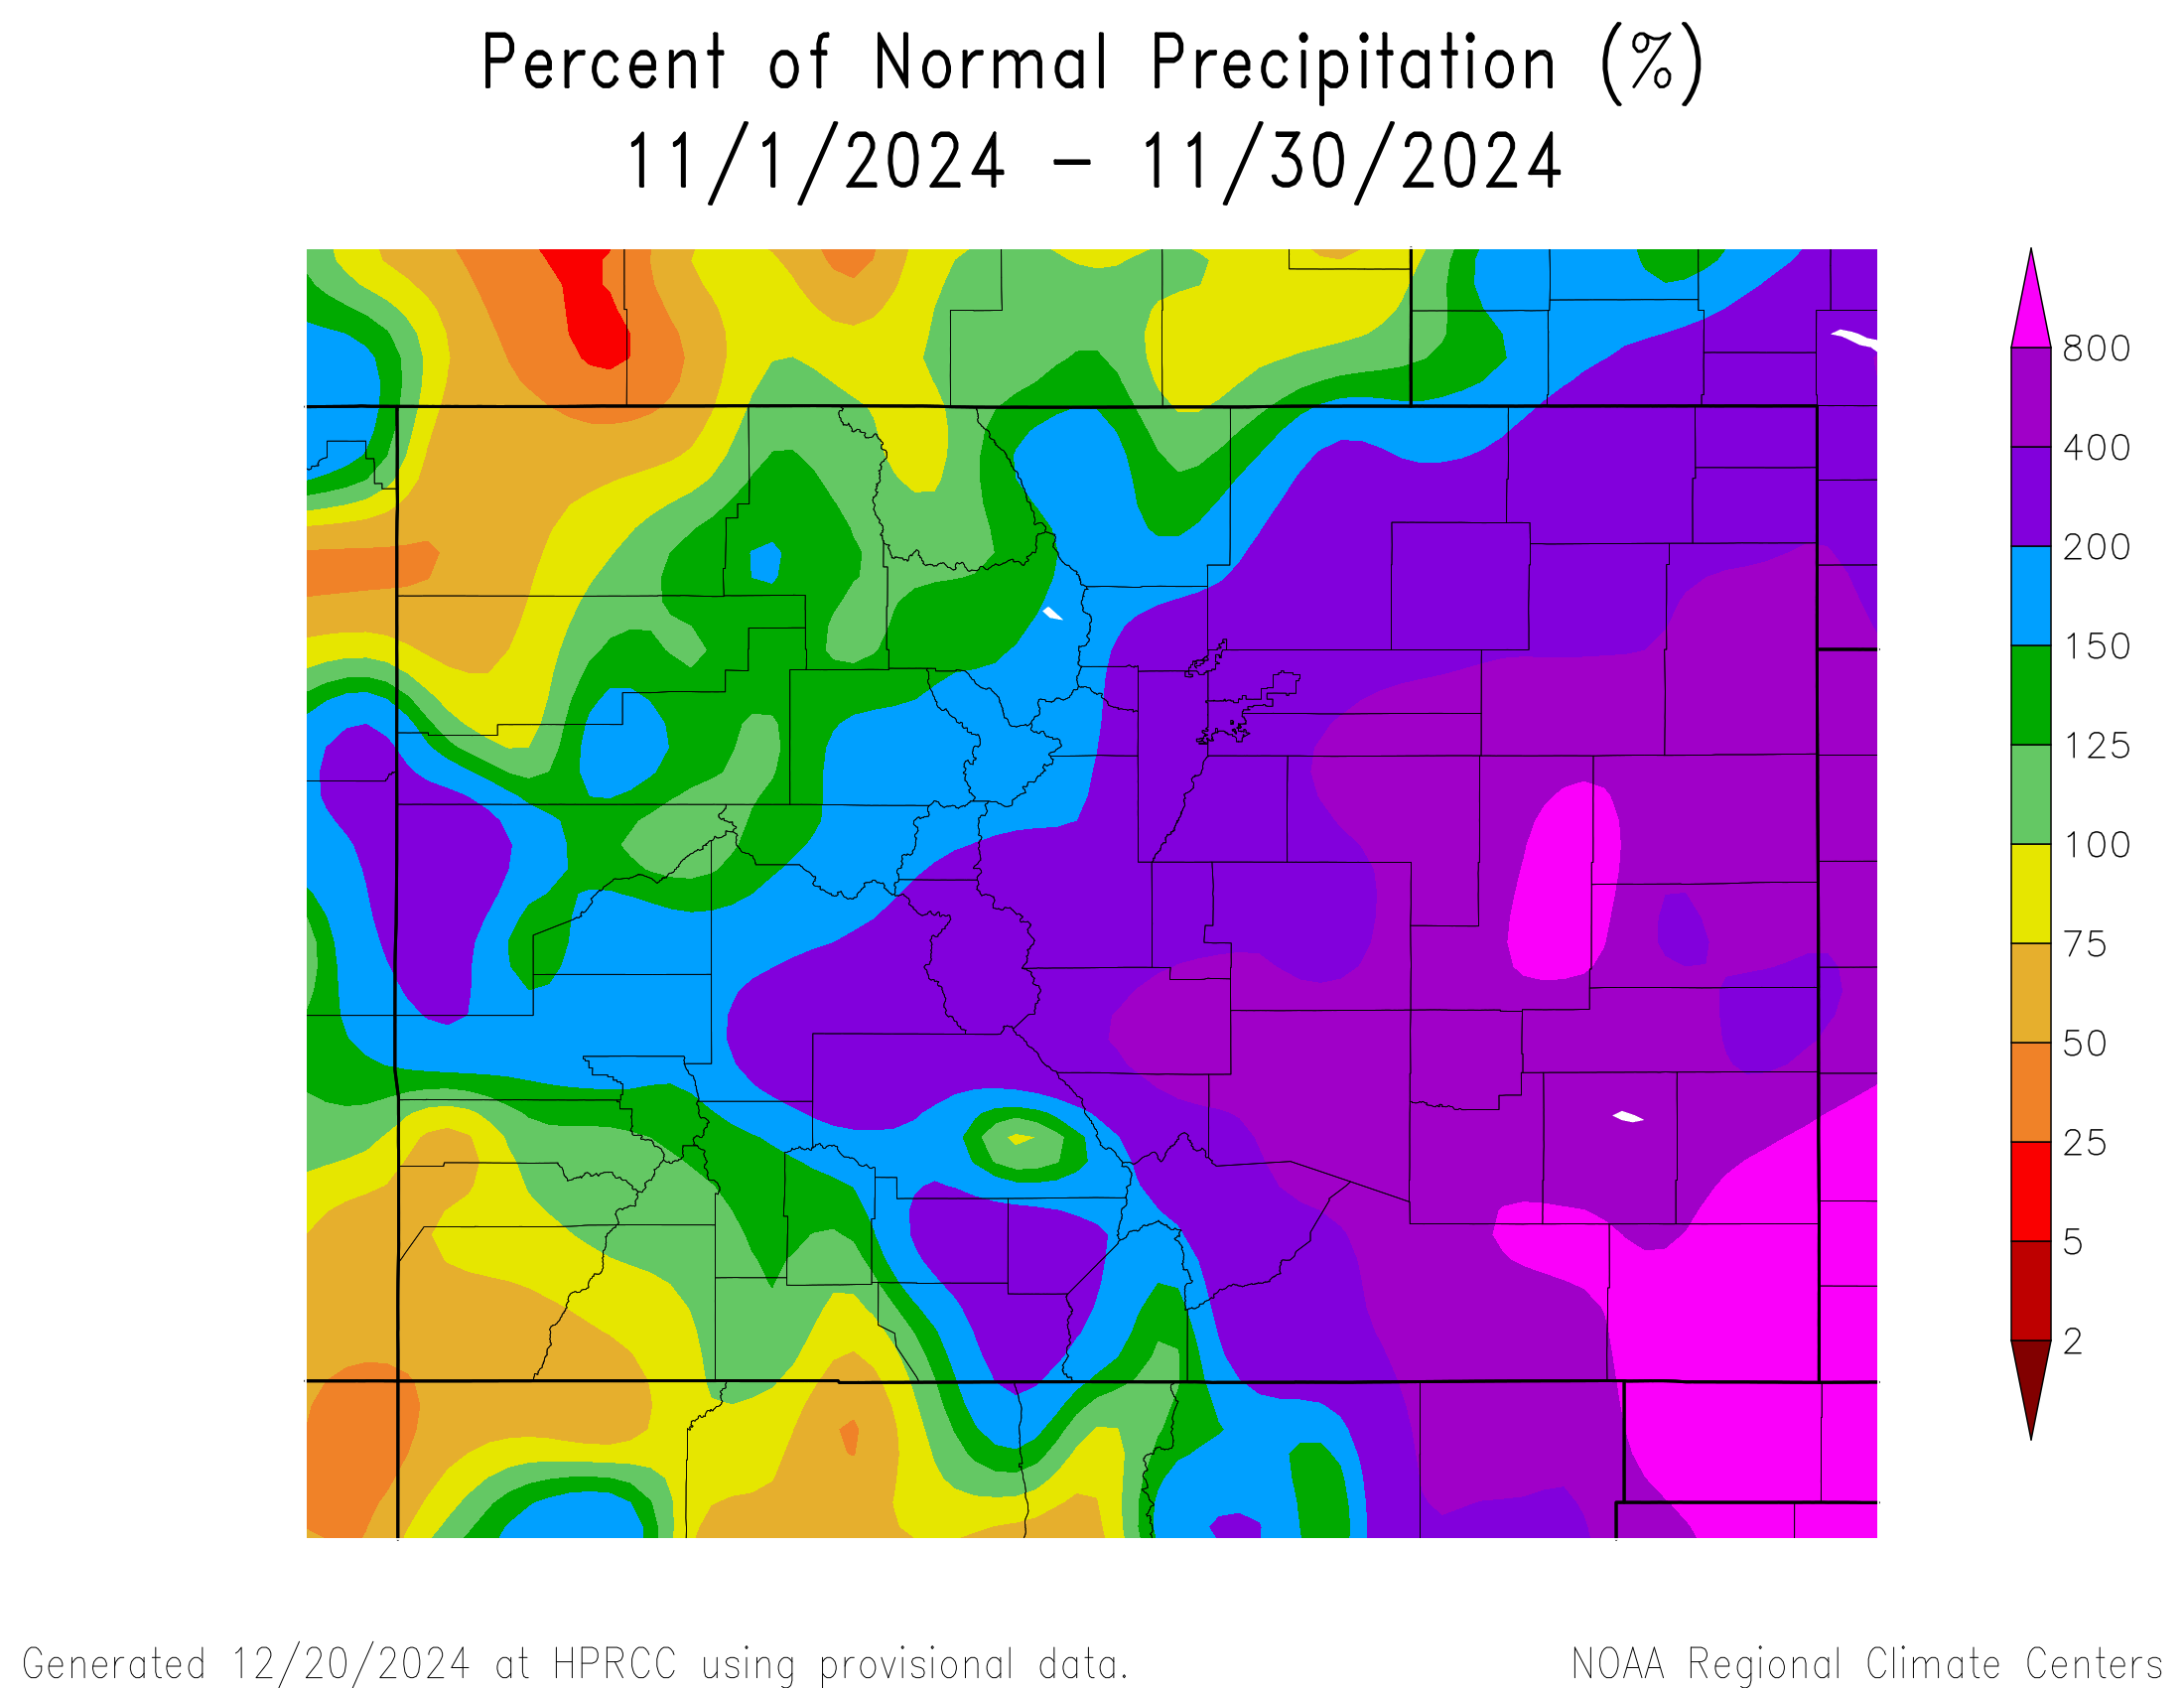
November Weather Summary: Things cooled off in November across the state, and brought some major snow events (five feet in the Sangre de Cristos?!). This big storm lifted drought conditions by 35%. The southern basins still held over 150% of average snow water equivalent by the end of the month, while the north was closer to average conditions. At this time, NOAA predicted an increased probability of below average precipitation and warmer-than-average temperatures for southern Colorado through February 2025. ENSO neutral conditions prevailed with a continued chance of tipping into a La Niña.
The biggest snowfall totals hit west of the San Juans. In our study basin, we saw two decent winter storms on the 5th and the 25th. We had seventeen days recording precipitation, and 3.9” (100 mm) of precipitation (3.5”/89 mm average), which was 112% of normal. Monthly average temperature for Swamp Angel was 20.8° F (-6.2 Celsius).
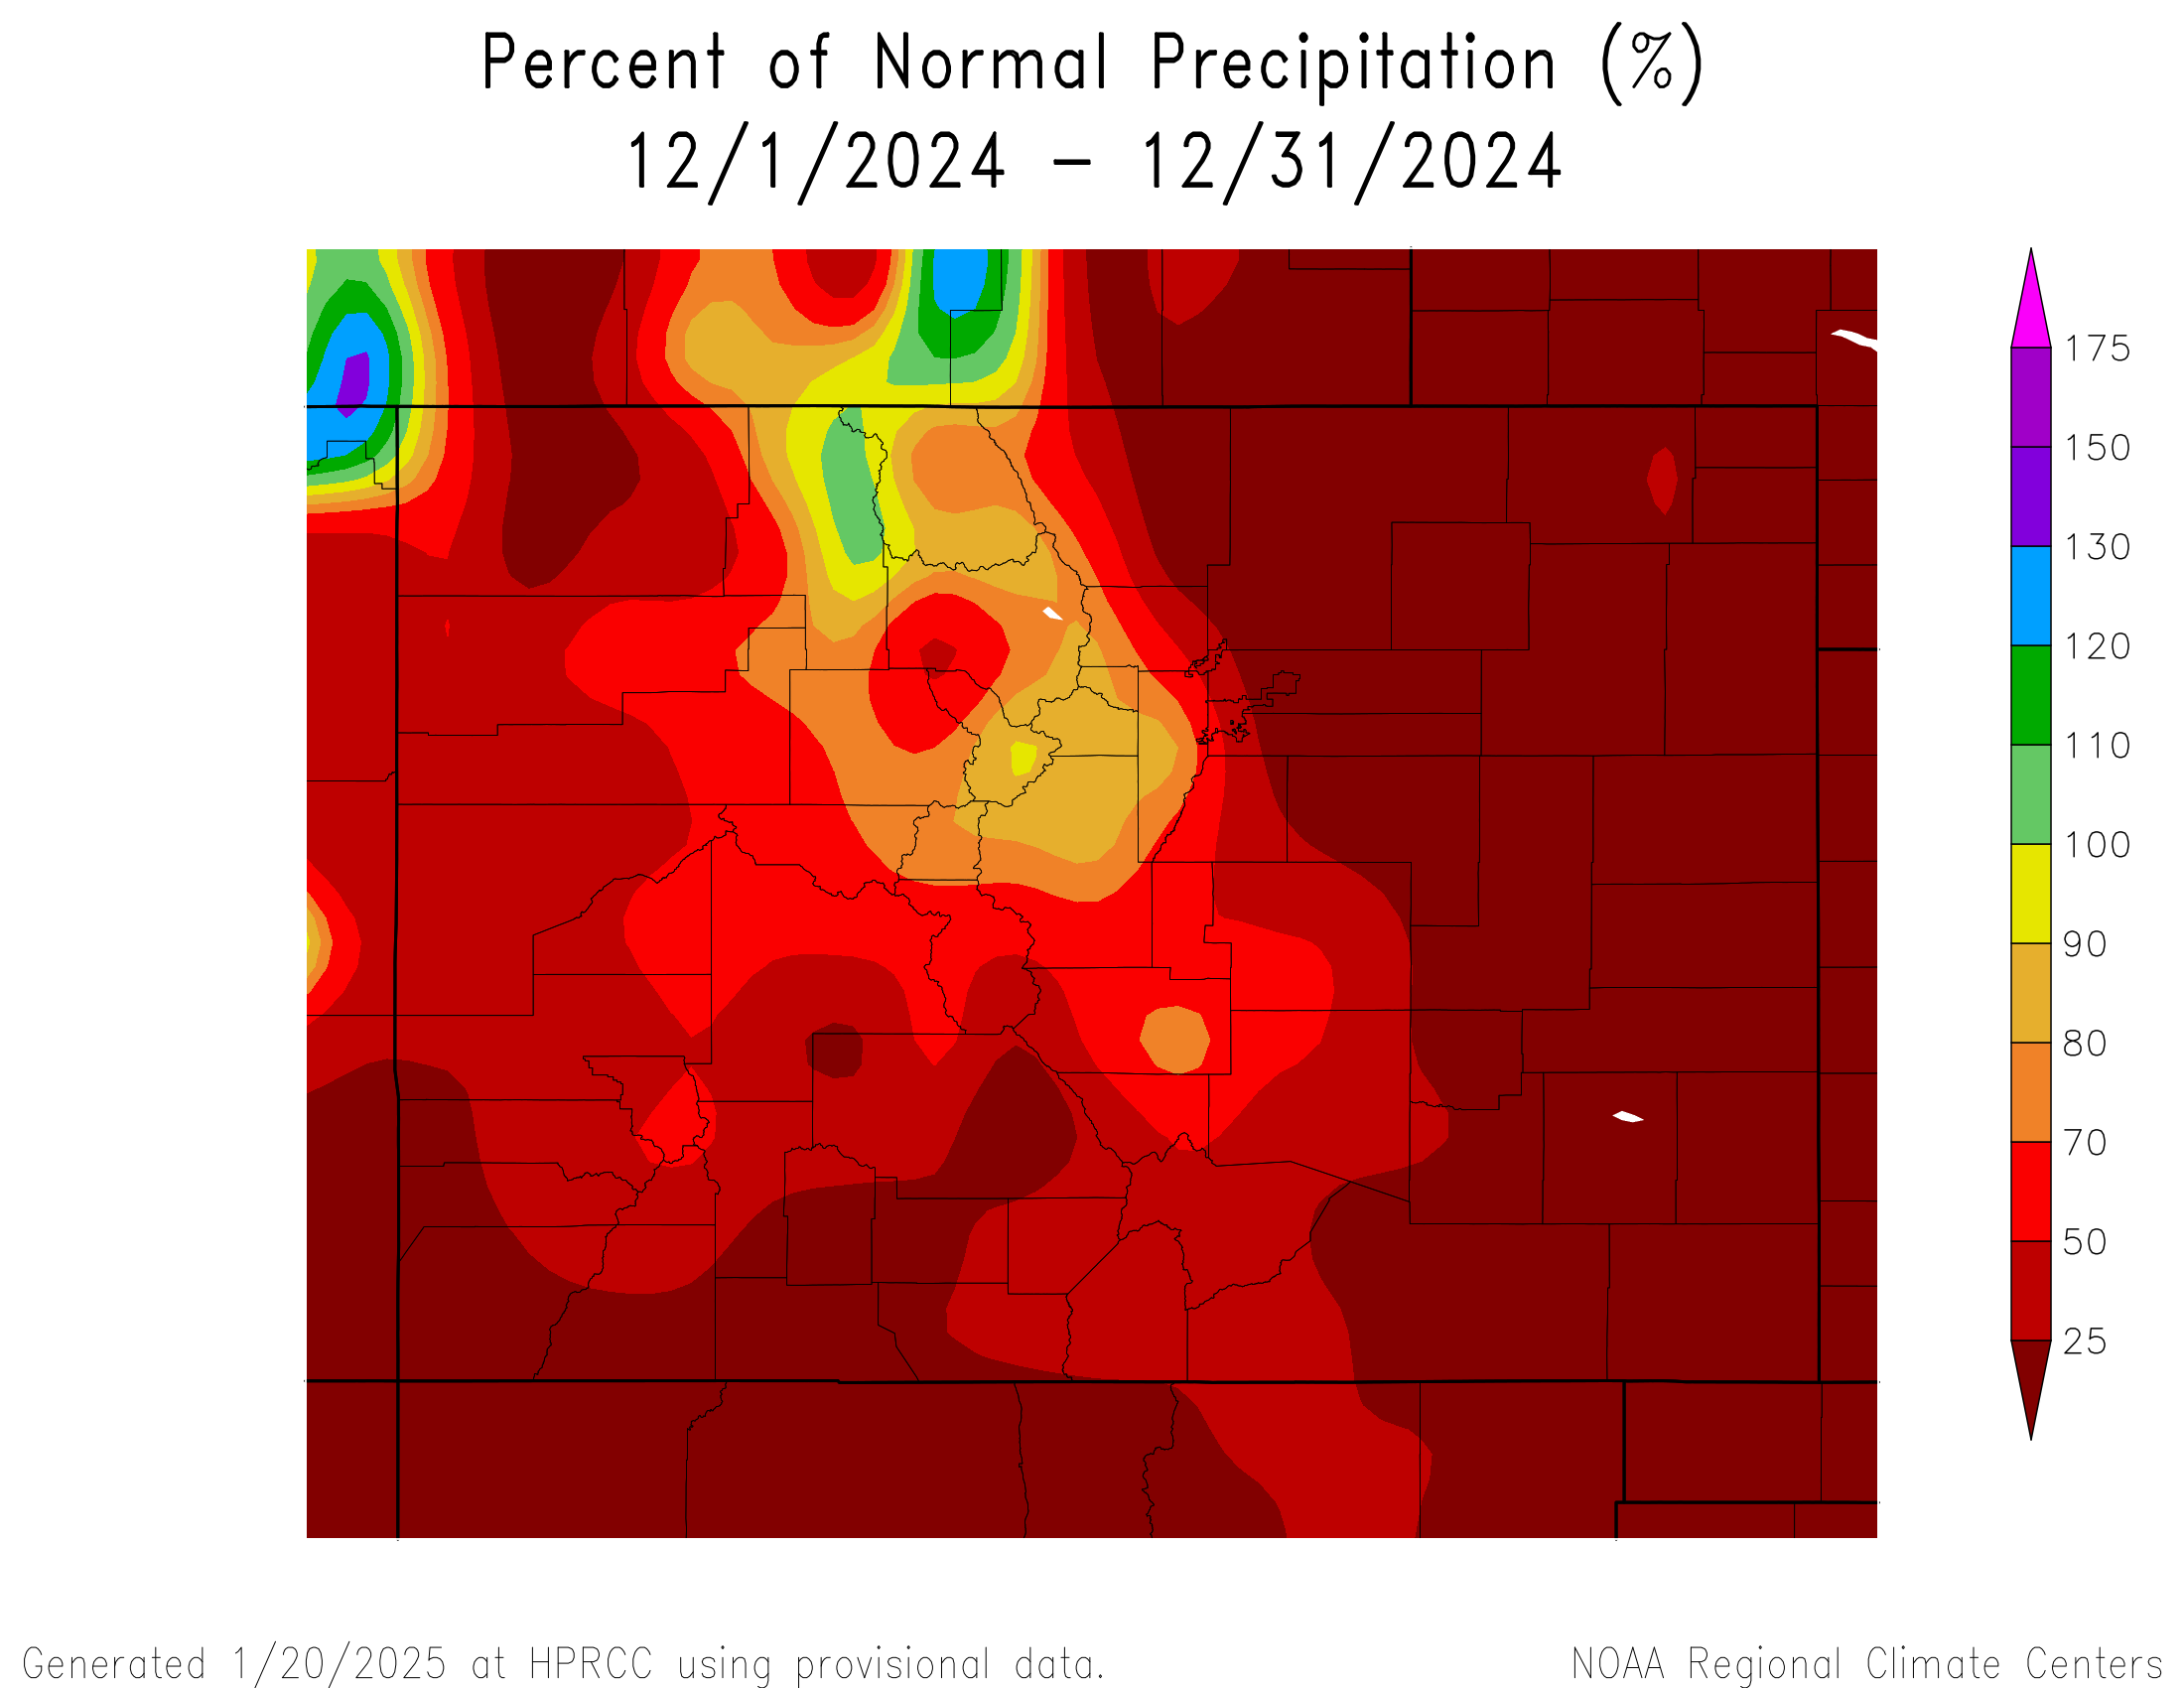
December Weather Summary: December was very warm for the state of Colorado – in most places, in the top 10 warmest Decembers on record. It was also very dry for most of the state, with the exception of the northern mountains recovering to near normal with late December storms. The southern basins did not recover, and began to lag behind for the remainder of the winter.
In our study basin, we had scant precipitation until the holidays arrived. Then, we had two winter storms, with December wrapping up with eight days recording precipitation, 2.6” (67 mm) (124 mm average) – just 54% of normal. Average monthly temperature was 21.7° F (-5.7 C)
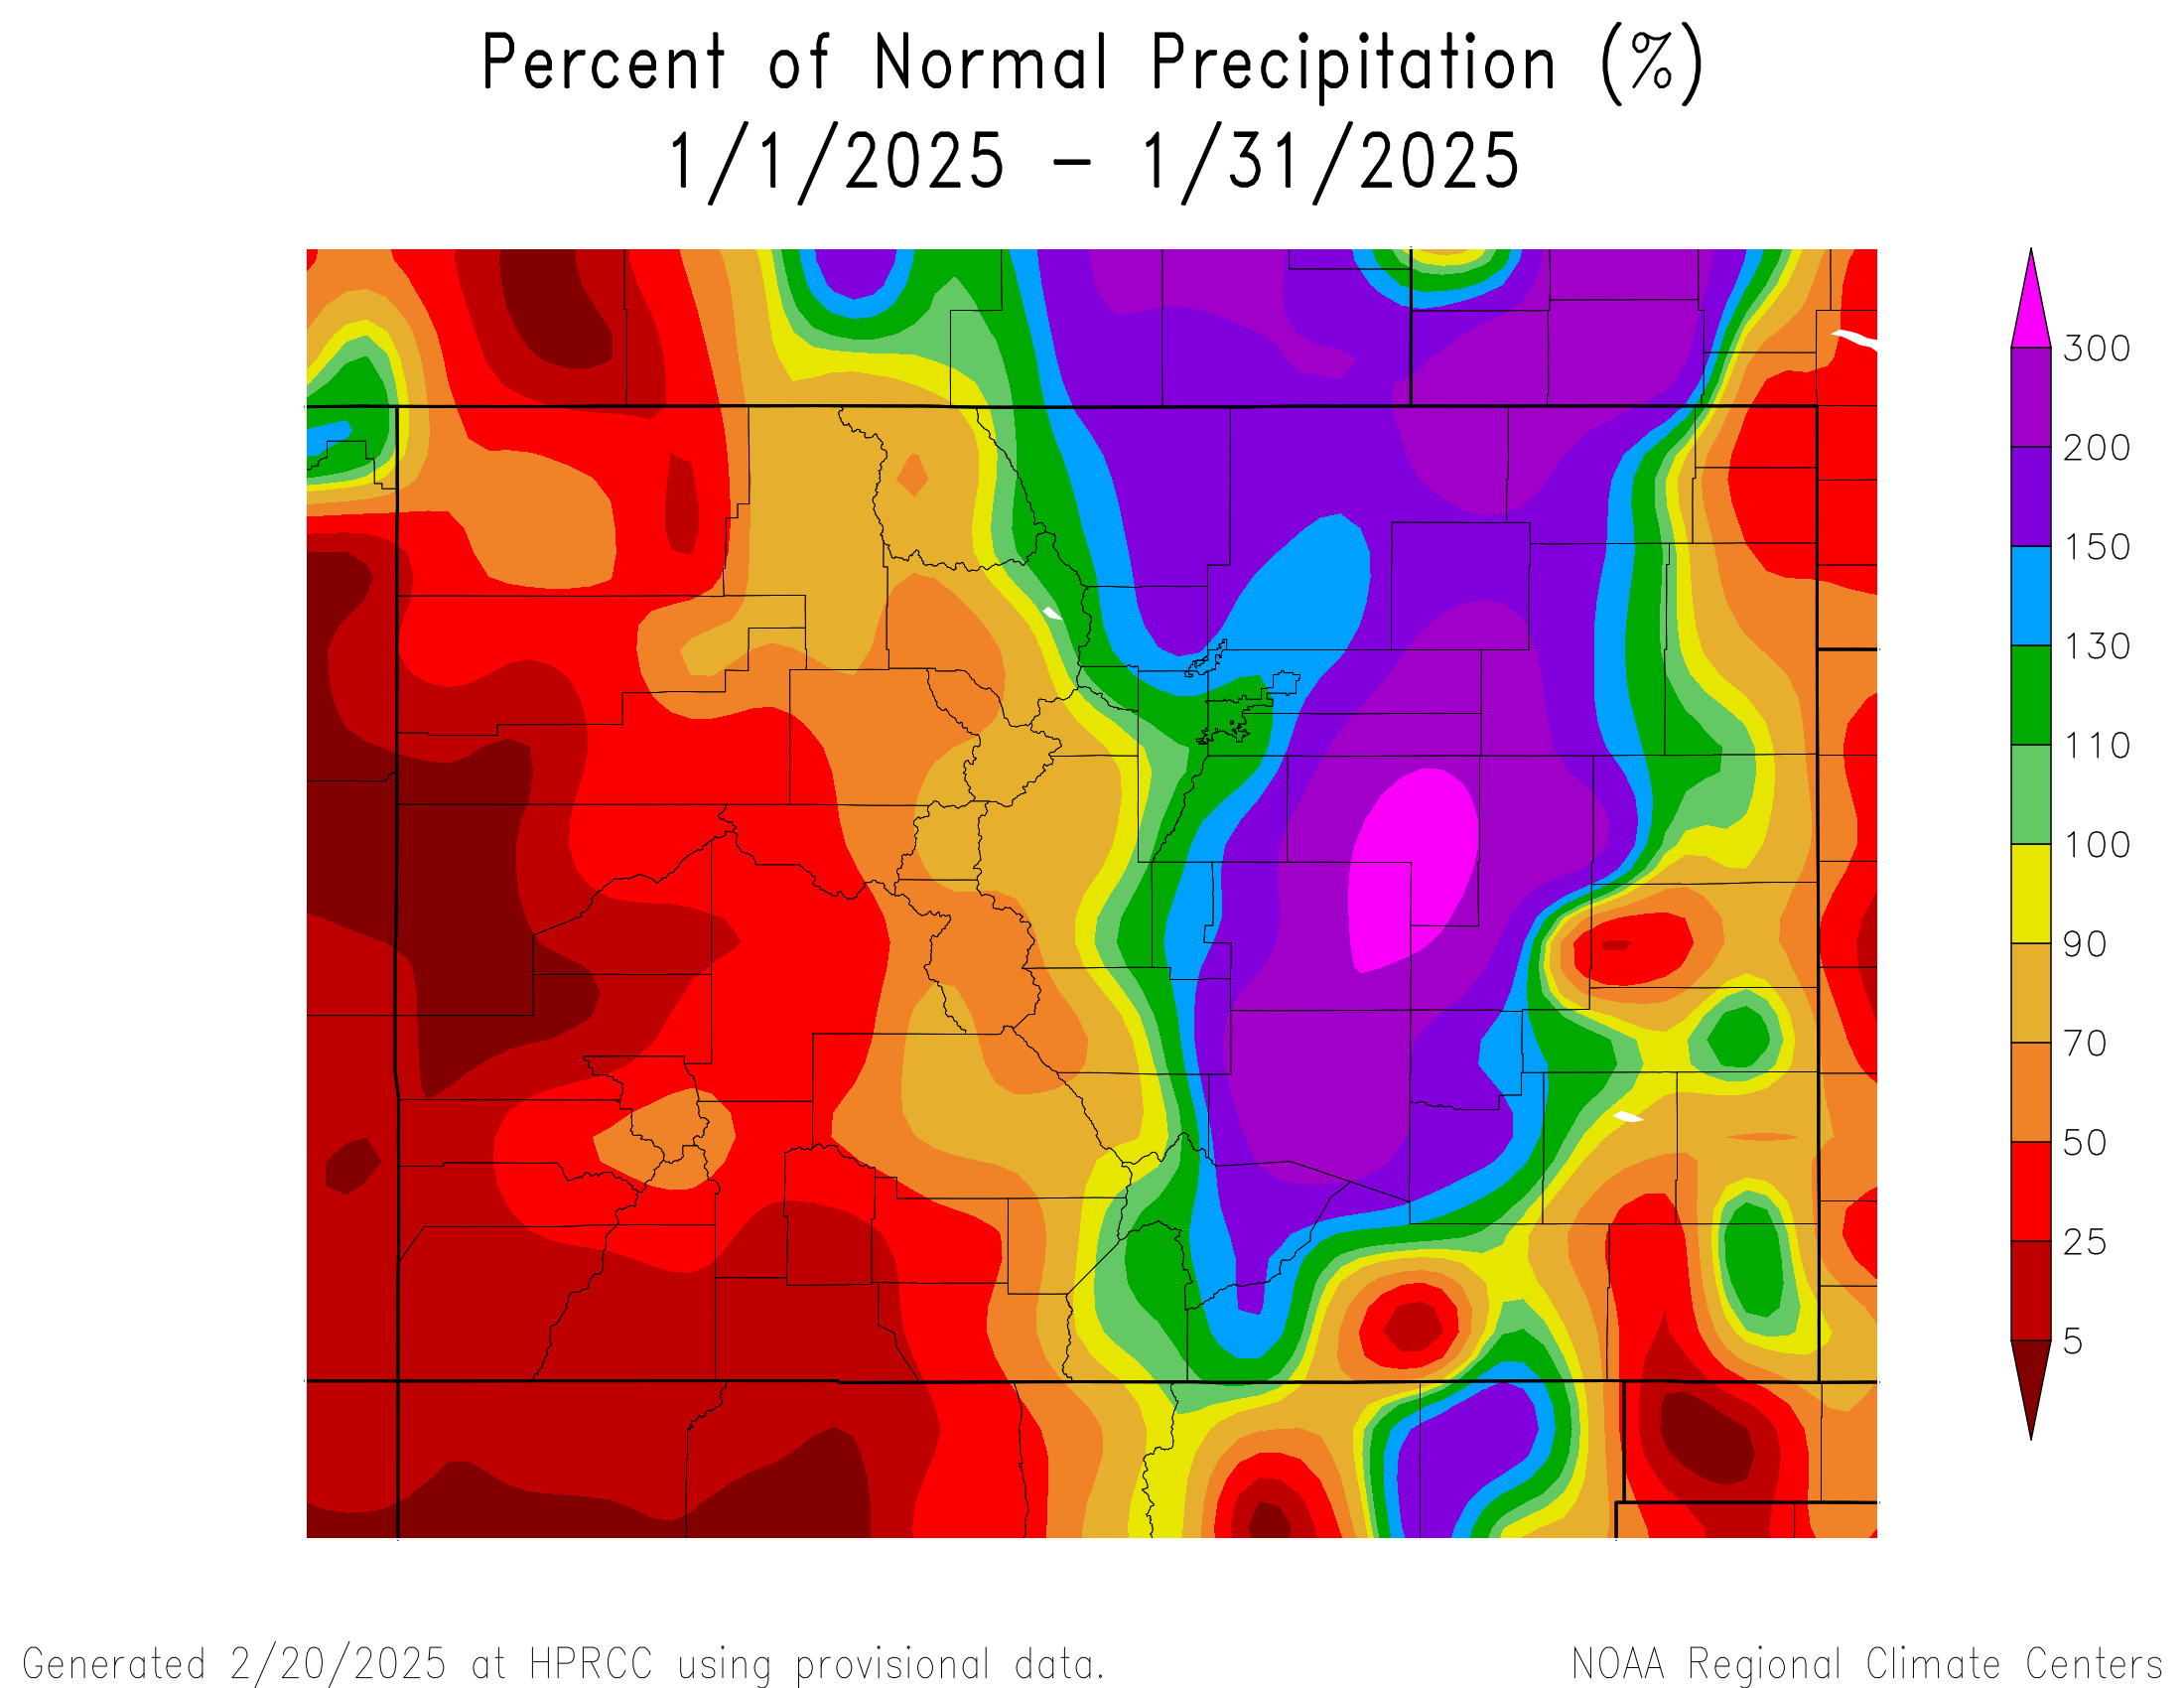
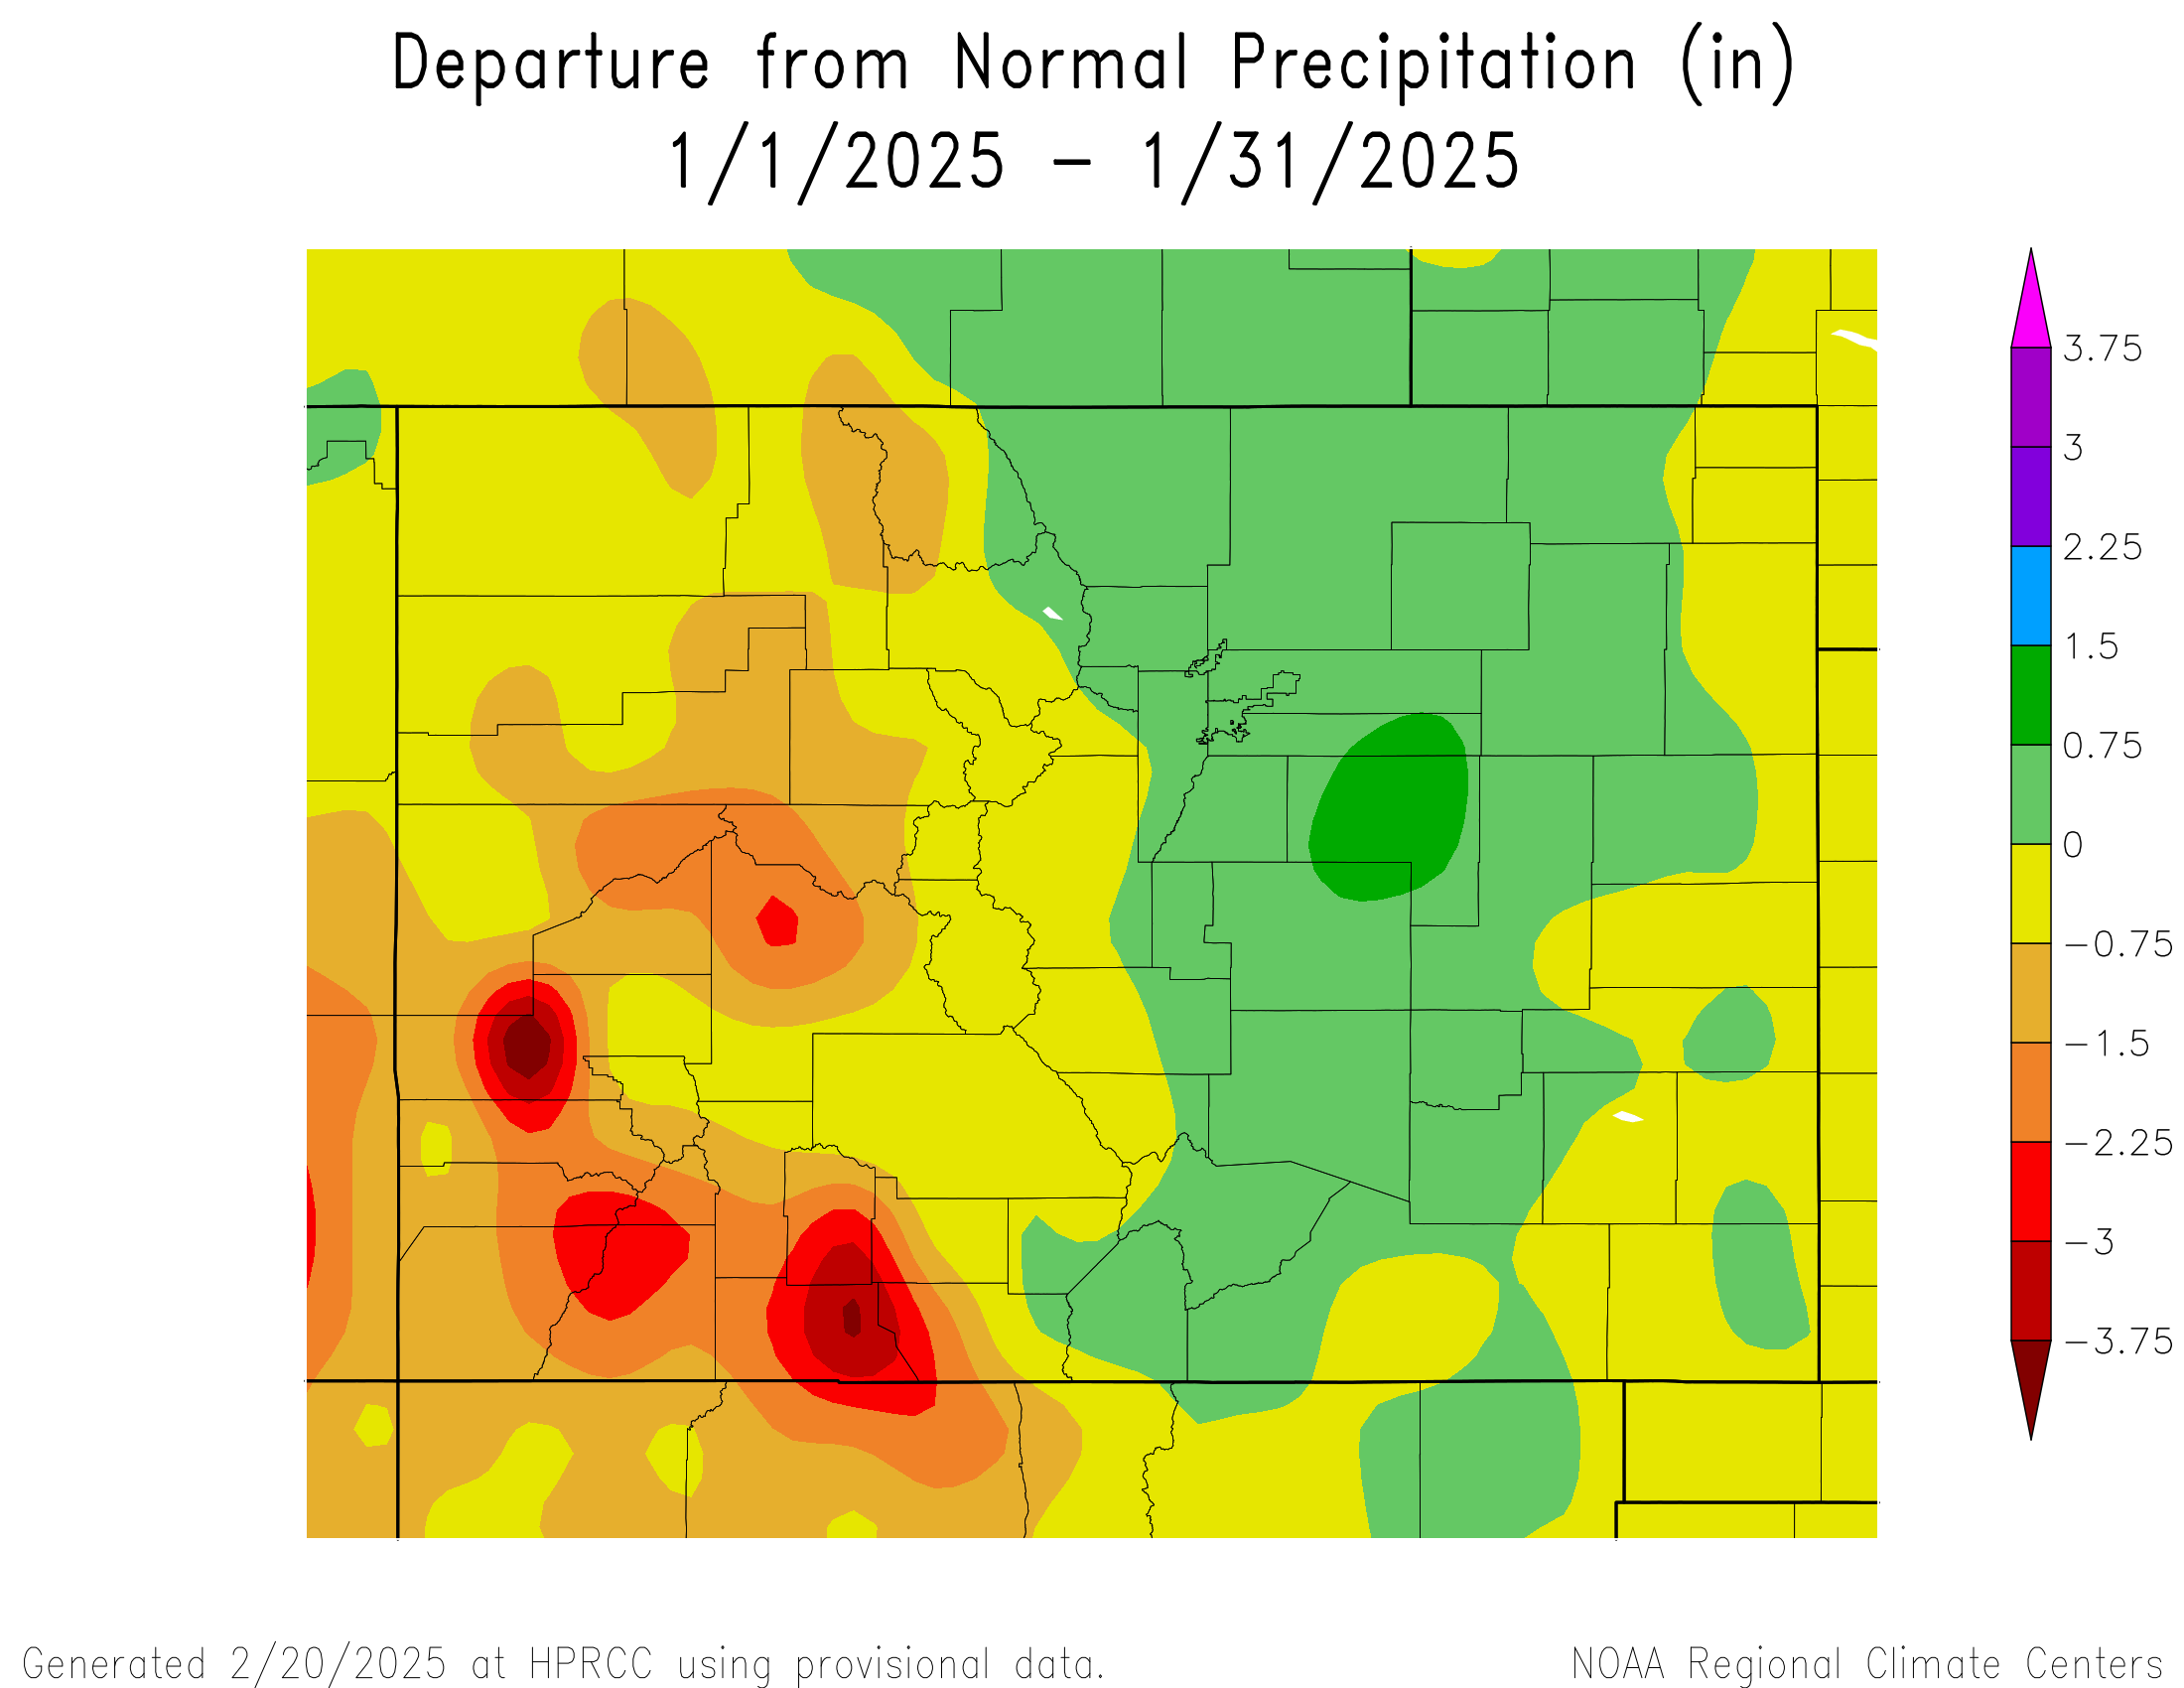
January Weather Summary: The temperature pendulum swung in the opposite direction for the first month of 2025. January was significantly colder-than-average in the central mountains, including San Juan County. And while the central-eastern mountains saw some nice snowfall, the western half of the state wallowed in dryness. Cold and dry is a typical La Niña pattern, which emerged in January, though was predicted to have little staying power.
Up at Swamp Angel, we saw two mild winter storms, depositing about 8” of snow depth each. It snowed thirteen days of the month, with liquid precipitation totaling 2.4” (62 mm), 116 mm is average, a disappointing 53% of average for January. At this point in the year, we still had hopes of recovering to near-normal, but two months of 50% of average precipitation is tough. Average monthly temperature was 10.9° F (-11.7° C).
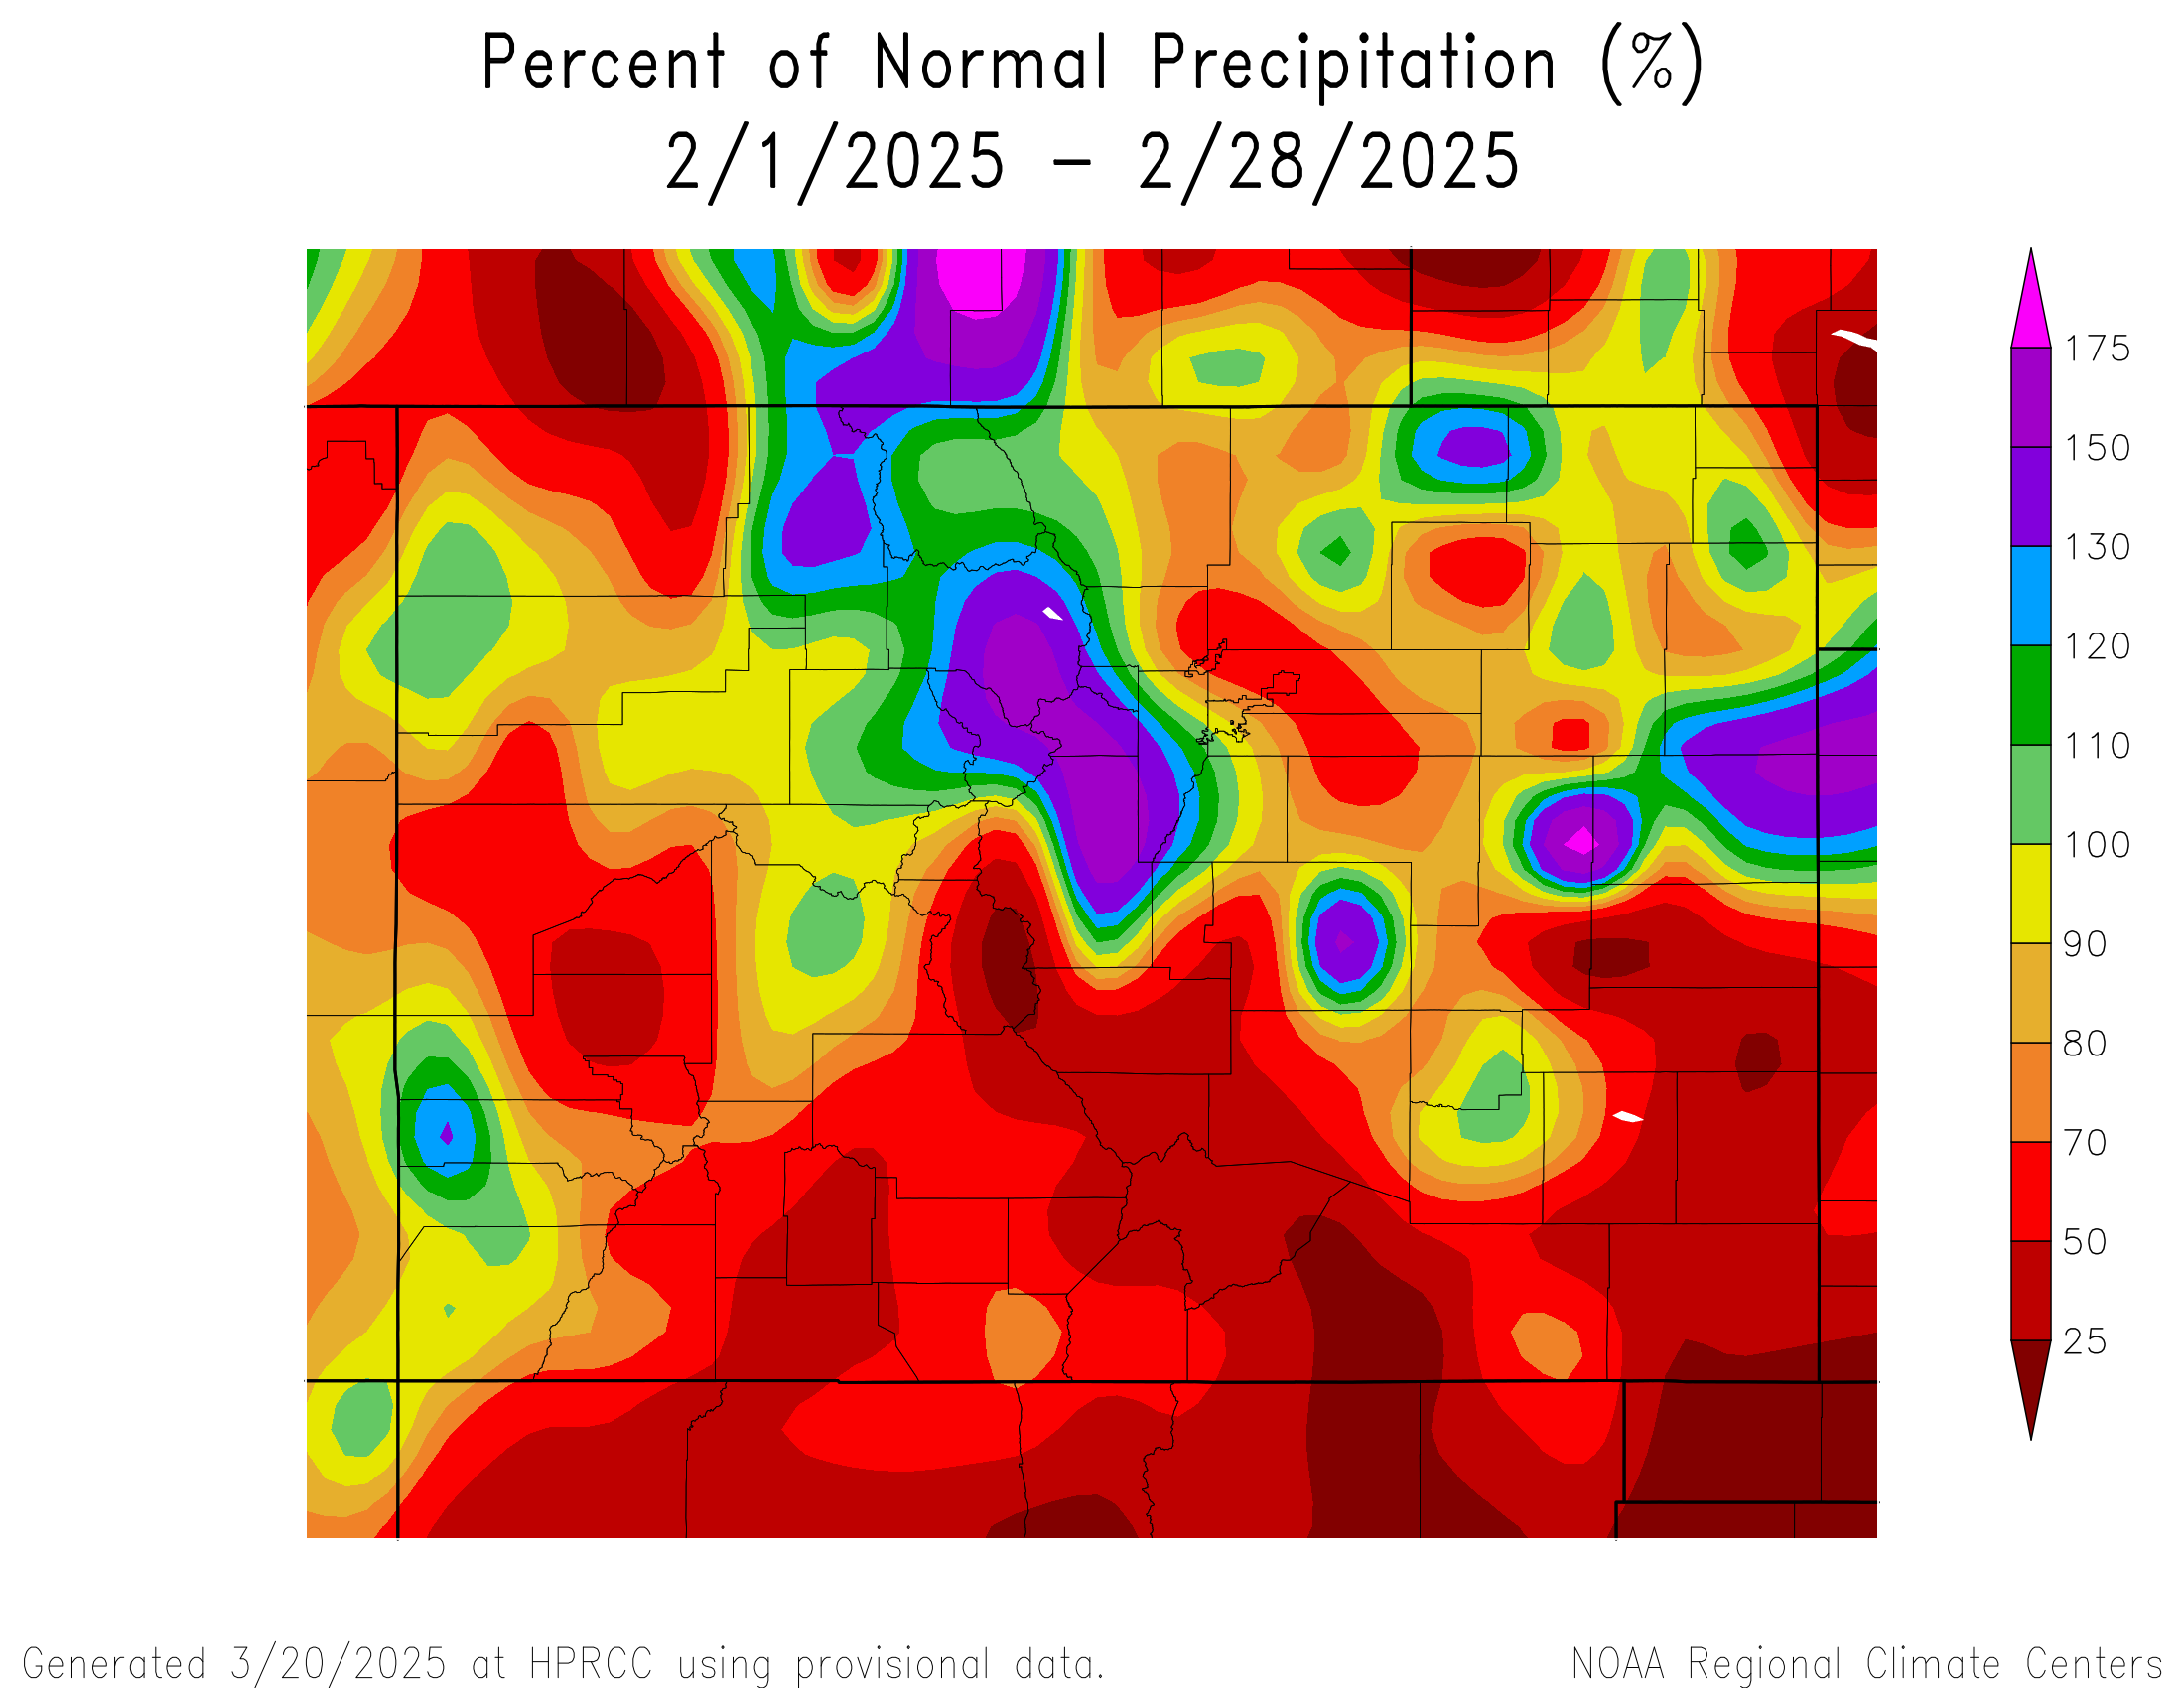
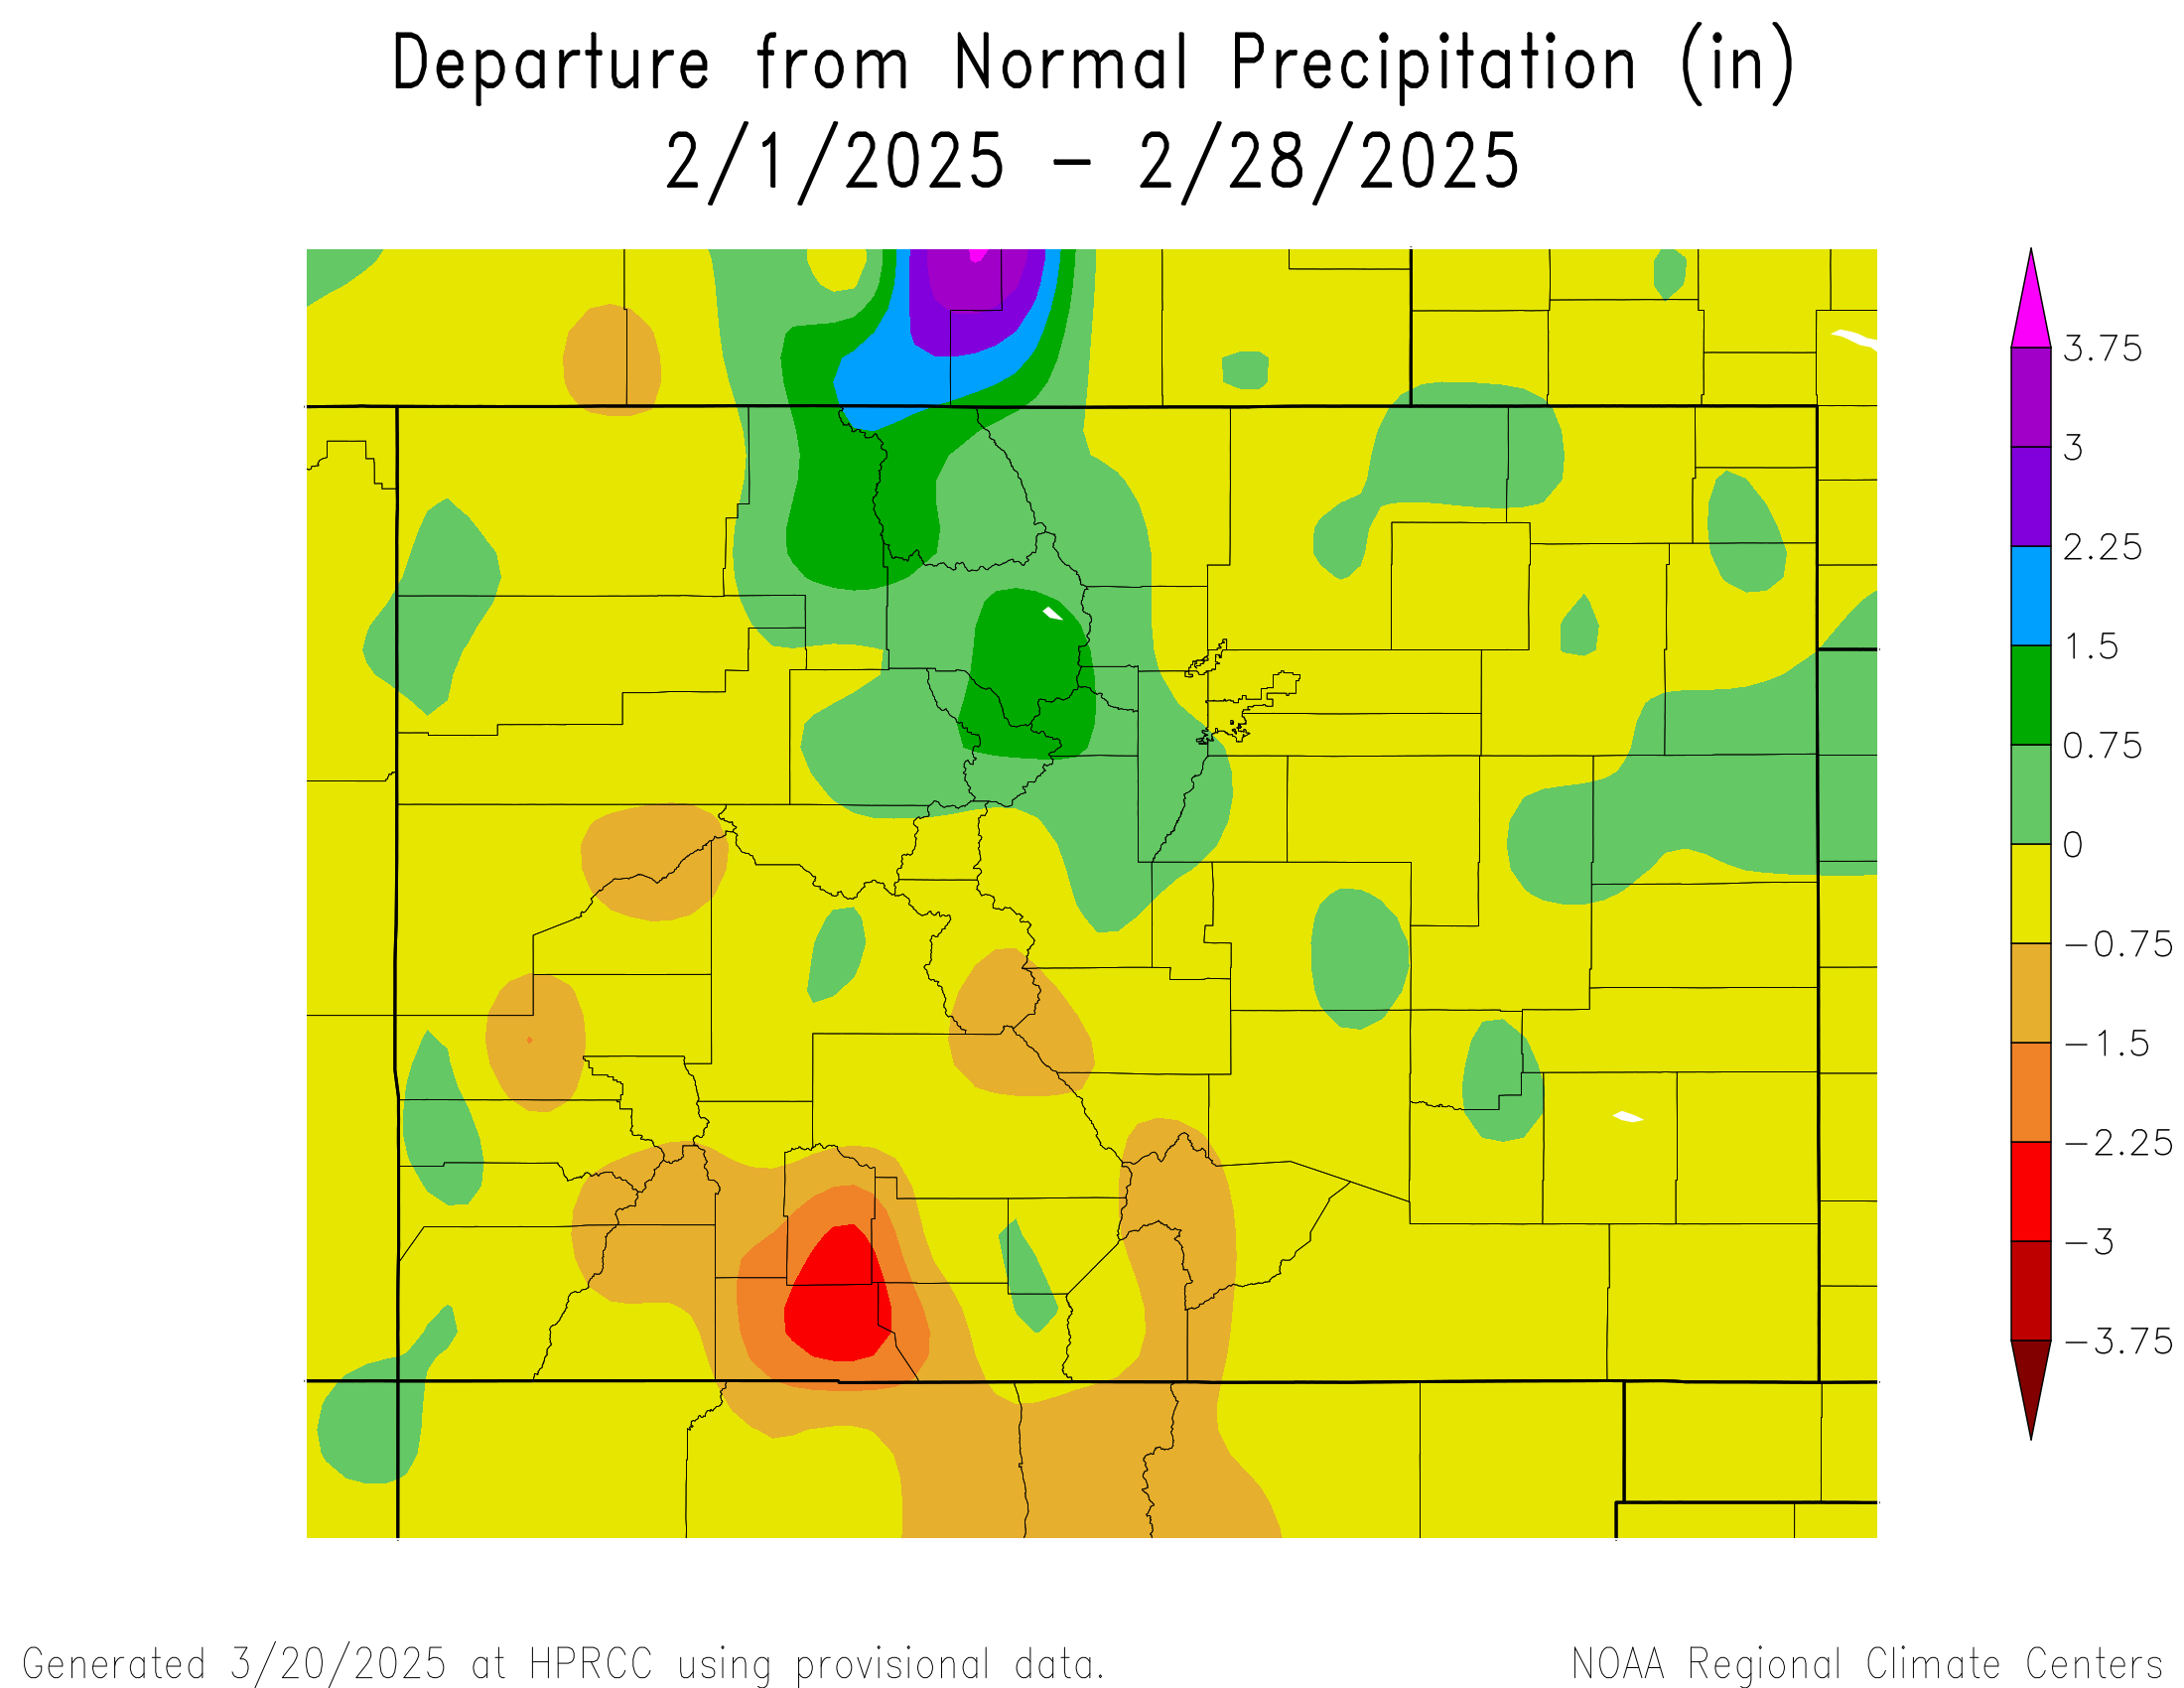
February Weather Summary: The divide between the northern and southern mountain ranges widened in February. The northern mountains experienced above average precipitation and ended the month near-normal. However, parts of the southern mountains saw only 50% of precipitation and further south, the numbers were starker. The western half of Colorado saw warmer-than-average temperatures, and the eastern half colder-than-average, split nearly right down the middle.
We had two winter storms in February. Notably, Valentine’s Day delivered and dropped 28” of snow depth at Swamp Angel Study Plot. Snowy winter weather was punctuated by spring-like conditions and ‘mud season’ in town. However, with only nine days and 3.4” (86 mm) of precipitation, we ended February with only about 76% of normal (4.4” is average) precipitation. Average monthly temperature was 21.9° F (-5.6 C).
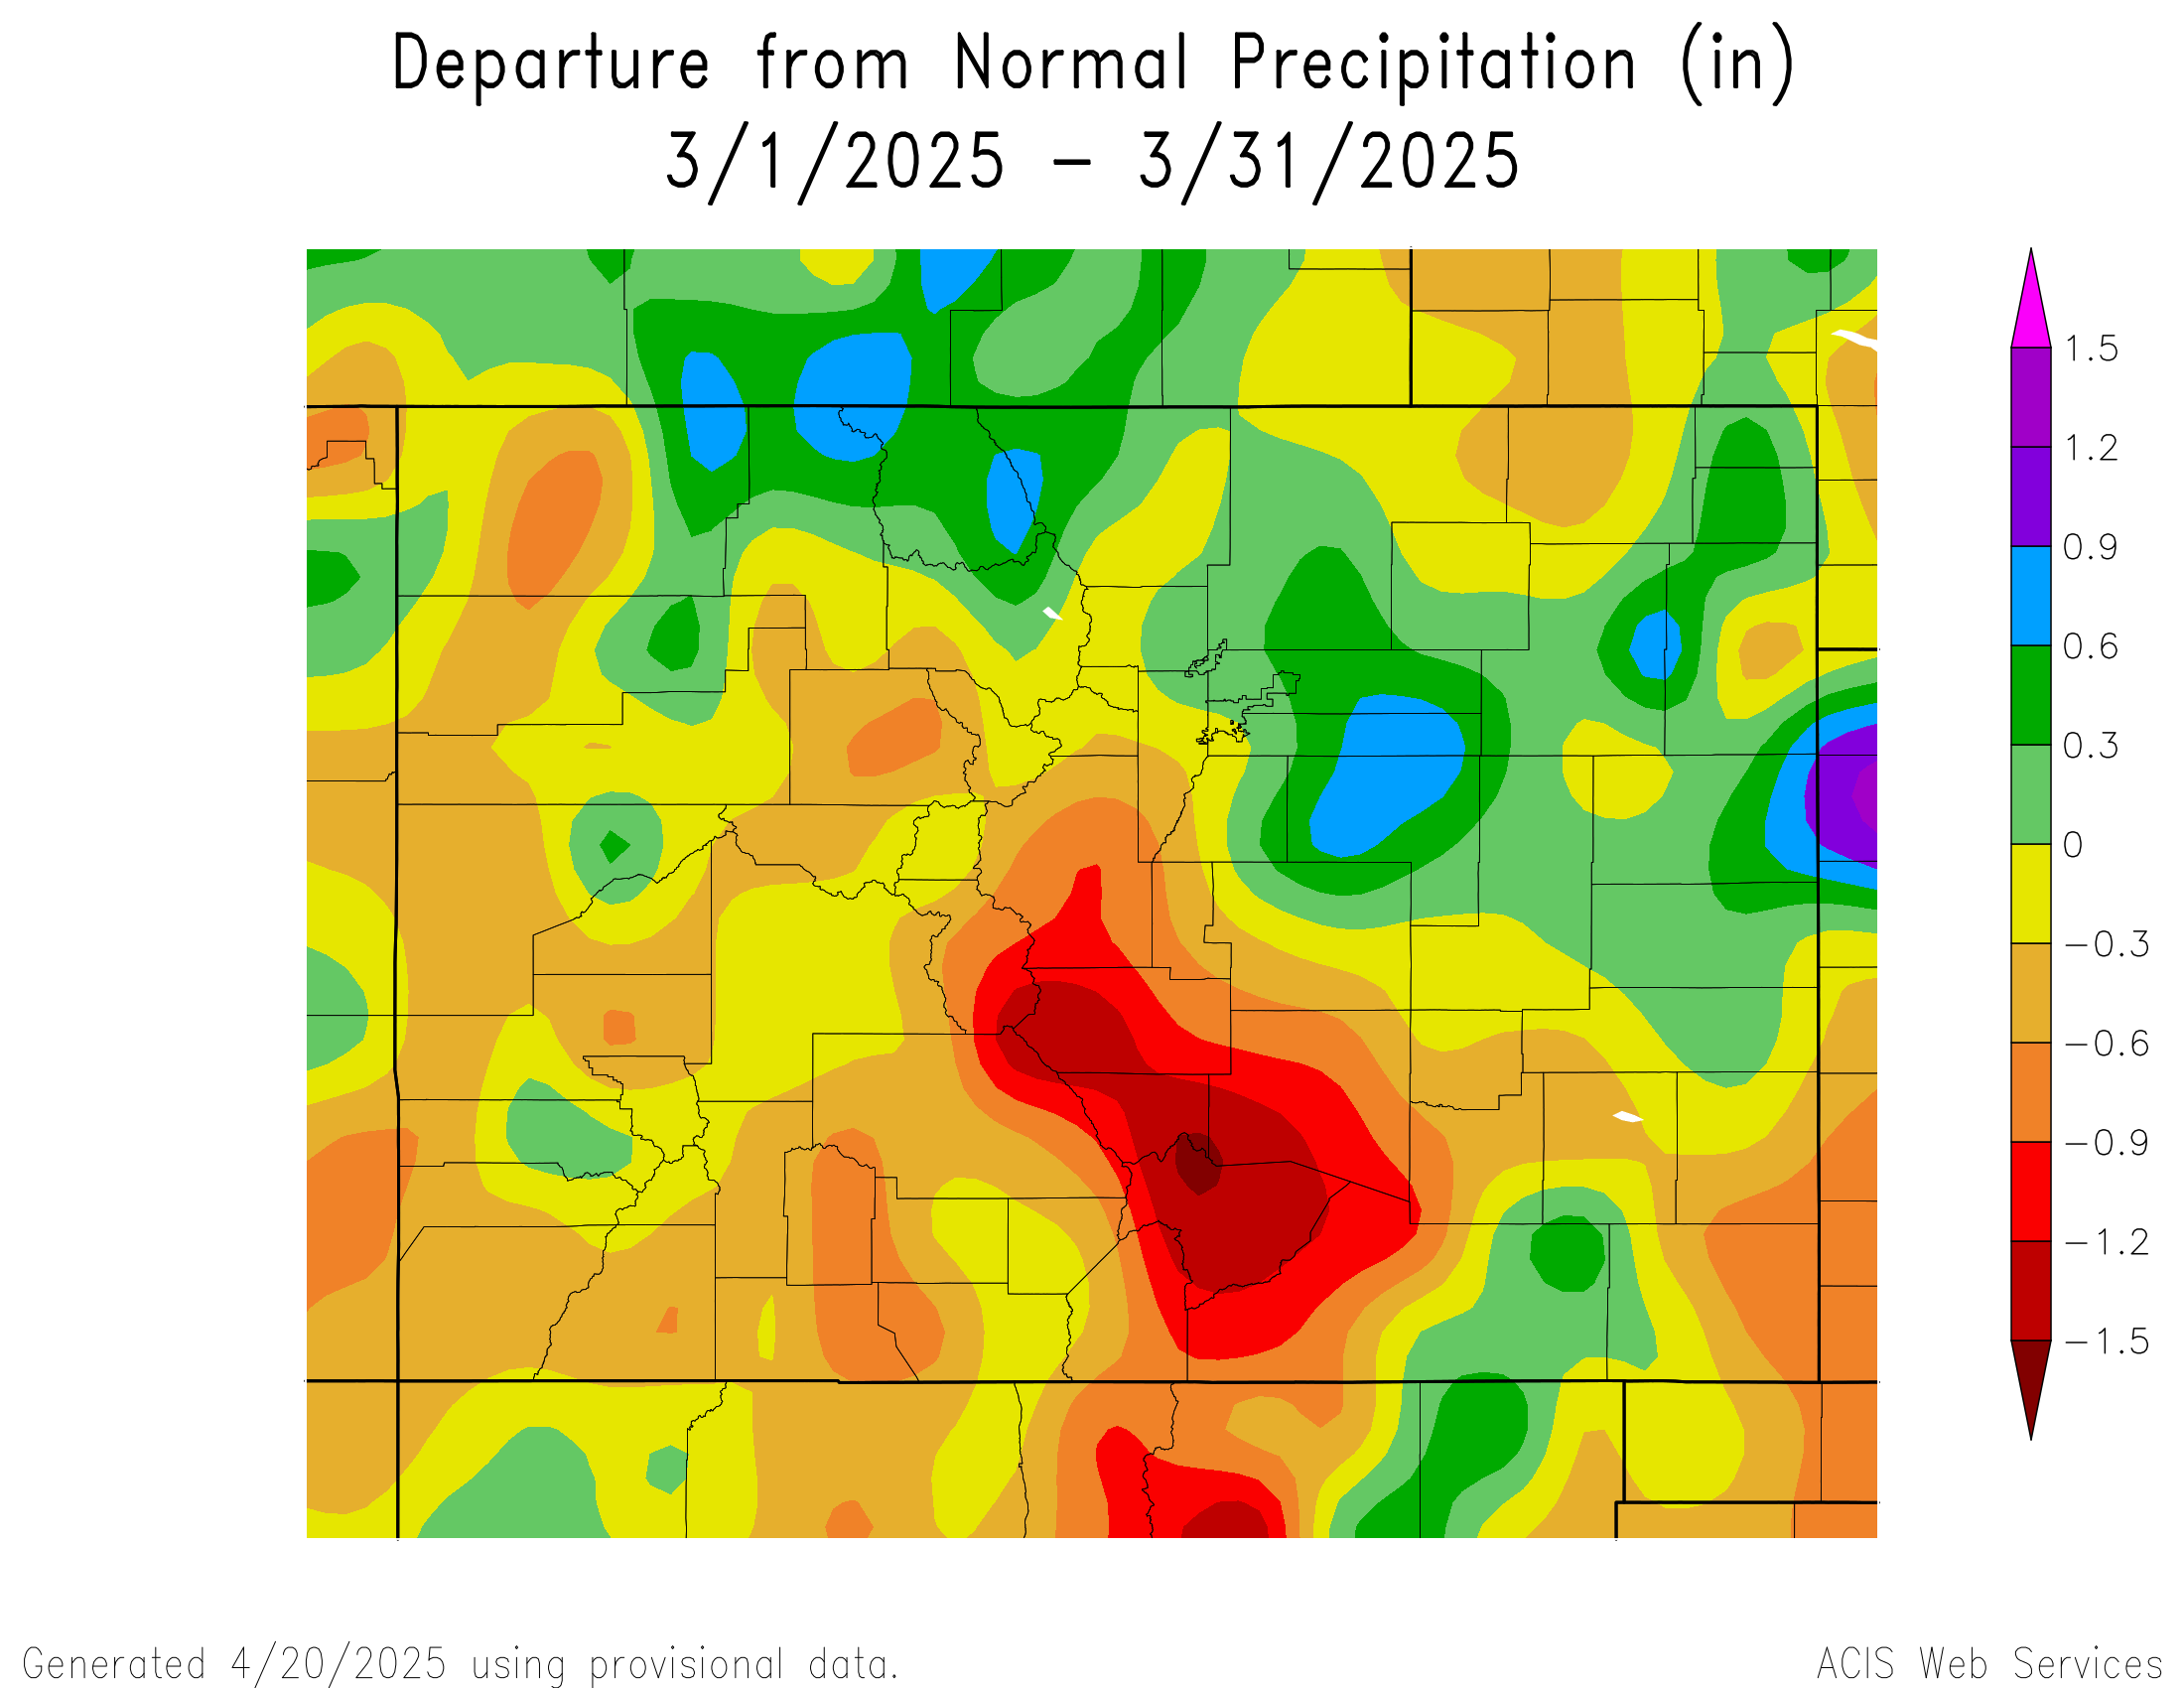
March Weather Summary: Colorado had one of the top ten warmest Marches on record. Most of the state saw near average precipitation, which was good for the northern mountains to hold their SWE, but not enough for the southern mountains to make up lost ground. Notably, the San Juan and Upper Rio Grande basins reported 63% and 56% of normal SWE, and the warm temperatures were hastening the decline.
Right around our first CODOS tour was when we at CSAS started to muse about the visual lack of low elevation snow. As many of you know, the SNOTEL network has limitations, one of them being that most are located with an elevation band around 9-10,000 feet. A West-Wide SWE report from INSTAAR at the University of Boulder displayed much lower basin-wide SWE than the SNOTEL network when taking into account the lack of snow at lower elevations.
On March 1st, we had 17.2” (437 mm) cumulative precipitation for the water year which was about 81% of the median value for our period of record (2002-2024). We had a slightly above average March with four winter storms, fifteen days and 5.4” (137 mm (116 mm average)) of precipitation, 118% of average. Monthly average temperature at our study plots was 22.5° F (-5.3 C). Globally, March tied with 2024 for the warmest March on record – the warmest March since 1850.
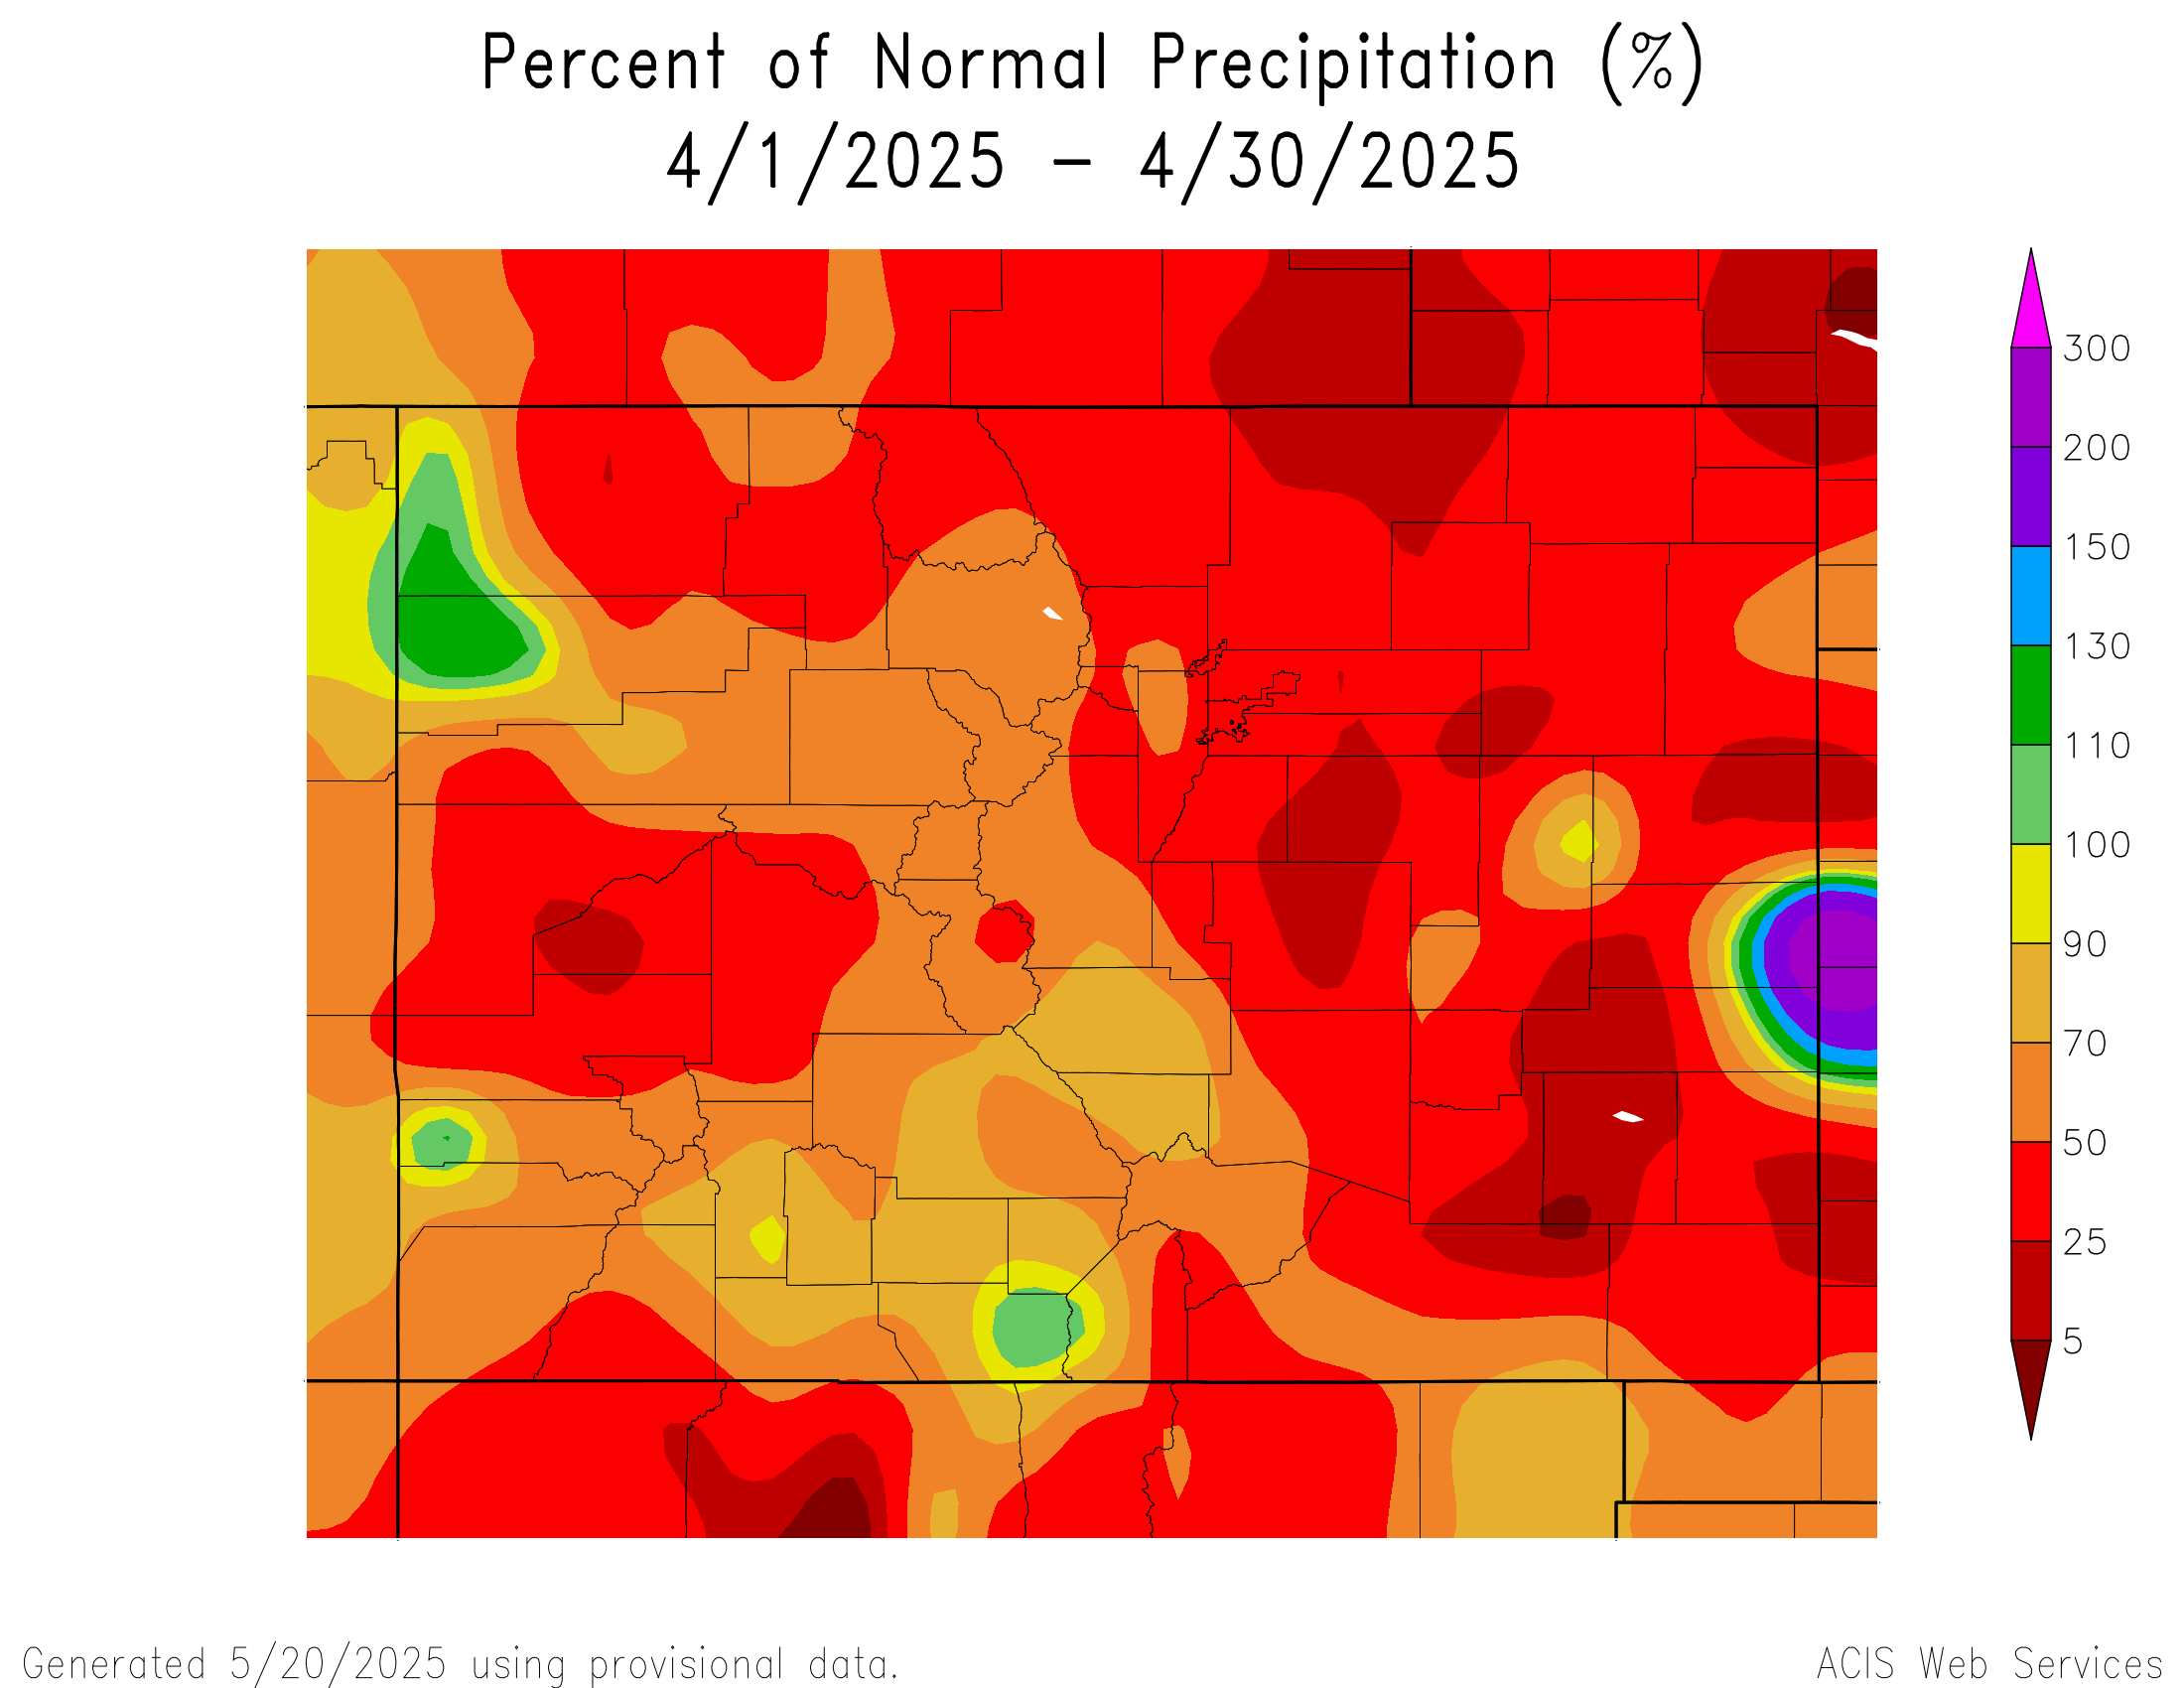
April Weather Summary: April precipitation was below normal, and in certain places much below, only 5-25% of normal. At the end of April, statewide median SWE was just 58% percent of normal. As you might imagine, streamflow forecasts were also quite low coming into the runoff season. The current thinking is a probability of dry weather through July. Hopefully, summer precipitation will pick up in the late summer and fall. Temps in April were near-normal.
April was very springy in Silverton, despite two winter storms. Warm, sunny weather prevailed, only briefly interrupted by the storms. Swamp Angel recorded a total of 12 days and 69 mm total of precipitation, (109 mm average) so just 63% of average for the month. The average temperature was 28.8° F (-1.8 C).
May Weather Summary: Only two storms documented in May, the first May 4-5 and second May 18-19. It was the second storm that delivered a nice surprise snowstorm delivering 7” of snow and over 1” precipitation. Only two storms but they really helped slow snowmelt. The San Luis Valley and Front Range enjoyed a wetter May but western Colorado was dry.
June Weather Summary: In a nice deviation from the norm, the first half of June was very wet for all but the northwestern part of the state. The southwestern part of the state was at least 200% of normal precipitation. Conditions made for lush and green conditions. The last half of June was extremely dry in western Colorado, typically no better than 25% of normal. The exception was around the Front Range corridor and towards the northeast did they see better than average precipitation. Overall, mountain temperatures were warmer than average by a few degrees and slightly cooler towards eastern Colorado.
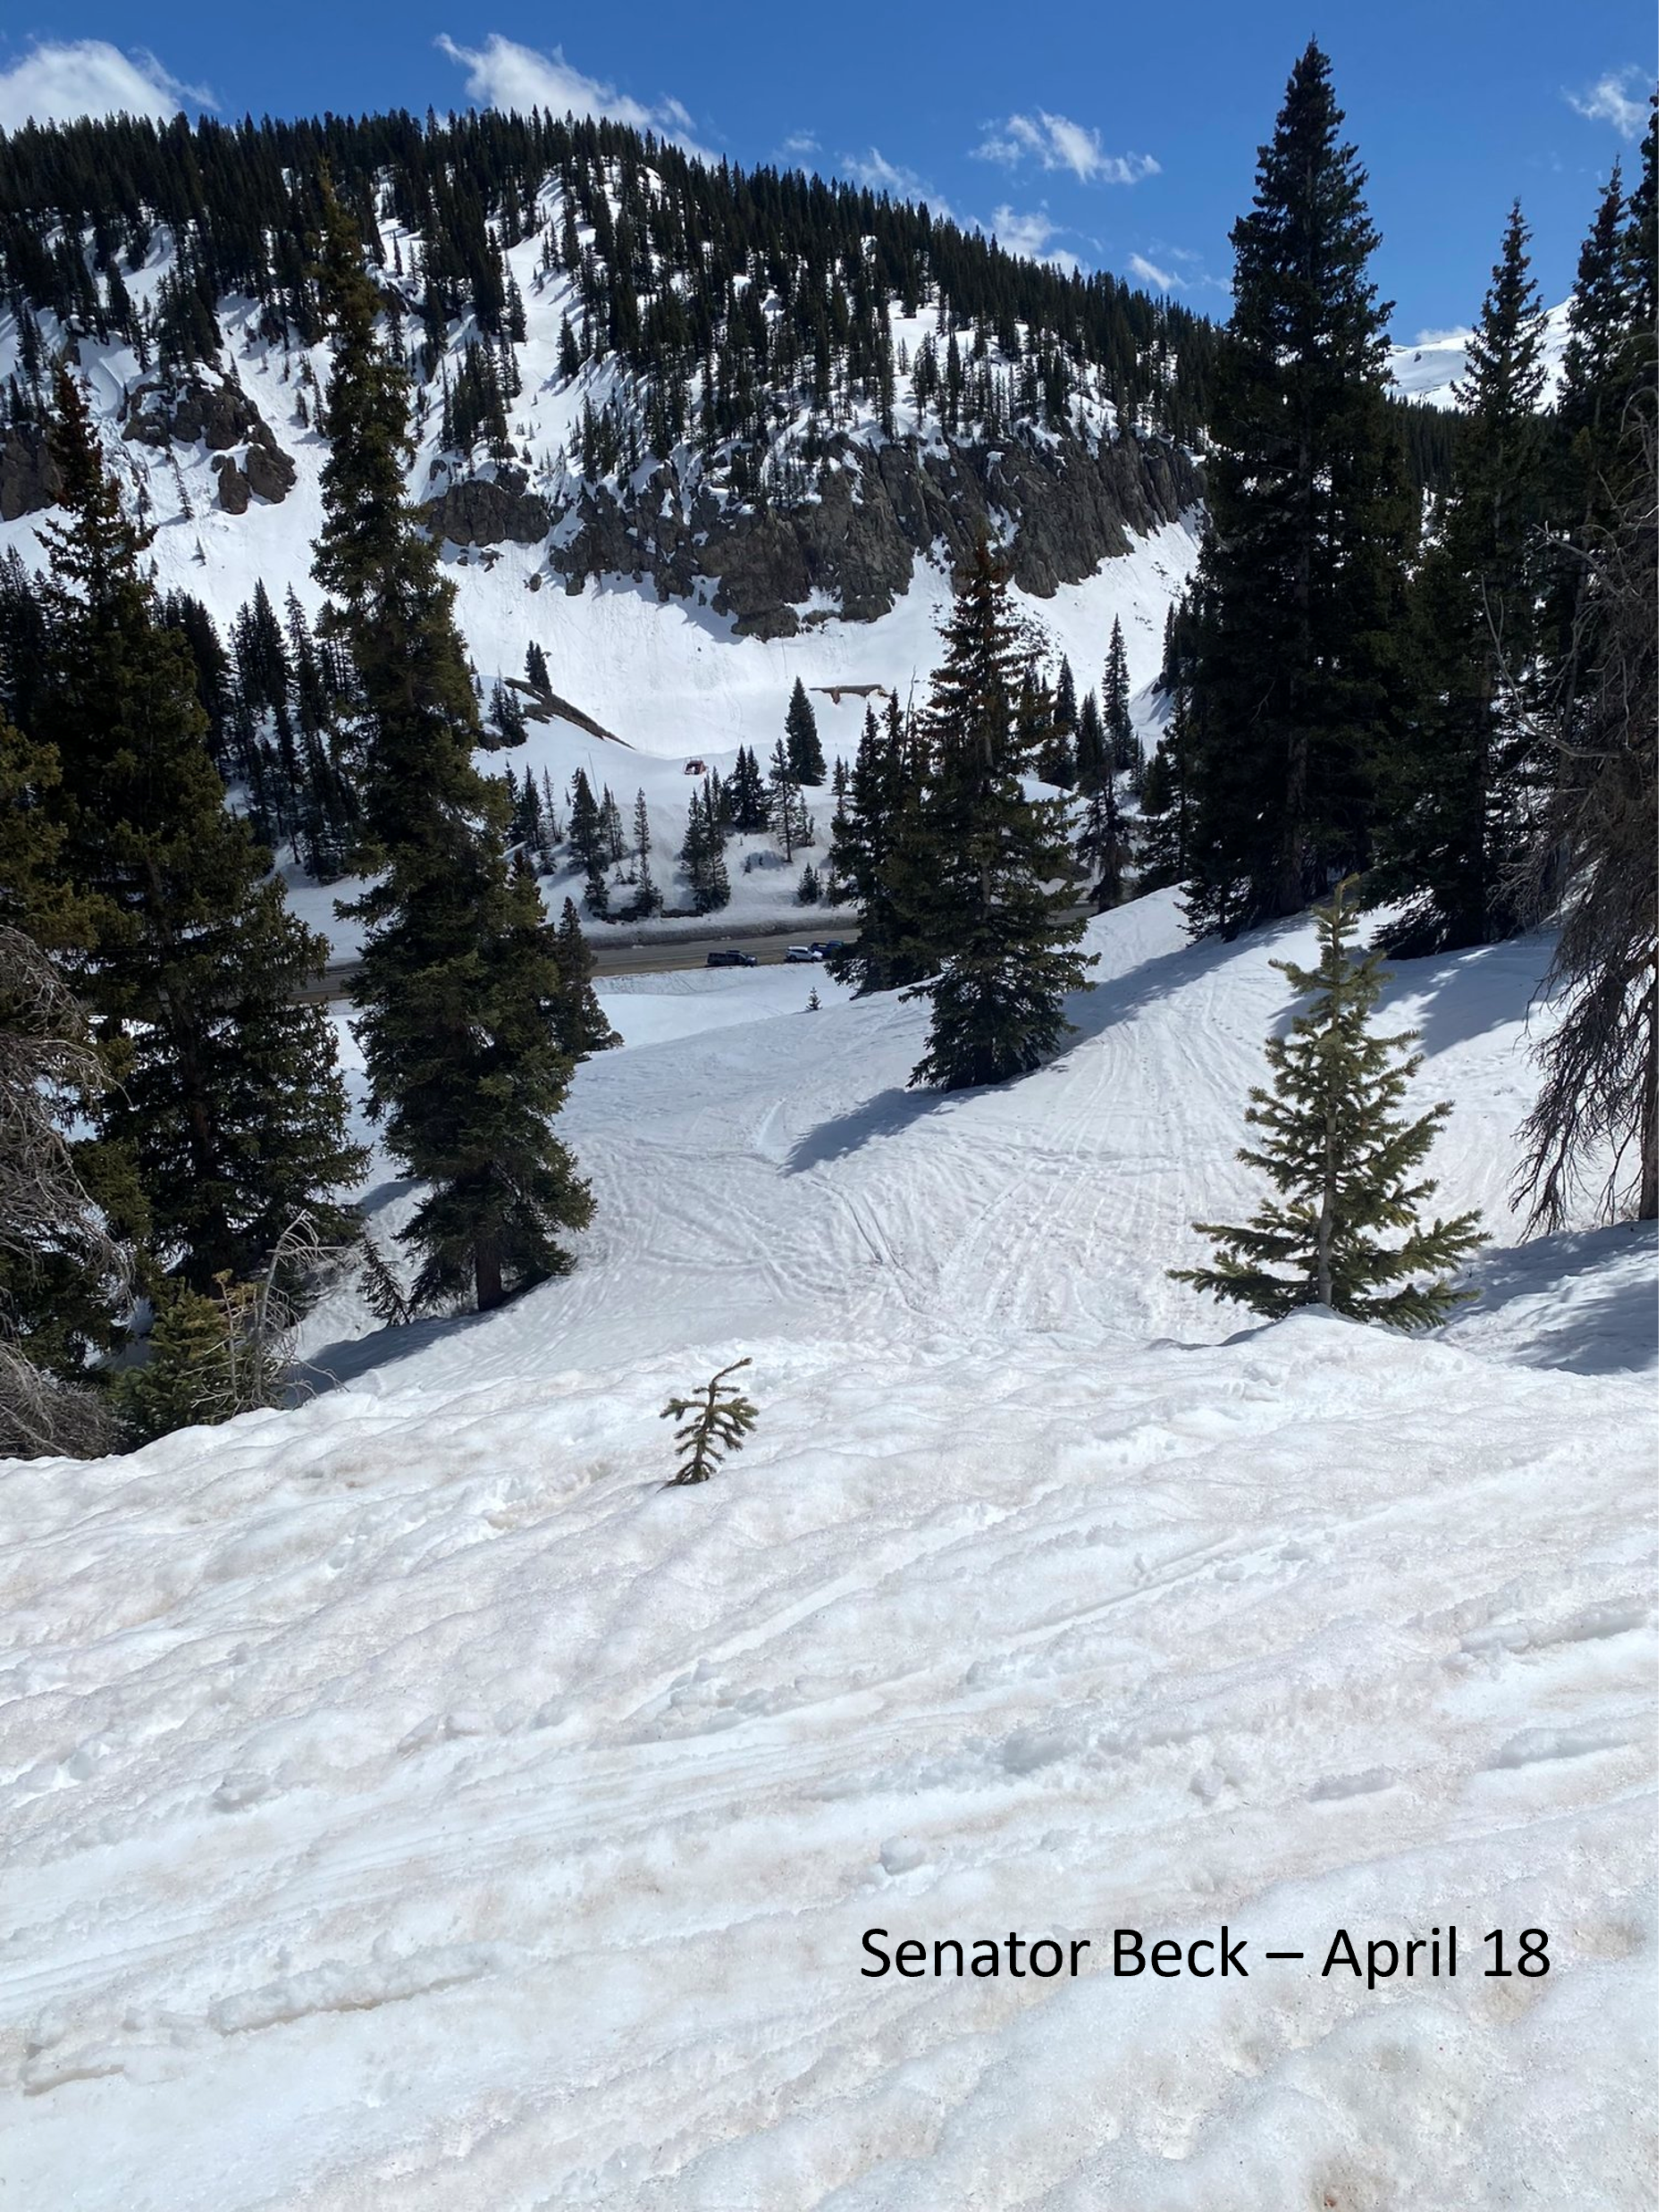
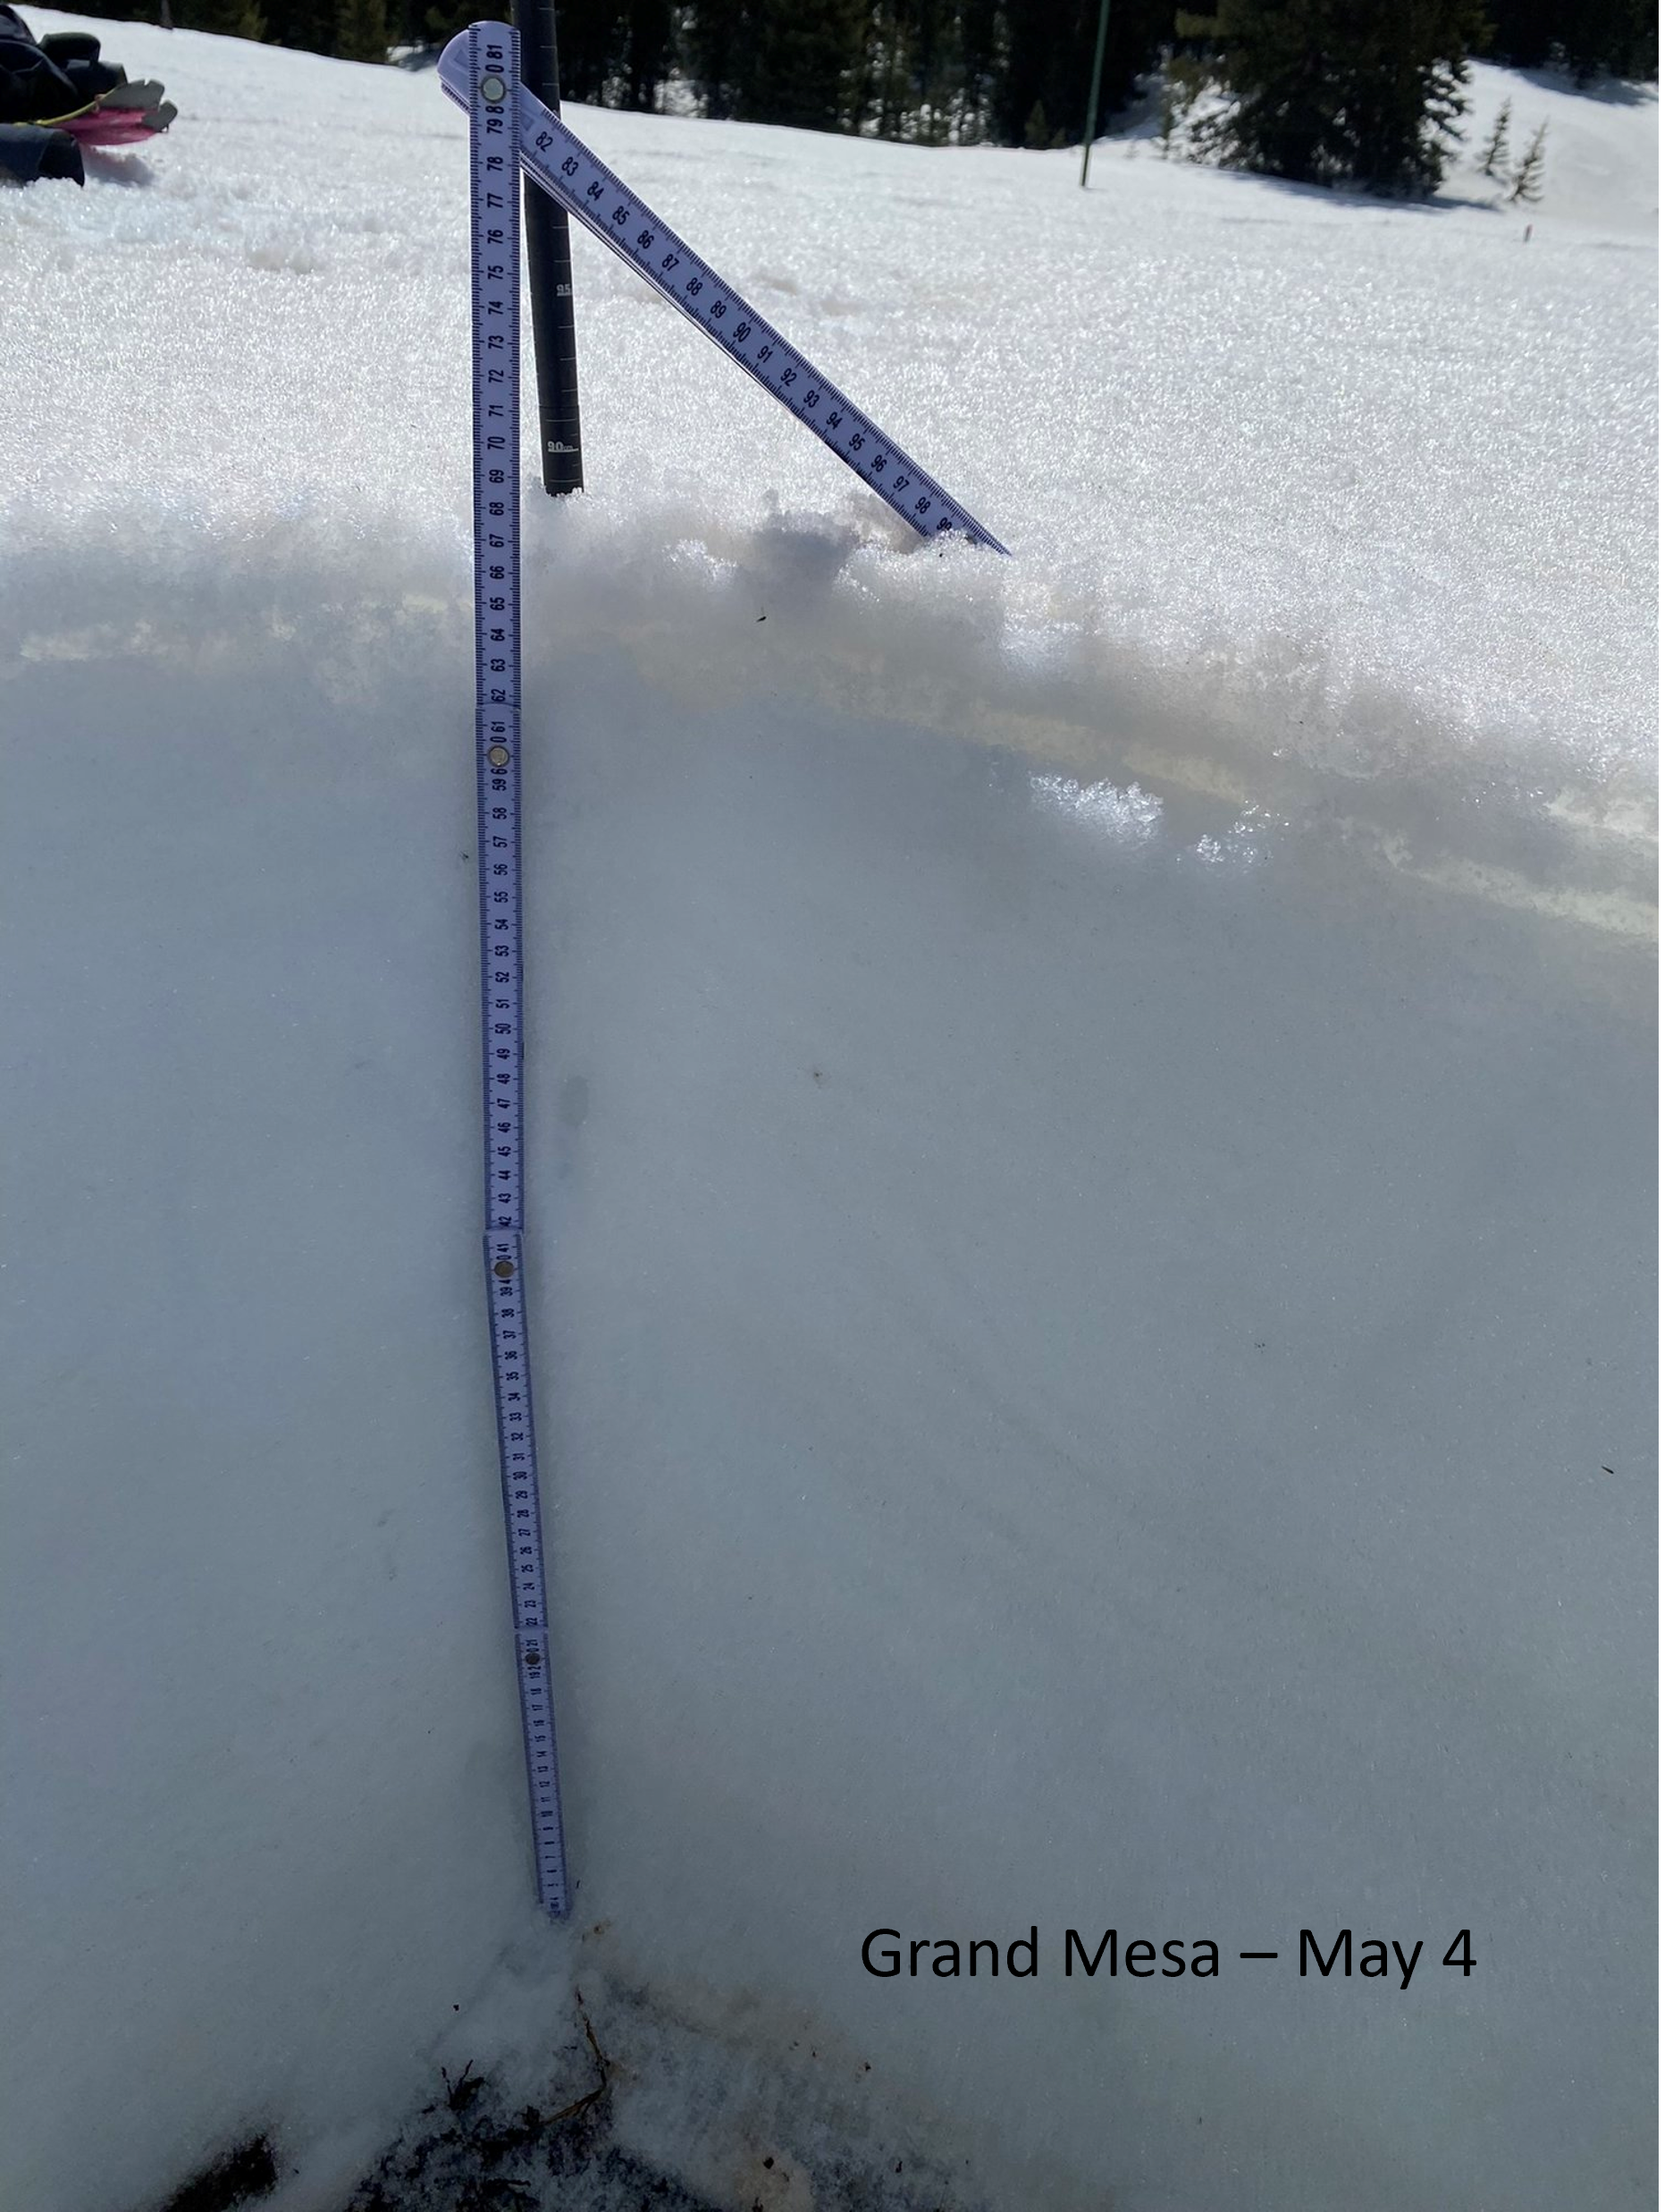
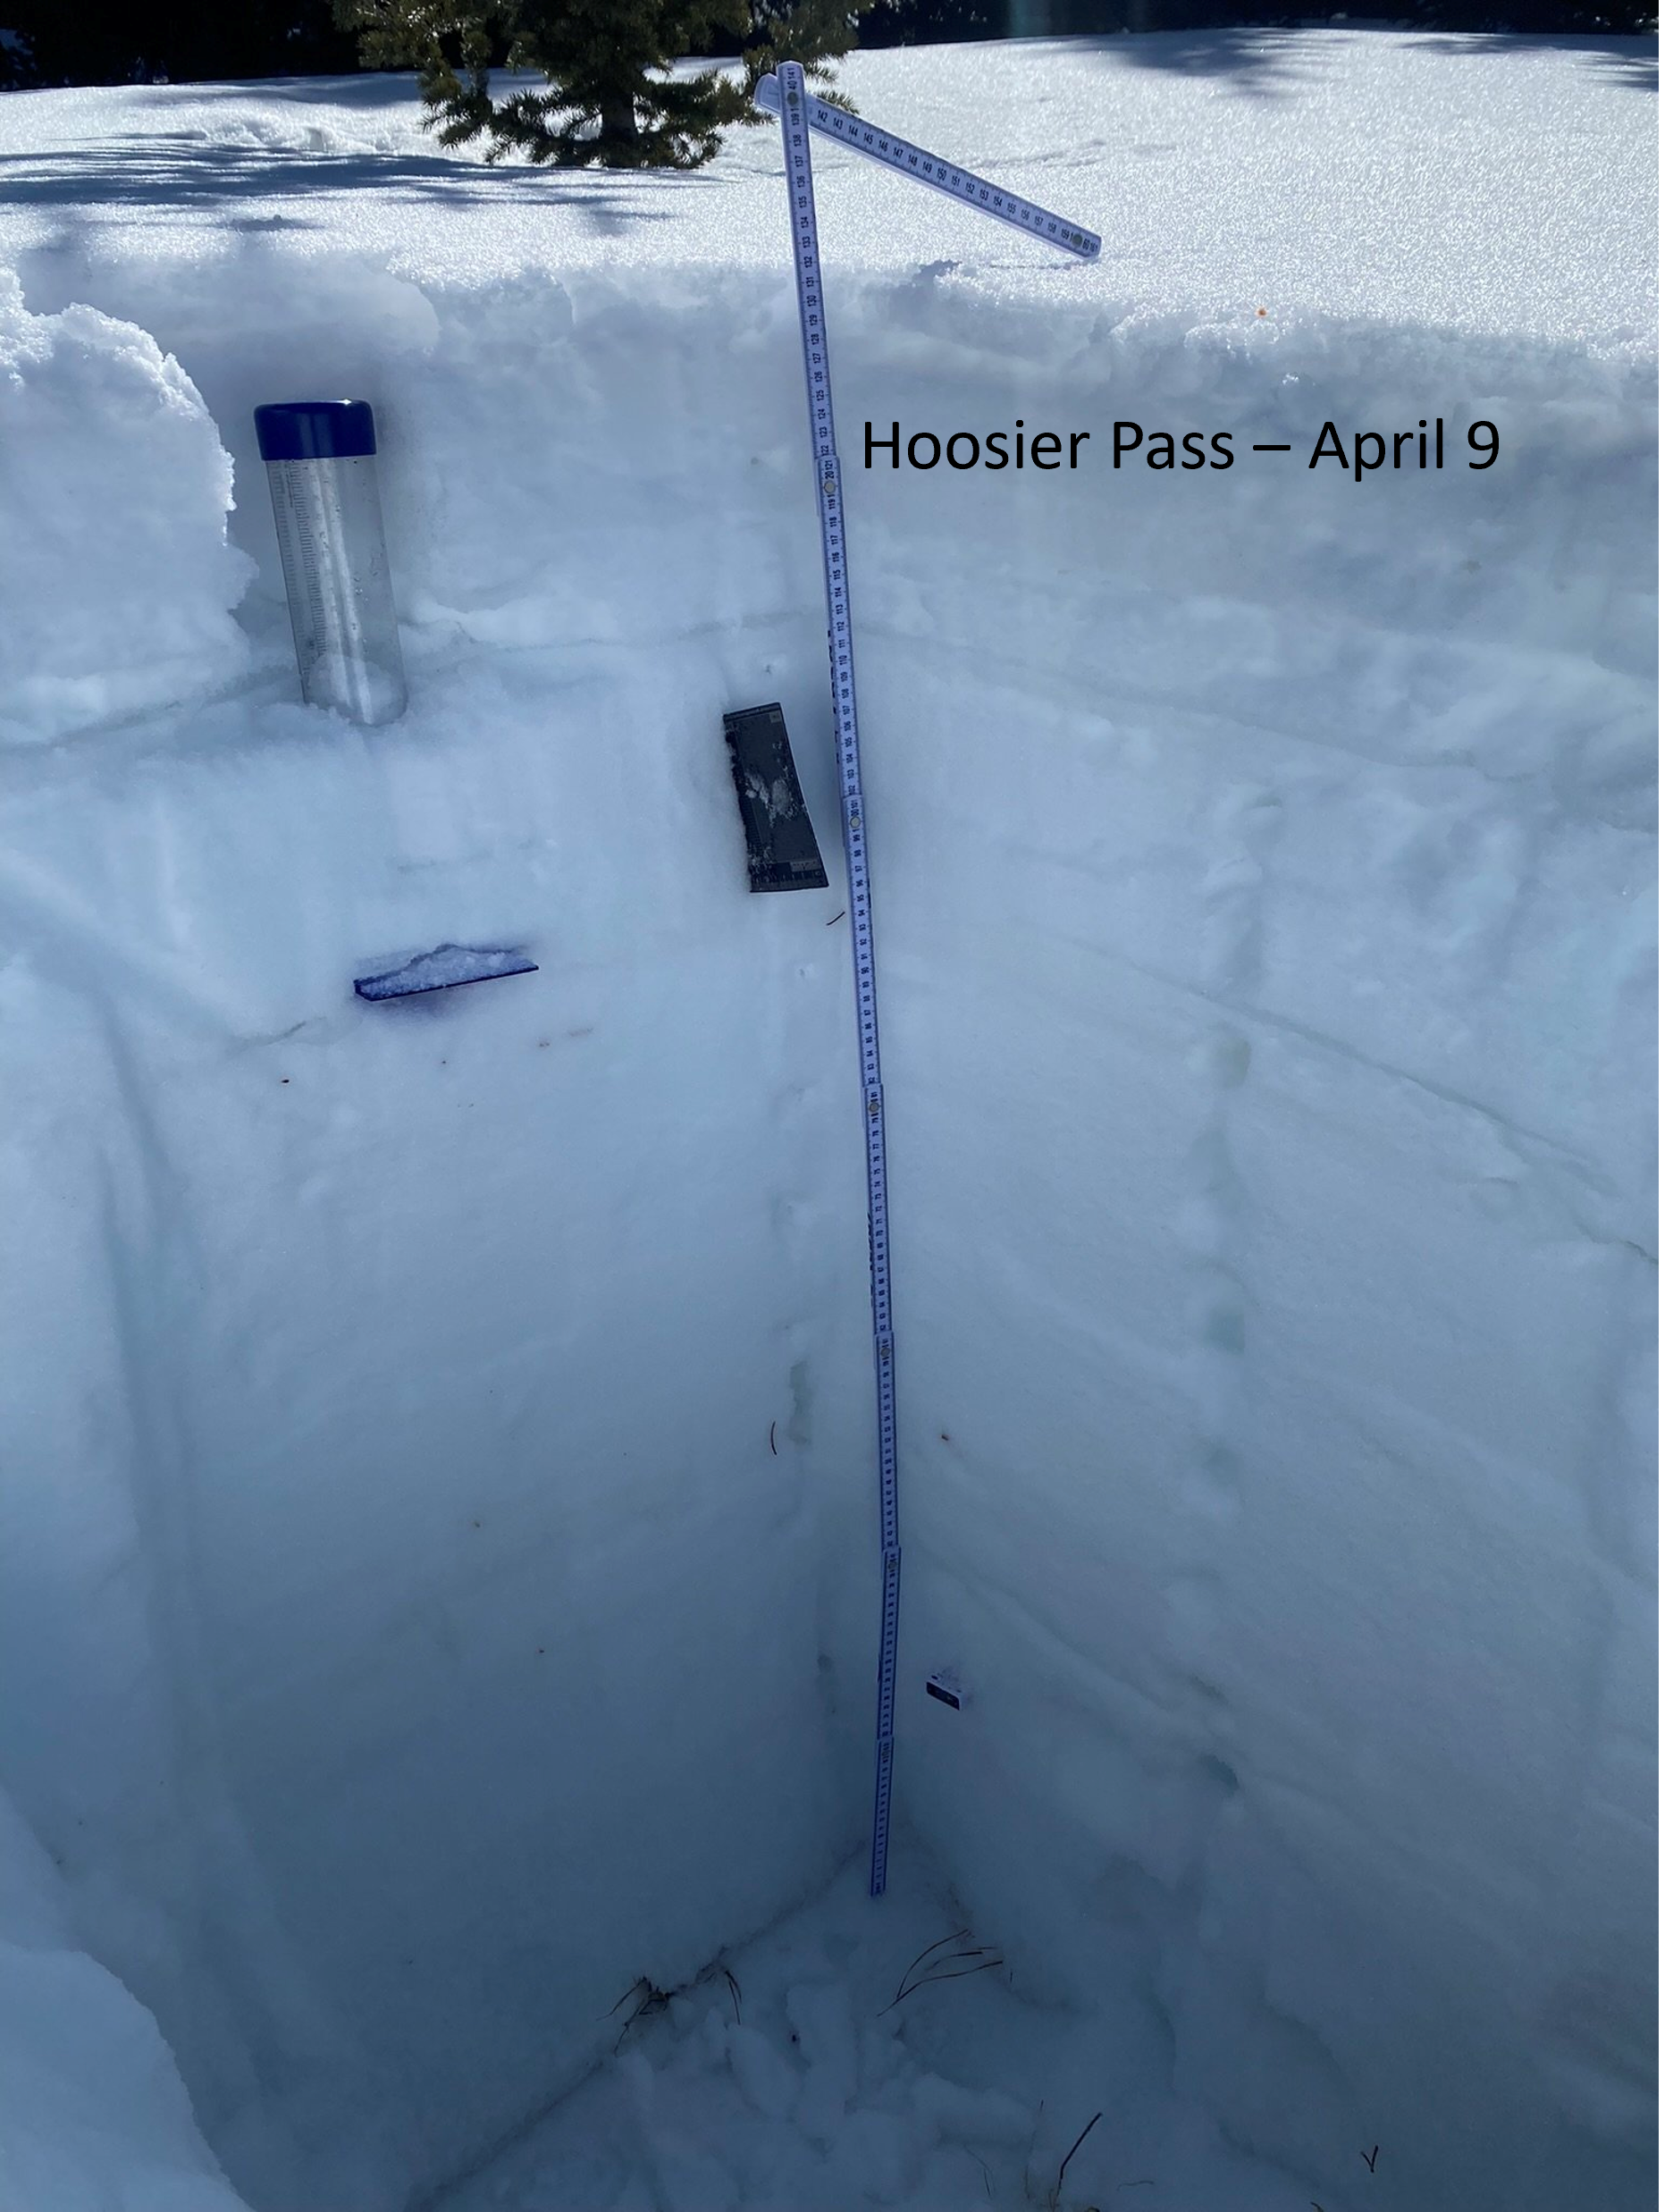
Below: Images to help illustrate WY2025 dust-on-snow conditions.


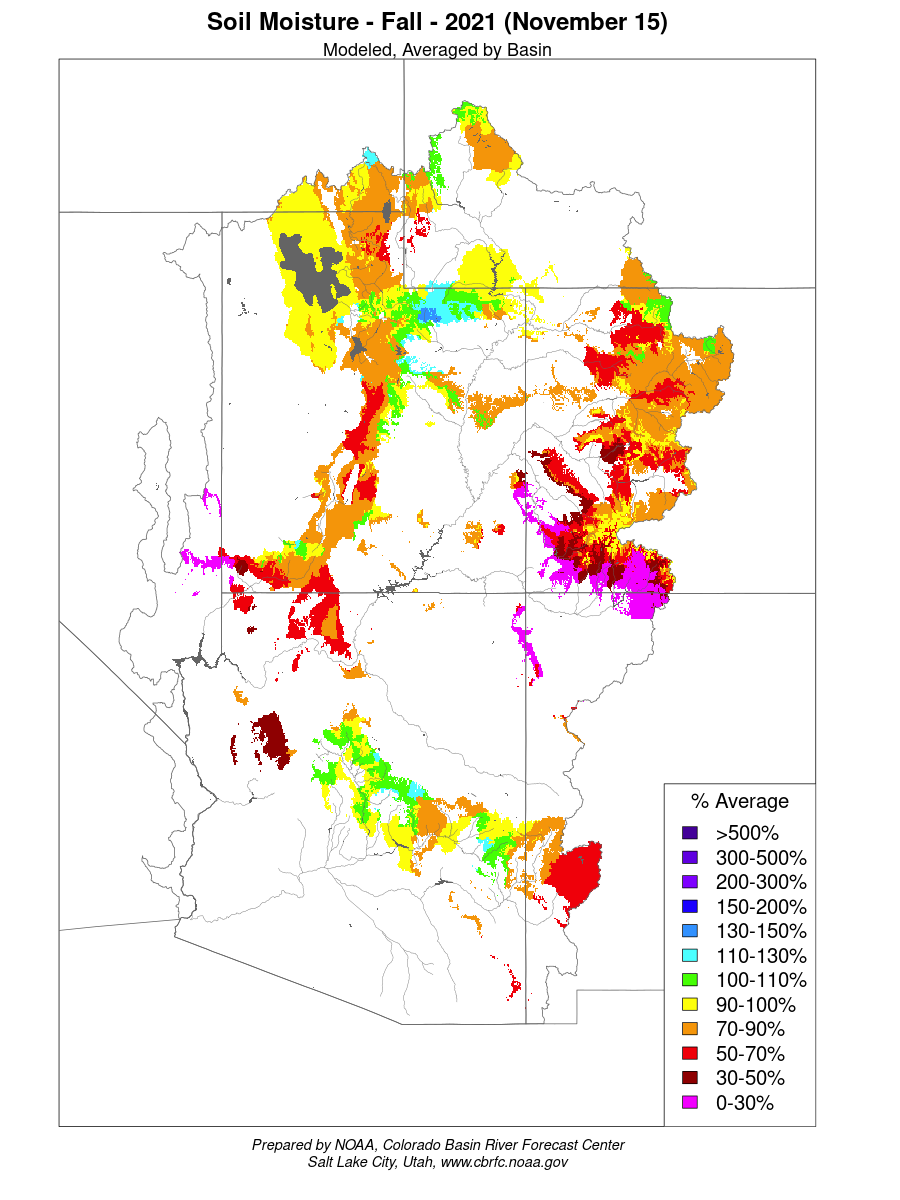
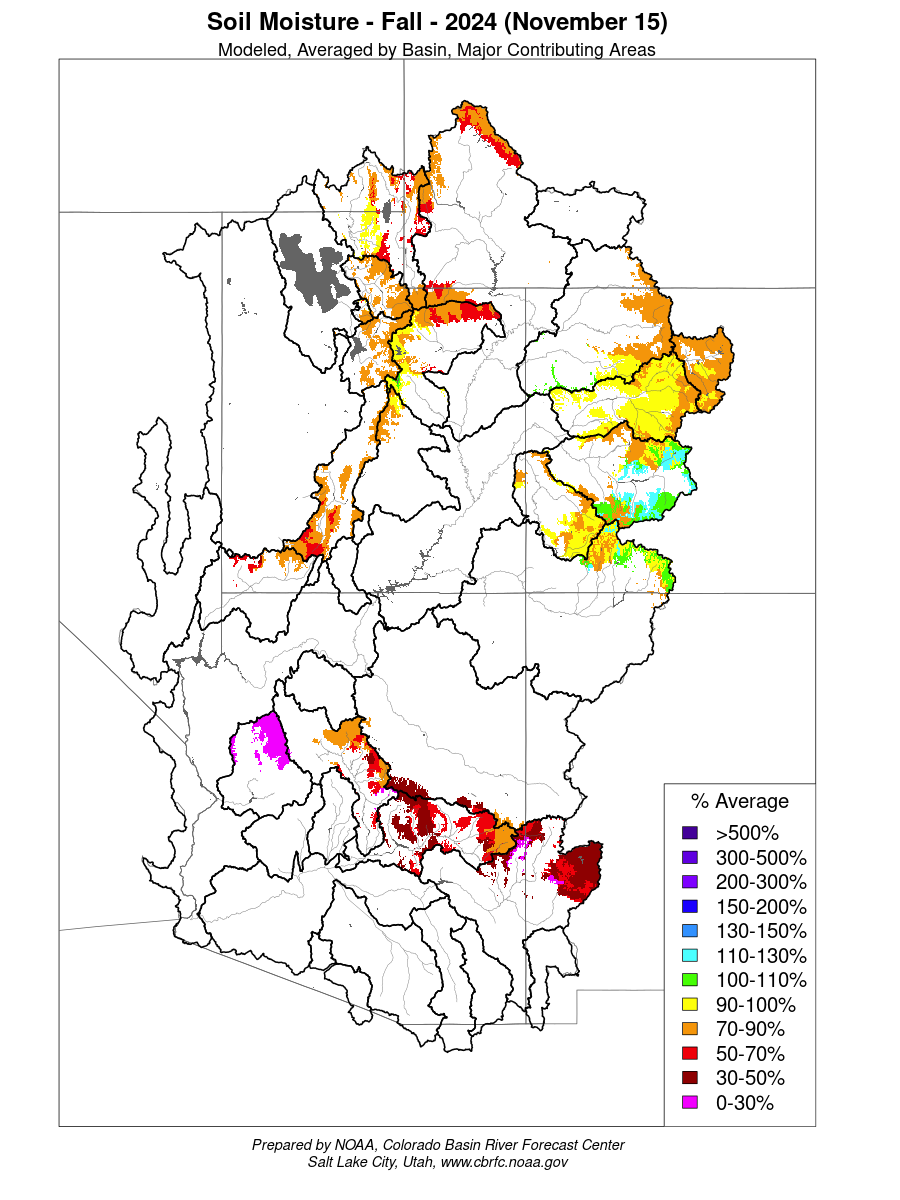
Below: Soil moisture conditions going into winter for the last four years. The beginning of WY2025 soil moisture was better than the previous year in general due to a few Autumn storms. Healthy soil moisture conditions generally improve the likelihood of more efficient snowmelt runoff.


Above: The southern basins had a strong start to the season and held on until about January then started to fall behind and couldn’t catch up. Northern basins held near median levels up until about April and then started falling behind normal precipitation accumulation.
SENATOR BECK STUDY BASIN DATA
This section describes conditions and data collected by the Center for Snow and Avalanche Studies at our Senator Beck Basin Study Area (SBB) at Red Mountain Pass under our Mountain System Monitoring program, which includes the Colorado Dust-on-Snow Program (CODOS). At SBB, snowpack, weather, soils, and radiation conditions are monitored and measured at the well-sheltered subalpine Swamp Angel Study Plot (SASP, 11,060’) and at the more exposed, alpine Senator Beck Study Plot (SBSP, 12,180’). Nearby, wind speed, wind direction, air temperature, and humidity data are collected at the Putney Study Plot (PTSP, 12,323’), located to minimize the influence of local terrain on those measurements. Finally, SBB streamflow discharge is continuously measured at the SBB pour point at the Senator Beck Stream Gauge (SBSG, 11,030’), in a broad-crested, notched weir.
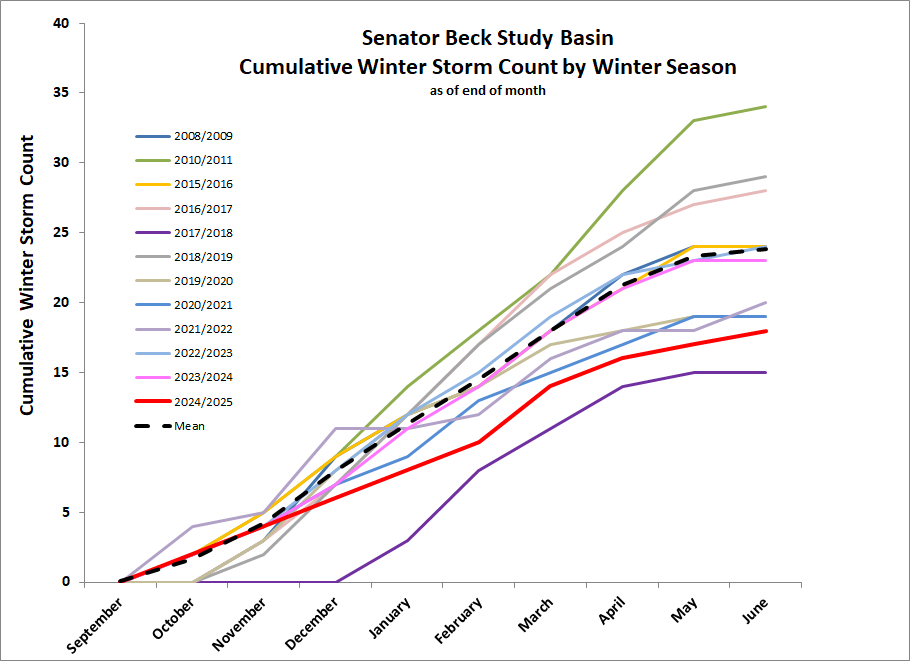
All total we received 20 storms, just under average for our season. A storm is defined as receiving 12 mm (0.5”) or more of precipitation with no break in precipitation greater than 12 hours. Winter storm reports can be viewed at the snowstudies.org website.
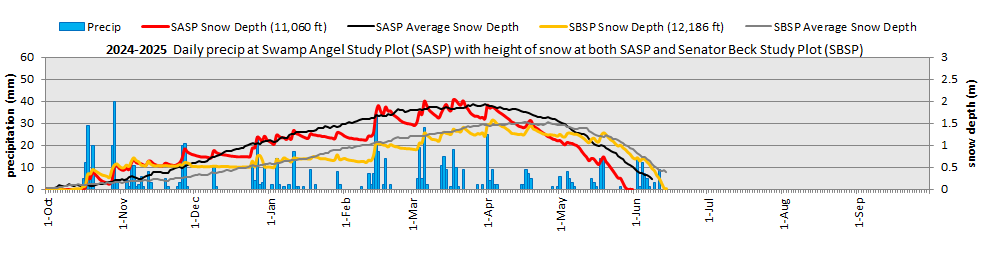
The above graph shows precipitation at SASP with snow depth at SASP and SBSP. Early precipitation helped soil moisture and started the snow accumulation season in fine fashion. Productive storms tapered off latter January and really got bad starting in April. The first half of June was wet through the state except the northwest corner, the first two weeks of June some areas were over 400% of normal.
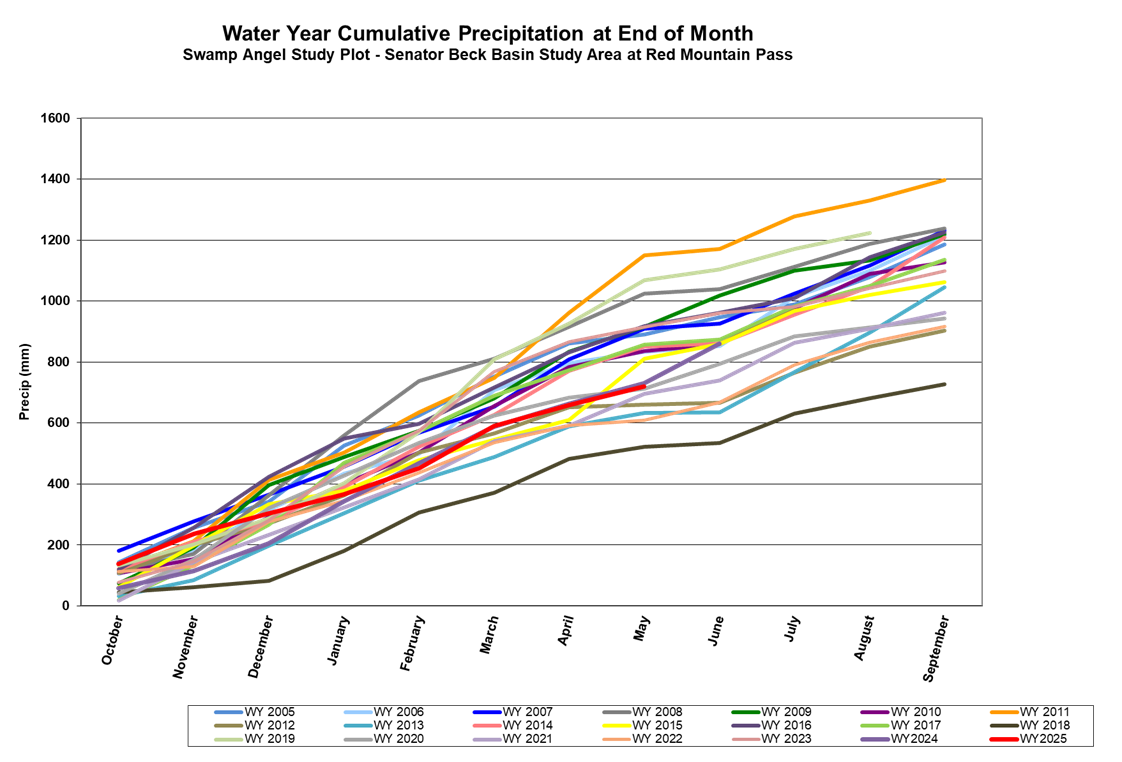
Above: Water Year 2025 cumulative precipitation.
SNOWPACK CONDITIONS
This winter started off with a bang for the San Juans, with the first snows hitting October 16th and lasting four days, delivering 2.7” of snow water equivalent and a foot and a half depth. Another late October storm set many of the lower basins up 200% of normal SWE heading into November.
We kept the lead through November, with two more storms and 115% of normal precipitation at Swamp Angel. A major snowfall event occurred in the southeastern mountains of Colorado in November as well, which kept the central and southern half of Colorado with a higher snowpack than the northern mountains, which were hovering shy of average heading into December.
Just as we were making winter interlodge plans in town, December took a warm and dry turn, which lasted all the way until the holidays. Two mild, consecutive snow storms hit the San Juans the last week of the month, and overall, most Colorado basins were at or just below average SWE conditions for the start of the new year. In January, the southern basins began to lose their foothold on a decent snow year. On January 1st, SWE % of normal was as follows: Upper San Juan – 77%, Rio Grande – 83%, Gunnison – 102%, Dolores – 99%, Arkansas – 106%, and Upper Colorado Headwaters – 103%. On February 1st, SWE % of normal was: Upper San Juan – 61%, Rio Grande – 72%, Gunnison – 85%, Dolores – 77%, Arkansas – 91%, and Upper Colorado Headwaters – 93%. Once those lower basins started to fall behind, they never caught up. We just didn’t have the precipitation needed to make a comeback.
For Swamp Angel, our low precipitation started in December which was just 54% of the average, while January was 53% of average. February was 76% of normal and even though March precipitation was above average (118%), it wasn’t enough to catch us up from three significantly dry months. And even though March delivered somewhat, we also had some very warm temperatures. The spring sun baked us, alternating with a few brief snows, through April. The albedo reset delivered by bits of snowfall was very welcome. Nevertheless, SWE conditions headed south, unable to stand up to that spring sun and warm/dry air. There were a few very small nooks, such as our Senator Beck station, at higher elevations above treeline that accumulated more snow and held onto it pretty well compared to the lower elevation stations. With just a few stations in the high alpine in Colorado, it can be difficult to know what is going on up there, making stations like Senator Beck a very valuable resource for water managers and forecasters.
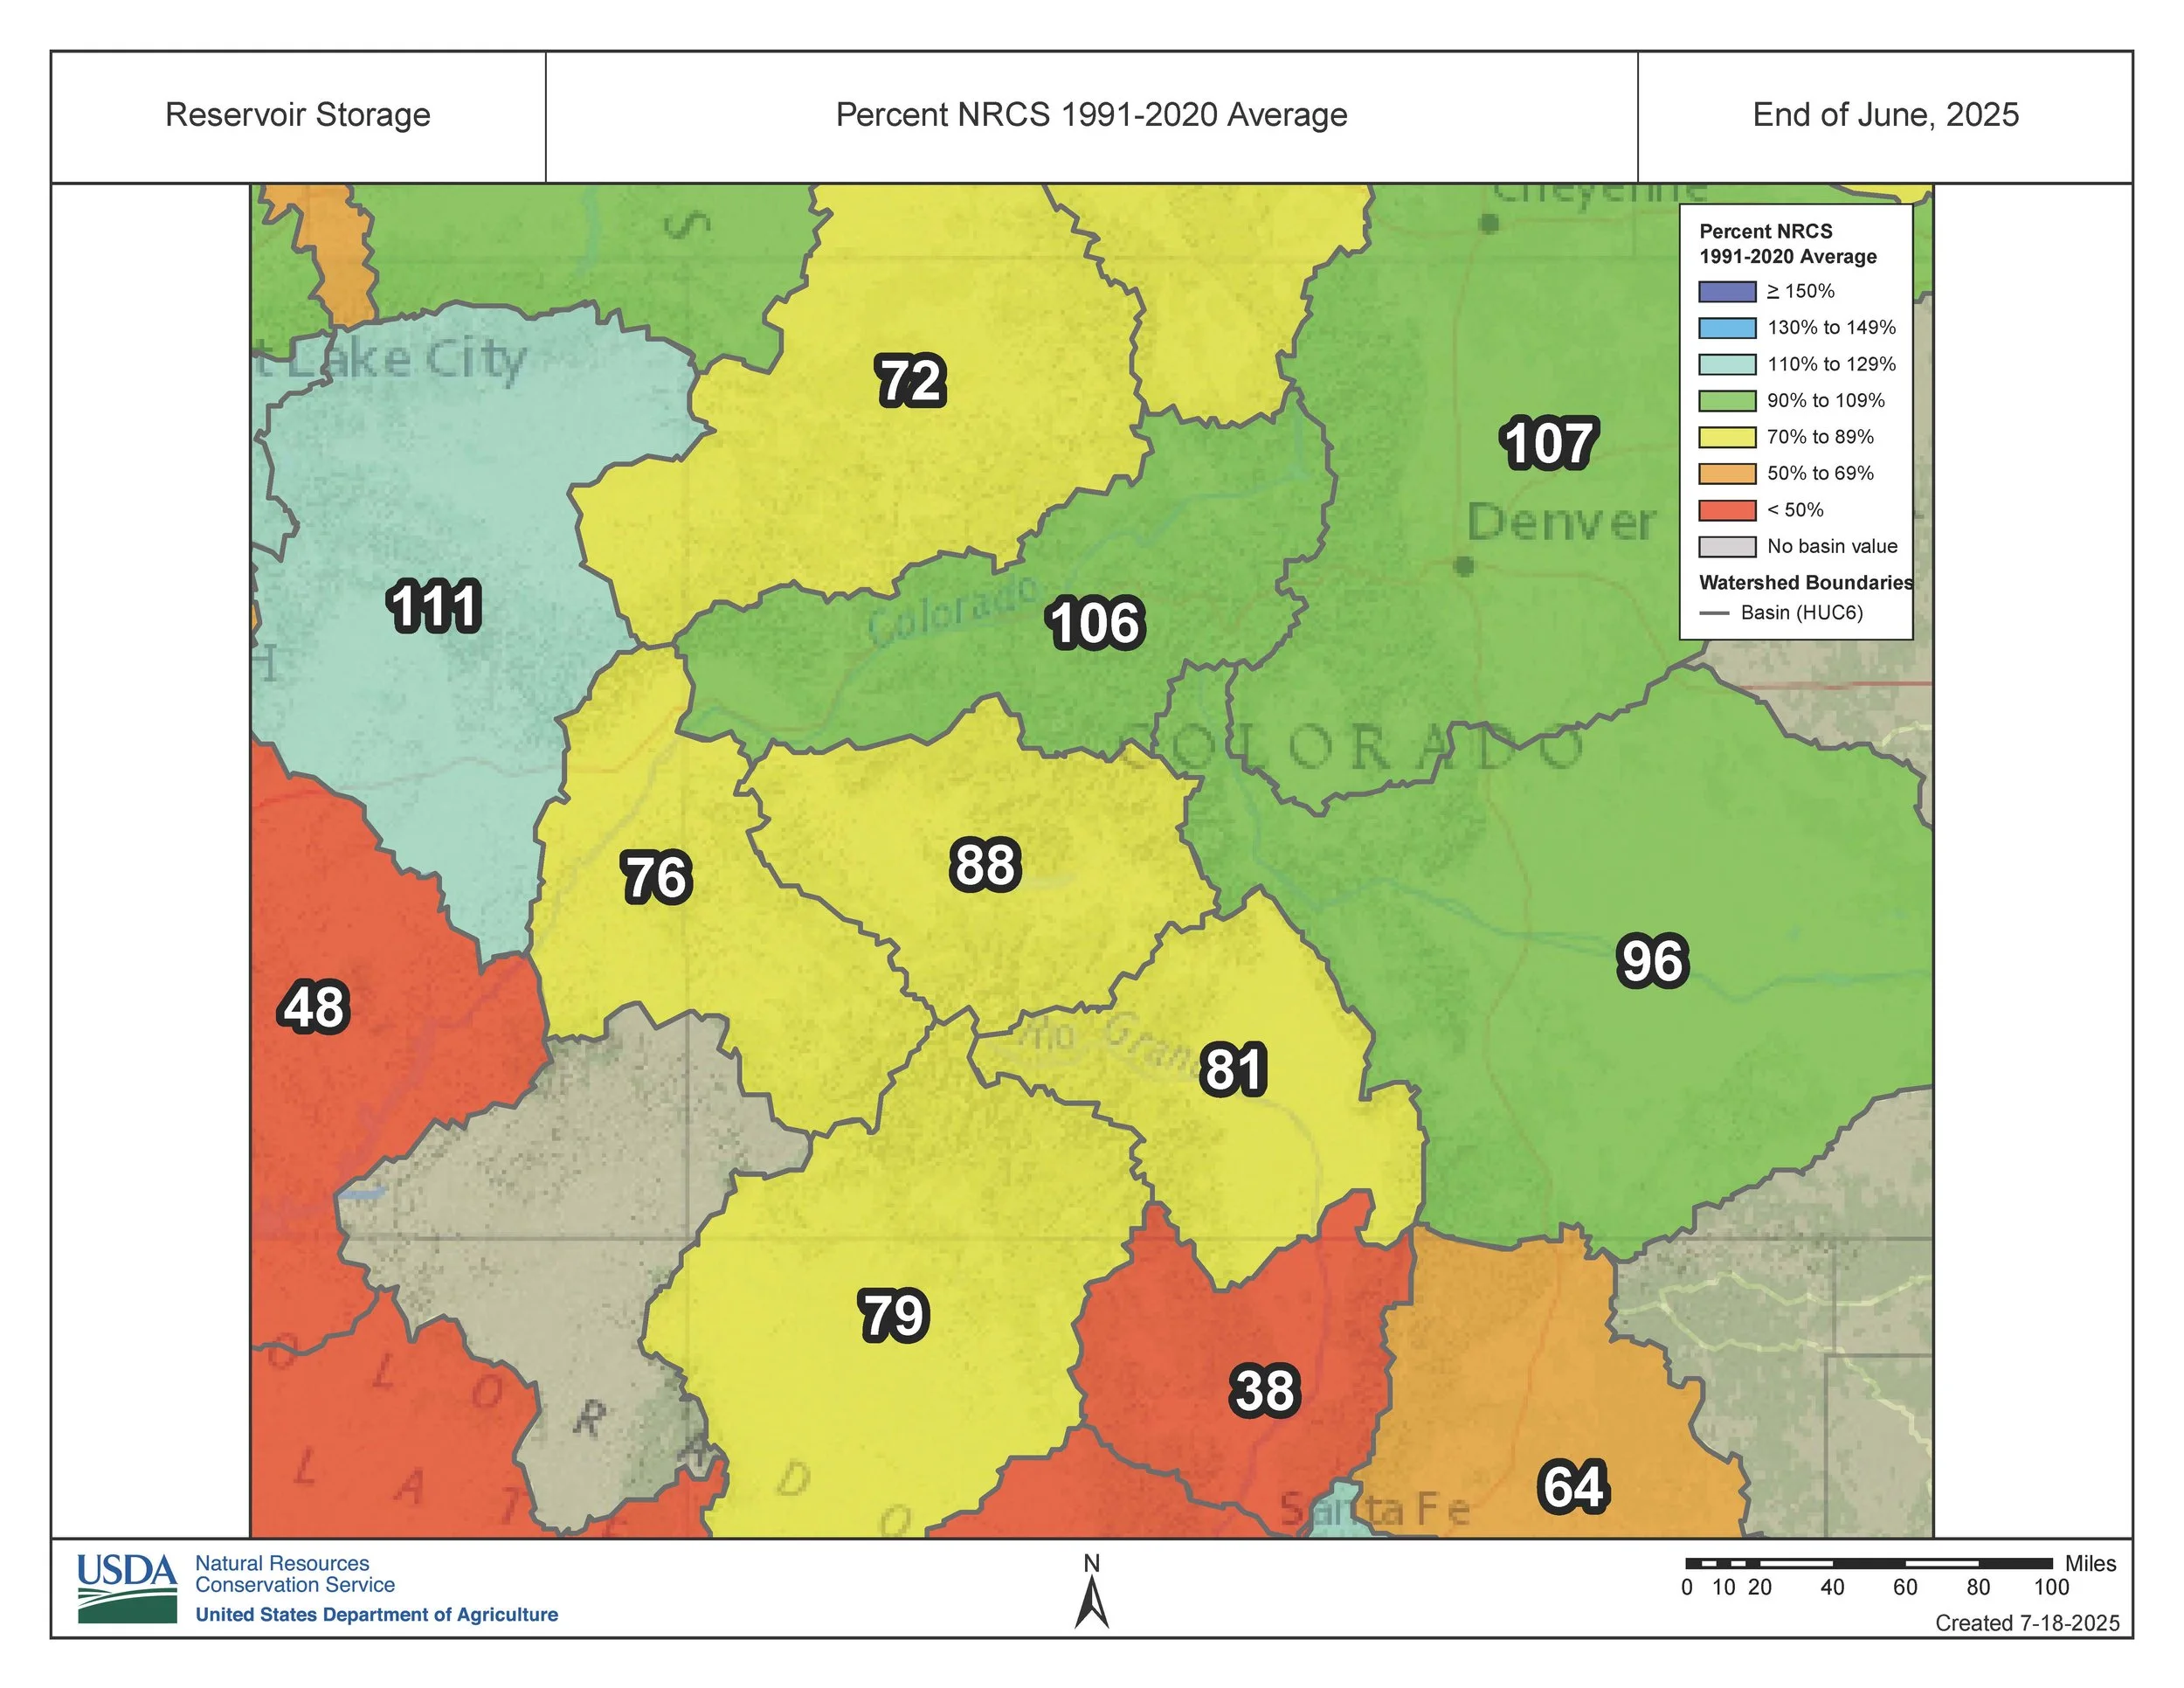
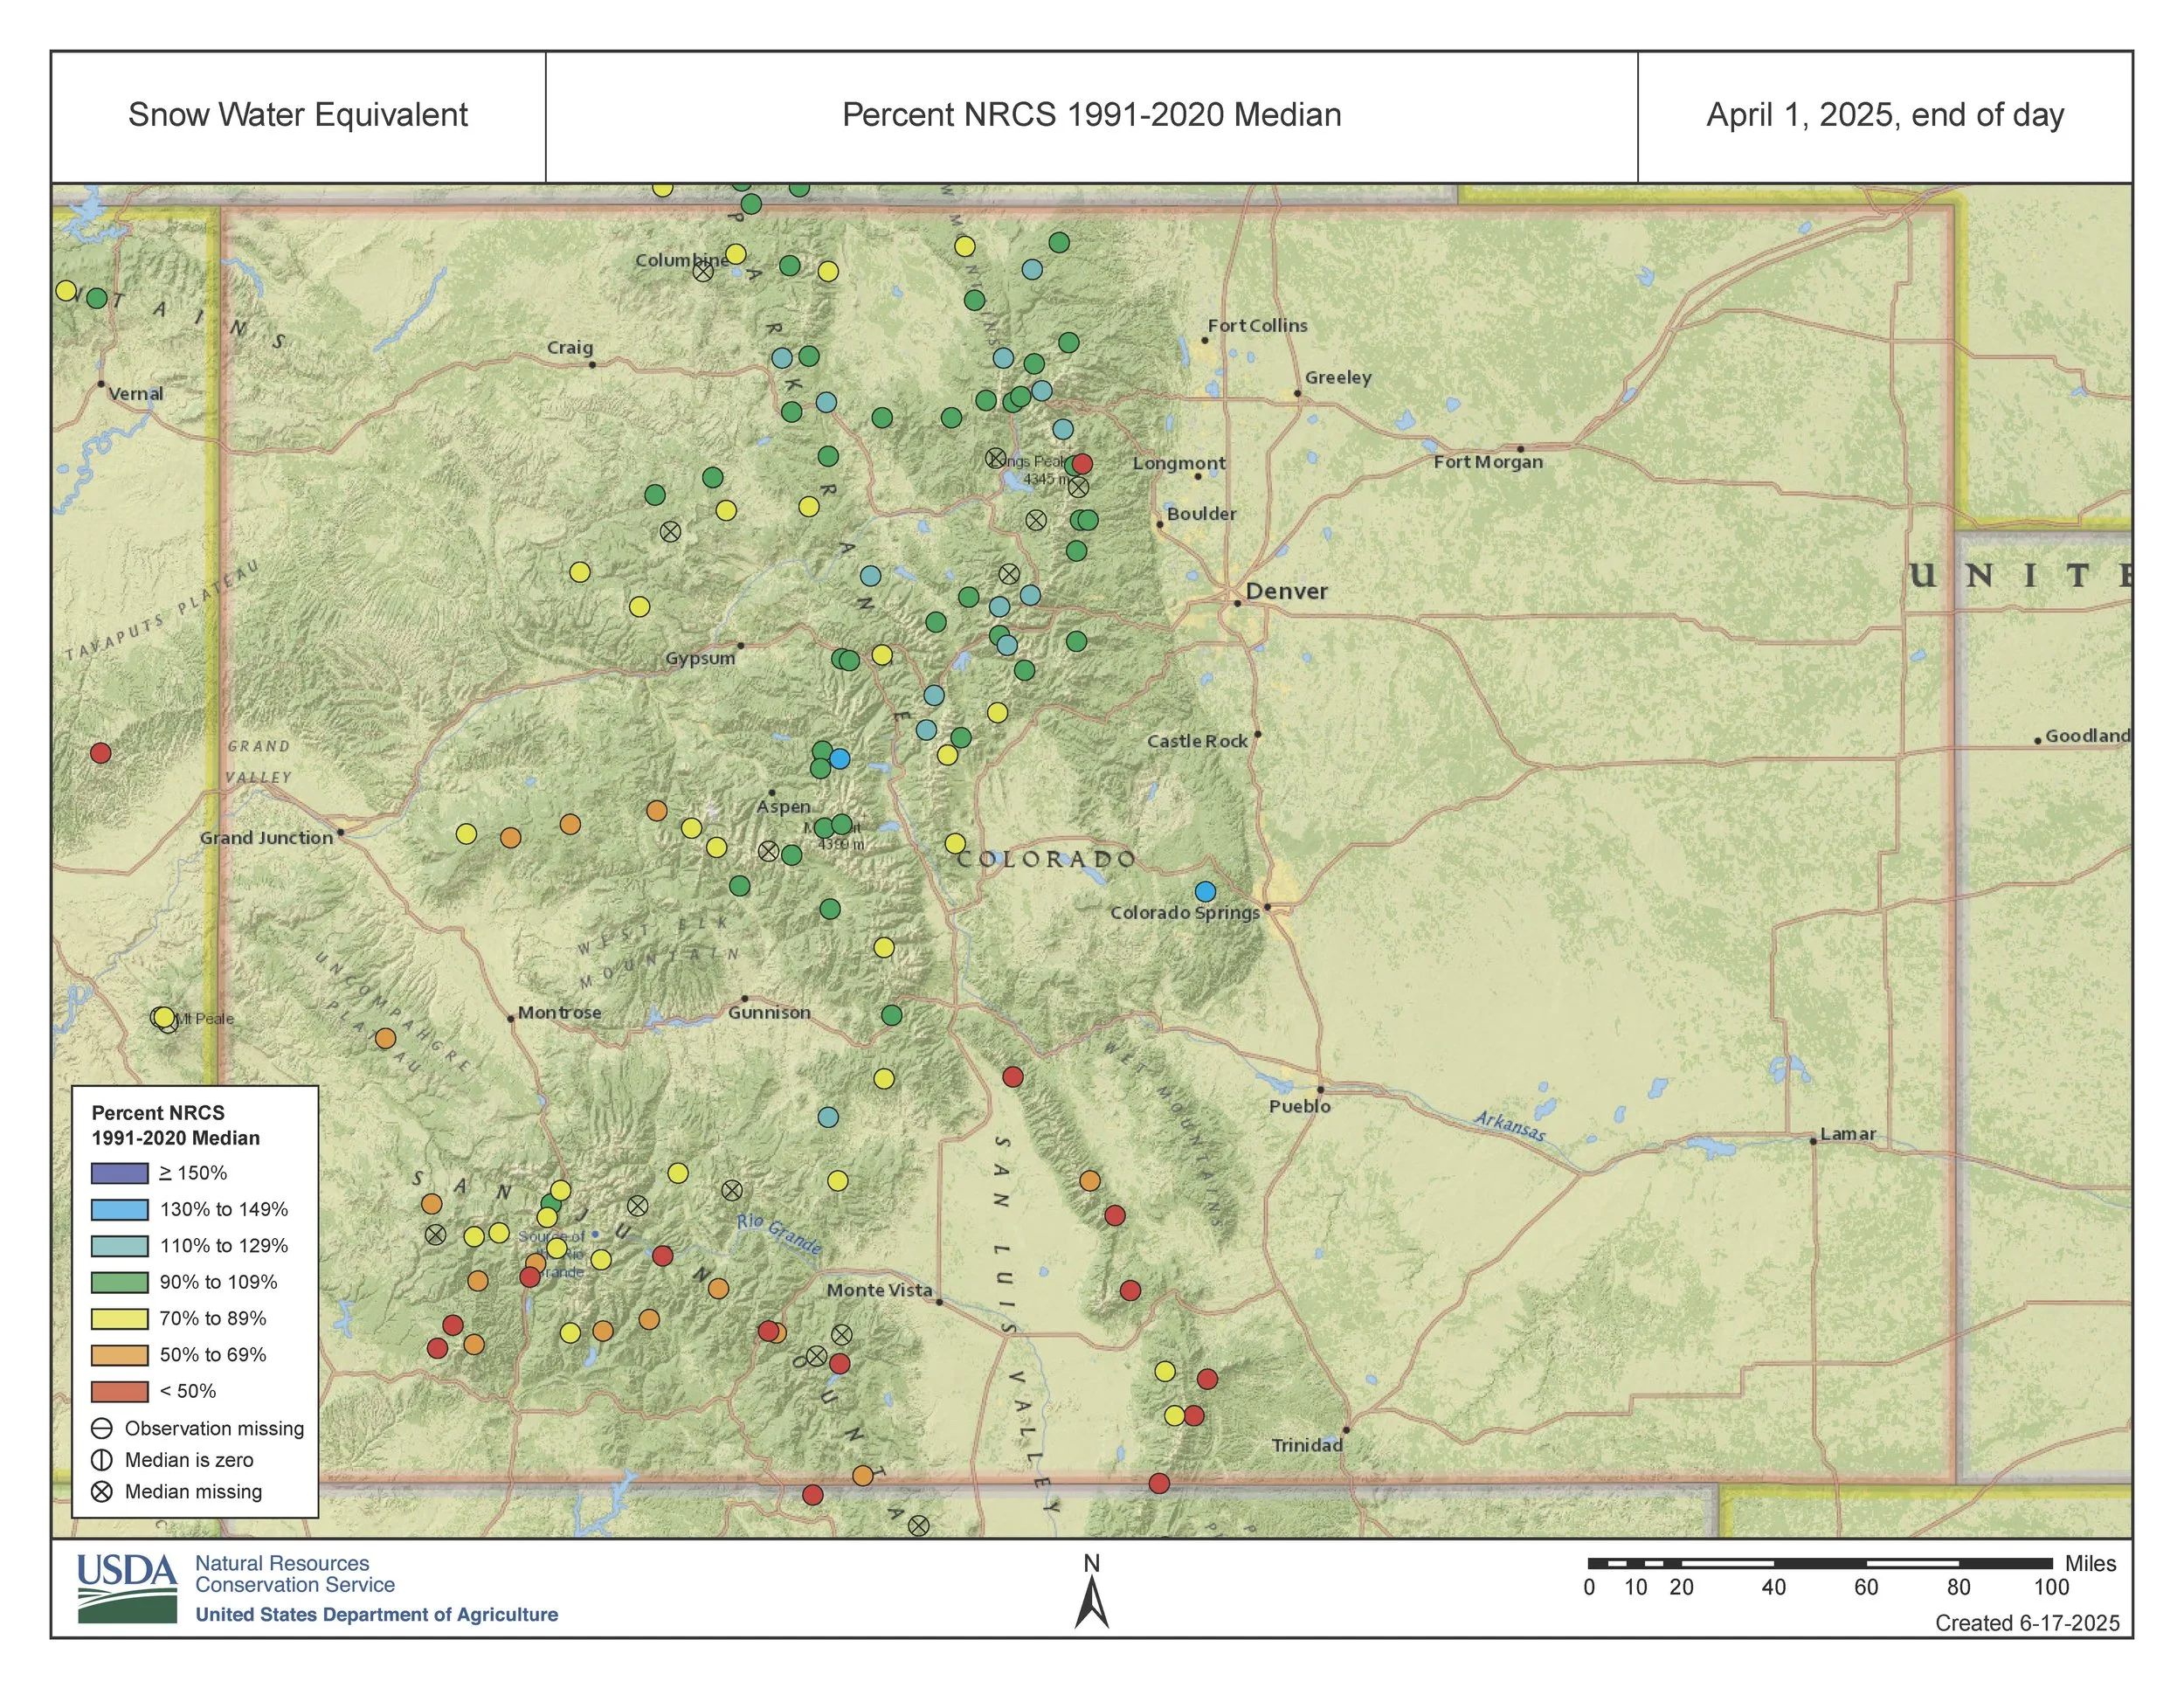
On May 1st, the NRCS Basin SNOTEL map had far too much lobster red (<50% SWE) and sunset oranges to leave any of us with much hope for a sustained streamflow season. Going into May we played the ‘predict the peak’ game following the lead of years like 2018 and 2012 to inform our guess of peak flow in the local adjacent watersheds. Fortunately at least, timely storms in May and first of June provided cloudy/cool conditions and modest albedo resets which prolonged snowmelt enough to make the peak flow around June 1, a bit closer to the average peak timeframe for most basins.


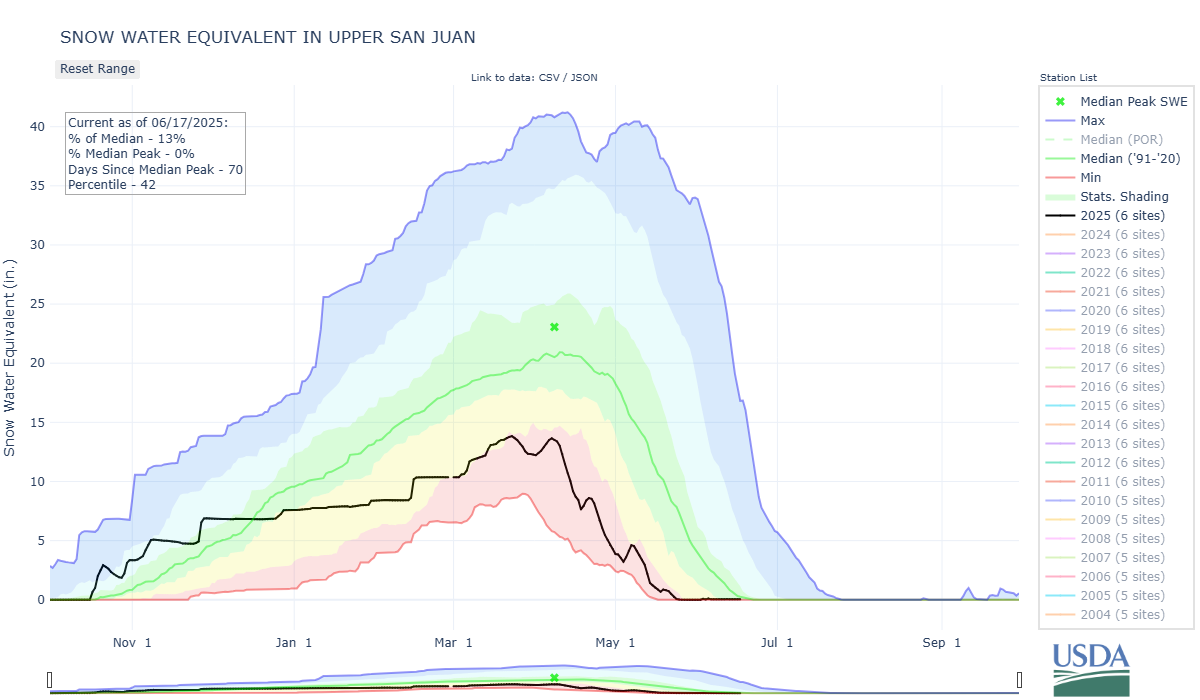


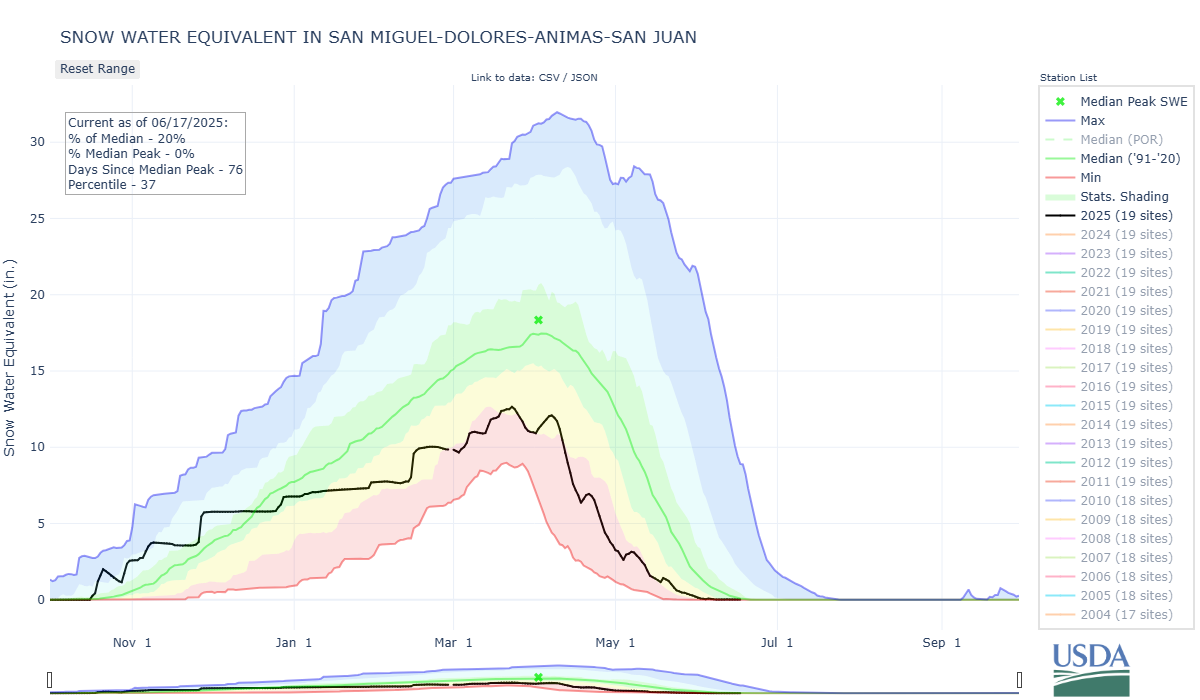


Above: All major basins struggled this season but there was yet again a north/south split that we have seen numerous occasions in the recent past, where northern basins fared significantly better than the southern.
Above: Annual statistics for individual SNOTEL stations tracked by the CODOS Program.
Below: Summary statistics for individual SNOTEL stations.


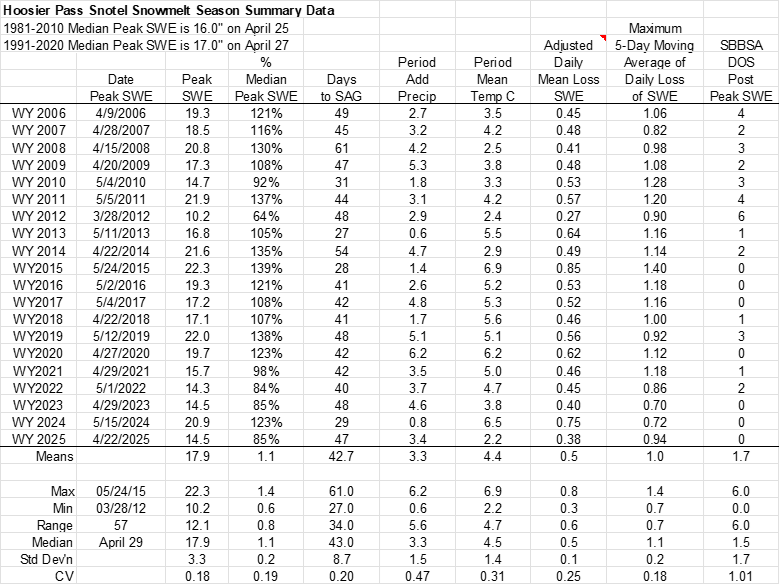


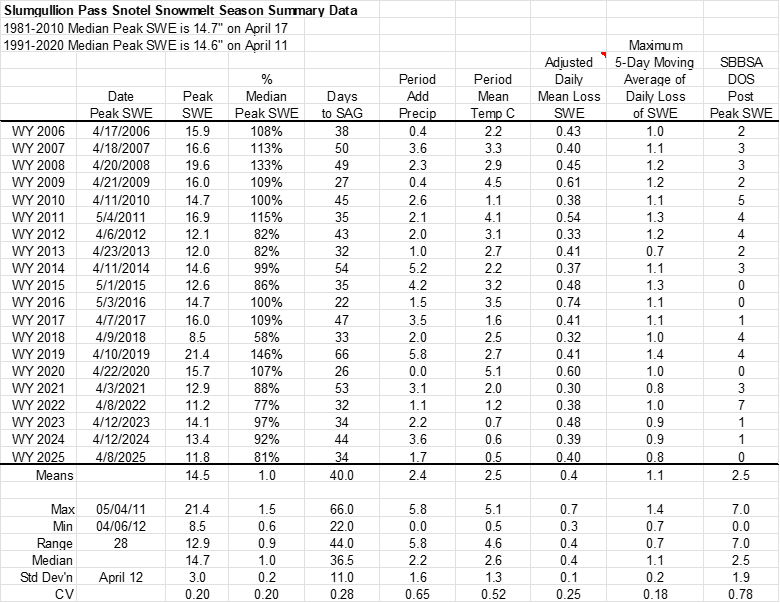


Below: Summary data for WY2025 at the 16 SNOTEL stations that CODOS monitors. The table shows peak SWE, and calculated from the day of peak SWE, melt rates, days to snow-all-gone, and mean temperature. Grizzly Peak (Loveland Pass) and Berthoud fared the best at 115% and 102% of normal. All other sites were below normal. The Rio Grande and San Juans as a whole came in on the low end.
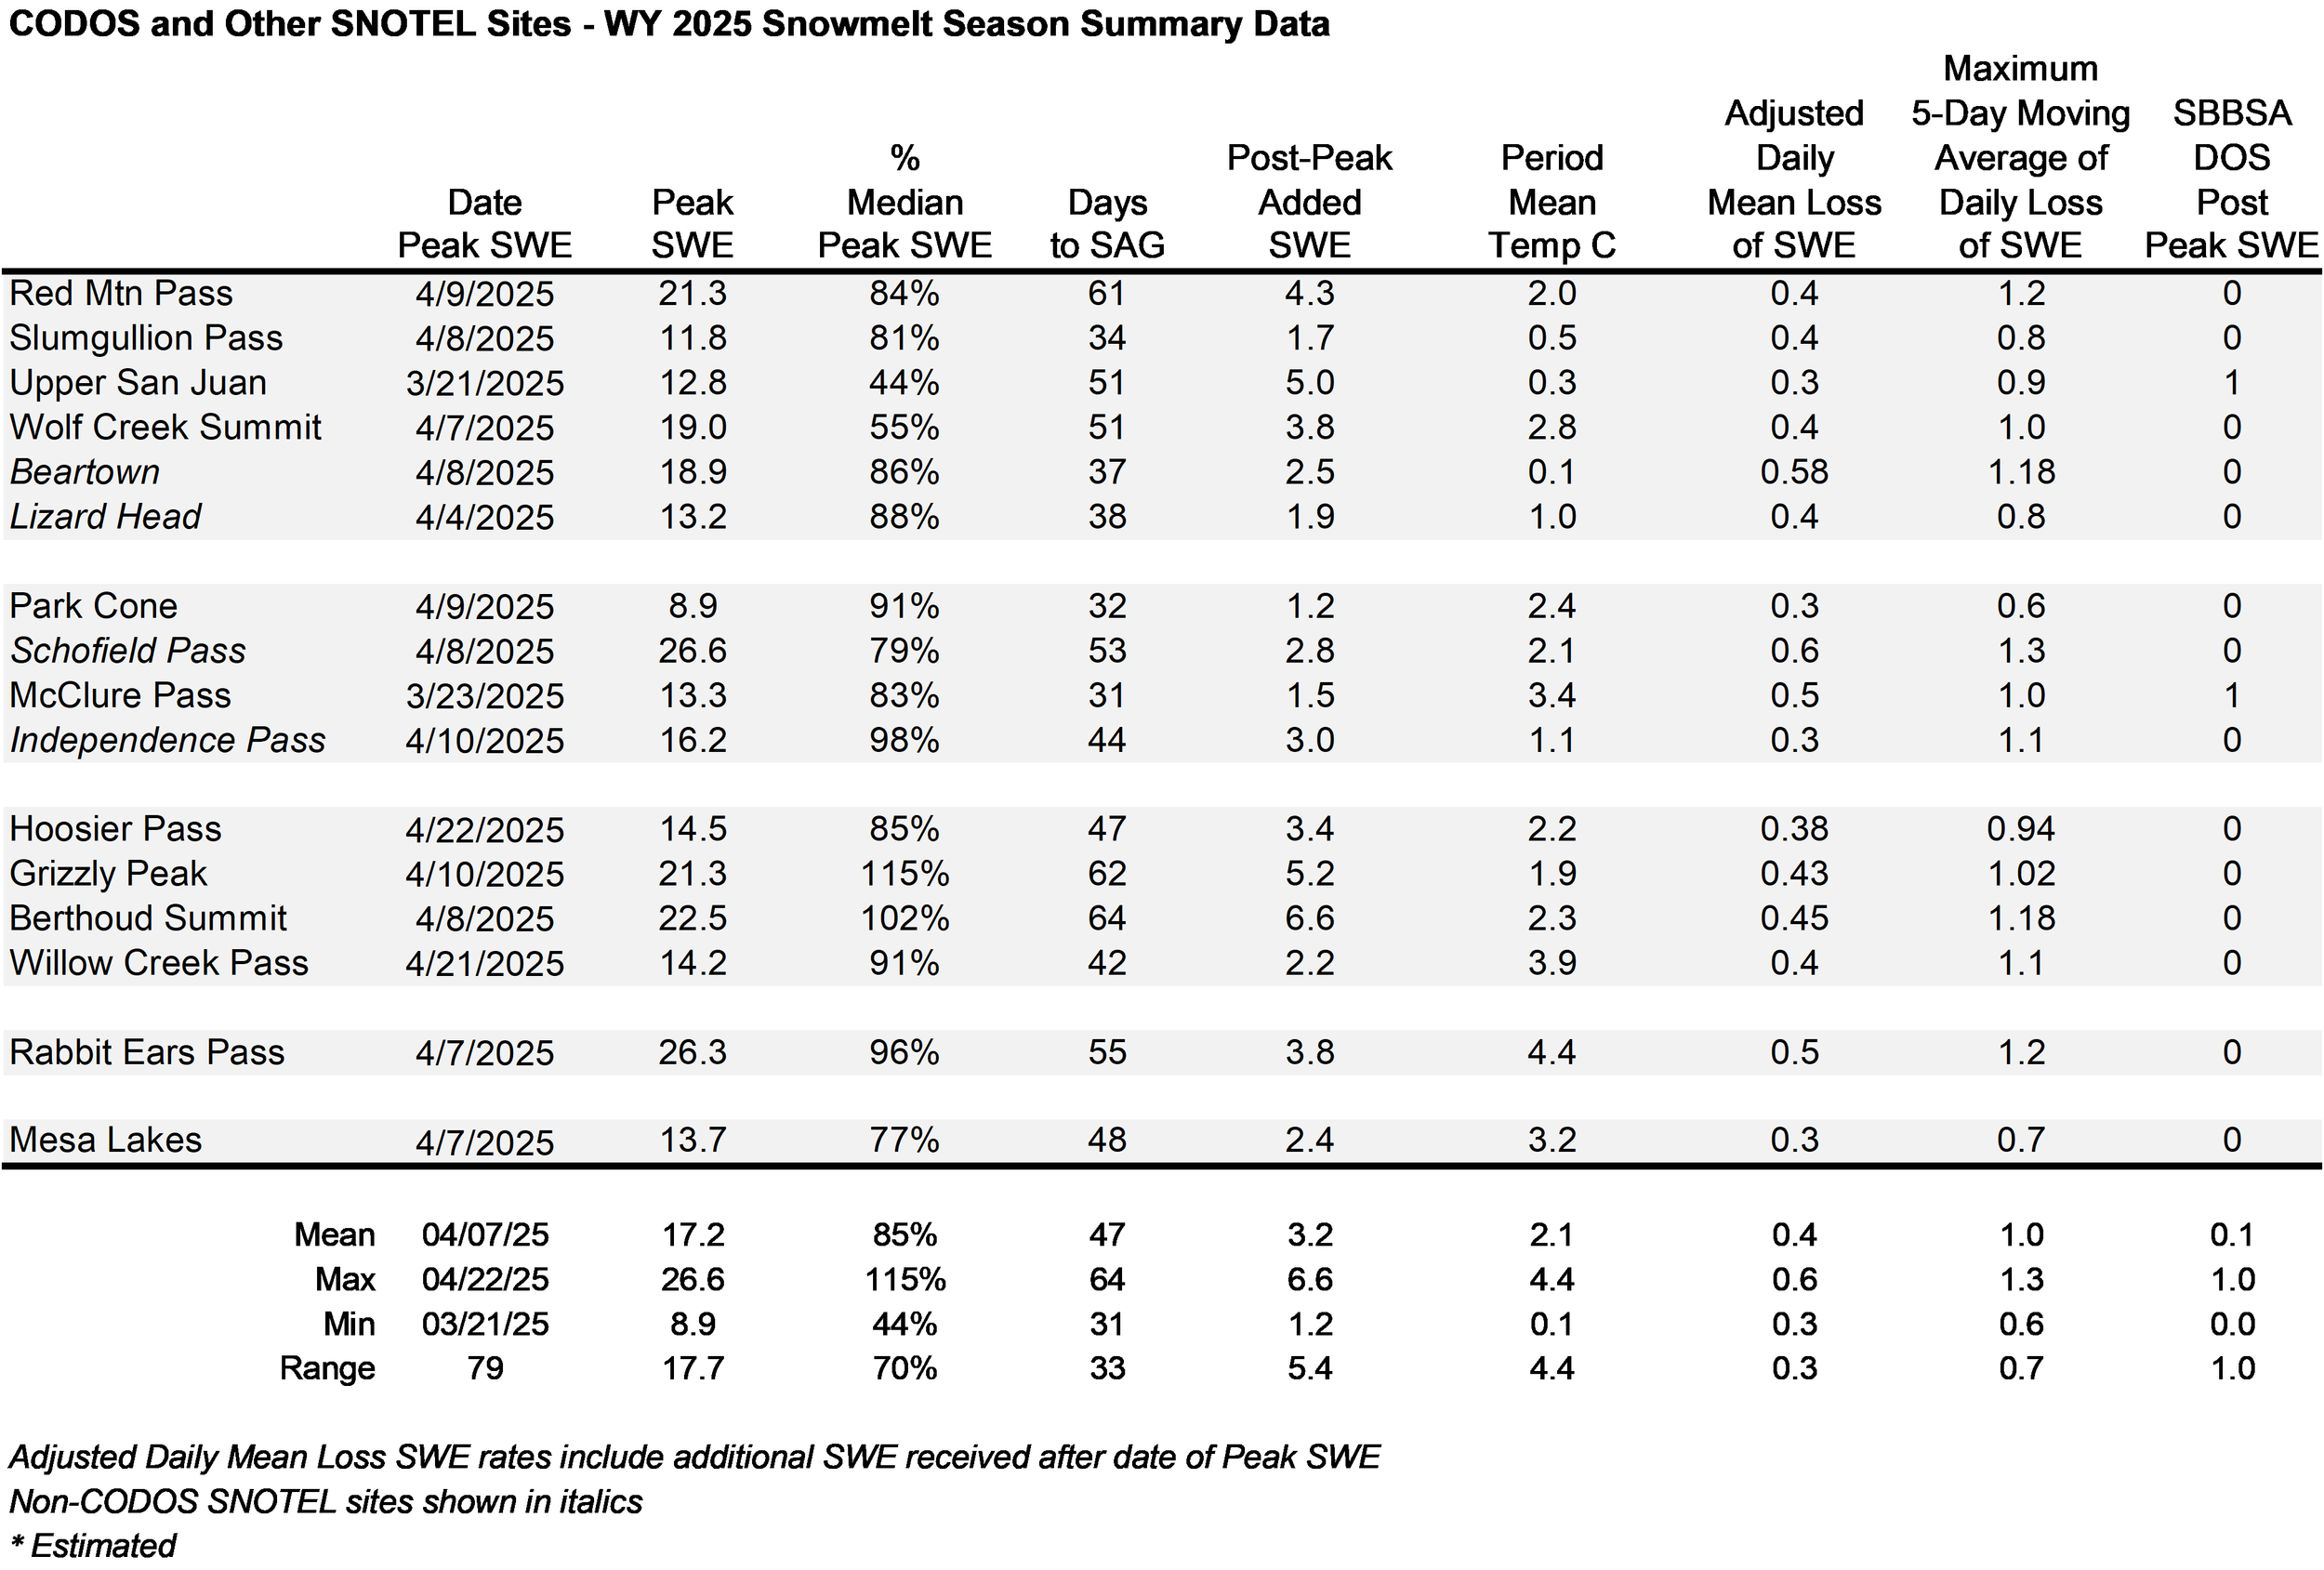
Below: A summary of WY 2006-2025 snowmelt rates and associated conditions at the 16 SNOTEL stations that CODOS routinely monitors. Days to SAG refers to the time between peak SWE and “snow all gone” at the SNOTEL sites. Adjusted Daily Mean Loss calculates the rate of snowmelt following peak SWE, including all precipitation received after peak SWE (assumed to be snow). Melt rate tables are presented for each of the 11 CODOS monitoring sites on their webpages.
Group mean peak SWE was about average. The adjusted daily loss of SWE was on the low end.


Above: Snow depth at Swamp Angel Study Plot.
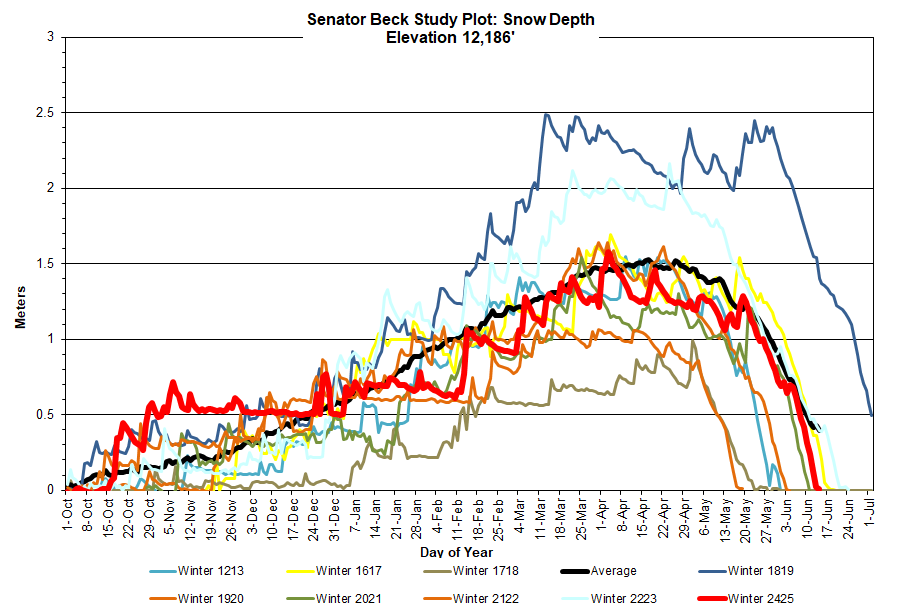
Above: Snow depth at Senator Beck Study Plot.
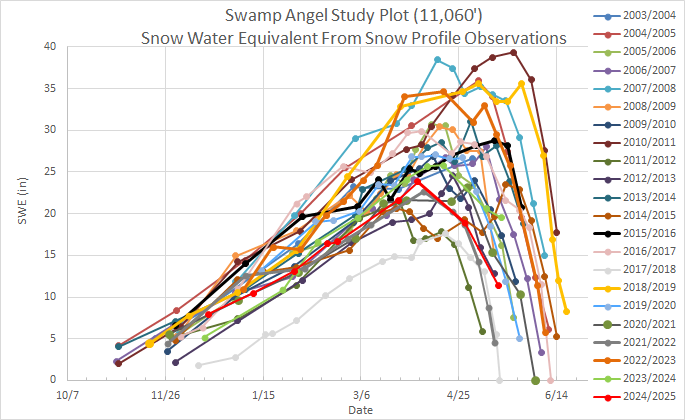
Above: Snow water equivalent at Swamp Angel from snow profiles.
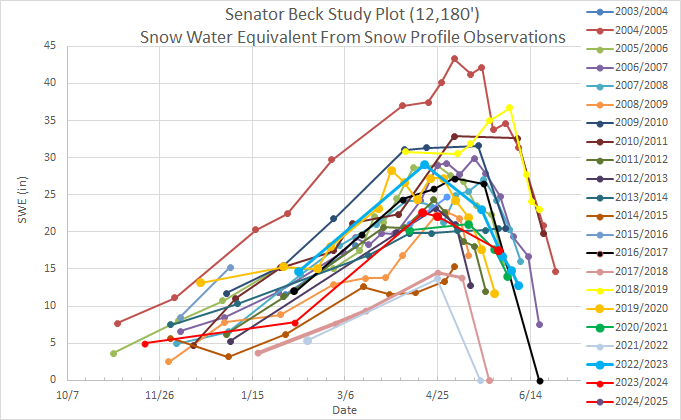
Above: Snow water equivalent at Senator Beck Study Plot from snow profiles.
DUST-ON-SNOW CONDITIONS
DUST ENHANCED RUNOFF CLASSIFICATION:
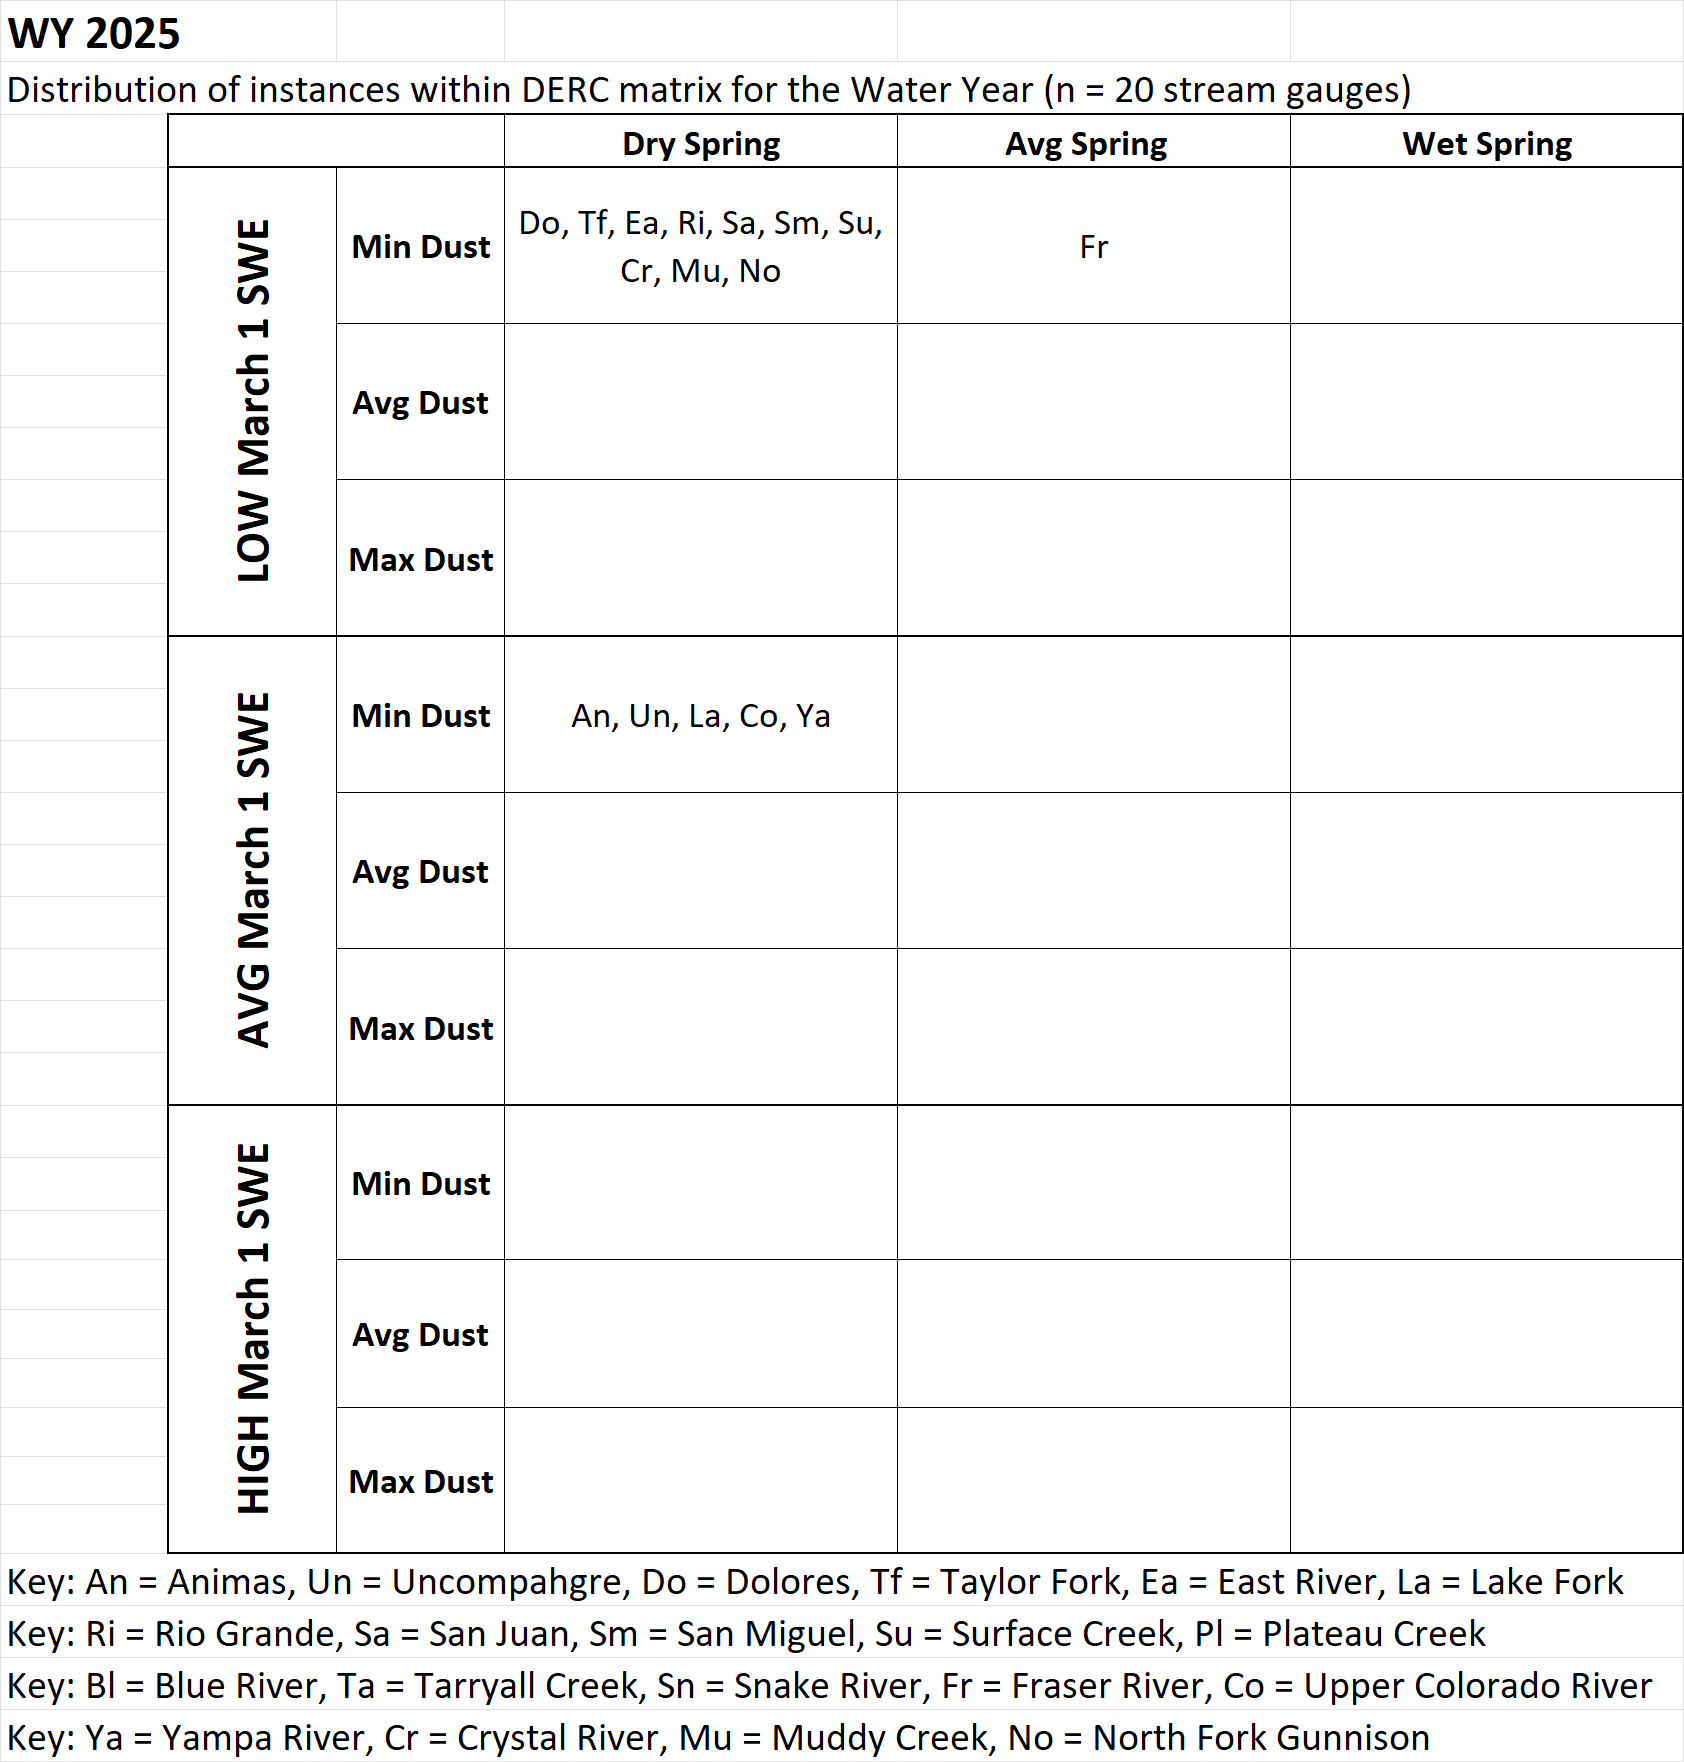
In Water Year 2015 CODOS introduced a Dust Enhanced Runoff Classification (DERC) approach to linking dust-on-snow, snowpack, and spring weather conditions to patterns in statewide hydrographs within a 3x3x3 Dust Enhanced Runoff Space. The below table presents the final DERC classification of WY2025 parameters at each of the 20 stream gauges monitored by CODOS. Water Years 2006-2025 classifications are contained in Excel workbook Runoff_Space_by_Region_and_WY.xlsx. Another workbook, Runoff_Space_by_Watershed.xlsx, contains individual DERC analyses for WY 2006-2025 for each of the 20 stream gauges.
A conceptual Dust Enhanced Snowmelt Runoff Space integrating the interactions of March 1 SWE, dust intensity, and spring precipitation.
Current and prior seasons snowpack conditions, dust severity, and spring precipitation are mapped for individual DERC space along with the hydrographs. These analyses are presented in PDF format and are available for the watersheds listed below. Referencing these DERC spaces in spring is helpful to get and idea how spring runoff will possibly unfold.
Below: Based on the discussions describing the DERC approach in characterizing the watersheds that CODOS monitors, WY2025 snowmelt season conditions are summarized in the tables below. Essentially, Colorado WY2025 snowpack and snowmelt runoff behaviors were mostly average with a number of wetter and drier areas. Dust severity was about minimal throughout Colorado but a dry/warm wet spring largely kept dust on the snow surface with an occasional storm temporarily covered the surface helping push runoff towards a more normal time period. Volumes however were very low.
This year was a mild year for dust-on-snow in Colorado. We tracked more than one dust plume on satellite imagery that skirted south of the Colorado mountains sparing us from having a dustier snowpack. The number of near-misses helped solidify this season as a mild year for dust-on-snow. Here, we discuss the progression of the dust season in Colorado.
The Senator Beck Study Basin received approximately three dust events this season. Often, dust layers were faint in the snowpack, at times not revealing themselves until the snowpack had settled and densified as the season progressed. We’ve documented three events – D1 (Dust Event #1) occurred on January 25-26th, D2 on March 18th, and D3 around April 1st.
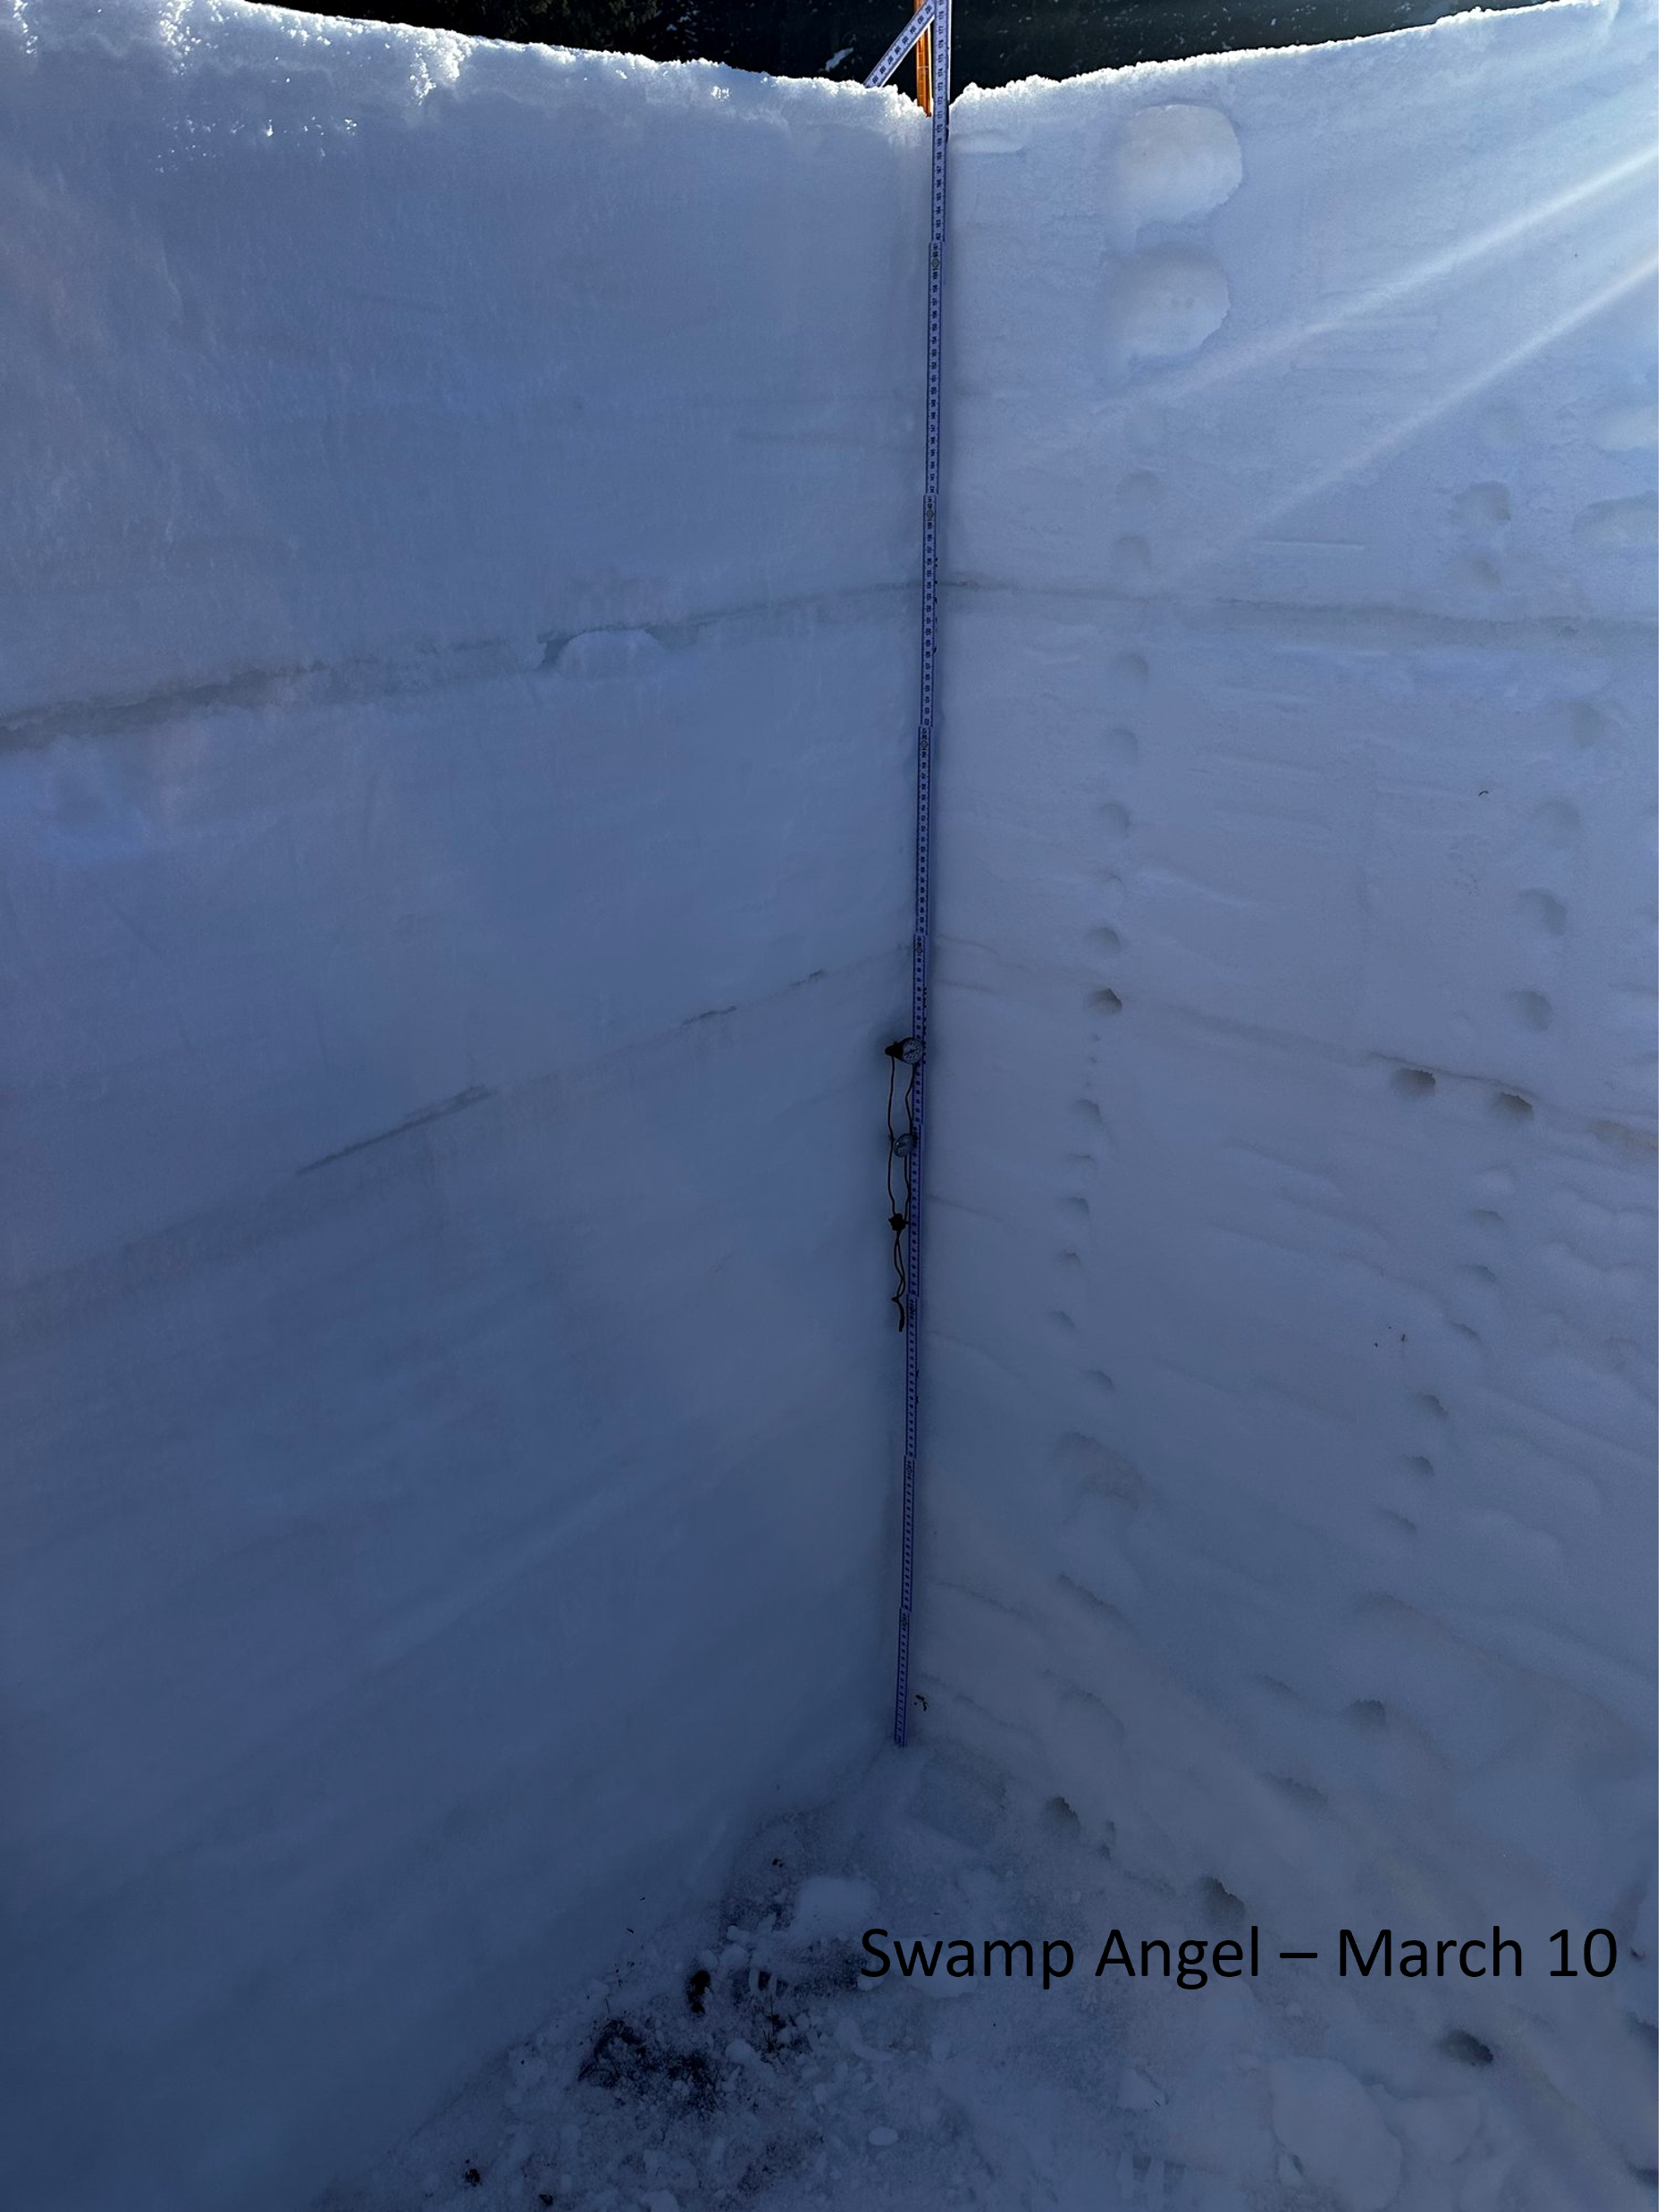
The weekend of January 25-26th we had reports of winds picking up and visible dust on the surface of the snow on Red Mountain Pass. On January 25-26th, prevailing winds were from the south, with the highest windspeeds occurring the afternoon/evening of the 25th. The following week on January 29-30th, Swamp Angel received some precipitation, accumulating 13 cm (5”) of depth. And in our Jan 31st pit we found a dust layer approximately 5” below the surface, which means the dust was a dry event (airborne dust without any precipitation) that blew in before that Jan 29th snowfall.
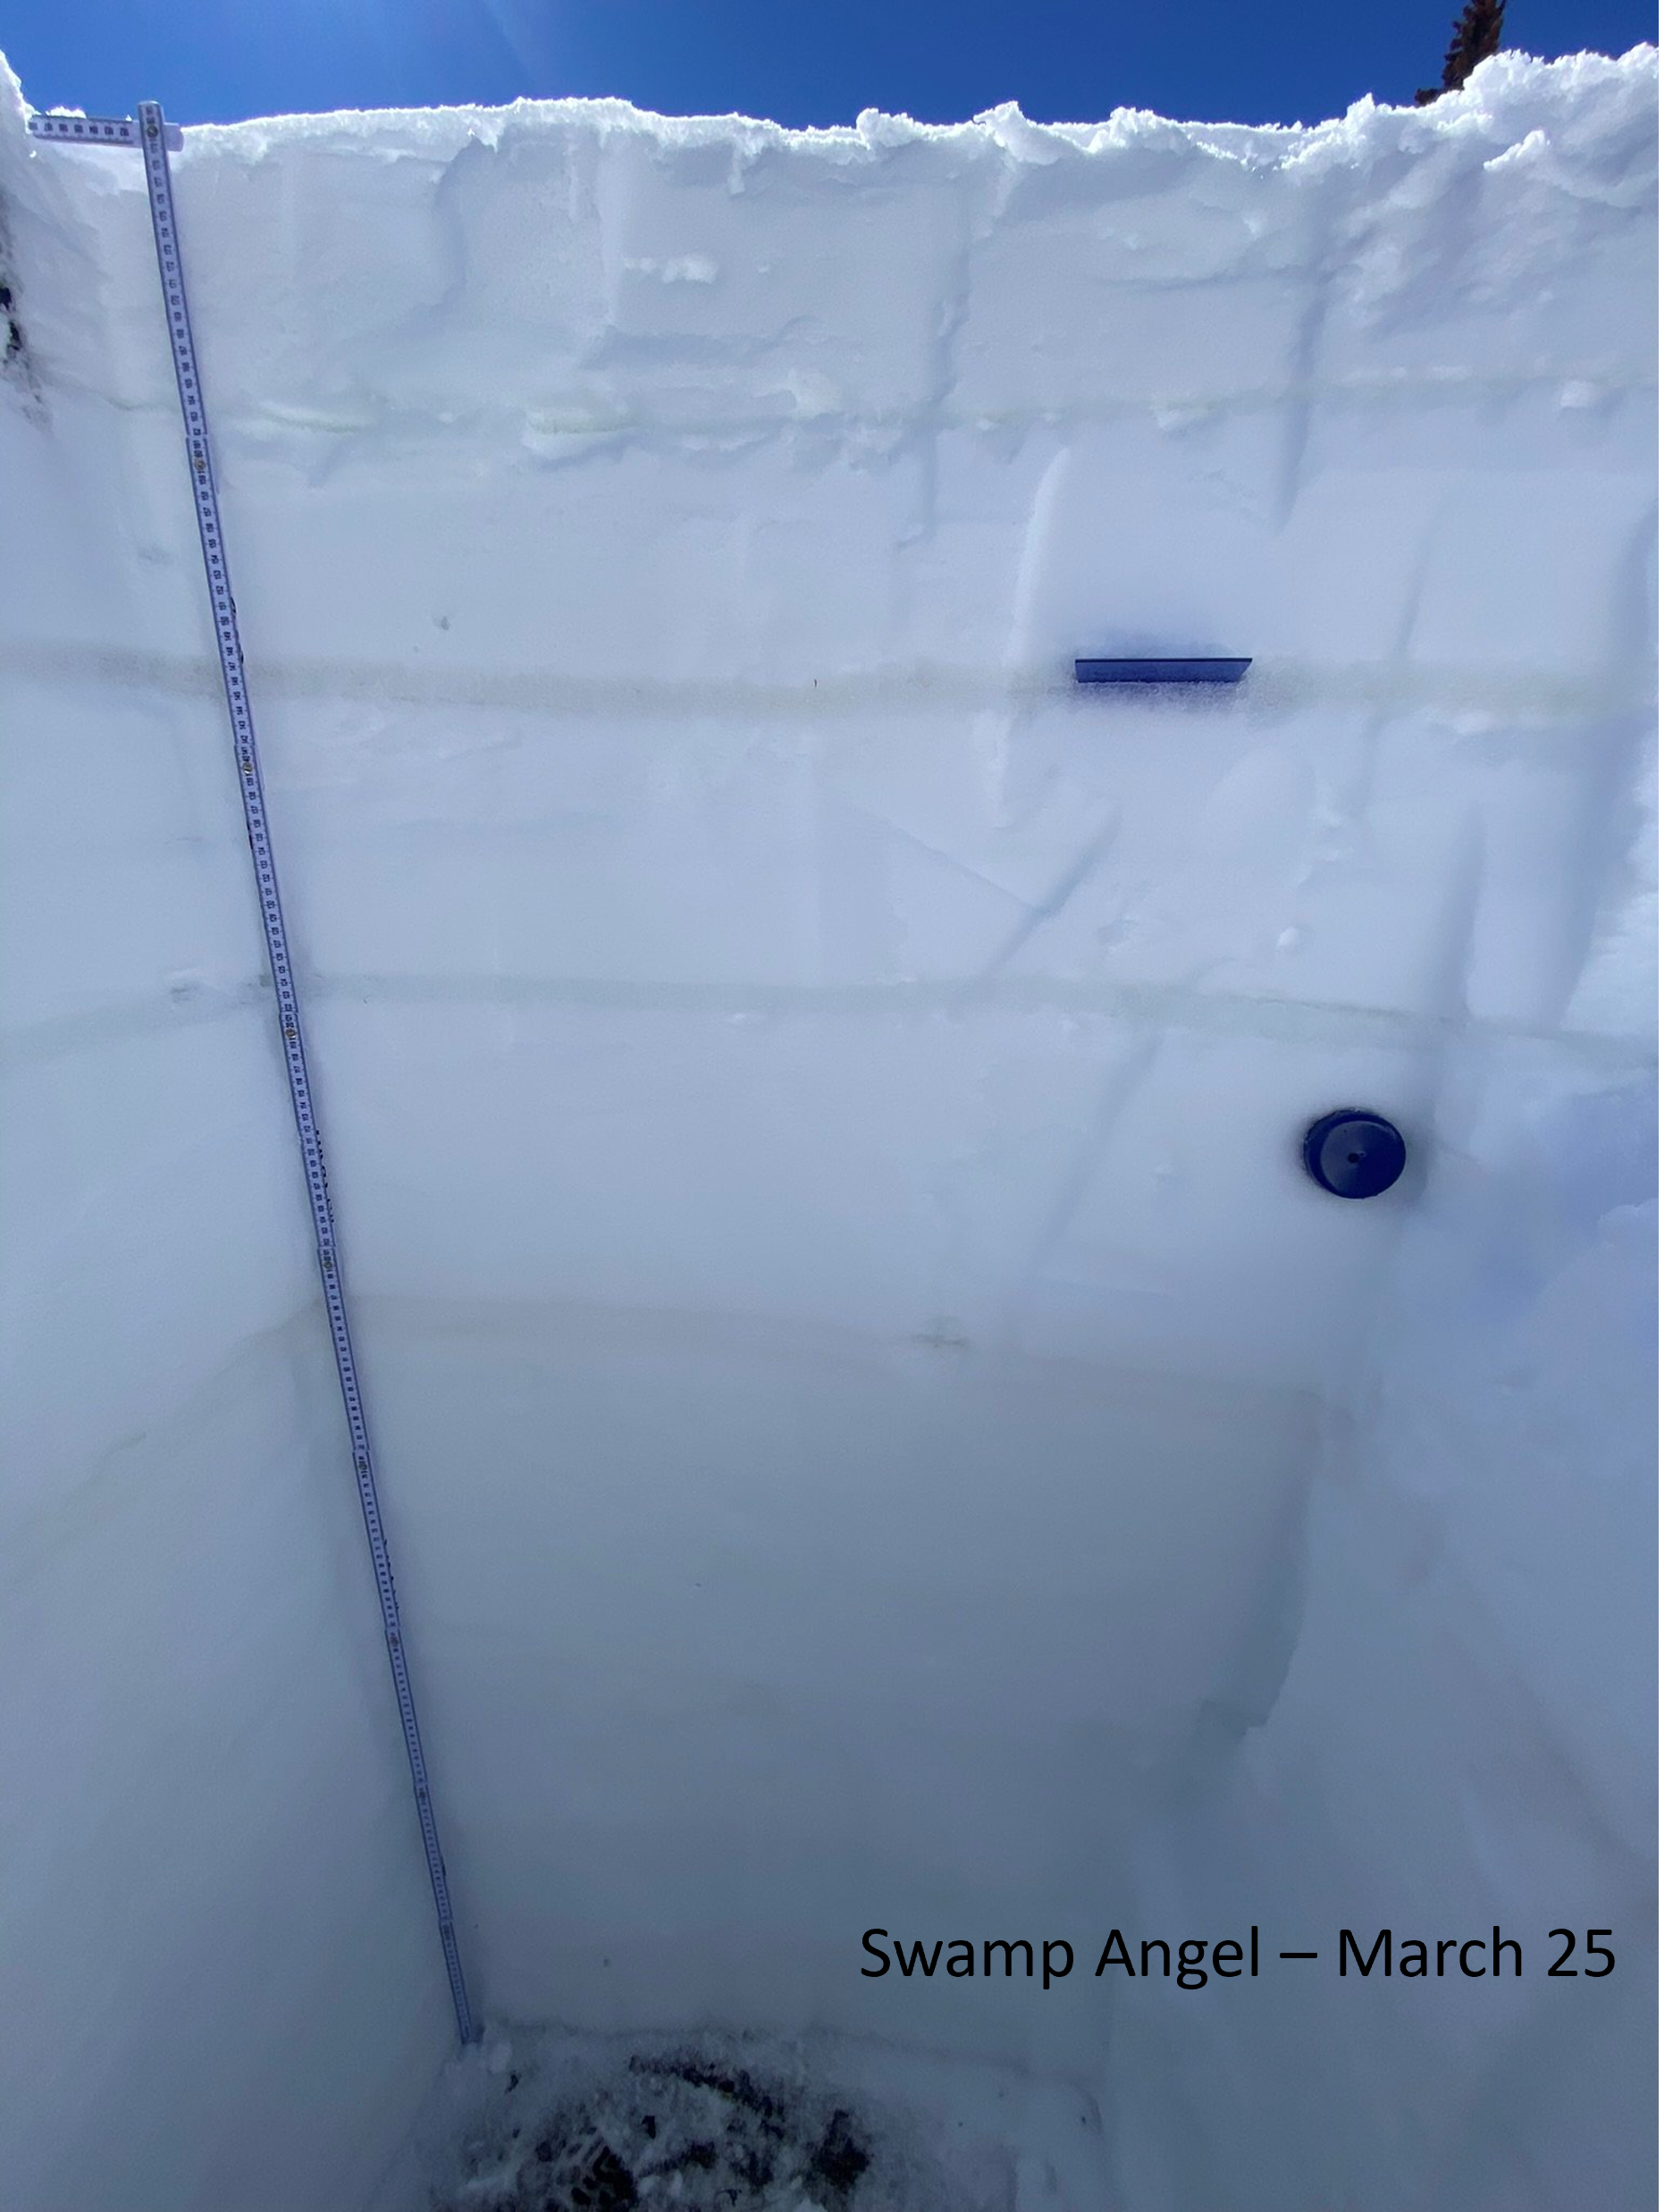
For our March dust event, we located a plume of dust kicking up on satellite imagery over land with no/low vegetation cover in Utah, and drifting west/southwest towards the San Juans. In the afternoon/evening of March 18th, we had direct westerly winds with gusts up to 66 mph. We speculate the dust blew in right in front of the storm, then followed 1.1” of liquid precipitation landing March 18-19th. On March 25th, we dug a pit and located a dust layer about 13” below the snow surface.
The transition from March into April had another dust event in store. The April 1-3rd snowstorm brought just over 11” of depth and 1.7” of SWE. About 10” of fresh snow sat atop the new dust layer in the April 4th Swamp Angel pit, so the dust likely blew in during the first part of the storm, where our plots also show was the windiest with prevailing winds coming from the west/southwest.
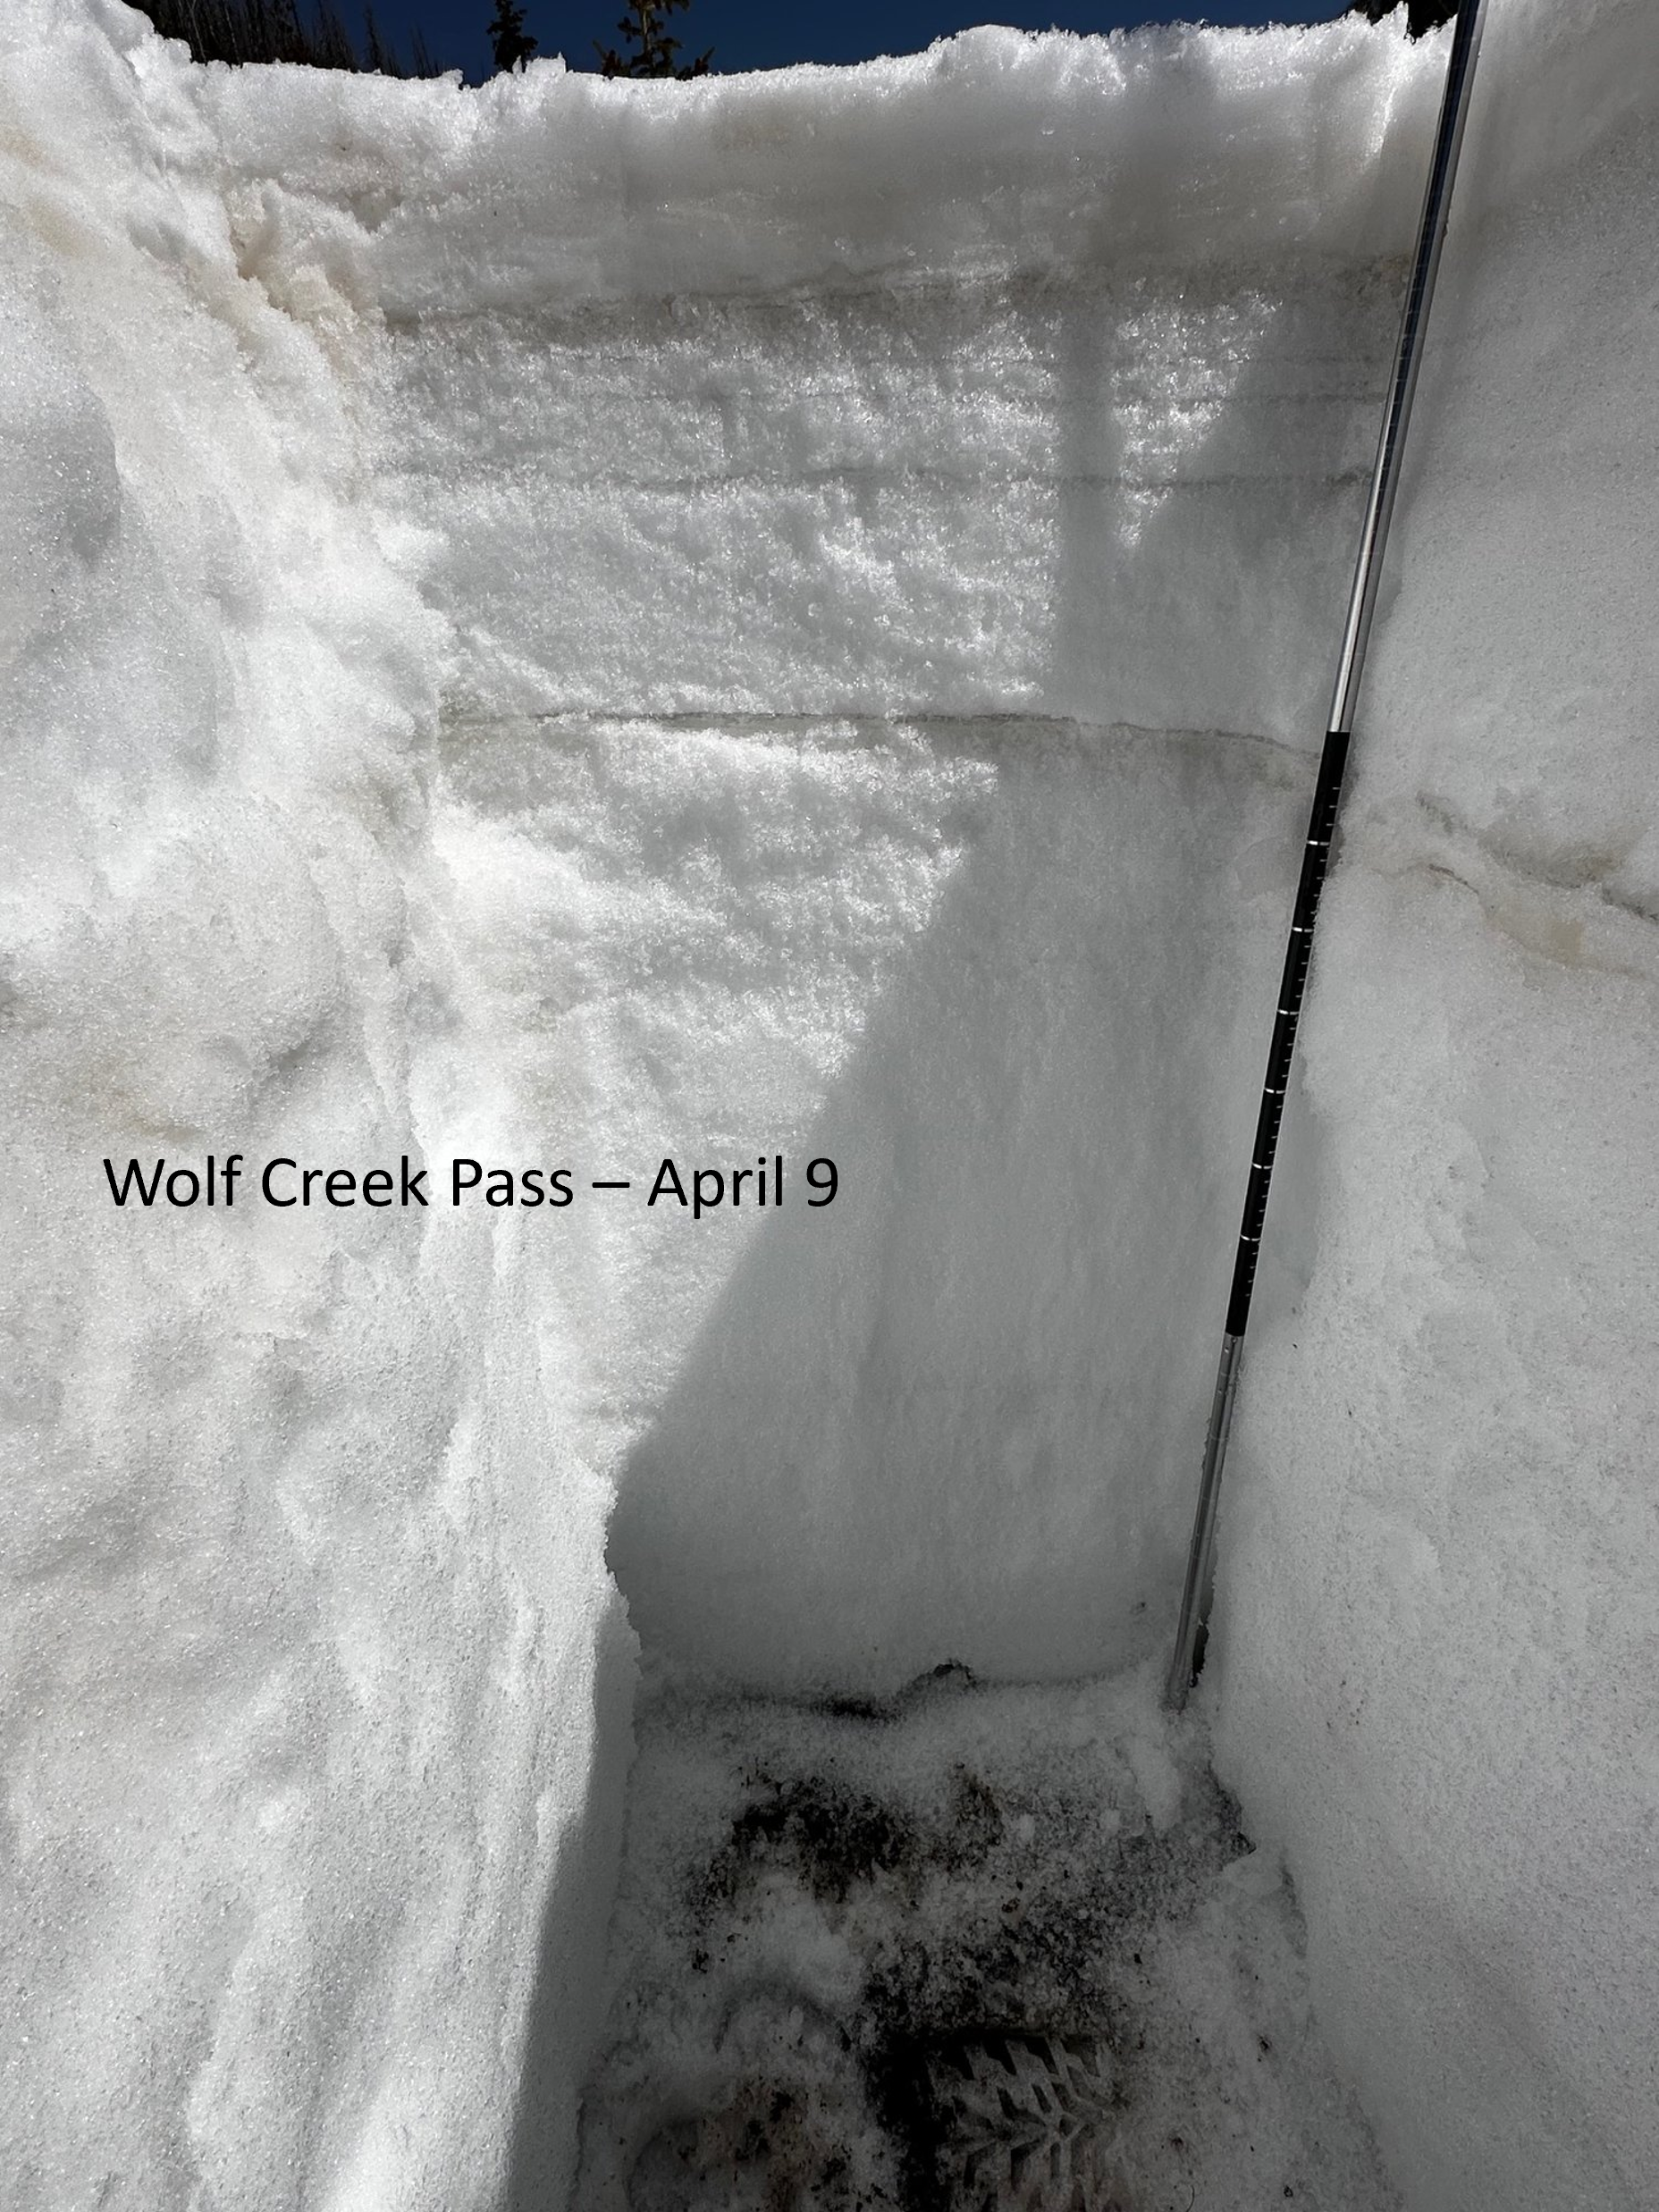
At the time of the first dust-on-snow tour of the season, March, we had only observed one dust event hitting the mountains from the January event. The distribution of this dust was somewhat typical. Generally, the southern mountains pick up quite a bit more dust. During our March CODOS tour, two southern sites had two established dust layers (Swamp Angel, Wolf Creek) while some of our central mountains (McClure, Grizzly and Hoosier) had faint dust evident. The northern sites’ snowpacks were dust-free, as was Grand Mesa, the western-most central site.
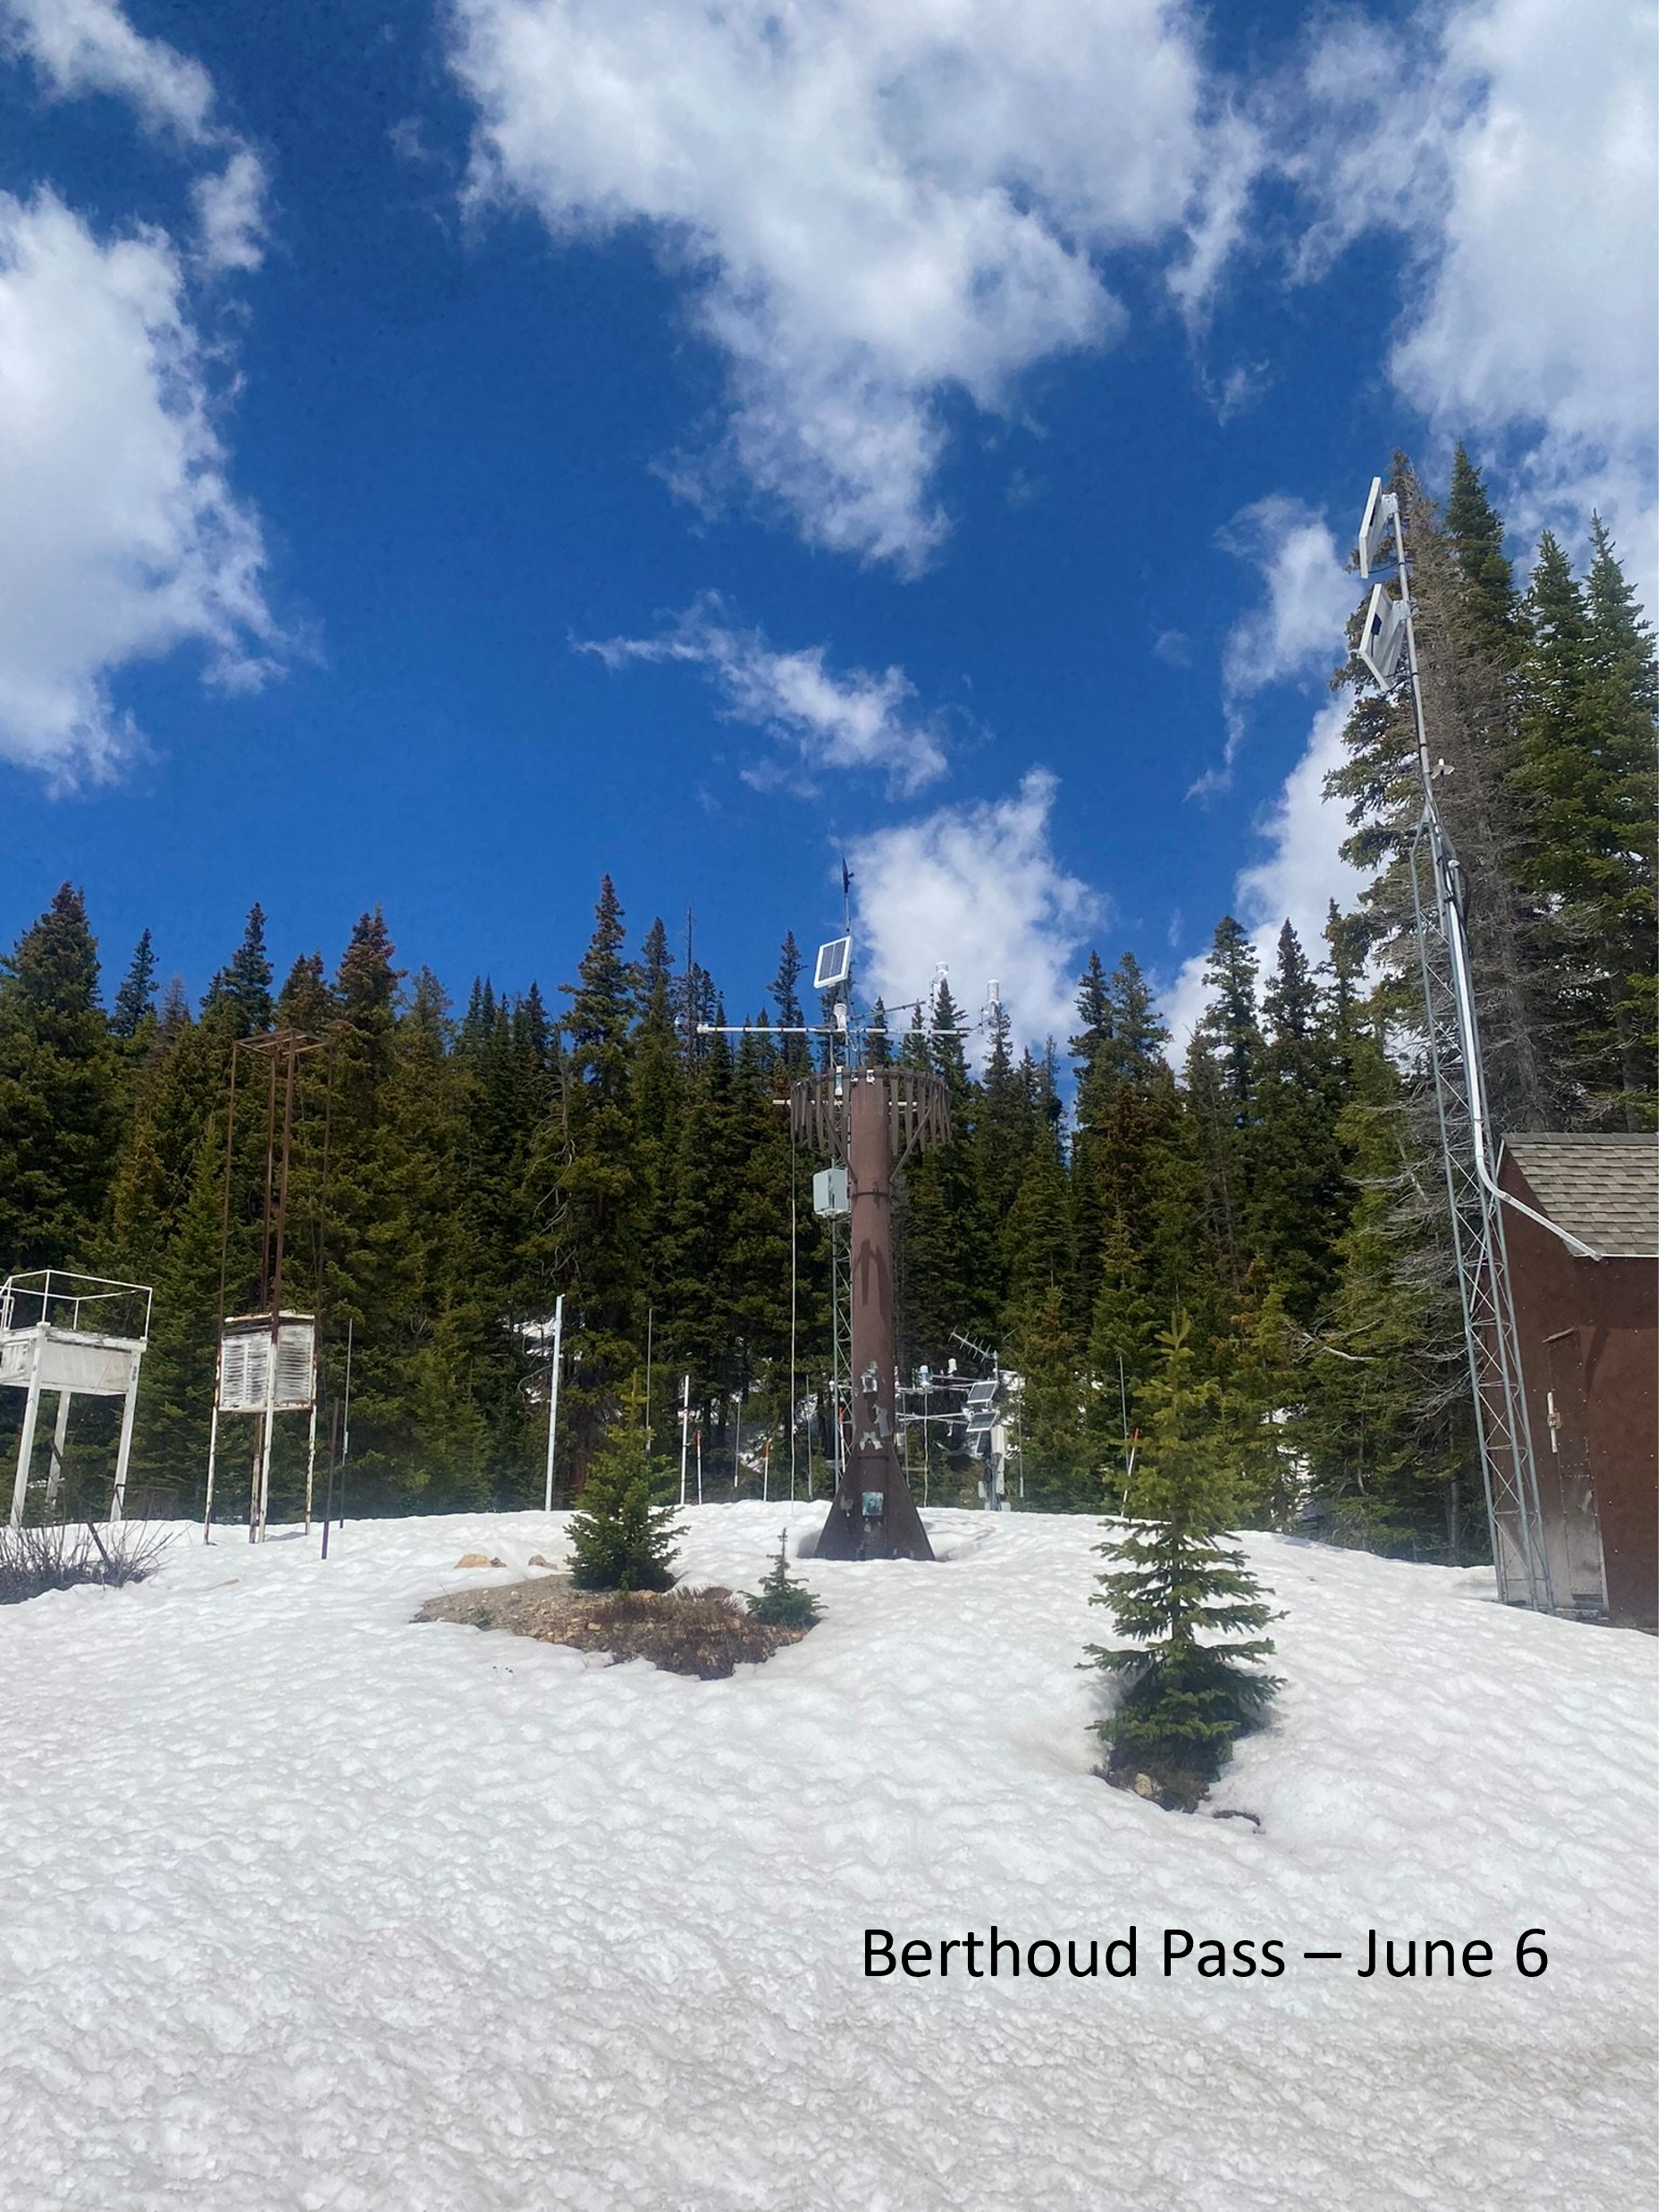
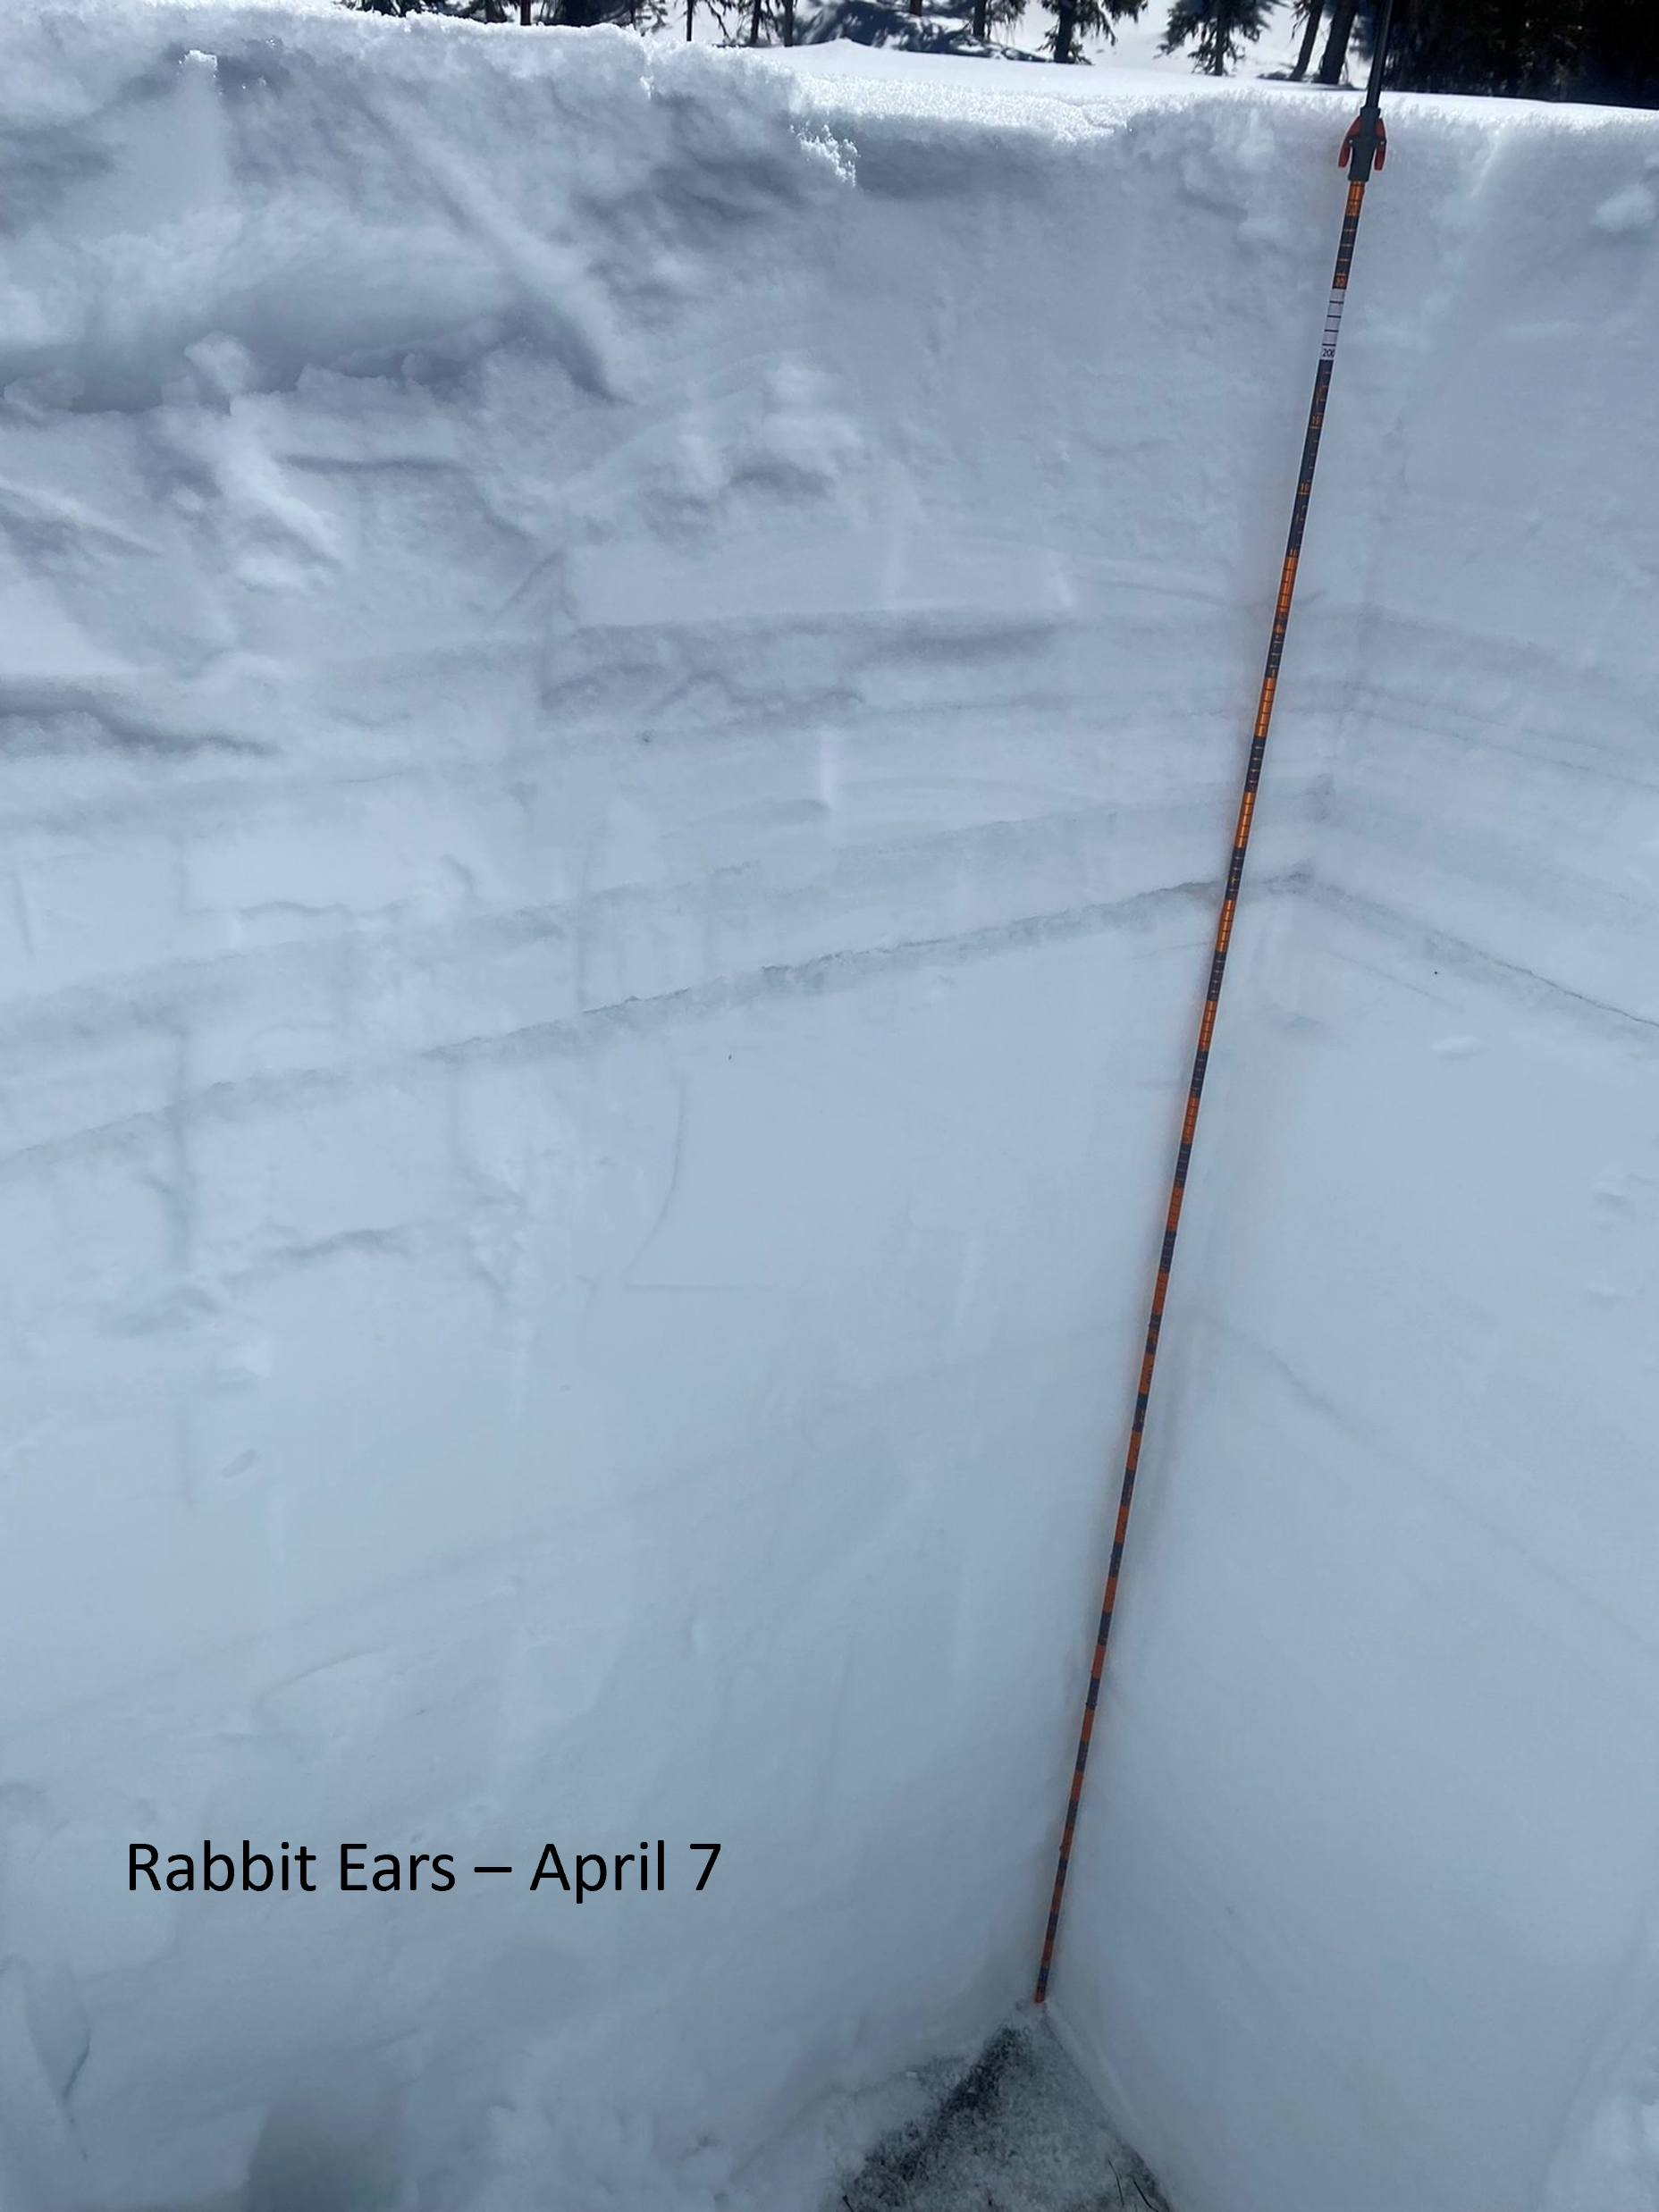
After the first week in April with all three dust events of the season under our belt, all southern sites had light dust, with Wolf Creek and Swamp Angel still the most significant, though still mild compared to what we’ve seen in the past. Berthoud Pass in the central mountains remained dust-free, while Grand Mesa, Grizzly, and Hoosier all had one dust layer mid-snowpack and McClure had dust 2” below the surface of a shallow snowpack. In the northern mountains, Rabbit Ears had two layers, one 42” below the surface, which was perhaps a consolidated layer from earlier in the season that wasn’t visible before, and another very mild dust presence 11” below the surface. Willow Creek, east of Rabbit Ears by thirty miles or so, had no visible dust.
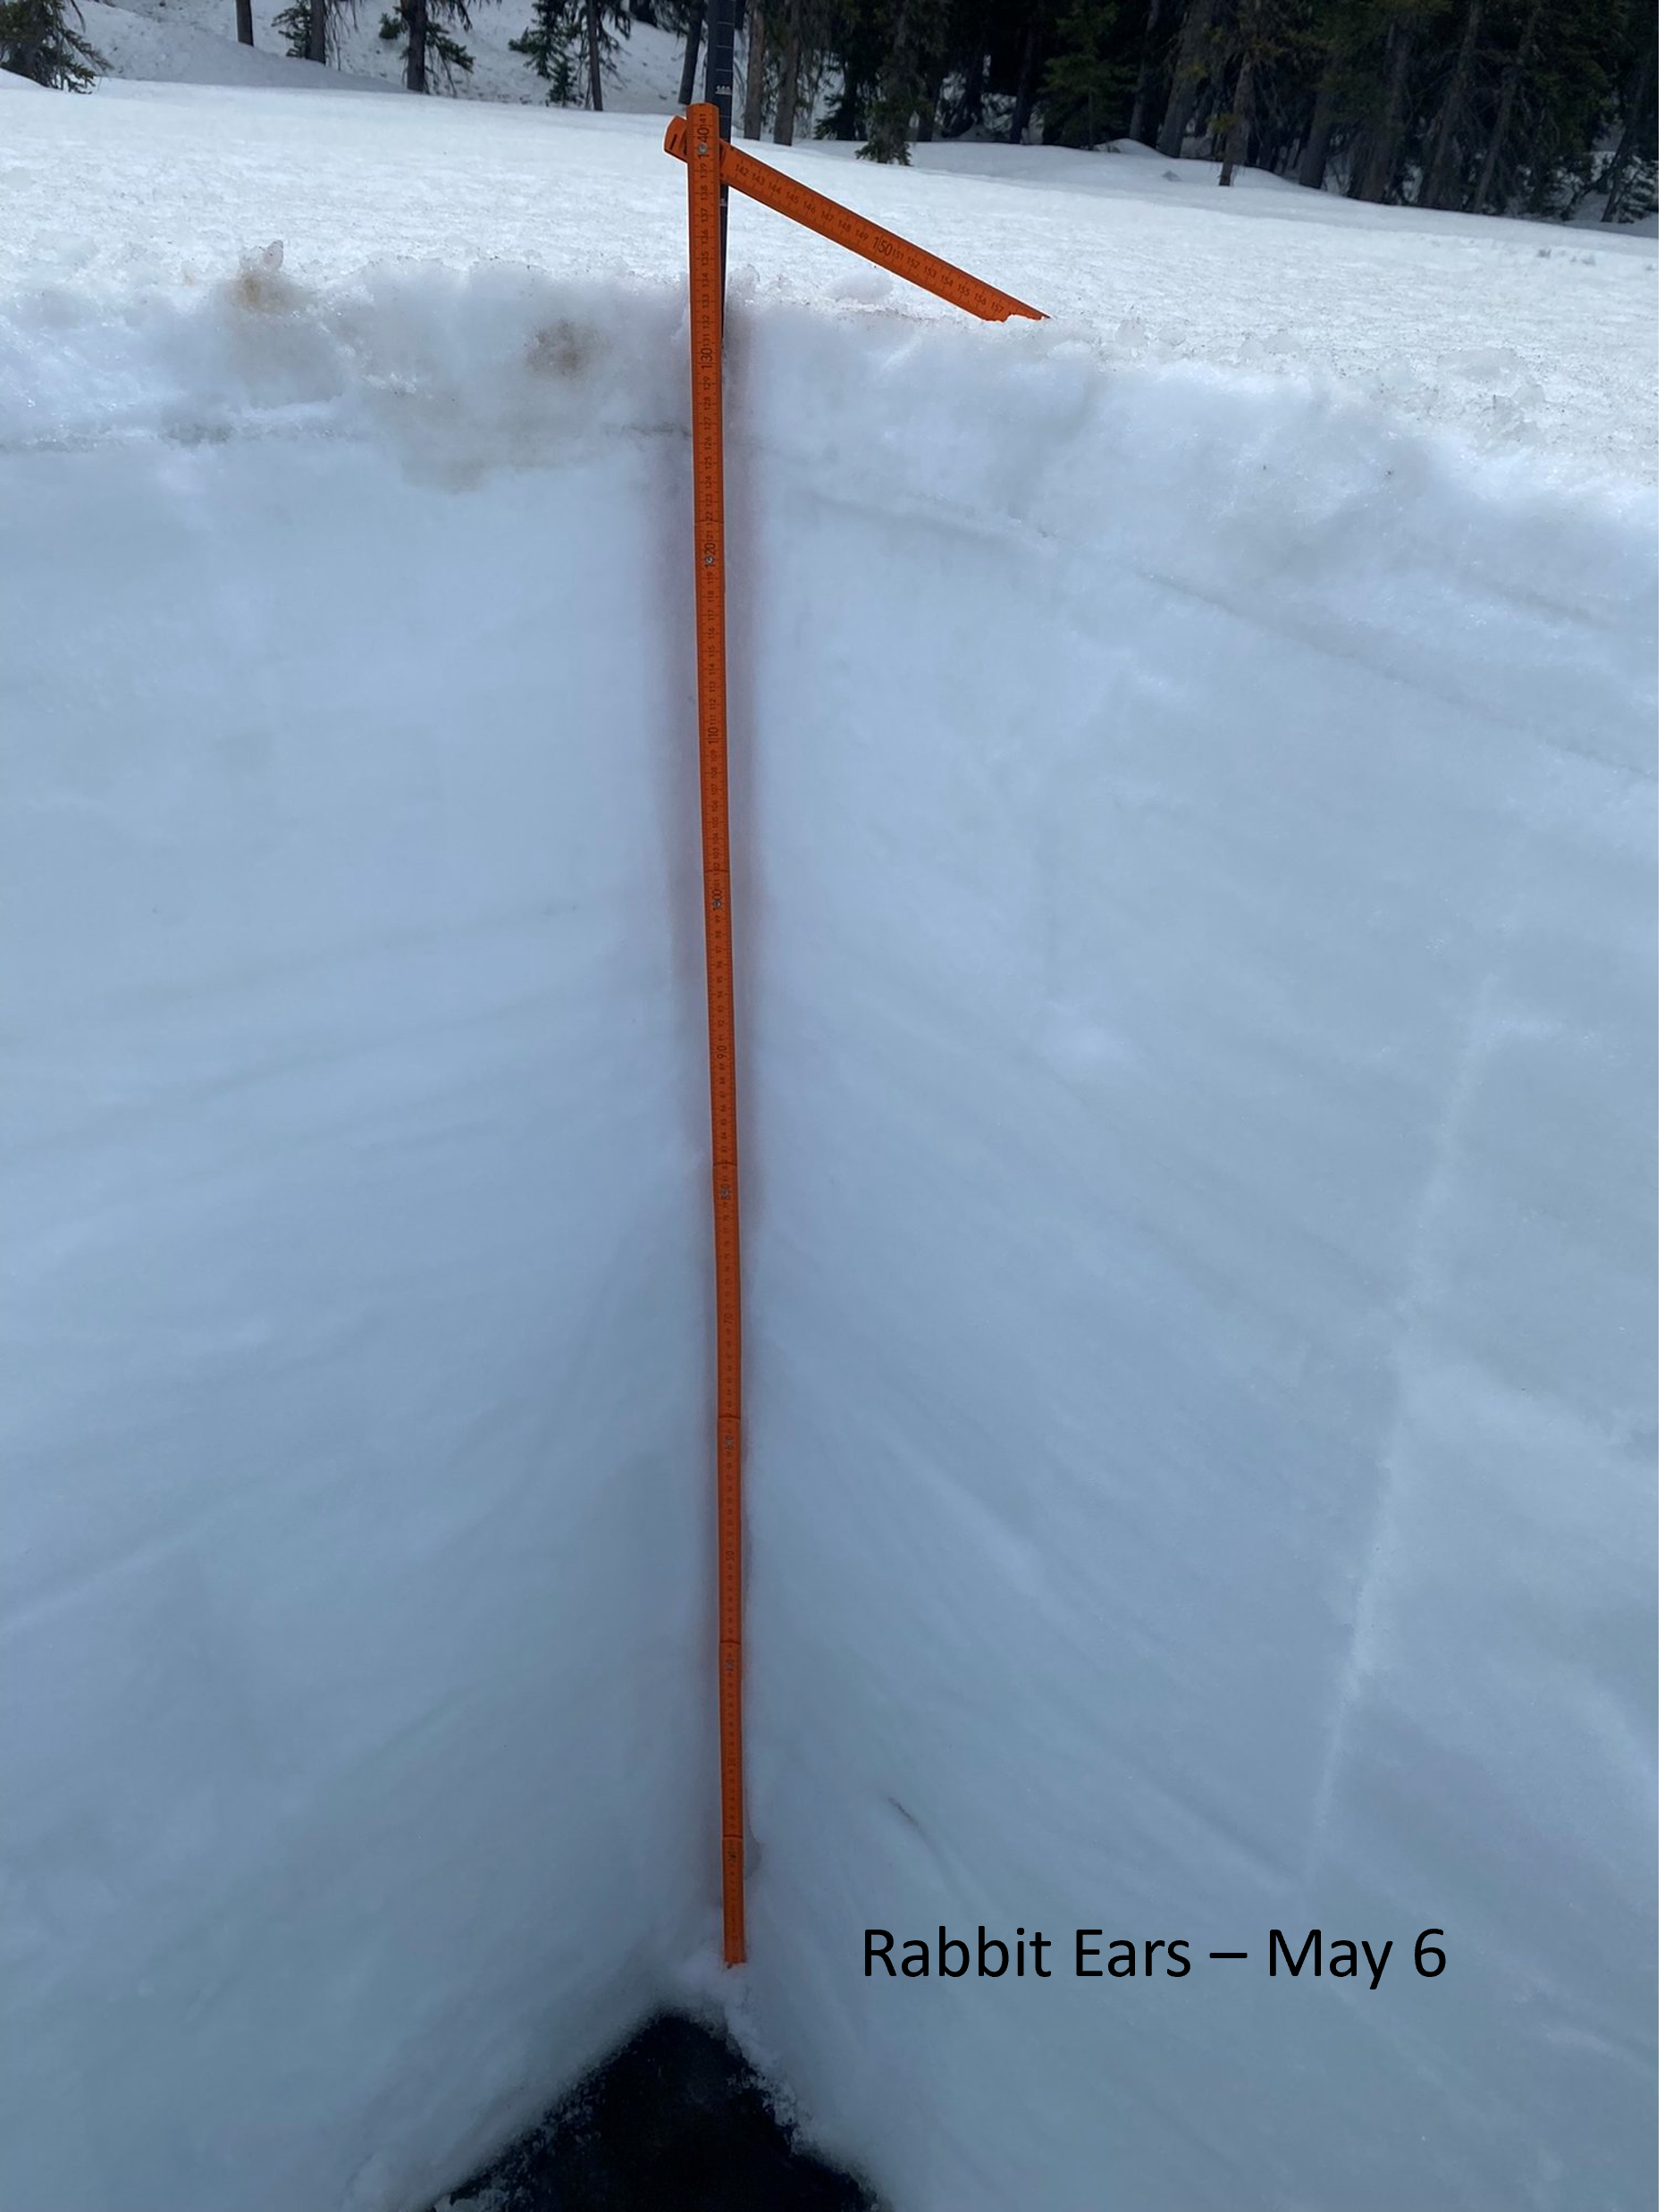
Warm temperatures made our May CODOS tour less exciting – due to no snow, no pits were dug at Wolf Creek, Spring Creek, Park Cone, and McClure, though we sampled merged dust at the surface of the snow in the remaining patches. Grand Mesa and Hoosier had dust layers merged at the surface, while the snowpacks of Berthoud and Grizzly enjoyed a fresh topping from a May snowstorm, where we found the merged dust layers below the new storm slabs of 29” and 15”, respectively. Rabbit Ears still had mild dust mid-pack, and holding, but missed out of the surface refresh.
March CODOS Summary
Swamp Angel had one dust layer from the January 31st storm at about 29” below the snow surface
Park Cone no dust observed
Spring Creek no dust observed
Wolf Creek had two mild dust layers
Grand Mesa no dust observed
McClure had faint dust 2” below the surface of a 31” deep snowpack
Hoosier had faint dust 12” below the surface
Grizzly Peak had faint dust 24” below the surface
Berthoud no dust observed
Willow Creek no dust observed
Rabbit Ears no dust observed and over 6’ of snow
April CODOS Summary
Swamp Angel had dust 34” below the surface, another layer at 18” below the surface, and a lighter layer at 11” below surface
Park Cone had light dust/debris at the surface
Spring Creek had very light surface dust
Wolf Creek had two darker dust layers, and a shallow pit for this time of year
Berthoud Pass no dust observed
Grand Mesa had one dust layer about 16” below surface
Grizzly had mild dust about 29” below the surface
Hoosier Pass had mild dust about 15” below the surface
McClure Pass had dust 2-3” below the surface
Rabbit Ears had one layer 42” below the surface (perhaps a consolidated layer from earlier in the season that wasn’t visible before) and another very mild 11” below the surface
Willow Creek no dust observed
May CODOS Summary
Wolf Creek was melted out
Spring Creek was melted out
Park Cone was melted out
Grand Mesa had a dusty surface
McClure was melted out
Hoosier Pass had dust layers merged at the surface, pretty mild
Berthoud Pass had mild dust layer below the storm slab at 14” depth
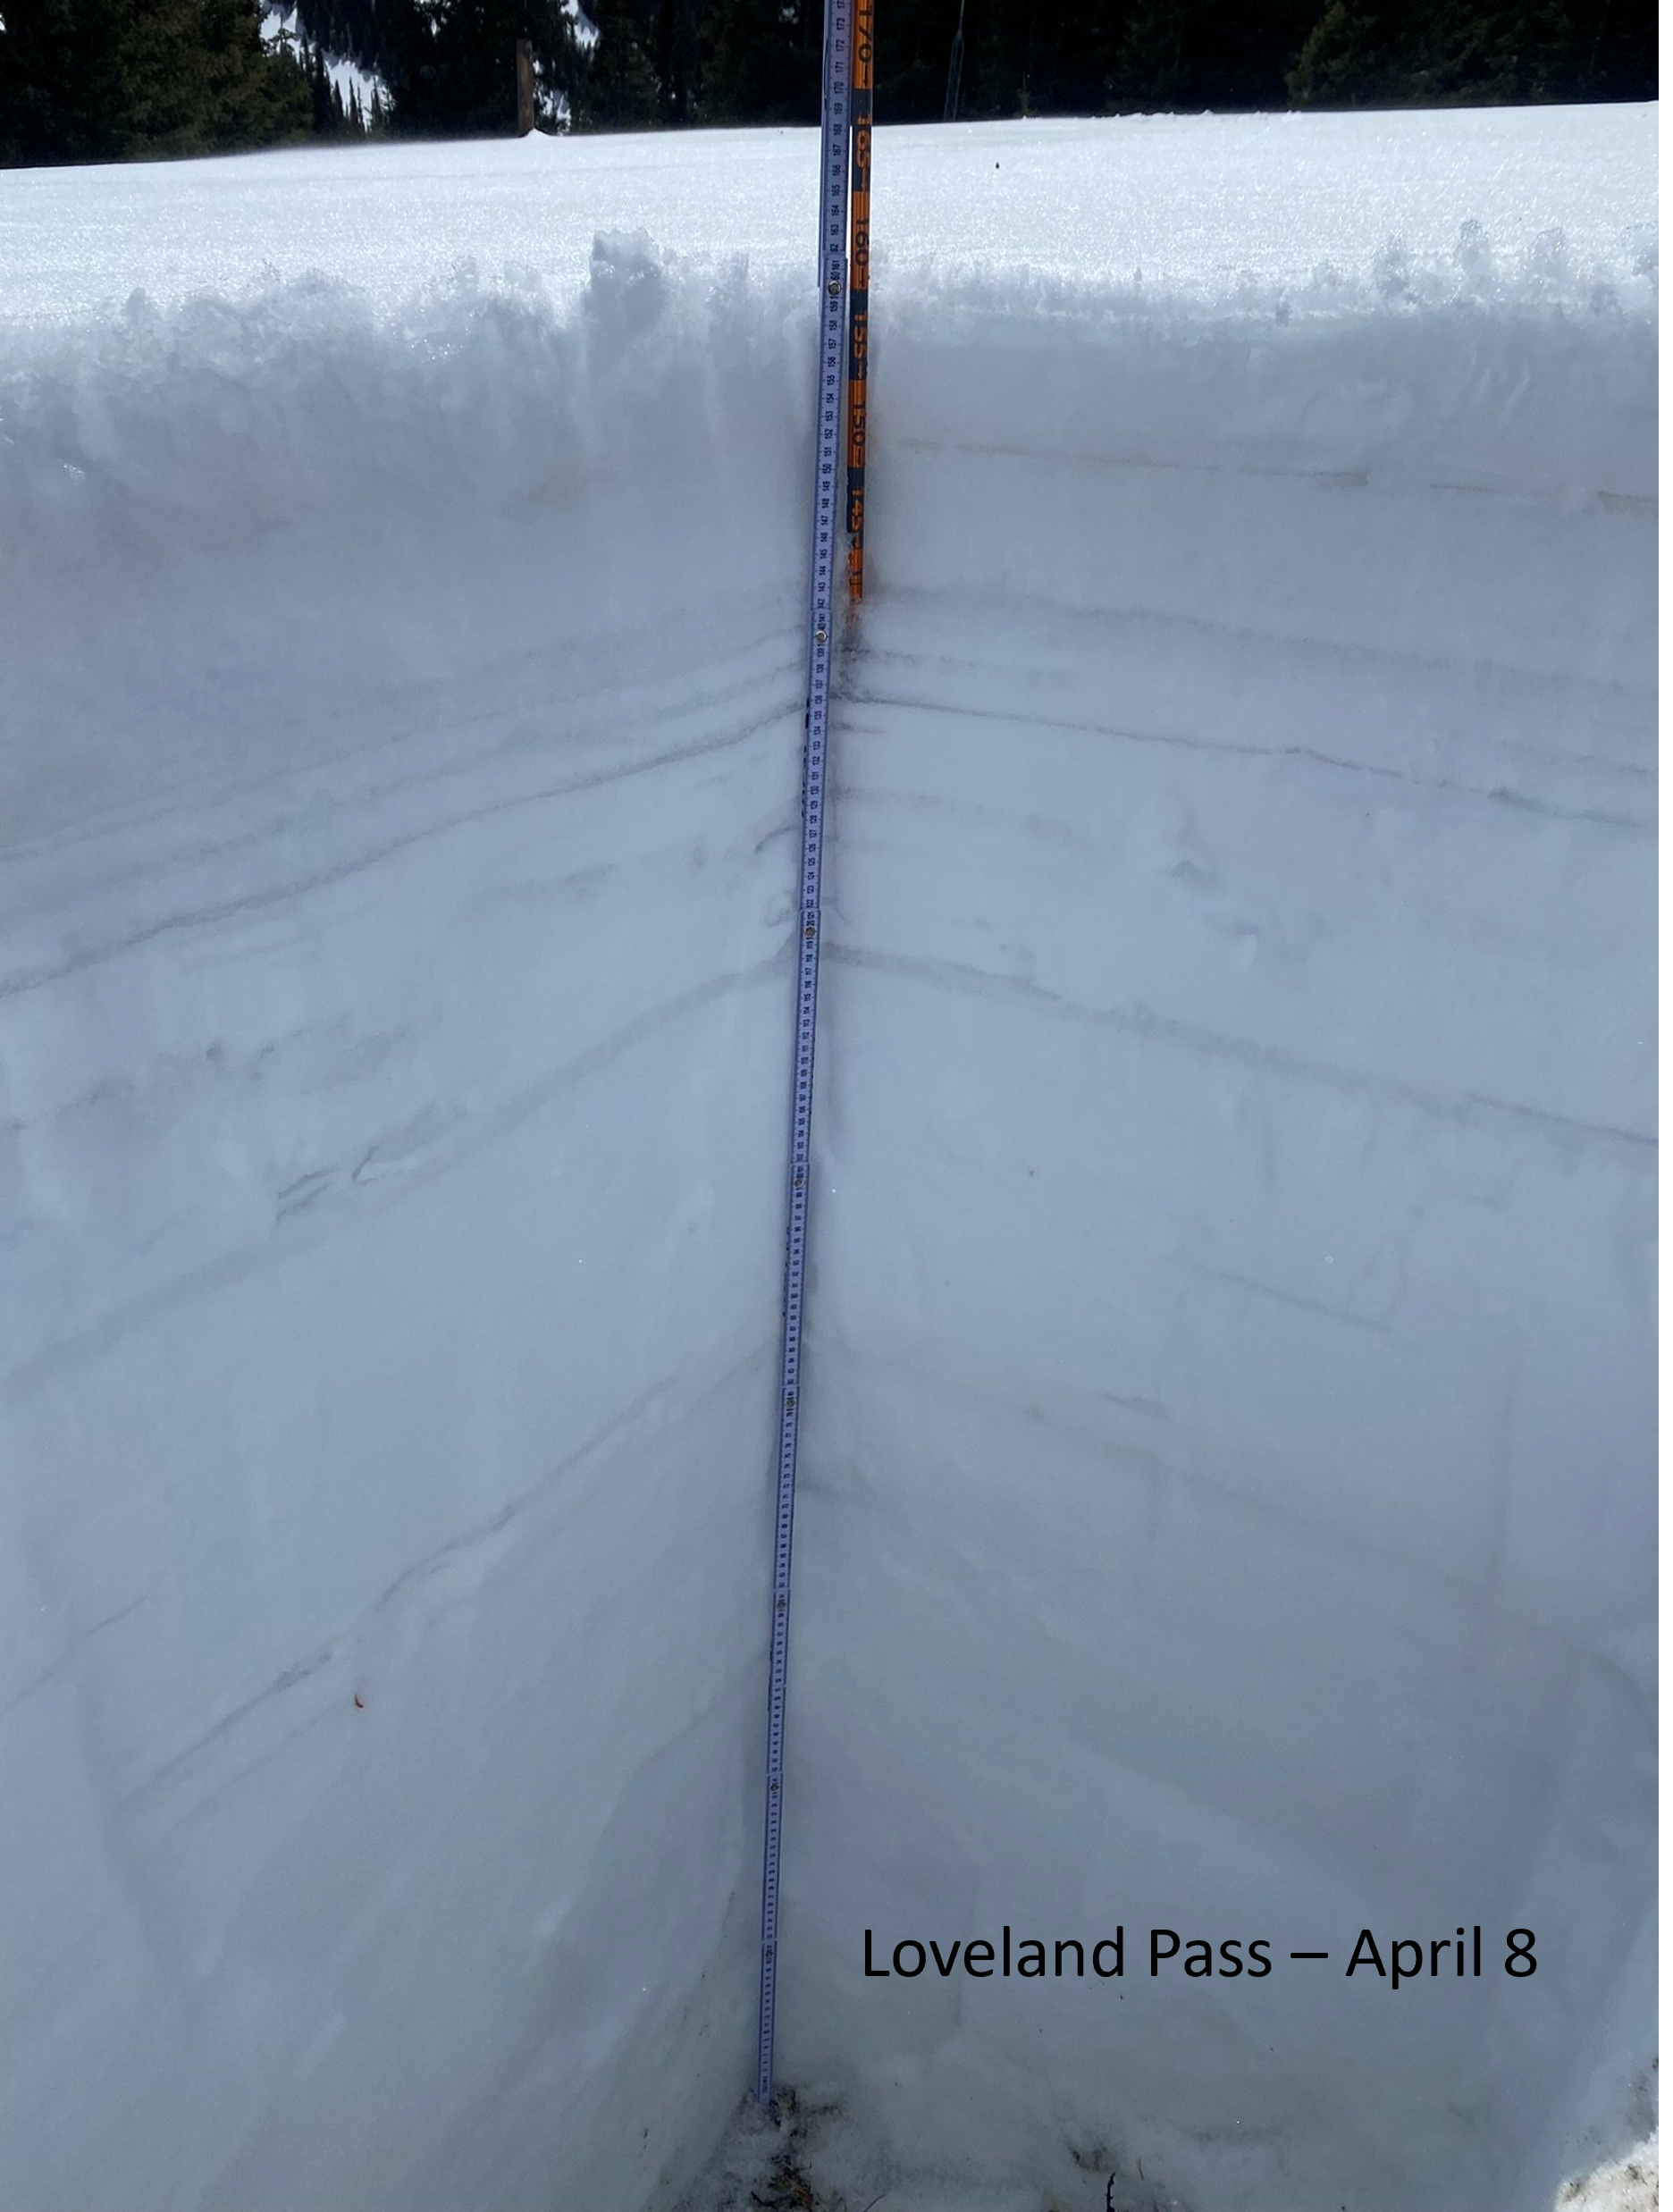
Loveland Pass had dust under new snow at 10” below surface
Willow Creek had patchy snow, none at our site
Rabbit Ears had mild dust mid-pack
Above: Total dust-on-snow events by month. March begins the more intensive part of dust-on-snow season. In WY2025, we saw dust events occur on January 25-26th, March 18, and April 1.
Above: Total dust-on-snow events by year. Two dust events in 2024/2025 were “wet” events and none were “dry” events. Wet means the dust came in with precipitation. Dry means it arrived without precipitation.
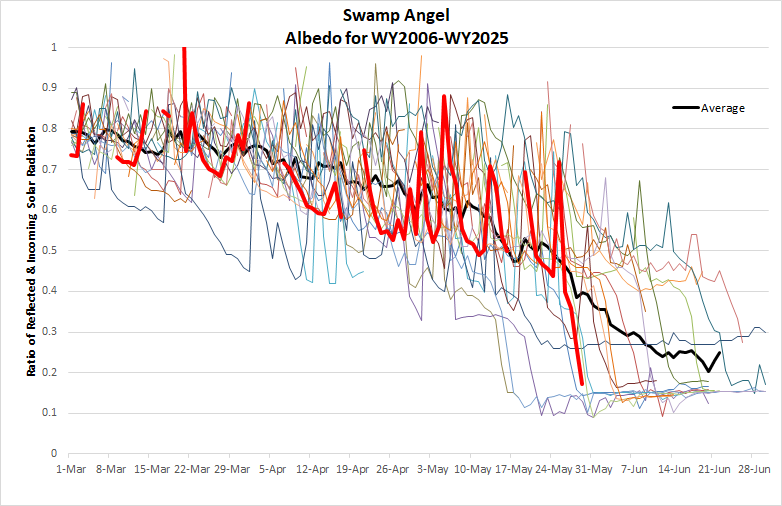
Below: Snow season albedo since 2006. Albedo can vary greatly depending on dust severity and precipitation events. WY2025 (red line) was “lower-end-of-average” for dust severity conditions at Senator Beck. Precipitation events, however light, were rather frequent in spring which helped keep fresh snow (as well as cloud cover) on the surface and minimized dust radiative forcing.
RUNOFF BEHAVIOR
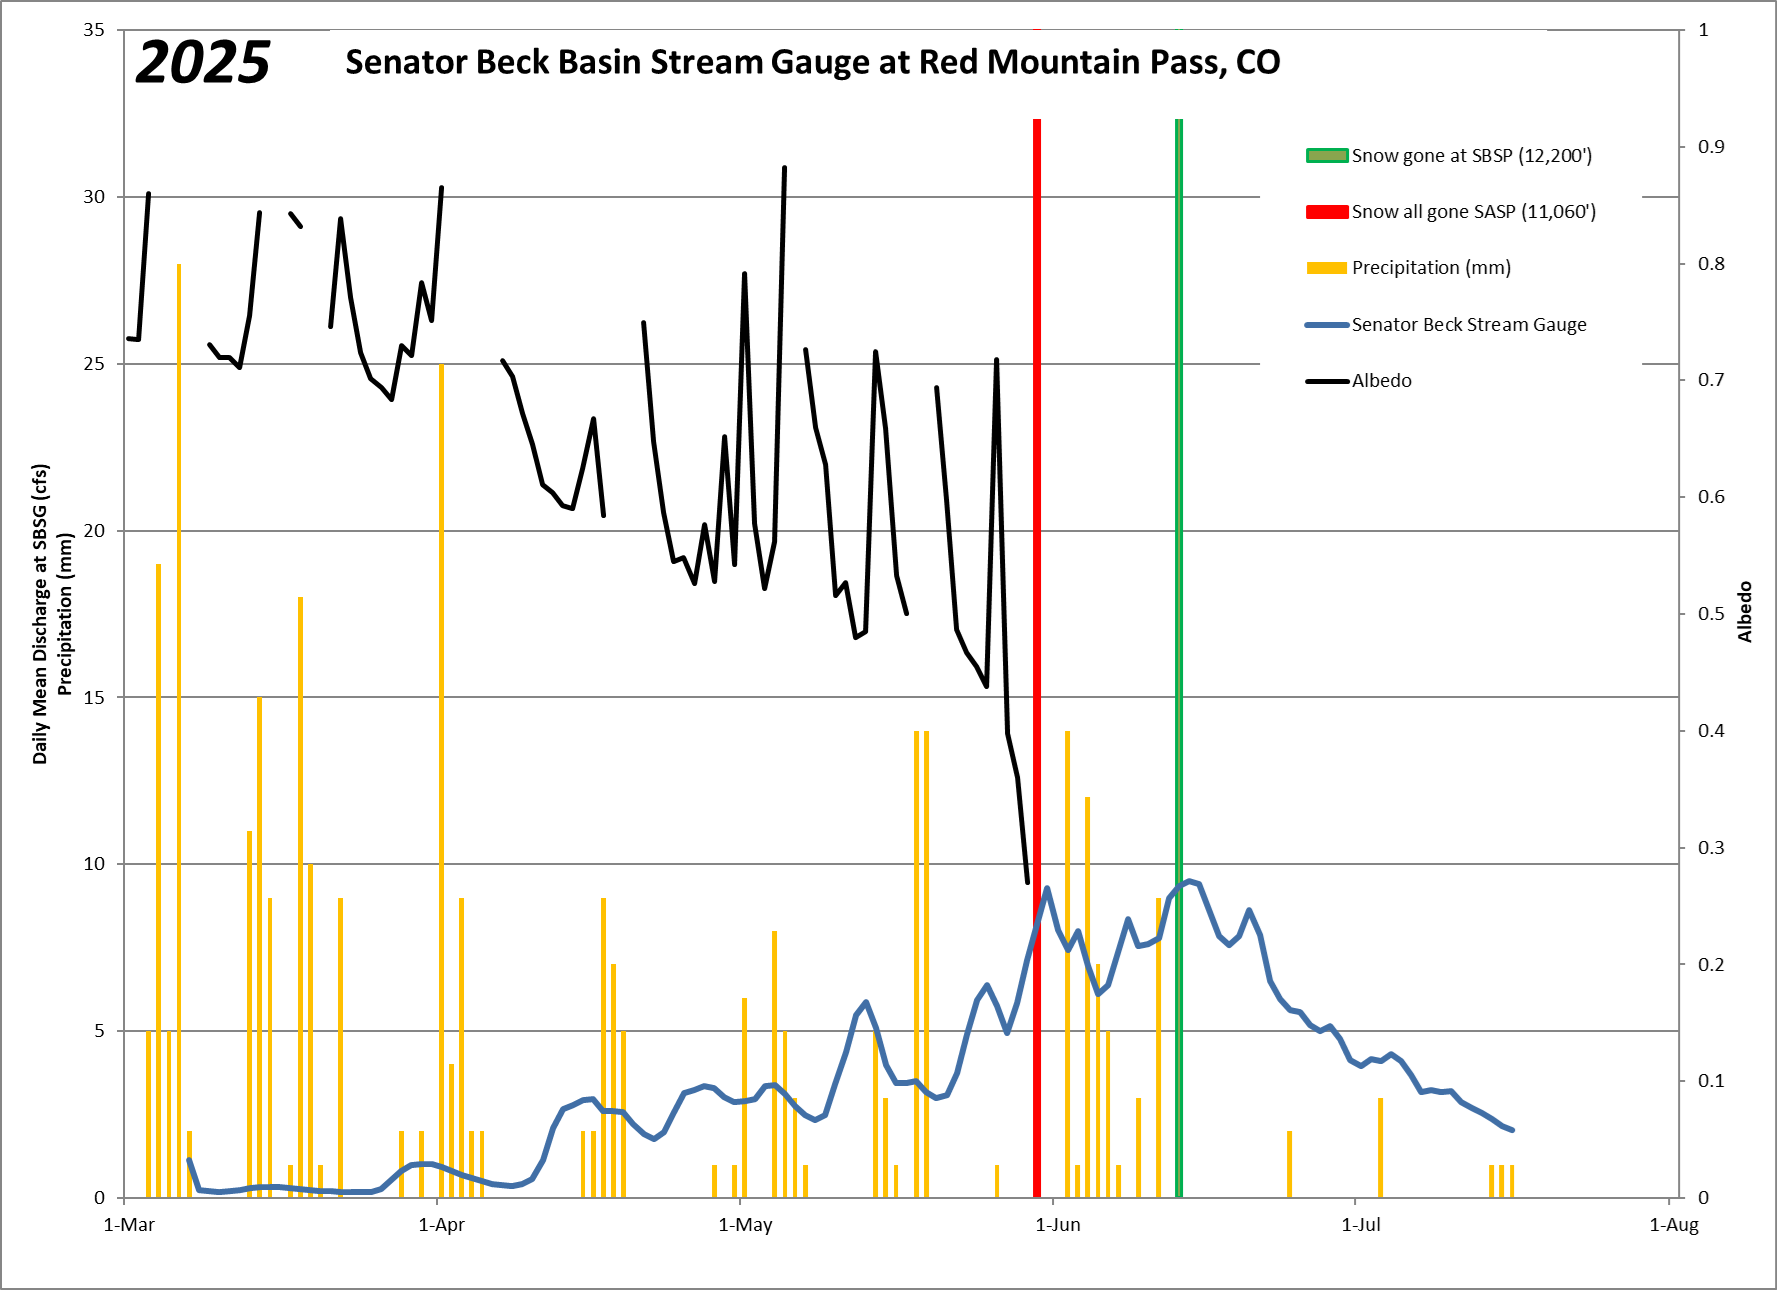
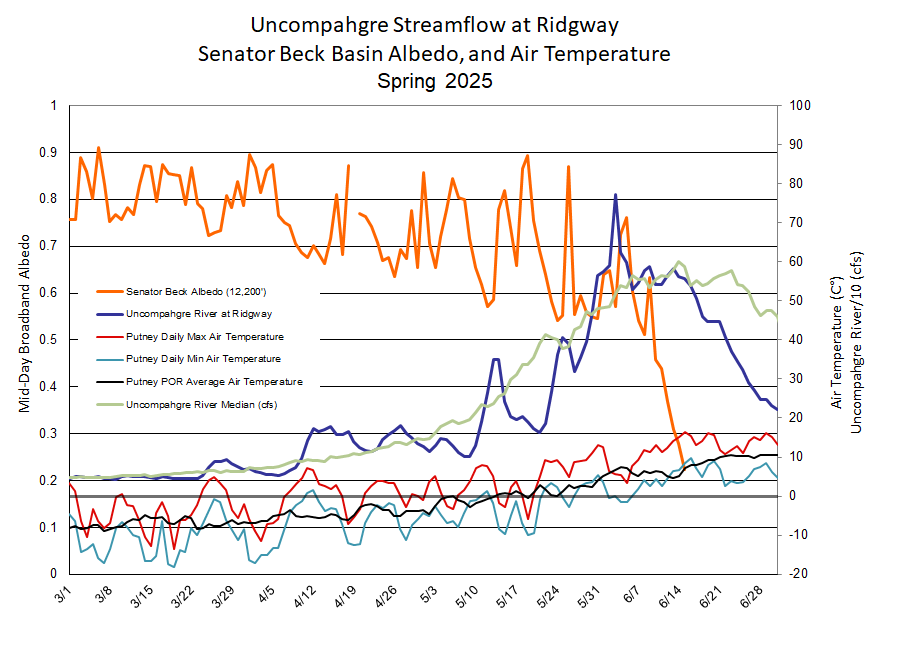
Snowpack and dust-on-snow conditions set the stage for streamflow come springtime, and weather conditions dictate how it unfolds. As has been the case for the last several years now, a big question was just how much a hot and dry April would advance ablation of the snowpack. That month played out with slightly above normal temperatures on average and very dry conditions throughout the state (only two storms at SBB). Lower severity dust-on-snow conditions kept the snowpack in place longer than expected, nonetheless, streamflows saw a solid uptick until mid-month when a modest storm came through and provided an albedo reset and brief cooler temps. A mild storm held things in check the first of May then melt really kicked in with rates of >1”/day. Another mid-month May storm tapped the brakes and dropped streamflows below median. Being mid-May, the snowpack is poised to melt quickly, the well timed storms (albedo resets) and minimum dust conditions already resulted in the snow sticking around longer than expected and streamflows from peaking very early. Nice weather settled in and streamflows ramped up and peaking right around June 3. Many gauges saw a slightly higher peak and/or extended peak due to a rain dominate storm June 4-5. For these reasons the streamflow peak constituted melt out of snow ~11,000’ and below. The higher elevations, still retaining a healthy snowpack in some locations, still had some melting to do. With our Senator Beck weather station being the only one of a small handful of stations above treeline, we knew there was a near normal snowpack up there. The first half of June was wonderfully wet which slowed melt a tad at elevations above treeline. Some higher elevation stream gauges (like SBB) showed sideways movement during this time, but the majority started tapering off. Within a day of snow being gone at the Senator Beck site we saw the high elevation induced peak in our SBB stream gauge, pretty much the same peak Q (9.4 cfs) as when 11,000’ peak occurred. After this, streamflows started receding.
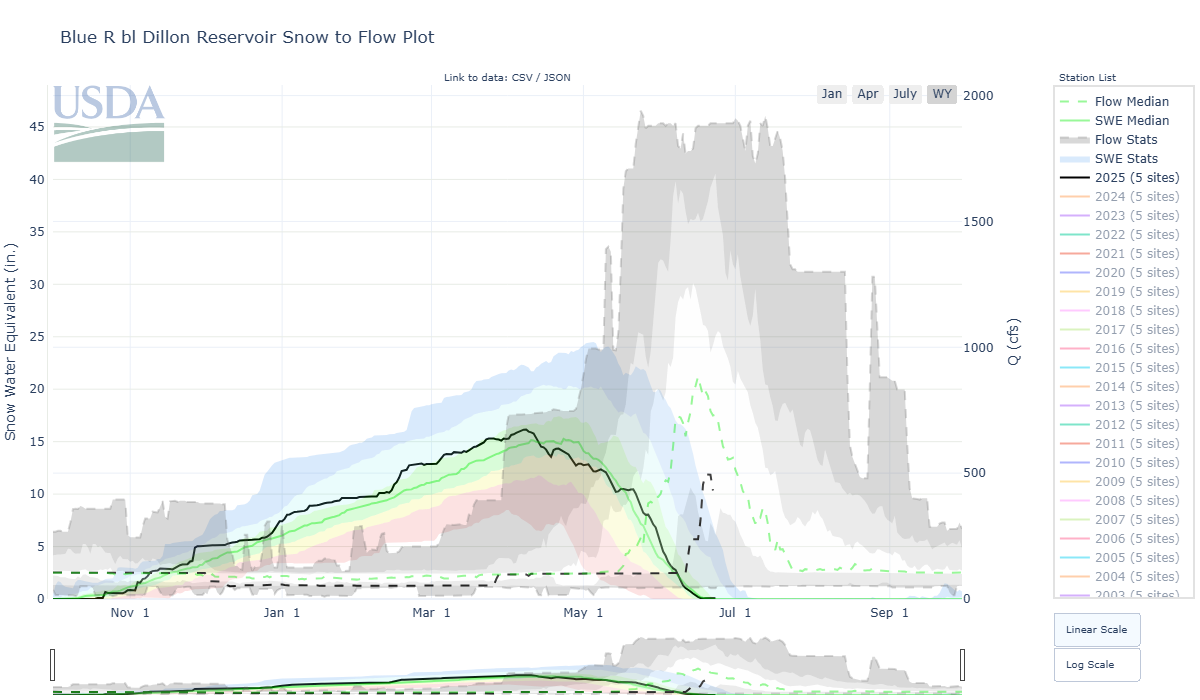
In general, the way snowmelt played out many gauges saw peak timing within a week of median and peak discharge was typically less, or very close, to the median. It is nice the peaks arrived near the normal timeframe, but what is really important is total volume, of course. Since we saw a north/south split in percent normal snowpack conditions, with northern basins faring much better than the southern, it was expected we would also see this split for streamflow volume as well. The northern mountains typically were much closer to normal estimated streamflow volumes than the southern mountains.

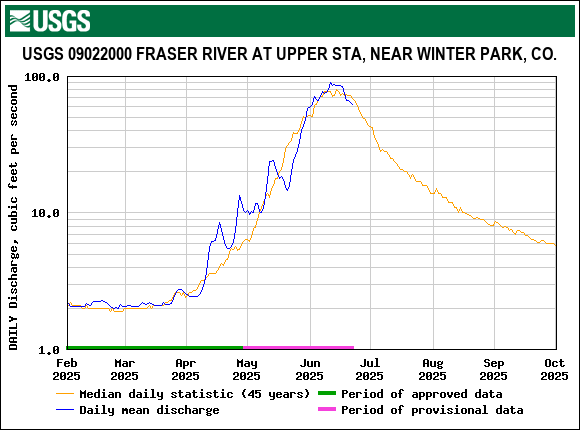
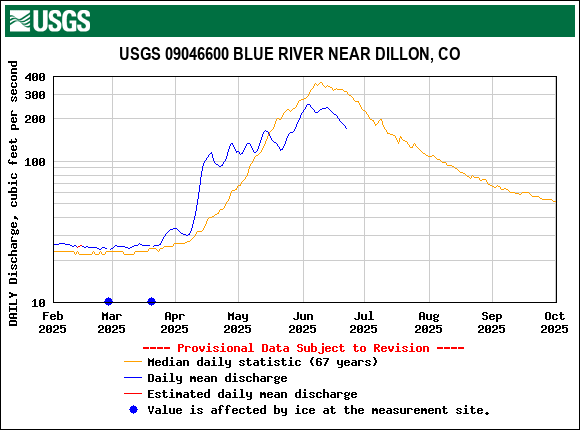
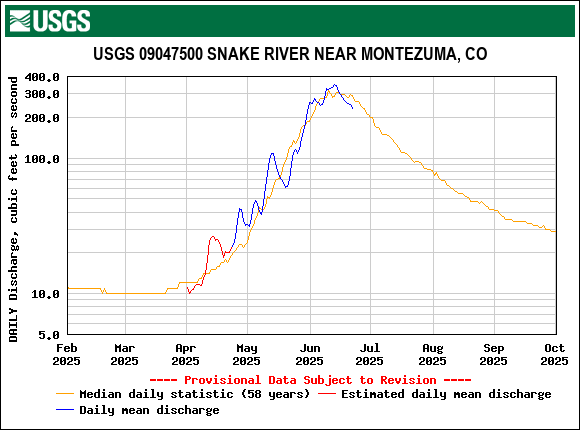
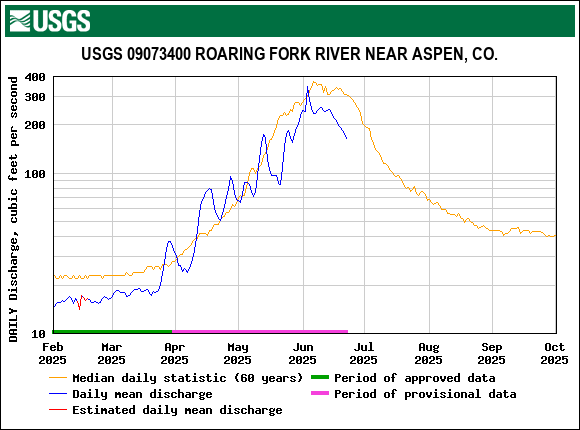
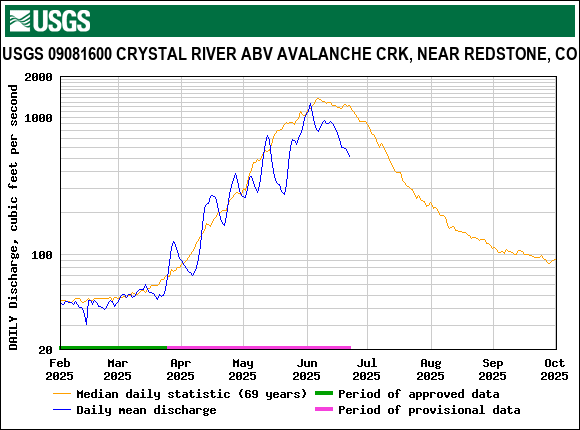
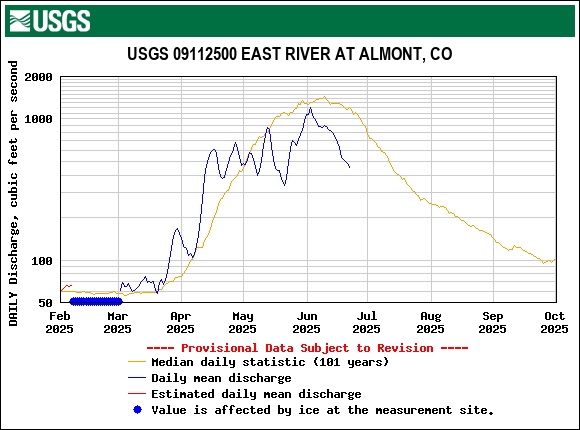


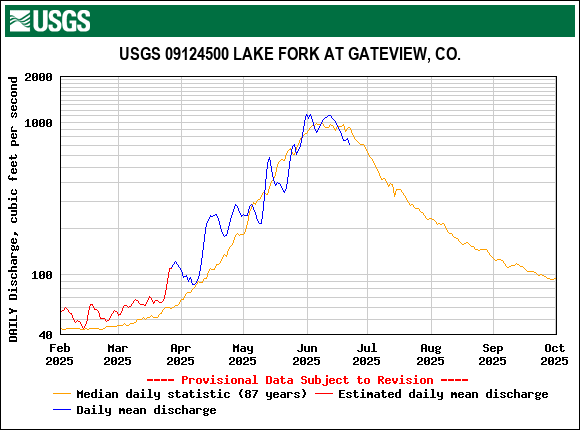
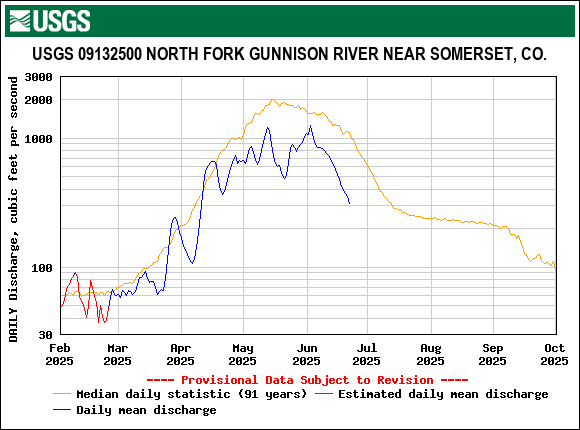
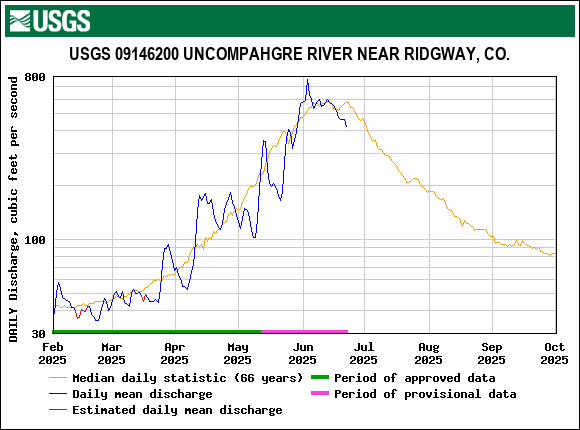

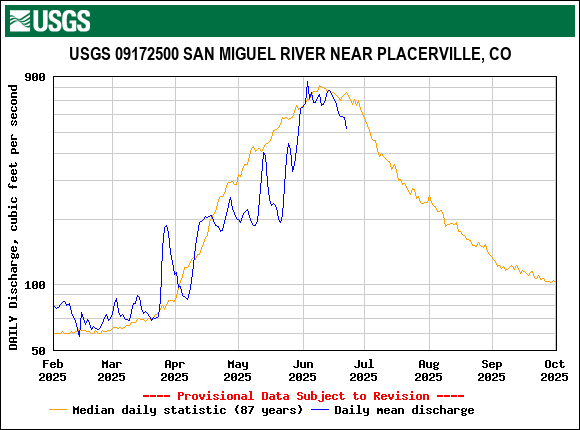
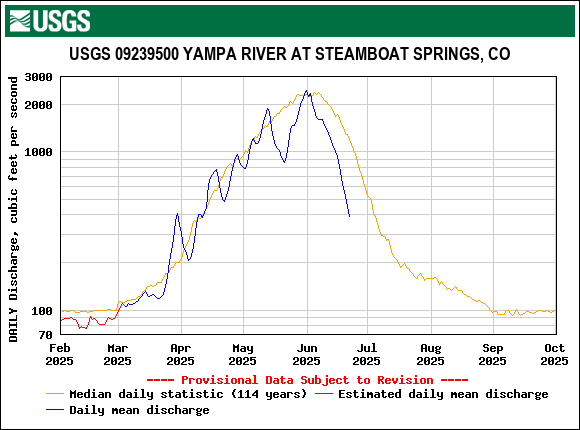
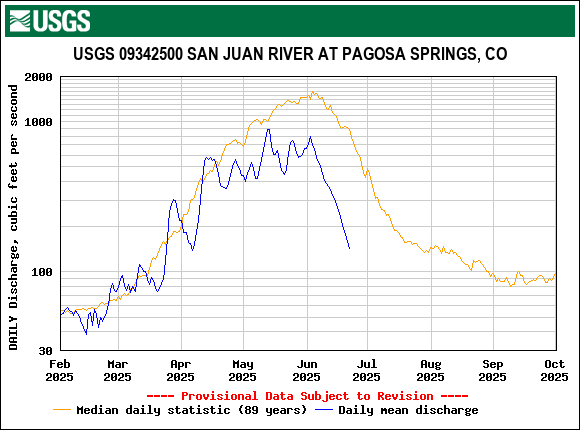
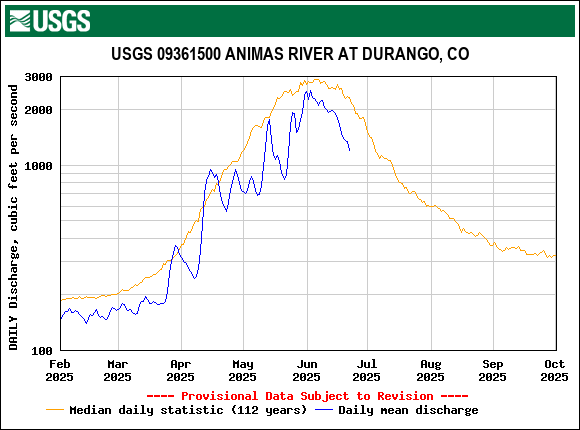
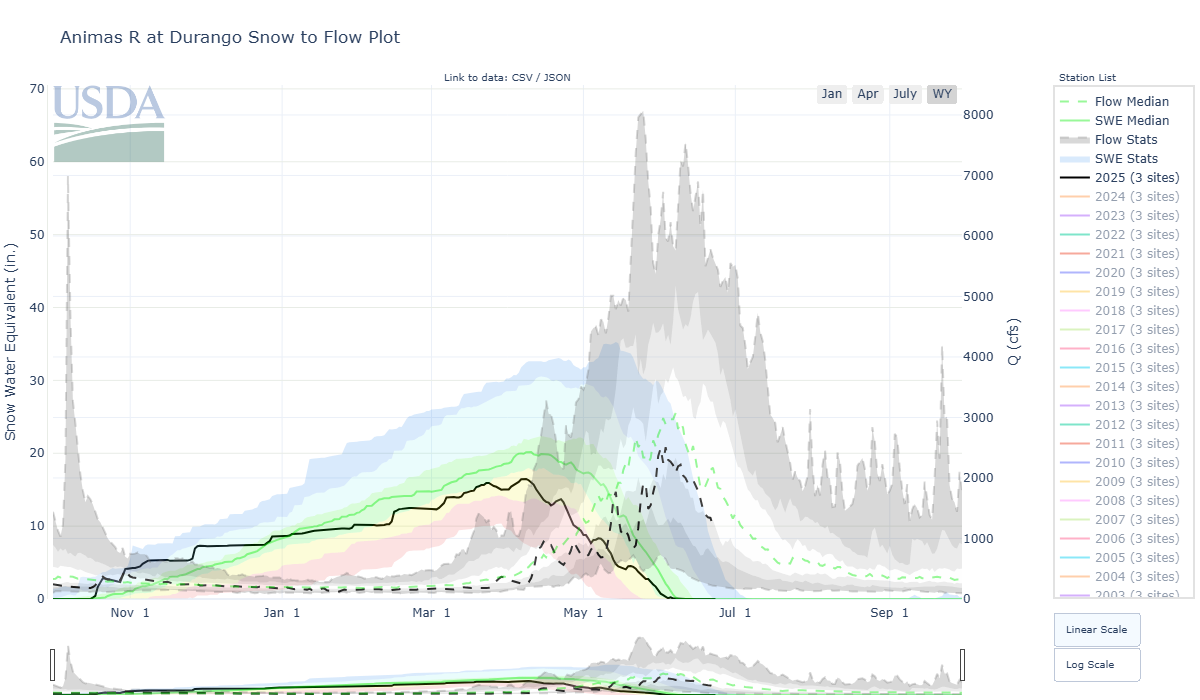
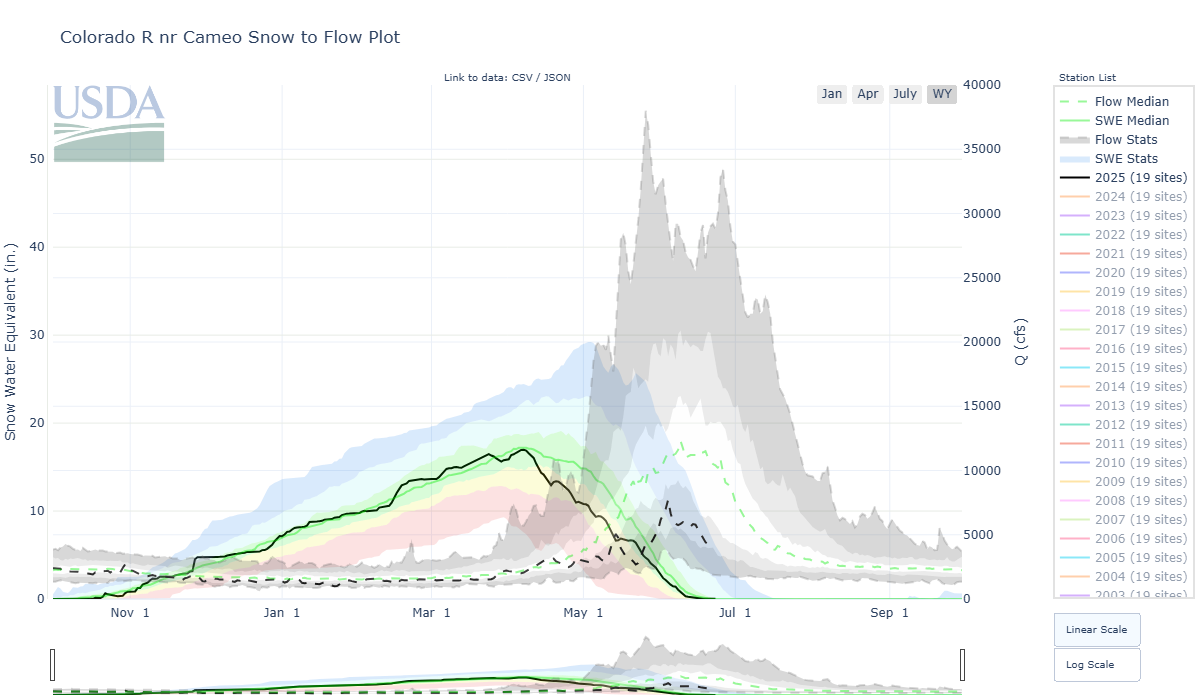

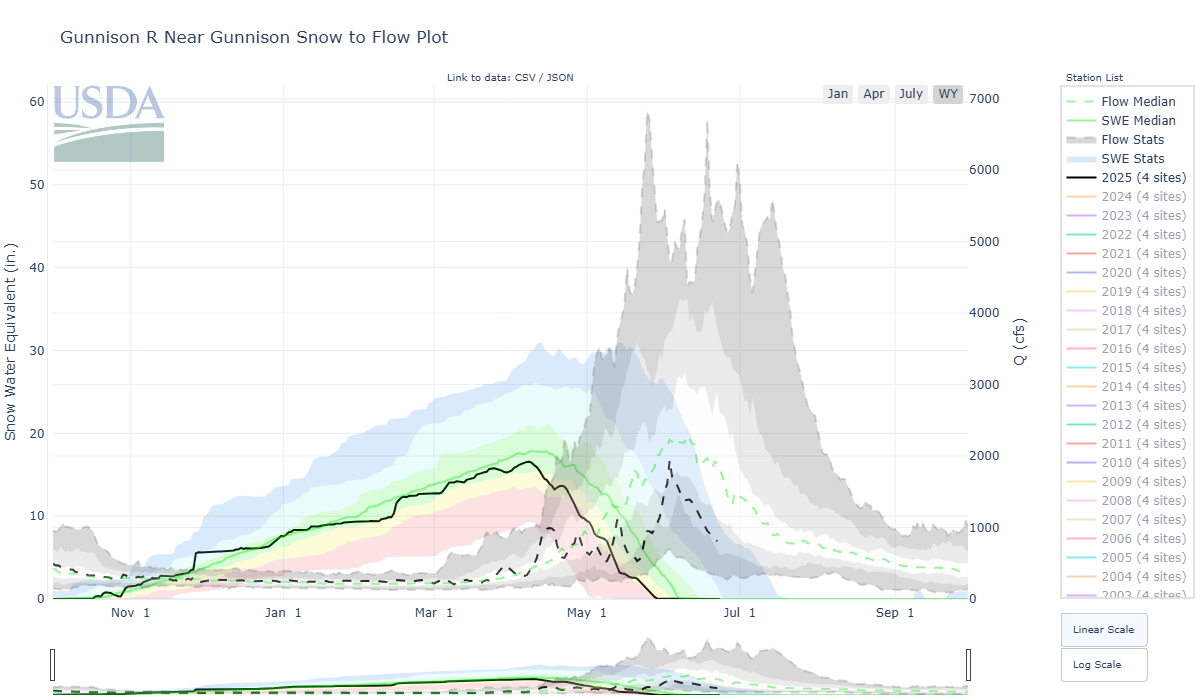

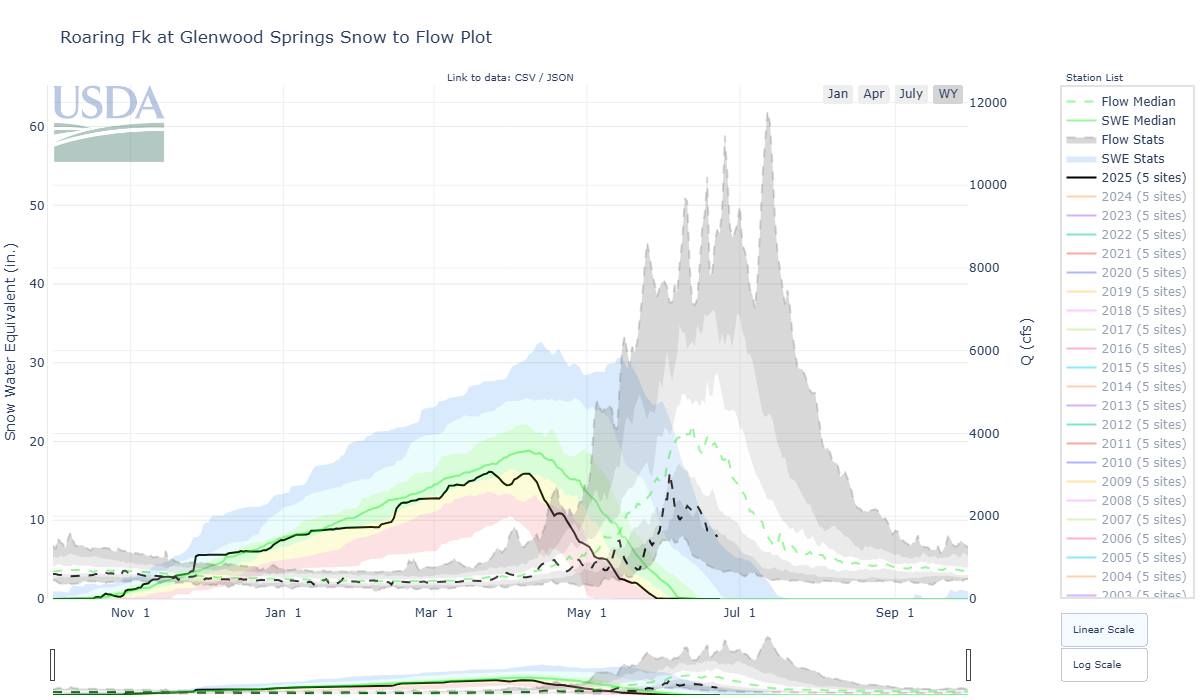

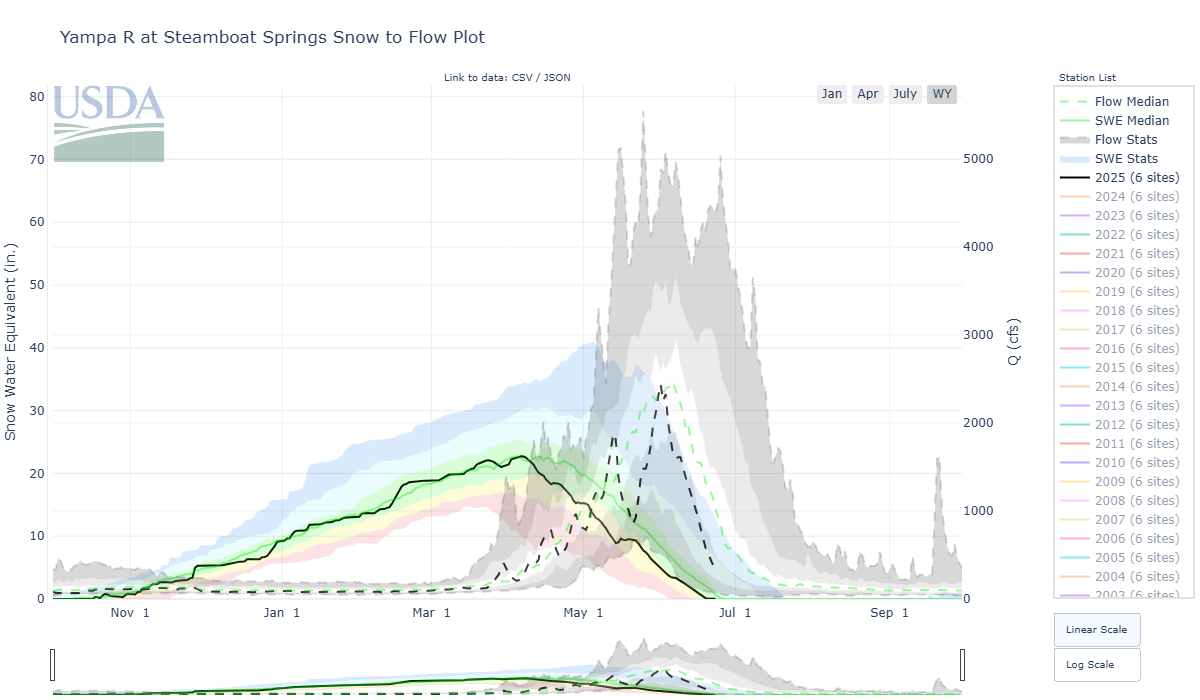


Above: It was a multi-peak season as recorded by many stream gauges. A skimpy snowpack towards the south kicked into the melt phase rapidly due to a dry and sunny April. Timely albedo resets in May and a wet start to June dampened snowmelt rates due to hampered incoming solar radiation, prolonged the melt of a meager snowpack until closer to the normal melt-out timeframe.
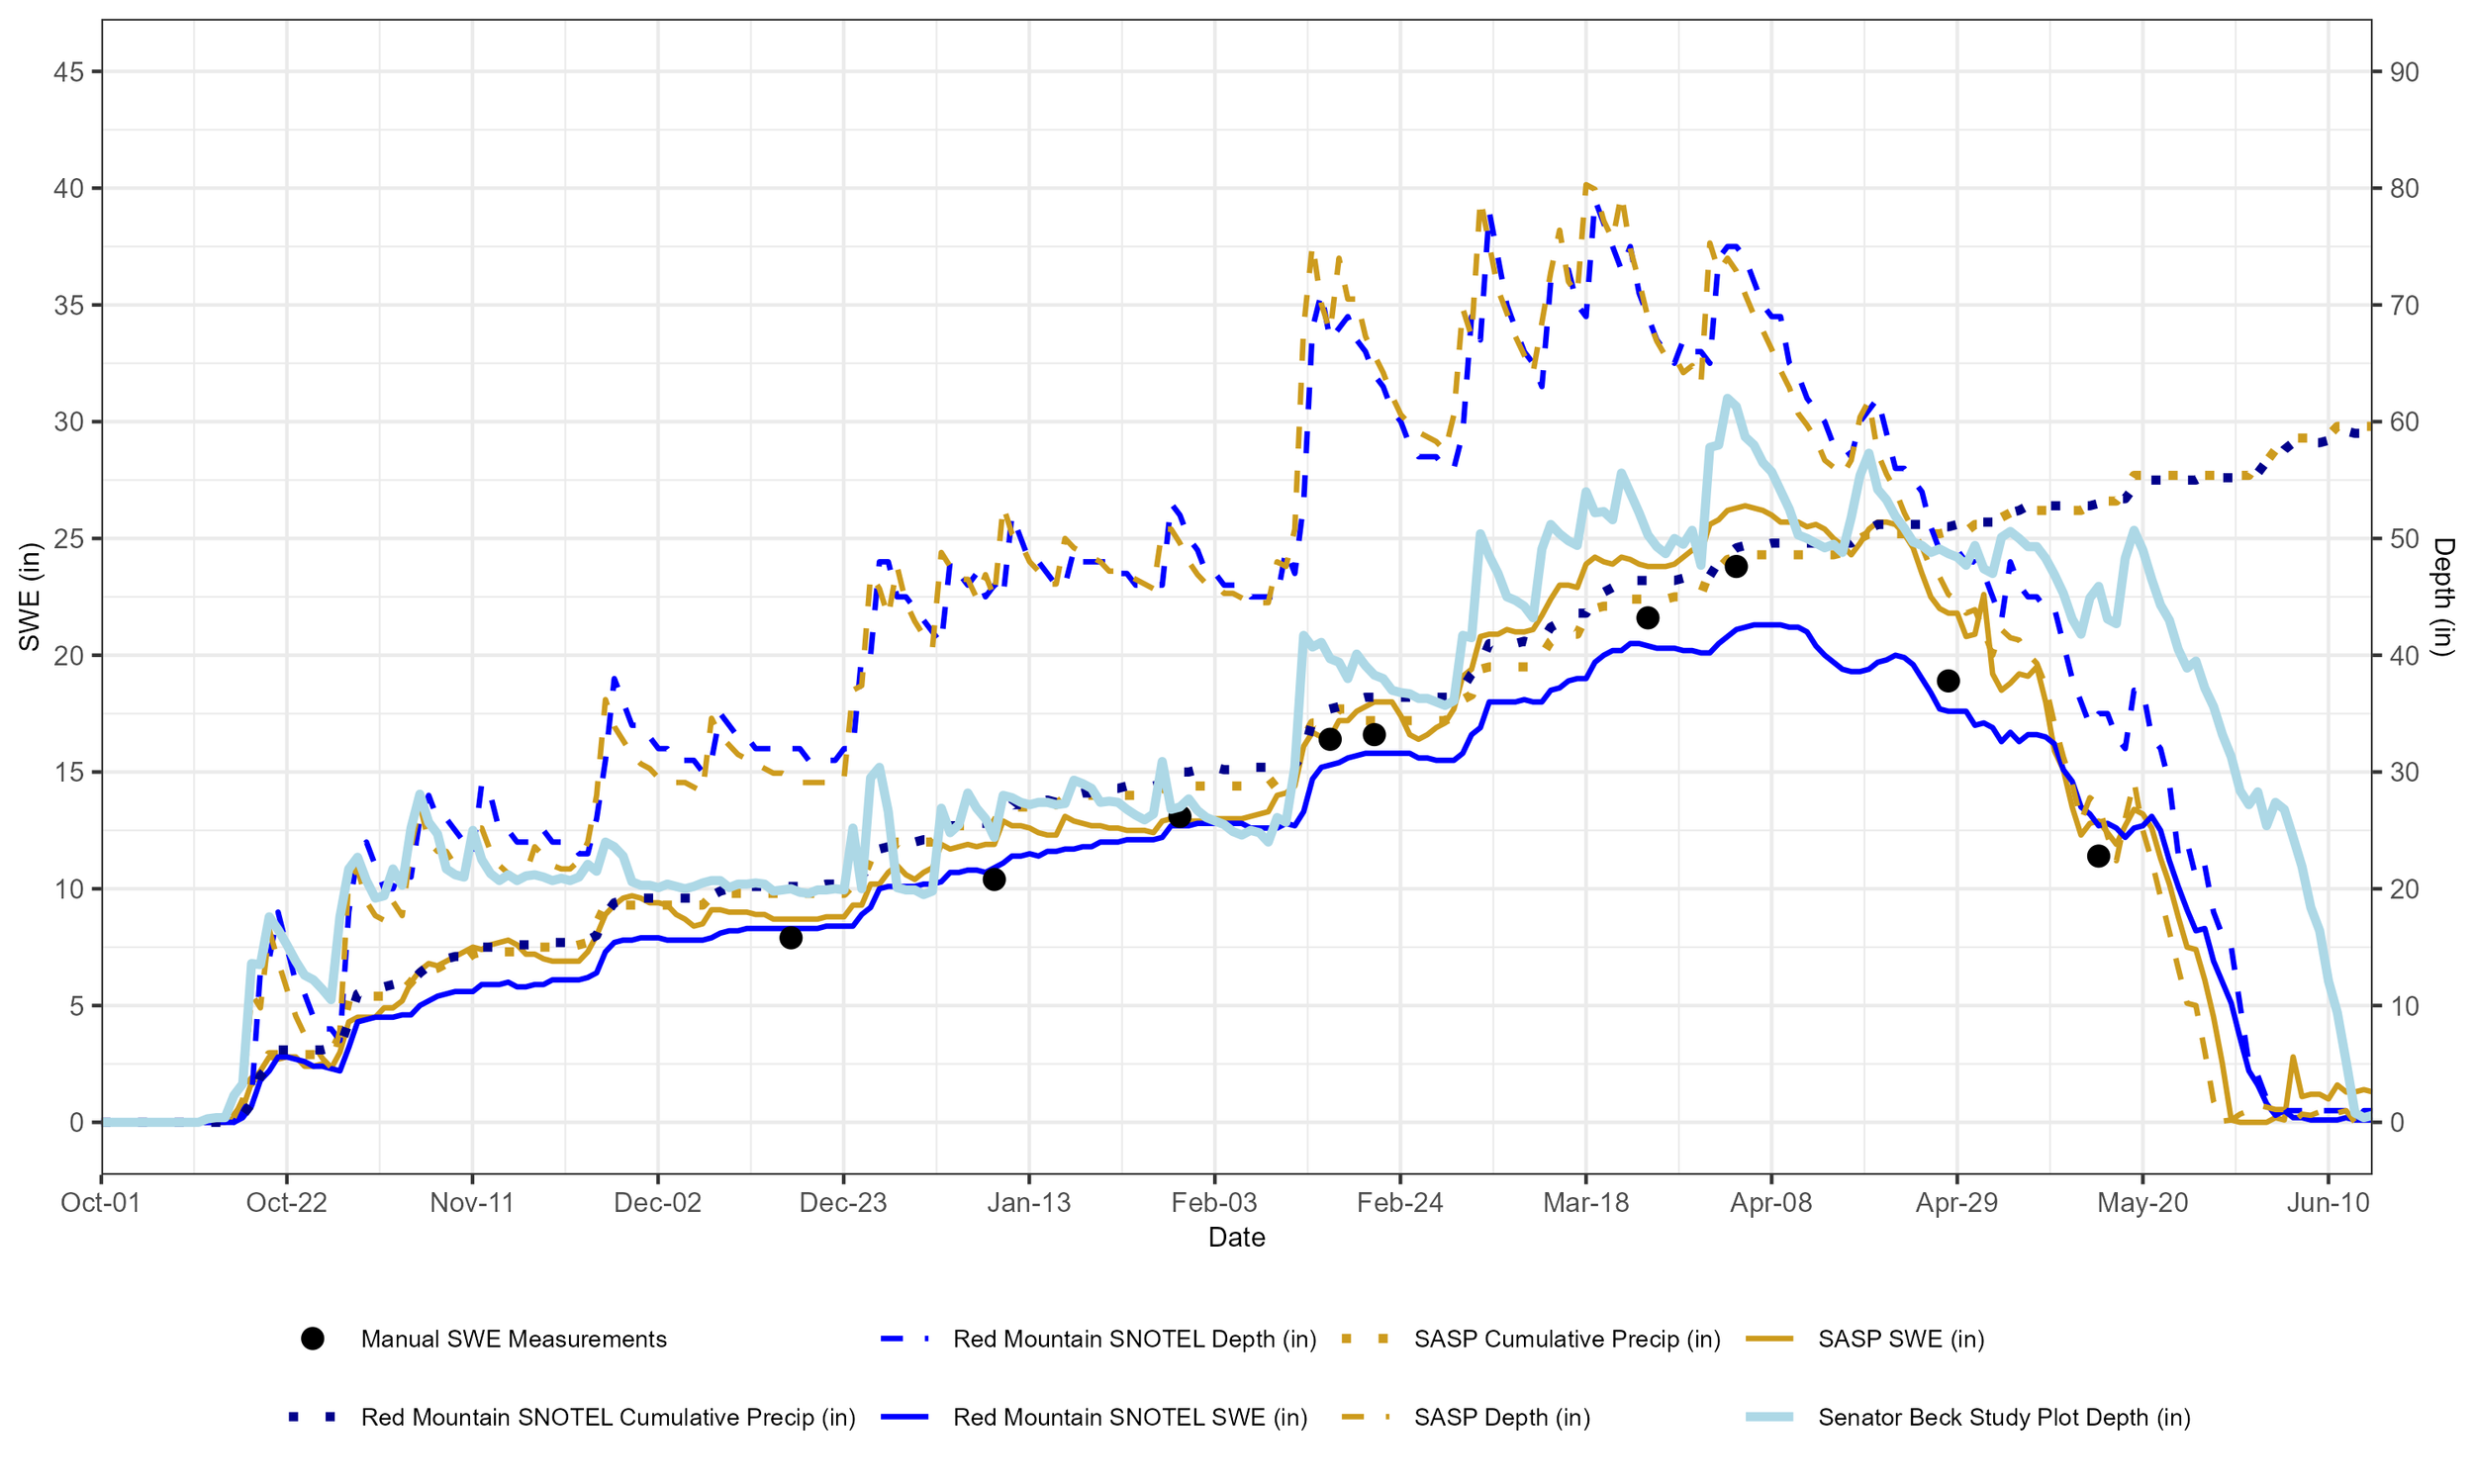
Above: We installed a snow scale last summer as well as a new snow depth sensor at Swamp Angel. The above graph compares snow depth, SWE, and precipitation at Swamp Angel and Red Mt Pass SNOTEL station, which are 1 mile from each other the way the crow flies. Swamp Angel is in a modest clearing and Red Mt SNOTEL is in a treed area. Snow depth at Senator Beck station is also shown. Data compares really well except for SWE comparisons between the SNOTEL snow pillow and the Swamp Angel snow scale near the peak of accumulation season.

Our stream gauge at the pour point of our Senator Beck Study Basin experienced essentially two equal peaks of 9.4 cfs. The first peak was May 30, reflecting the ~11,000’ elevation zone and below melt out, and June 13 reflecting the bulk of melt out at the higher elevations, 12,000’ and above.
Above: Correlation of snow-all-gone at SASP and peak Q at the adjacent stream gauge. All the severe dust years in red show SAG and peak discharge before June 1. Low dust years are shown in blue and average in green. The two years in green at lower left make sense as this was 2012 and 2018, two notorious low snow years (and dust severity was “upper-end-of average” for 2018). This year, snow-all-gone and the first streamflow peak was within a day of each other. Check out the recently published research article on this subject matter here: Twin-Peaks Streamflow Timing - Can We Use Forest and Alpine Snow Melt-Out Response to Estimate?
Below: There is a little less correlation of the second streamflow peak Q with SAG at Senator Beck Study Plot (12,200’) but still very informative when assessing possible peak flow scenarios. This year, snow-all-gone and the second streamflow peak was within a day of each other.


Above: Peaks occurred approximately May 30, June 13. At the Swamp Angel gauge it was nearly identical at 9.4 cfs.
Looking Ahead
The experts were predicting a dry summer, which we rolled into after a dry, warm spring characterized by rapid melt of a low snowpack in southern Colorado. However, it is nice to see patches of snow lingering in the higher elevations; the wildflowers are loving it. We’ve rainstorms and thunderstorms rolling through, potentially monsoon-driven, though we haven’t seen significant rainfall. As of July 18th, Swamp Angel Study Plot is at 82% of the median cumulative precipitation this year. In early July, thunder and lightning storms in Colorado sparked a few fires.
While Colorado had near-normal April 1 SWE conditions the northern half of the state and conditions in the 60-80% in the southern half, by mid-May most basins were at or below 50% of the 1991-2020 median. By July, drought covered the western half of Colorado, and conditions are expected to persist; a wide swath of D3 (Extreme Drought) sits amidst the lesser drought categories (D0-D2). The Climate Prediction Center’s (CPC) Seasonal Temperature Outlook for Aug-Sep-Oct portends a 40-60% probability of above normal temperatures, while the Precipitation Outlook suggests 33-50% chance of below average precipitation for the same time period.
As a reminder, we had close to neutral conditions for this past winter; we never officially hit sea surfaces temperatures of 0.5 °C below average in the Pacific Ocean three months in a row, which would have officially been considered La Niña. In the spring, we shifted from the La Niña-ish winter into neutral conditions, which are expected to continue through late summer. Chances of a La Niña transition increase in fall/winter, but are comparable to the chances of remaining ENSO-neutral. The longer-term outlooks from the CPC are leaning warm and average-to-dry this winter; though of course, we’re a long way out.